

University of Sheffield
Department of Germanic Studies
&
Department of Human Communication Sciences
Cross-language acoustic
and perceptual
similarity of vowels
The role of listeners’ native accents
Daniel Philip Williams
Submitted in accordance with the requirements
of PhD
March 2013
ii
Abstract
Vowel inventories vary across languages in terms of the phonological vowel
categories within them and the phonetic properties of individual vowels. The
same also holds across different accents of a language. The four studies in this
project address the role of listeners’ native accents in the cross-language
acoustic and perceptual similarity of vowels. Study I explores the acoustic
similarity of Northern Standard Dutch (NSD) vowels to the vowels in two
accents of British English, namely Standard Southern British English (SSBE)
and Sheffield English (SE), and demonstrates that some NSD vowels are
acoustically most similar to different SSBE and SE vowels and that other NSD
vowels differ in the degree of acoustic similarity to SSBE and SE vowels. Study
II examines how SSBE and SE listeners use spectral properties to identify
English monophthongs and finds that SSBE and SE listeners differ on some
monophthongs, broadly in line with the spectral differences between naturally
produced SSBE and SE vowels. Study III investigates SSBE and SE listeners’
discrimination accuracy of five NSD vowel contrasts, which cause British
English learners of Dutch perceptual problems, and shows that SE listeners are
generally less accurate than SSBE listeners. Study IV tests SSBE and SE
listeners’ perceptual similarity of NSD vowels to English vowels and reveals
that SSBE and SE listeners differ on some NSD vowels. The present findings
demonstrate the influence of listeners’ differential linguistic experience on
speech perception and underscore the importance of accounting for listeners’
particular native accents in cross-language studies.

iii
Acknowledgments
Firstly, I would like to thank the Arts and Humanities Research Council for
providing a doctoral studentship award (AH/H032649/1) to support my
research financially.
Secondly, many individuals have helped me along the way to complete
this project. I would like to thank Dr. Paola Escudero from MARCS Auditory
Laboratories for hosting me at the University of Amsterdam in 2010. During
my stay, she offered many inspiring ideas and put me in contact with many
helpful individuals. I am very thankful to two PhD candidates from the
Amsterdam Center for Language and Communication. Jan-Willem van
Leussen helped obtaining the Northern Standard Dutch data and Kateřina
Chládková helped with the synthetic vowel stimuli. Both Jan-Willem and
Kateřina have been very generous with their support on various Praat scripts. I
am also thankful to Polina Vasiliev from the University of California, Los
Angeles, who helped in designing the English speech production task. I would
like to thank Dr. Bronwen Evans and Melanie Pinet in the Division of
Psychology and Language Sciences at University College London for hosting
me and helping to recruit participants.
Thirdly, I am very grateful for the technical support I have received for
this research. This has come from the Department of Human Communication
Sciences and the Department of Computer Sciences at the University of
Sheffield, the Department of Speech, Hearing and Phonetic Sciences at
University College London and the Amsterdam Center for Language and
Communication.
Fourthly, I am of course very thankful to the participants for sparing
time to complete my various experiments.

iv
Finally, I am most indebted to my supervisors, Dr. Roel Vismans and
Professor Sara Howard, for their many insightful comments, regular
encouragement and constant enthusiasm. Their immense support always
ensured that from the very start of this project I had a positive approach, was
well motivated and remained focused. Any shortcomings are of course my
own.

v
Table of contents
ABSTRACT .............................................................................................................................................. ii
ACKNOWLEDGMENTS ....................................................................................................................... iii
LIST OF TABLES.................................................................................................................................... ix
LIST OF FIGURES ................................................................................................................................. xi
1. GENERAL INTRODUCTION ............................................................................................................ 1
1.1. Research area and contribution ...................................................................................... 1
1.2. Research approach and project structure .................................................................. 2
2. REVIEW OF PREVIOUS RESEARCH ............................................................................................... 4
2.1. Introduction to Chapter 2 .................................................................................................. 4
2.2. The vowel inventories of Northern Standard Dutch (NSD), Standard
Southern British English (SSBE) and Sheffield English (SE) ............................ 5
2.2.1. Vowel inventories ..................................................................................................................... 5
2.2.2. The vowel inventory of Northern Standard Dutch (NSD) ............................... 6
2.2.3. The vowel inventory of Standard Southern British English (SSBE) ........... 9
2.2.4. The vowel inventory of Sheffield English (SE) ................................................... 11
2.3. Vowel production and vowel acoustics .................................................................... 13
2.3.1. Introduction ............................................................................................................................. 13
2.3.2. Source-filter model of speech production .............................................................. 13
2.3.3. Acoustic properties of vowels ........................................................................................ 15
2.3.4. Phonetic variation effects on the acoustic properties of vowels ................ 20
2.4. Vowel perception and linguistic experience .......................................................... 24
2.4.1. Introducing speech perception ..................................................................................... 24
2.4.2. Cross-language speech perception and the Perceptual Assimilation
Model............................................................................................................................................ 27
2.5. Acoustic similarity and perceptual similarity of speech sounds and the
role of native accent .......................................................................................................... 34
2.5.1. Measuring acoustic similarity of vowels ................................................................. 34
2.5.2. Measuring perceptual similarity .................................................................................. 38
2.5.3. Accent variation in cross-language speech perception ................................... 41
2.5.4. Accent variation in second-language speech perception .............................. 43
2.5.5. Accent variation in cross-dialect and cross-language speech perception
..................................................................................................................................................... 44
2.6. Summary ................................................................................................................................ 50
3. THE FOUR STUDIES: RESEARCH FRAMEWORK AND METHODOLOGY .......................... 53
3.1. Introduction to Chapter 3 ............................................................................................... 53
3.2. Research questions ............................................................................................................. 53
3.3. Experimental variables .................................................................................................... 57
vi
3.4. Participants ............................................................................................................................ 59
3.5. Study I: Acoustic similarity of NSD vowels to SSBE and SE vowels .......... 62
3.5.1. Introduction to Study I ....................................................................................................... 62
3.5.2. Method: participants ............................................................................................................ 64
3.5.3. Method: stimuli ....................................................................................................................... 64
3.5.4. Method: procedures .............................................................................................................. 66
3.5.5. Method: acoustic analysis ................................................................................................. 67
3.6. Study II: Perception of native vowel quality ......................................................... 69
3.6.1. Introduction to Study II ..................................................................................................... 69
3.6.2. Method: participants ............................................................................................................ 70
3.6.3. Method: stimuli ....................................................................................................................... 70
3.6.4. Method: procedure ................................................................................................................ 70
3.7. Study III: Non-native vowel discrimination .......................................................... 73
3.7.1. Introduction to Study III ................................................................................................... 73
3.7.2. Methods: participants .......................................................................................................... 73
3.7.3. Methods: stimuli ..................................................................................................................... 73
3.7.4. Methods: procedure .............................................................................................................. 74
3.8. Study IV: Cross-language vowel perception .......................................................... 75
3.8.1. Introduction to Study IV.................................................................................................... 75
3.8.2. Methods: participants .......................................................................................................... 75
3.8.3. Methods: stimuli ..................................................................................................................... 76
3.8.4. Methods: procedure .............................................................................................................. 76
3.9. Summary ................................................................................................................................ 78
4. STUDY I: ACOUSTIC SIMILARITY OF NSD VOWELS TO SSBE AND SE VOWELS ...... 80
4.1. Introduction to Chapter 4 .............................................................................................. 80
4.2. An acoustic description of NSD vowels ................................................................... 81
4.2.1. NSD vowel data ....................................................................................................................... 81
4.2.2. The nine NSD monophthongs ....................................................................................... 81
4.2.3. The six NSD diphthongs .................................................................................................... 84
4.3. An acoustic description of SSBE vowels .................................................................. 87
4.3.1. The SSBE vowel data ............................................................................................................ 87
4.3.2. The 11 SSBE monophthongs ........................................................................................... 87
4.3.3. The five SSBE diphthongs ................................................................................................ 89
4.4. An acoustic description of SE vowels ......................................................................... 92
4.4.1. The SE vowel data ................................................................................................................... 92
4.4.2. The 10 SE monophthongs .................................................................................................. 92
4.4.3. The five SE diphthongs ....................................................................................................... 94
4.5. An acoustic comparison of SSBE and SE vowels ................................................. 96
4.5.1. Introduction .............................................................................................................................. 96
4.5.2. Acoustic evidence for the strut-foot split in SSBE but not in SE ................ 97
4.5.3. A comparison of the acoustic properties of 10 SSBE and SE
monophthongs ........................................................................................................................ 98
4.5.4. A comparison of the acoustic properties of five SSBE and SE
diphthongs .............................................................................................................................. 102
4.5.5. Summary of acoustic similarities and differences between SSBE and SE
vowels ........................................................................................................................................ 104
vii
4.6. The acoustic similarity of NSD vowels to SSBE and SE vowels .............. 105
4.6.1. Linear discriminant analyses (LDAs).....................................................................105
4.6.2. Classification of NSD vowels in terms of the 16 SSBE and the 15 SE
vowel categories ................................................................................................................... 109
4.6.3. Discussion of the classifications ................................................................................. 110
4.7. Summary .............................................................................................................................. 116
5. STUDY II: THE USE OF SPECTRAL PROPERTIES IN THE IDENTIFICATION OF
ENGLISH MONOPHTHONGS BY SSBE AND SE LISTENERS ................................................. 118
5.1. Introduction to Chapter 5 ............................................................................................. 118
5.2. Results .................................................................................................................................... 118
5.4. Discussion ............................................................................................................................. 122
5.5. Summary .............................................................................................................................. 128
6. STUDY III: DISCRIMINATION OF FIVE NSD VOWEL CONTRASTS BY SSBE AND SE
LISTENERS .......................................................................................................................................... 130
6.1. Introduction to Chapter 6 ............................................................................................. 130
6.2. Results .................................................................................................................................... 131
6.3. Discussion ............................................................................................................................. 133
6.4. Summary .............................................................................................................................. 134
7. STUDY IV: CROSS-LANGUAGE PERCEPTUAL SIMILARITY OF NSD VOWELS TO
ENGLISH VOWELS BY SSBE AND SE LISTENERS .................................................................... 135
7.1. Introduction to Chapter 7 ............................................................................................. 135
7.2. Results .................................................................................................................................... 135
7.2.1. Perceptual assimilation of NSD /ɑ/ ........................................................................... 140
7.2.2. Perceptual assimilation of NSD /a/ ........................................................................... 141
7.2.3. Perceptual assimilation of NSD /ʌu/ ........................................................................ 142
7.2.4. Perceptual assimilation of NSD /e/ ........................................................................... 143
7.2.5. Perceptual assimilation of NSD /ɪ/ ............................................................................ 144
7.2.6. Perceptual assimilation of NSD /ɔ/ ........................................................................... 144
7.2.7. Perceptual assimilation of NSD /o/ ........................................................................... 145
7.2.8. Perceptual assimilation of NSD /ʏ/ ........................................................................... 145
7.2.9. Perceptual assimilation of NSD /œy/ ....................................................................... 146
7.2.10. Perceptual assimilation of NSD /y/ ......................................................................... 147
7.2.11. Perceptual assimilation of NSD /u/ ........................................................................ 147
7.3. Discussion: PAM’s predictions on discrimination ............................................. 148
7.3.1. PAM’s predictions on discrimination of NSD /ɑ-ɔ/ .......................................... 150
7.3.2. PAM’s predictions on discrimination of NSD /ʌu-œy/ ................................... 152
7.3.3. PAM’s predictions on discrimination of NSD /ø-o/ .......................................... 154
7.3.4. PAM’s predictions on discrimination of NSD /i-ɪ/ ............................................ 155
7.3.5. PAM’s predictions on discrimination of NSD /u-y/ .......................................... 156
7.4. Summary .............................................................................................................................. 157
8. DISCUSSION AND IMPLICATIONS .......................................................................................... 159
8.1. Introduction to Chapter 8 ............................................................................................. 159
8.2. The research questions and the four studies ....................................................... 159
8.3. Review of native vowel production and native vowel perception (Study I
and Study II) ........................................................................................................................ 161
viii
8.4. Relationship of native vowel production and cross-language vowel
perception (Study I and Study IV) ............................................................................ 166
8.4.1. Acoustic and perceptual similarity of NSD /ɑ/ .................................................. 167
8.4.2. Acoustic and perceptual similarity of NSD /a/ .................................................. 167
8.4.3. Acoustic and perceptual similarity of NSD /ʌu/ ............................................... 167
8.4.4. Acoustic and perceptual similarity of NSD /ɛ/ .................................................. 168
8.4.5. Acoustic and perceptual similarity of NSD /e/ .................................................. 168
8.4.6. Acoustic and perceptual similarity of NSD /ø/ .................................................. 168
8.4.7. Acoustic and perceptual similarity of NSD /ɪ/ ................................................... 168
8.4.8. Acoustic and perceptual similarity of NSD /i/ ................................................... 169
8.4.9. Acoustic and perceptual similarity of NSD /ɛi/ ................................................. 169
8.4.10. Acoustic and perceptual similarity of NSD /ɔ/ ................................................ 169
8.4.11. Acoustic and perceptual similarity of NSD /u/ ............................................... 170
8.4.12. Acoustic and perceptual similarity of NSD /o/................................................ 170
8.4.13. Acoustic and perceptual similarity of NSD /ʏ/ ................................................ 171
8.4.14. Acoustic and perceptual similarity of NSD /œy/ ........................................... 171
8.4.15. Acoustic and perceptual similarity of NSD /y/ ................................................ 172
8.4.16. Evaluation of the relationship between acoustic and perceptual
similarity of NSD vowels to native vowel categories: some
considerations ....................................................................................................................... 172
8.5. Relationship of perceptual assimilation and non-native discrimination
(Study IV and Study III) ............................................................................................................ 182
8.5.1. Perceptual assimilation and discrimination of NSD /ɑ-ɔ/ ........................... 183
8.5.2. Perceptual assimilation and discrimination of NSD /i-ɪ/ ............................. 183
8.5.3. Perceptual assimilation and discrimination of NSD /ʌu-œy/ .................... 184
8.5.4. Perceptual assimilation and discrimination of NSD /ø-o/ ........................... 184
8.5.5. Perceptual assimilation and discrimination of NSD /u-y/ ........................... 186
8.6. Implications of the findings ........................................................................................ 186
8.6.1. Implications for comparing vowels across languages and accents....... 186
8.6.2. Implications for cross-language speech perception and PAM ................. 187
8.6.3. Implications for L2 speech learning and L2 acquisition ............................. 193
8.7. Summary .............................................................................................................................. 194
9. CONCLUSION ............................................................................................................................... 197
9.1. Overall conclusion ........................................................................................................... 197
9.2. Evaluation and future research ................................................................................. 198
9.3. Final remarks ..................................................................................................................... 201
APPENDICES ...................................................................................................................................... 203
Appendix A: NSD individuals’ background data ........................................................... 203
Appendix B: SSBE individuals’ background data .......................................................... 205
Appendix C: SE individuals’ background data ............................................................... 206
REFERENCES ...................................................................................................................................... 208

ix
List of tables
Table 2.1. The NSD vowel inventory: phonetic classification and descriptions of
the 15 NSD vowels (adapted from Collins and Mees, 2004) ............................... 8
Table 2.2. The SSBE vowel inventory: phonetic classification and descriptions
of the 16 SSBE vowels (adapted from McMahon, 2002) .................................... 10
Table 2.3. The SE vowel inventory: phonetic classification and descriptions of
the 15 SE vowels (adapted from Stoddart et al., 1999) ........................................ 11
Table 2.4. Assimilation patterns of non-native contrasts and predictions of
discrimination accuracy in the framework of PAM (adapted from Best,
1995) ................................................................................................................................................. 31
Table 4.1. Geometric means for duration, f0, F1, F2 and F3 of the nine NSD
monophthongs ........................................................................................................................... 82
Table 4.2. Geometric means for duration, f0, F1, F2 and F3 values at two time
points and absolute F1, F2, F3 change of the six NSD diphthongs ............. 85
Table 4.3. Geometric means for duration, f0, F1, F2 and F3 of the 11 SSBE
monophthongs ........................................................................................................................... 88
Table 4.4. Geometric means for duration, F1, F2 and F3 values at two time
points and absolute F1, F2 and F3 change of the five SSBE diphthongs.. 90
Table 4.5. Geometric means for duration, f0, F1, F2 and F3 of the 10 SE
monophthongs ........................................................................................................................... 93
Table 4.6. Geometric means for duration, F1, F2 and F3 at two time points and
absolute F1, F2 and F3 change of the five SE diphthongs ................................ 95
Table 4.7. Geometric means for duration, f0, F1, F2 and F3 of SE and SSBE
monosyllables rhyming with STRUT and FOOT ........................................................ 98
Table 4.8. Significant differences from six multivariate ANOVAs between five
SSBE and SE diphthongs .................................................................................................... 103
Table 4.9. Summary of the four LDAs .................................................................................... 106
Table 4.10. 10 acoustic independent variables used in the LDAs ............................ 108
Table 4.11. SSBE classification percentages for the 15 NSD vowels ...................... 110
Table 4.12. SE classification percentages for the 15 NSD vowels ............................ 110
Table 4.13. Modal classifications of NSD vowels in terms of SSBE and SE vowel
categories ..................................................................................................................................... 111
Table 5.1. Mean F1, F2 and F3 values (Hz) of SSBE and SE listeners’
identification of English monophthongs .................................................................. 119
Table 6.1. Median discrimination accuracy (percent correct) scores for the five
NSD vowel contrasts by listener group...................................................................... 131
Table 7.1. Percentage of NSD vowel tokens classified in terms of 16 English
vowel categories by SSBE and SE listeners .............................................................. 137

x
Table 7.2. Summary of assimilation patterns and PAM predictions for five NSD
vowel contrasts ......................................................................................................................... 158
Table 8.1. The four studies and corresponding research questions ....................... 160

xi
List of figures
Figure 3.1. Screenshots from the experimental task in Study II ................................ 72
Figure 3.2. Screenshots from the experimental task in Study III .............................. 75
Figure 3.3. Screenshots from the experimental task in Study IV .............................. 77
Figure 4.1. Mean F1 and F2 values of the nine NSD monophthongs ..................... 83
Figure 4.2. Mean F1 and F2 trajectories for the six NSD diphthongs .................... 86
Figure 4.3. Mean F1 and F2 values of the 11 SSBE monophthongs ......................... 89
Figure 4.4. Average F1 and F2 trajectories for the five SSBE diphthongs ............ 91
Figure 4.5. Mean F1 and F2 values of the 10 SE monophthongs ............................... 94
Figure 4.6. Average F1 and F2 trajectories for the five SE diphthongs ................. 96
Figure 4.7. Mean F1 and F2 values of the 10 shared SSBE and SE
monophthongs ......................................................................................................................... 101
Figure 4.8. Average F1 and F2 trajectories for the five SSBE and SE diphthongs
........................................................................................................................................................... 104
Figure 4.9. Comparison of F1 and F2 averages of NSD vowels with SSBE and SE
monophthongs for male speakers ................................................................................ 112
Figure 4.10. Comparison of F1 and F2 averages of NSD vowels with SSBE and
SE monophthongs for female speakers ..................................................................... 113
Figure 4.11. Comparison of average F1 and F2 trajectories for NSD, SSBE and
SE diphthongs for male speakers .................................................................................. 114
Figure 4.12. Comparison of average F1 and F2 trajectories for NSD, SSBE and
SE diphthongs for female speakers .............................................................................. 115
Figure 5.1. Mean F1 and F2 values (Mel) of SSBE and SE listeners’ perceptual
identification of English monophthongs .................................................................. 120
Figure 5.2. SSBE and SE percentage labellings of the stimuli as FOOT per F3 of
stimulus ........................................................................................................................................ 126
Figure 5.3. SSBE and SE percentage labellings of the stimuli as GOOSE per F3 of
stimulus ........................................................................................................................................ 127
Figure 5.4. SSBE and SE percentage labellings over 75% of the stimuli as
GOOSE per F3 of stimulus ................................................................................................... 128
Figure 6.1. Boxplots showing discrimination accuracy (percent correct) scores
for SE and SSBE listeners ................................................................................................... 133
Figure 7.1 Perceptual assimilation patterns for the 9 NSD monophthongs to
English vowel categories by SE listeners (left) and SSBE listeners (right)
........................................................................................................................................................... 143
Figure 7.2. Perceptual assimilation patterns for the six NSD diphthongs to
English voweL CATEgories by SE listeners (left) and SSBE listeners (right)
........................................................................................................................................................... 146

1. General introduction
1
1.
General introduction
1.1. Research area and contribution
Cross-language speech perception is a branch of speech perception that
examines the perception of non-native speech typically by ‘functional
monolinguals … [who] are naïve to the target language’ (Best and Tyler, 2007:
16). In many cross-language speech perception studies, the focus is on
perceived phonetic similarity (henceforth perceptual similarity) of non-native
sounds to native sounds (e.g., Best et al., 1996; Nishi et al., 2008; Gilichinskaya
and Strange, 2010; Escudero and Vasiliev, 2011). However, investigating
phonetic similarity in an objective manner is not straightforward and it is
especially challenging when investigating the phonetic similarity of sounds
across different languages. One way in which the phonetic similarity of vowels
has been investigated in previous research is by examining the acoustic
similarity of vowels (for a review, see Strange, 2007). By comparing measures
of several acoustic properties of vowels, it is possible to objectively quantify
how similar one vowel from one language is to that in another language. In
doing so, it is revealed what acoustic-phonetic features could be involved in
listeners’ judgments on perceptual similarity (e.g., Escudero and Vasiliev, 2011).
Young infants are able to distinguish between virtually all human
speech sounds, but this ability declines as infants become more attuned to the
sounds in their native language, facilitating native perception and hindering
non-native perception (e.g., Best and McRoberts, 2003). As for learning to
recognise the sounds of their native language, infants’ linguistic experience is
initially biased toward the sounds as produced in the particular accent of their
environment (e.g., Best et al., 2009; Butler et al., 2011). Furthermore, early

1. General introduction
2
exposure to other accents can facilitate non-native accent perception
(Kitamura et al., 2006) and the development of phonological awareness can aid
the understanding of words said in a non-native unfamiliar accent (Best et al.,
2009). Notwithstanding, it has been observed that the effects of linguistic
experience relating to native accent can persist into adulthood, exerting a clear
influence in cross-dialect perception – the perception of speech sounds in non-
native accents or dialects. That is, adults’ native accent can have a profound
effect in the perception of sounds as realised in other accents (e.g., Evans and
Iverson, 2004; Clopper and Tamati, 2010; Dufour et al., 2007; Clopper, 2011).
In studies on cross-language speech perception, adults’ linguistic experience,
such as having different native language backgrounds, has a clear effect on the
perceived similarities between non-native and native speech sounds, which can
have an effect on perceptual discrimination accuracy (e.g., Best et al., 2003).
Given the apparent native accent influences found in research on cross-dialect
perception, the differential effects of different linguistic experience in cross-
language speech perception may go beyond simply native languages and
encompass the particular native accents of listeners.
This project aims to contribute to the understanding of the role of
listeners’ native accent in cross-language speech perception, specifically
focusing on the acoustic and perceptual similarity of vowels. At present,
listeners’ native accent in cross-language perception is only just beginning to
be tackled in the research (e.g., Chládková and Podlipský, 2011; Escudero et al.,
2012) and it is therefore not well understood.
1.2. Research approach and project structure
The current project is essentially data-driven. The role of native accent in the
cross-language acoustic and perceptual similarity of vowels is addressed by
means of four research questions that are addressed in four separate studies.
Each of the research questions is approached with a laboratory-based
experiment from which results are obtained and subsequently analysed. The
research questions deal with four aspects of the role of native accent in the
1. General introduction
3
cross-language perception of vowels, namely native vowel production, the
spectral properties used in native vowel perception, cross-language vowel
discrimination and cross-language perceptual similarity of vowels. Throughout
the four studies, Dutch is the non-native language and the particular accent is
Northern Standard Dutch (NSD). In addition, English is the native language
and two accents are employed, Standard Southern British English (SSBE) and
Sheffield English (SE). The four studies assess the acoustic and perceptual
similarity of NSD vowels to SSBE and SE vowels and, along the way, the
similarity or dissimilarity of SSBE and SE vowels to one another are compared.
The current project takes on the following structure. Chapter 2 reviews
the main areas of research relating to the project theme. Chapter 3 introduces
the four research questions behind the four studies that make up the project
and describes the methodology of the laboratory-based experiments relating to
each of the studies. Chapters 4, 5, 6 and 7 present the results and analyses of
the experiments involved in Study I, Study II, Study III and Study IV,
respectively. Chapter 8 discusses the results of the four studies together and
presents a number of implications that arise from the discussion. Finally,
Chapter 9 presents the main conclusions, an evaluation of the four studies and
some directions for future research.

2. Review of previous research
4
2.
Review of previous research
2.1. Introduction to Chapter 2
Vowels are tricky sounds to describe. One phonetician commented in a text
book on English sounds, published some 100 years ago, ‘Now we must pull
ourselves together, for we have come to the vowels, and they are very
troublesome’ (Ripmann, 1911: 32). Traditionally, vowels were described in
terms or their articulatory properties, based mainly on auditory impressions.
The advent of acoustic analyses led phoneticians to describe vowels in terms of
how the resulting sound is transmitted, i.e., the acoustic properties of vowels.
Even so, describing vowels is still rather elusive. This is in part due to the same
set of articulators being required to produce many different vowel sounds and
due to the same acoustic properties being used to describe them.
This chapter provides a review of relevant research, both well-
established and very recent, relating to the present project. Since the project
draws heavily on describing and comparing how vowels are produced and
perceived, it is necessary to examine the main ways in which research into this
has previously been conducted. As the phonological vowel inventories of the
accents of NSD, SSBE and SE are to be used in the project, these are outlined
first in section 2.2 with reference to previous descriptions. In section 2.3, a
general overview is provided of how vowels are articulated and how this relates
to the resulting vowel sound; an understanding of the acoustics of vowels
underpins any understanding of how listeners might perceive them. Section
2.4 introduces non-native perception, specifically the notions of cross-language
speech perception and perceptual similarity. In section 2.5, some of the
methodological issues in comparing vowels are introduced as well as issues
relating to how listeners’ judgments of perceptual similarity can be gauged.
2. Review of previous research
5
Section 2.5 also introduces the core theme of this project, the role of native
accent in cross-language speech perception, and how this has been handled in
the literature and what conclusions can be drawn from the available evidence.
Finally, section 2.6 draws together the review of the literature and points to the
motivation of the present research project.
2.2. The vowel inventories of Northern Standard Dutch
(NSD), Standard Southern British English (SSBE) and
Sheffield English (SE)
2.2.1. Vowel inventories
Speech sounds are conventionally classified into two main groups: consonants
and vowels. Both types of sound are produced with constrictions in the vocal
tract, but for consonants the constrictions are usually more extreme and can
include a brief stoppage of the air flow. Consonants also differ from vowels in
that they may exploit aperiodic and periodic voice sources, whereas vowels
generally only make use of a periodic source. More specifically, this is the
quasi-periodic oscillation of the vocal folds that occurs when air is expelled
from the lungs. A vowel is thus a speech sound which is generally produced
with voicing and a relatively open vocal tract configuration (Laver, 1994;
Ladefoged, 2001).
By investigating speech, phoneticians and phonologists have been able
to describe the individual sounds that make up a particular language. Such
descriptions demonstrate that there is a very wide range of different sounds in
spoken human languages (Ladefoged and Maddieson, 1996). The observed sets
of sounds of languages are referred to as inventories, and following the
conventional classification of speech sounds into two main groups of vowels
and consonants, there are inventories for vowels and for consonants.
A vowel inventory is the set of phonological vowel categories in a given
language variety. It is made up of all phonologically contrasting vowel
segments. The ways in which vowels are contrasted is dependent on the
2. Review of previous research
6
language in question. Common contrasting features are quality, length
(duration), nasality and tone. The size of a vowel inventory refers to the
number of individual vowel categories in it. Amongst the world’s languages,
the most commonly occurring vowel inventory size is five or six vowel
categories (Maddieson, 2011). Vowel inventories smaller than this average are
regarded as small vowel inventories, while vowel inventories greater in size are
considered large vowel inventories. The vowel inventories of NSD, SSBE and
SE are at least twice as large as this average. That is, they have been described
as having at least 10 to 12 separate vowel categories, as will be described in the
next few subsections.
A language is not a single monolithic entity. It has long been observed
that the way in which speech sounds are produced in a given language is not
universal across all speakers of that language. An individual’s habitual manner
of pronunciation in their native language may differ from that of another
speaker who is, say, from another region. This variation gives rise to different
accents and dialects of a language. There are many more factors that lead to
variation in speech and these, along with regional accents, are discussed later
in 2.3.4. The next subsections (2.2.2-2.2.4) outline the vowel inventories of
specific regional accents of Dutch and English, namely NSD, SSBE and SE,
with reference to the available literature on them.
2.2.2. The vowel inventory of Northern Standard Dutch (NSD)
The accent of Dutch under examination is NSD, which is the standard accent
of Dutch in the Netherlands. There has been a long debate as to whether there
are one or more standard varieties of Dutch, one that is spoken in the
Netherlands and another in Flanders, Belgium (e.g., Van de Velde et al., 1997).
Recent studies show that the vowels in NSD are indeed distinct from the
vowels in the different standard variety of Dutch spoken in Flanders, Standard
Southern Dutch, with the most notable differences exhibited in the realisation
of diphthongs (Adank et al., 2004; Adank et al., 2007). Despite differences in
how the vowels are produced in the two standard accents, the vowel

2. Review of previous research
7
inventories in the two standard accents are largely identical (Collins and Mees,
2004).
NSD has a large vowel inventory since it has been described as having
the 15 vowels /i, y, ɪ, ʏ, ø, e, ɛ, a, ɑ, ɔ, o, u, ʌu, ɛi, œy/ and a schwa vowel /ə/
(Booij, 1995). In addition to these vowels, there are some marginal vowels and
vowel sequences which are not normally considered as separate phonological
vowel categories in the NSD vowel inventory. The NSD marginal vowels /ɛː,
œː, ɔː, iː, yː, ɛ , ɑ , ɔ / are so called because they occur only in certain loan
words and as a result have marginal phonological status (Collins and Mees,
2004; Gussenhoven, 1999). Furthermore, the latter three vowels are frequently
not nasalised and realised in the same manner as the three NSD vowels /ɛ, ɑ, ɔ/.
NSD also has the six vowel sequences /aːi, oːi, ui, iu, yu, eːu/, which are not
usually regarded as separate vowels because ‘both elements appear to have
equal prominence’ unlike diphthongs for which the first element is most
prominent (Collins and Mees, 2004, pp. 137). Hence each element in these six
vowel sequences is regarded as a separate vowel category, i.e., as one of the
NSD monophthongs described below.
Of the 15 NSD vowels /i, y, ɪ, ʏ, ø, e, ɛ, a, ɑ, ɔ, o, u, ʌu, ɛi, œy/ the first
12 are traditionally classed as monophthongs (or steady-state vowels) and the
latter three as diphthongs. In their classification of these 15 vowels, Collins and
Mees (2004) class /e, o, ø/ as ‘potential diphthongs’ because they are realised as
closing diphthongs in NSD but have traditionally been transcribed as
monophthongs. Collins and Mees (2004) group the three diphthongs /ʌu, ɛi,
œy/ together as ‘essential diphthongs’ and Collier et al. (1982) as ‘genuine
diphthongs’ since these are traditionally regarded as such. Adank et al. (2004)
in their recent acoustic analysis of NSD vowels treat the vowels /e, o, ø/ in the
same way as the diphthongs /ʌu, ɛi, œy/ since these six vowels can be
characterised by formant movement, whereas the monophthongs /i, y, ɪ, ʏ, ɛ, a,
ɑ, ɔ, u/ can be described in terms of their steady-state characteristics. Note,

2. Review of previous research
8
though, that two older studies which provide acoustic analyses of NSD vowels,
Pols et al. (1973) and Van Nierop et al. (1973), treat /e, o, ø/ as monophthongs
and do not provide any information about formant movement. Van Leussen et
al. (2011) examine the acoustic properties of the nine NSD vowels /i, y, ɪ, ʏ, ɛ, a,
ɑ, ɔ, u/ and refer to them as the ‘steady-state vowels’ and exclude the NSD
vowels /e, o, ø, ʌu, ɛi, œy/ which are all considered ‘dynamic vowels’.
Table 2.1. The NSD vowel inventory: phonetic classification and descriptions of the 15 NSD vowels (adapted
from Collins and Mees, 2004) Vowel
type
NSD
vowel Description
Mo
nop
hth
on
g
i front, close, unrounded
y front-central, between close and close-mid, rounded
ɪ front-central, above close-mid, unrounded
ʏ front-central, close-mid, rounded
ɛ front, open-mid, unrounded
a front-central, open, unrounded
ɑ back, open, unrounded
ɔ back, above open-mid, rounded
u back-central, close, rounded
Dip
hth
on
g
e begins front, close-mid; ends front, above close-mid;
unrounded
ø begins front-central, below close-mid; ends front-central, above
close-mid; rounded
o begins back-central, between close-mid and open-mid; ends
back-central, close-mid; rounded
ʌu begins back-central, below open-mid; ends back-central, close-
mid; unrounded becoming rounded
ɛi begins front, open-mid; ends front, close-mid; unrounded.
œy begins front-central, open-mid; ends front-central, close-mid;
rounded
In sum, NSD vowels can be divided into the nine monophthongs /i, y, ɪ,
ʏ, ɛ, a, ɑ, ɔ, u/ and the six diphthongs /e, o, ø, ʌu, ɛi, œy/. Even though the
NSD diphthongs can be further subdivided into the potential diphthongs /e, o,
ø/ and essential diphthongs /ʌu, ɛi, œy/ (Collins and Mees, 2004), this
subdivision does not serve any theoretical or methodological function in
recent acoustic descriptions of NSD vowels because all six NSD diphthongs
have been treated in the same manner (Adank et al., 2004; Adank et al., 2007;
Van Leussen et al., 2011). As this subdivision does not appear relevant for
acoustic descriptions of contemporary NSD, the six NSD vowels /e, o, ø, ʌu, ɛi,
2. Review of previous research
9
œy/ will all be simply referred to as diphthongs in the present project. Under
this classification, the NSD vowel inventory is summarised in Table 2.1.
Of the nine NSD monophthongs listed in Table 2.1, only /a/ usually has
a long duration, being considered a ‘long vowel’ and therefore often
transcribed as /aː/ (Collins and Mees, 2004). Additionally, the six NSD
diphthongs displayed in Table 2.1 usually exhibit long vowel durations
(Collins and Mees, 2004).
2.2.3. The vowel inventory of Standard Southern British English (SSBE)
SSBE is the standard accent of British English spoken primarily in the South of
England, especially in the Home Counties. SSBE has been described as having
at least 20 vowels (Deterding, 2004), meaning its vowel inventory is large, like
that of NSD. The vowel inventory of SSBE has the 11 monophthongs /iː, ɪ, ɛ, ɜː,
a, ɑː, ɒ, ʌ, ɔː, ʊ, uː/, a schwa vowel /ə/, five closing diphthongs /eɪ, aɪ, ɔɪ, əʊ,
aʊ/ and three or four centring diphthongs /ɪə, ɔə, ɛə, ʊə/ (Laver, 1994; Roach,
2000; Ogden, 2009; Roach, 2004). The centring diphthongs generally occur
where there is a post-vocalic <r> in the spelling but no observable /r/ sound
since SSBE is a non-rhotic accent (McMahon, 2002). In modern SSBE,
especially as spoken by young speakers, the centring diphthongs /ɪə, ɔə, ɛə/
are not realised as diphthongs but long variants of the monophthongs /ɪ, ɔ, ɛ/,
respectively, and the centring diphthong /ʊə/ is also realised as a long variant
of the monophthong /ɔ/ rather than /ʊ/ (McMahon, 2002; Wells, 2000;
Ladefoged, 2001). Some descriptions of SSBE also mention /juː/ since both
components can be analysed as being inseparable in the rime of a syllable
rather than individual phonological categories (e.g., McMahon, 2000).
Nevertheless, the status of /juː/ as a separate vowel category is considered
uncertain (Ladefoged, 2000; Deterding, 2004). Due to their apparent marginal
or uncertain status as separate vowel categories in more modern SSBE, the
centring diphthongs /ɪə, ɔə, ɛə, ʊə/ and /juː/ will not be included in the

2. Review of previous research
10
present project. This therefore leaves 16 vowels in SSBE, namely /iː, ɪ, ɛ, ɜː, a,
ɑː, ɒ, ʌ, ɔː, ʊ, uː, eɪ, aɪ, ɔɪ, əʊ, aʊ/.
The vowels of British English accents are conventionally represented
by a word label rather than a phonetic symbol to ease comparative descriptions
between accents. Originally, these labels, called ‘lexical sets’, were devised to
describe the lexical distribution of phonological categories between different
accents of English, as proposed by Wells (1982). Since there are two accents of
English involved in this project, these labels will be adopted for convenience in
order to refer to the different vowels that make up each accent’s vowel
inventory, rather than to specifically draw attention to the lexical distributions
of categories. By means of Wells’ (1982) lexical sets, the 16 SSBE vowels /iː, ɪ, ɛ,
ɜː, a, ɑː, ɒ, ʌ, ɔː, ʊ, uː, eɪ, aɪ, ɔɪ, əʊ, aʊ/ are labelled FLEECE, KIT, DRESS, NURSE,
TRAP, PALM, LOT, STRUT, THOUGHT, FOOT, GOOSE, FACE, PRICE, CHOICE, GOAT and
MOUTH, respectively. This classification of the 16 SSBE vowels is summarised
Table 2.2.
Table 2.2. The SSBE vowel inventory: phonetic classification and descriptions of the 16 SSBE vowels (adapted
from McMahon, 2002) Vowel
type SSBE vowel
Phonetic
Symbol Description
Mo
nop
hth
on
g
FLEECE iː front, close, unrounded
KIT ɪ front-central, above close-mid, unrounded
DRESS ɛ front, open-mid, unrounded
NURSE ɜː central, open-mid, unrounded
TRAP a front-central, open, unrounded
PALM ɑː back, open, unrounded
LOT ɒ back, open, rounded
STRUT ʌ back, open-mid, unrounded
THOUGHT ɔː back, above open-mid, rounded
FOOT ʊ back-central, above close-mid, rounded
GOOSE uː back-central, close, rounded
Dip
hth
on
g
FACE eɪ begins front, open-mid; ends front-central, above close-mid;
unrounded
PRICE aɪ begins front-central, open; ends front-central, above close-
mid; unrounded
CHOICE ɔɪ begins back, open-mid; ends front-central, above close-mid;
rounded becoming unrounded
GOAT əʊ begins mid-central; ends back-central, above close-mid;
rounded
MOUTH aʊ begins front-central, open; ends front-central, above close-
mid; unrounded becoming rounded
2. Review of previous research
11
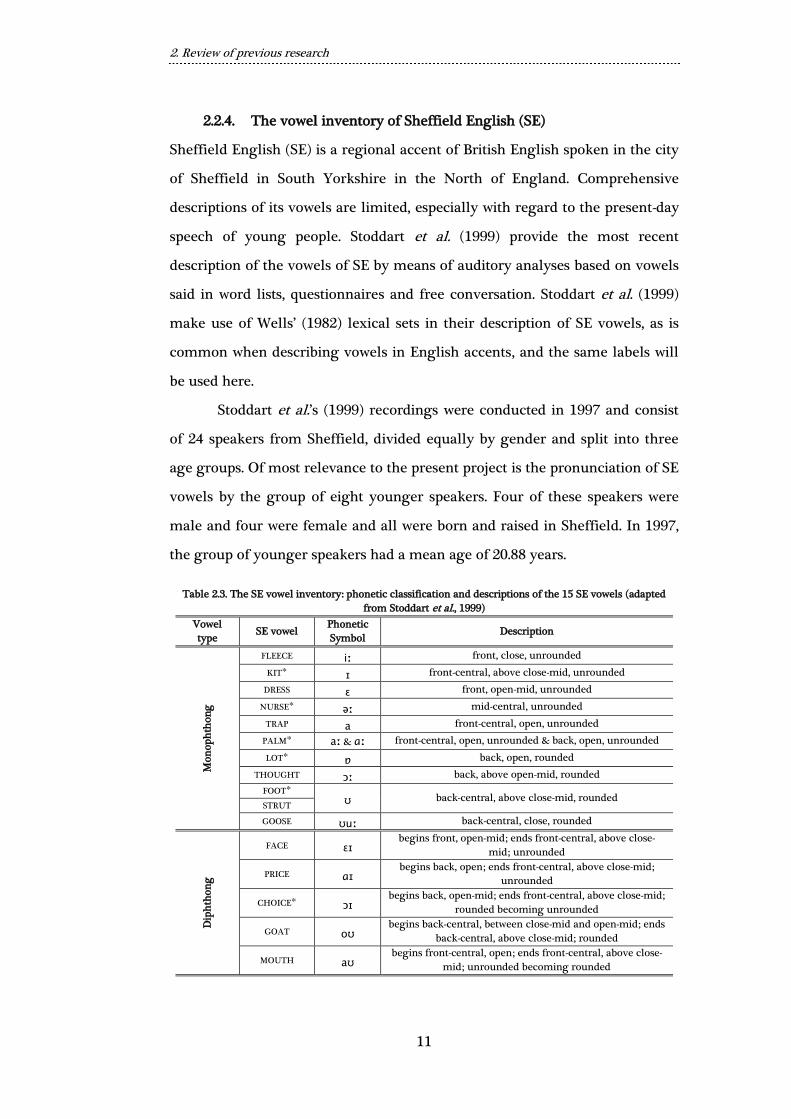
2.2.4. The vowel inventory of Sheffield English (SE)
Sheffield English (SE) is a regional accent of British English spoken in the city
of Sheffield in South Yorkshire in the North of England. Comprehensive
descriptions of its vowels are limited, especially with regard to the present-day
speech of young people. Stoddart et al. (1999) provide the most recent
description of the vowels of SE by means of auditory analyses based on vowels
said in word lists, questionnaires and free conversation. Stoddart et al. (1999)
make use of Wells’ (1982) lexical sets in their description of SE vowels, as is
common when describing vowels in English accents, and the same labels will
be used here.
Stoddart et al.’s (1999) recordings were conducted in 1997 and consist
of 24 speakers from Sheffield, divided equally by gender and split into three
age groups. Of most relevance to the present project is the pronunciation of SE
vowels by the group of eight younger speakers. Four of these speakers were
male and four were female and all were born and raised in Sheffield. In 1997,
the group of younger speakers had a mean age of 20.88 years.
Table 2.3. The SE vowel inventory: phonetic classification and descriptions of the 15 SE vowels (adapted
from Stoddart et al., 1999) Vowel
type SE vowel
Phonetic
Symbol Description
Mo
nop
hth
on
g
FLEECE iː front, close, unrounded
KIT* ɪ front-central, above close-mid, unrounded
DRESS ɛ front, open-mid, unrounded
NURSE* əː mid-central, unrounded
TRAP a front-central, open, unrounded
PALM* aː & ɑː front-central, open, unrounded & back, open, unrounded
LOT* ɒ back, open, rounded
THOUGHT ɔː back, above open-mid, rounded
FOOT* ʊ back-central, above close-mid, rounded
STRUT
GOOSE ʊuː back-central, close, rounded
Dip
hth
on
g
FACE ɛɪ begins front, open-mid; ends front-central, above close-
mid; unrounded
PRICE ɑɪ begins back, open; ends front-central, above close-mid;
unrounded
CHOICE* ɔɪ begins back, open-mid; ends front-central, above close-mid;
rounded becoming unrounded
GOAT oʊ begins back-central, between close-mid and open-mid; ends
back-central, above close-mid; rounded
MOUTH aʊ begins front-central, open; ends front-central, above close-
mid; unrounded becoming rounded

2. Review of previous research
12
* These vowels were not included in Stoddart et al.’s (1999) description of vowels for the group of
younger speakers. The above descriptions are based on their overall description of SE vowel without
reference to any particular age group.
Table 2.3 lists the SE vowel categories and their ‘characteristic’ phonetic
transcriptions, which are mostly based on Stoddart et al.’s (1999) reported
pronunciation of vowels by the eight younger speakers in their study. However,
in their discussion of SE vowels by the different age groups, Stoddart et al.
(1999) omit transcriptions for some vowels. Therefore, the vowels in Table 2.3
marked with an asterisk are taken from Stoddart et al.’s (1999) overall
description of SE vowels.
As can be seen, SE shares 10 of the 11 monophthong vowel categories
found in SSBE and, notably, three are assigned different phonetic
transcriptions, i.e., NURSE, PALM and GOOSE. There may well be further
qualitative differences involving monophthongs in SE and SSBE that are not
evident from the present transcriptions. Three of the five diphthongs in SSBE
are also transcribed differently in SE, i.e., FACE, PRICE and GOAT.
One major difference between SE and SSBE relates to the phonological
make-up of their vowel inventories. Namely, SE lacks the STRUT-FOOT split. In
SE and other accents of Northern British English STRUT and FOOT are not
distinct phonological vowel categories and both are represented phonetically
as [ʊ] (e.g., Wells, 1982; Upton and Widdowson, 1996; Stoddart et al., 1999), as
indicated in Table 2.3. Words such as ‘strut’ and ‘buck’ in SSBE and other
accents of Southern British English contain the vowel [ʌ] (the STRUT vowel)
which is clearly distinct from the vowel [ʊ] in words such as ‘foot’ and ‘put’ (the
FOOT vowel). Conversely, in SE and other accents of Northern British English,
words such as ‘strut’ and ‘buck’ contain [ʊ] and words such as ‘foot’ and ‘put’
also contain [ʊ]. The prevalence of the STRUT-FOOT split in Southern British
English accents and lack of it in Northern British English accents is evident in
Ferragne and Pellegrino’s (2010) recent acoustic description of the vowels in 13
accents of the British Isles. SE, in common with other accents of Northern

2. Review of previous research
13
British English, has a vowel category equivalent to the SSBE FOOT vowel, but it
lacks a separate vowel [ʌ] belonging to a category equivalent to the SSBE
STRUT vowel. In effect, SE has one less monophthong vowel category in its
vowel inventory than SSBE and hence shares 10 of the 11 SSBE
monophthongal vowel categories, namely FLEECE, KIT, DRESS, NURSE, TRAP,
PALM, LOT, THOUGHT, FOOT and GOOSE. Regarding the diphthong vowel
categories, both SSBE and SE contain the same five categories FACE, PRICE,
CHOICE, GOAT and MOUTH.
2.3. Vowel production and vowel acoustics
2.3.1. Introduction
While differences can be observed between the NSD, SSBE and SE vowel
inventories based on vowel transcriptions alone, a more fruitful analysis would
investigate how each vowel is physically produced and/or would examine the
physical properties of the vowels themselves. Around the middle of the 20th
century, advances in technology applied to the study of speech paved the way
for more objective methods of describing speech sounds in terms of
articulatory gestures and acoustic properties. An exploration of the
relationship between the articulation and the acoustic properties of the
resulting speech sound gave rise to the source-filter model of speech
production, which is summarised in section 2.3.2 below. This model is
particularly useful for understanding the nature of the most important
acoustic properties of vowel sounds, which are discussed in section 2.3.3. In
addition to the basic mechanisms that produce vowel sounds, there are many
other factors that can affect the acoustic properties of vowels and the most
significant of these are reviewed in 2.3.4.
2.3.2. Source-filter model of speech production
The source-filter model at its most basic states that the glottal pulses are the
source of a vowel sound which is then filtered by the vocal tract, resulting in a
vowel sound at the opening end (the lips) (Fant, 1970; Stevens, 1998; Johnson,
2. Review of previous research
14
2003). The various configurations of the vocal tract filter the source sound
differently, creating different vowel sounds. It is how the source is filtered
according to the particular resonant responses of the vocal tract that
contributes to the quality of a given vowel. On this account, a vowel is defined
as a speech sound produced with the glottal source filtered by an open vocal
tract.
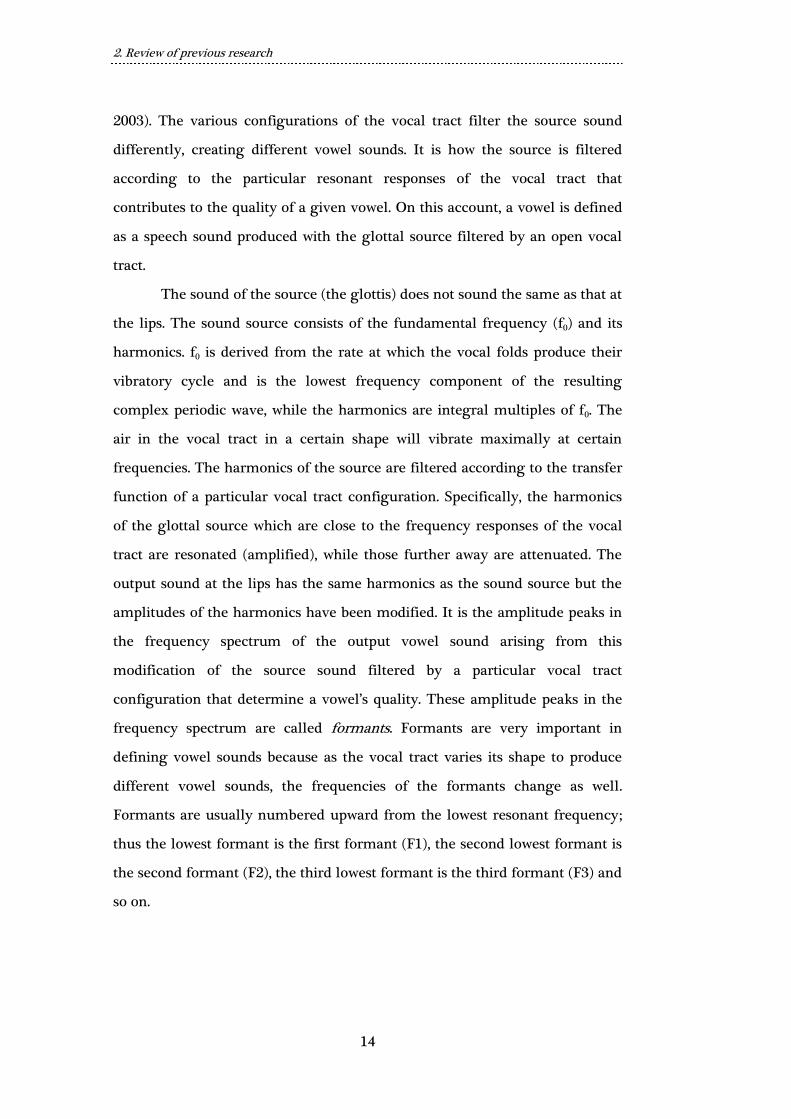
The sound of the source (the glottis) does not sound the same as that at
the lips. The sound source consists of the fundamental frequency (f0) and its
harmonics. f0 is derived from the rate at which the vocal folds produce their
vibratory cycle and is the lowest frequency component of the resulting
complex periodic wave, while the harmonics are integral multiples of f0. The
air in the vocal tract in a certain shape will vibrate maximally at certain
frequencies. The harmonics of the source are filtered according to the transfer
function of a particular vocal tract configuration. Specifically, the harmonics
of the glottal source which are close to the frequency responses of the vocal
tract are resonated (amplified), while those further away are attenuated. The
output sound at the lips has the same harmonics as the sound source but the
amplitudes of the harmonics have been modified. It is the amplitude peaks in
the frequency spectrum of the output vowel sound arising from this
modification of the source sound filtered by a particular vocal tract
configuration that determine a vowel’s quality. These amplitude peaks in the
frequency spectrum are called formants. Formants are very important in
defining vowel sounds because as the vocal tract varies its shape to produce
different vowel sounds, the frequencies of the formants change as well.
Formants are usually numbered upward from the lowest resonant frequency;
thus the lowest formant is the first formant (F1), the second lowest formant is
the second formant (F2), the third lowest formant is the third formant (F3) and
so on.
2. Review of previous research
15
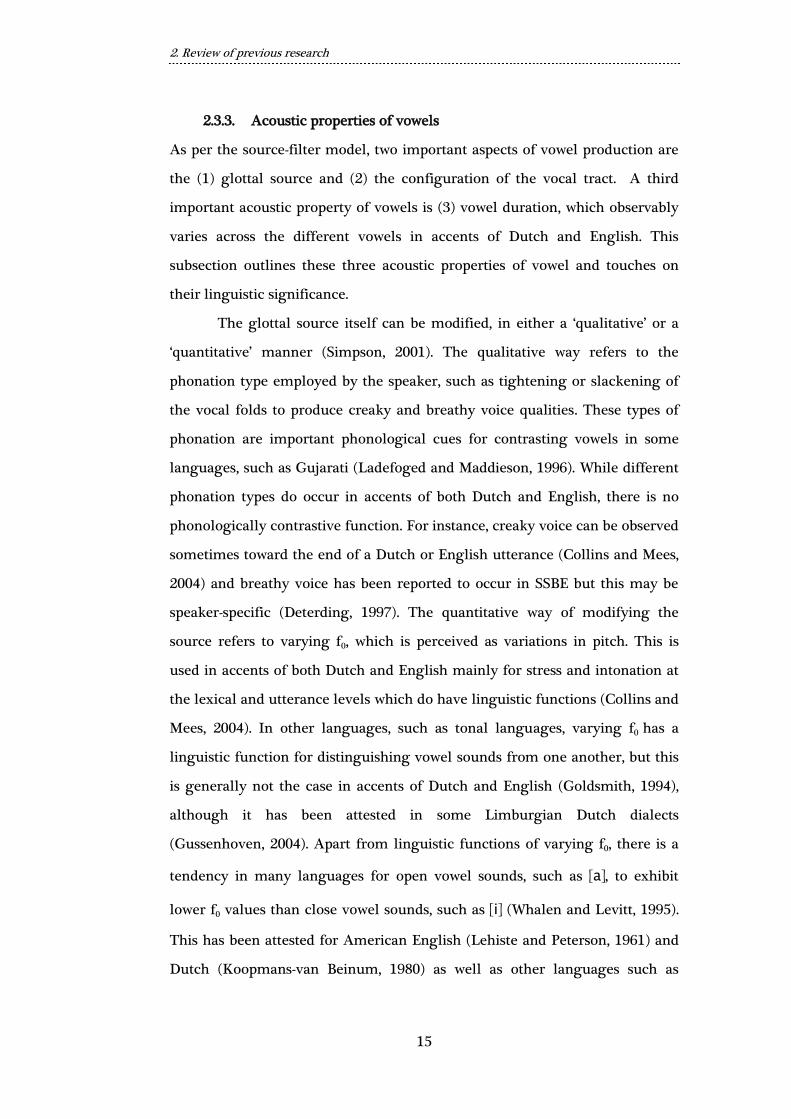
2.3.3. Acoustic properties of vowels
As per the source-filter model, two important aspects of vowel production are
the (1) glottal source and (2) the configuration of the vocal tract. A third
important acoustic property of vowels is (3) vowel duration, which observably
varies across the different vowels in accents of Dutch and English. This
subsection outlines these three acoustic properties of vowel and touches on
their linguistic significance.
The glottal source itself can be modified, in either a ‘qualitative’ or a
‘quantitative’ manner (Simpson, 2001). The qualitative way refers to the
phonation type employed by the speaker, such as tightening or slackening of
the vocal folds to produce creaky and breathy voice qualities. These types of
phonation are important phonological cues for contrasting vowels in some
languages, such as Gujarati (Ladefoged and Maddieson, 1996). While different
phonation types do occur in accents of both Dutch and English, there is no
phonologically contrastive function. For instance, creaky voice can be observed
sometimes toward the end of a Dutch or English utterance (Collins and Mees,
2004) and breathy voice has been reported to occur in SSBE but this may be
speaker-specific (Deterding, 1997). The quantitative way of modifying the
source refers to varying f0, which is perceived as variations in pitch. This is
used in accents of both Dutch and English mainly for stress and intonation at
the lexical and utterance levels which do have linguistic functions (Collins and
Mees, 2004). In other languages, such as tonal languages, varying f0 has a
linguistic function for distinguishing vowel sounds from one another, but this
is generally not the case in accents of Dutch and English (Goldsmith, 1994),
although it has been attested in some Limburgian Dutch dialects
(Gussenhoven, 2004). Apart from linguistic functions of varying f0, there is a
tendency in many languages for open vowel sounds, such as [a], to exhibit
lower f0 values than close vowel sounds, such as [i] (Whalen and Levitt, 1995).
This has been attested for American English (Lehiste and Peterson, 1961) and
Dutch (Koopmans-van Beinum, 1980) as well as other languages such as
2. Review of previous research
16
German (Ladd and Silverman, 1984), European and Brazilian Portuguese
(Escudero et al., 2009) and Peruvian and Iberian Spanish (Chládková et al.,
2011).
Different vowel qualities are identified by different formant
frequencies arising from different shapes of the vocal tract made by the
speaker. The most important formants for defining vowel quality and
distinguishing between vowel sounds are undoubtedly the lowest two formants,
F1 and F2 (Peterson and Barney, 1952; Cohen et al., 1967; Pols et al., 1969).
Additionally, the third formant (F3) is important in describing some vowels
because it is affected by the shape of the constriction in the vocal tract as well
as vocal tract length, which can have an effect on whether a vowel is perceived
as front or back (Jackson and McGowan, 2012; Fujisaki and Kawashima, 1968;
Slawson, 1968). Acoustic descriptions of the vowels in accents of Dutch and
English make use of spectral properties to determine vowel quality, i.e., how
individual vowels differ from one another in their formant frequencies and
how formant frequencies differ between speakers of different accents and age
groups etc. This general acoustic approach has been utilised extensively to
describe the vowels in accents of Dutch (e.g., Adank et al., 2004; Adank et al.,
2007; Pols et al., 1973; Van Nierop et al., 1973) and the vowels in various
accents of English (e.g., Hillenbrand et al., 2000; Ferragne and Pellegrino, 2010;
Hawkins and Midgley, 2005). Usually, the formants beyond F3 (F4, F5, F6 etc.)
are less useful in revealing vowel-specific information and tend to reveal
speaker-specific information such as voice timbre (Sundberg, 1970), as is the
case in all of the acoustic descriptions of vowels in accents of Dutch and
English given above.
It is generally accepted that there is a relationship between tongue
position, affecting the size and shape of the vocal tract, and F1 and F2
frequencies (for a detailed account, see Raphael et al., 2007). A decreasing F1
frequency is associated with an increase in the height at which there is
maximum constriction (e.g., from high in the oral cavity to lower in the
pharyngeal cavity) and a decreasing F2 frequency is related to the increasing

2. Review of previous research
17
length of the oral cavity (e.g., a larger oral cavity by moving the tongue
downwards and/or backwards resulting in a smaller pharyngeal cavity). To
demonstrate the relationship between F1 and F2 and the shape of the vocal
tract, consider the close vowel [i] and the open vowel [a]. Typically, [i] exhibits a
relatively low F1 frequency and a relatively high F2 frequency. The tongue is
raised in the oral cavity toward the front, which pulls the tongue root from the
pharyngeal cavity, with the jaw moving upward to create a narrower mouth
opening at the lips. The space in the oral cavity becomes relatively smaller
while space in the pharyngeal cavity increases. A larger pharyngeal cavity
resonates to lower frequencies, producing a relatively low F1 frequency and, at
the same time, the relatively small length (constriction) of the oral cavity
results in resonances at higher frequencies, generating a relatively high F2
frequency. The vowel [a], on the other hand, typically has a relatively high F1
frequency and a relatively low F2 frequency. In the articulation of [a], the
tongue and jaw are lowered which pushes the tongue root downward, thereby
increasing the size of the oral cavity but reducing the size of the pharyngeal
cavity, creating a constriction. The relatively small pharyngeal cavity resonates
to higher frequencies than a larger pharyngeal cavity for [i], leading to a
relatively high F1 frequency. Likewise, the relatively long oral cavity resonates
to lower frequencies than the relatively small oral cavity for [i], so the result is
a relatively low F2 frequency.
It is important to bear in mind that the vocal tract may not remain in
the same configuration in the articulation of some vowel sounds and this is
especially true of diphthongs whose articulation involves tongue movement.
The changing shape of the vocal tract in the production of diphthongs results
in changes to the formant frequencies over the vowel’s duration, referred to as
formant movement. Consider the SSBE diphthong [ai] (the PRICE vowel)
composed of the two vowels [a] and [i] described above. The change in shape of
the vocal tract from the open vowel [a] to the close vowel [i] results in the
2. Review of previous research
18
vowel exhibiting a high F1 frequency and a low F2 frequency at the beginning
that transition into a much lower F1 and a much higher F2 at the end.
This relationship between the articulation of vowels and F1 and F2
sketched above is at best an approximation of how the different shapes of the
vocal tract can cause it to take on different resonant characteristics because it
is sometimes possible for two different articulations of a vowel to exhibit
similar formant frequencies, for instance, depending on the degree of lip
protrusion or the degree of tongue retraction. In impressionistic judgments
and speech perception, it has been observed that the relationship between
linguistic vowel height (or closeness) and frontness and tongue height and
frontness is not always consistent (Ladefoged et al., 1972; Johnson, 2003).
Aside from modifying the source and the vocal tract, vowels can also
differ from one another in their duration. Vowel duration is frequently
mentioned in descriptions of accents of Dutch and English vowels (e.g., Collins
and Mees, 2004). Vowel duration is the time a given vowel sound lasts for and
it is often described relative to the duration of other vowel sounds in a given
vowel inventory. In accents of Dutch and English, some vowels are
systematically longer than others, as noted in acoustic descriptions of vowels
for NSD (e.g., Adank et al., 2004) and American English (e.g., Hillenbrand et al.,
1995). In addition to the systematic variation, vowel duration can be affected
by speaking rate, stress, intonation, the place of the vowel sound in an
utterance (Klatt, 1976) as well as the consonants surrounding the vowel sound
(Van Leussen et al., 2011). While differences in vowel duration between the
vowel sounds in accents of both Dutch and English clearly exist, there is some
debate as to how vowel duration is used linguistically because its linguistic
purpose is not clear-cut. Descriptions of Dutch phonology, such as Booij (1995),
draw attention to a ‘short-long’ contrast involving vowel duration because it is
observable in some phonological processes, such as in the diminutive suffix
which is -tje after syllables containing a ‘short’ vowel and -etje after syllables
containing a ‘long’ vowel. There is also some evidence for a ‘short-long’
contrast in research on Dutch child-directed speech as Dutch-speaking parents
2. Review of previous research
19
are unlikely to exaggerate the duration of ‘short’ Dutch vowels (Dietrich et al.,
2007). For most accents of English, it has been noted that vowel duration is
‘intrinsic’ since some vowels are inherently shorter or longer than others
(House, 1961; Hillenbrand et al., 1995). However, it is unclear how significant
vowel duration is for phonologically contrasting vowels in English. For
instance, in Hillenbrand et al.’s (2000) study on the perception of American
English vowels that had been manipulated to be shorter or longer, listeners
were able to correctly identify the majority of vowels most of the time; only a
very small number of vowels resulted in some identification errors. In contrast
to native English listeners, Van der Feest and Swingley (2011) show that
modifying the duration of Dutch vowels did indeed affect native Dutch
listeners’ vowel identification. These studies by Hillenbrand et al. (2000) and
Van der Feest and Swingley (2011) demonstrate that, while vowel duration
systematically varies across vowel categories in both English and Dutch, the
linguistic relevance of vowel duration is much clearer for Dutch than for
English because modifying vowel duration led to a much higher proportion of
vowel identification errors for Dutch listeners than for English listeners.
The defining acoustic properties of vowel sounds in accents of Dutch
and English can be summed up as follows. Firstly, the source of vowel sounds
(f0) needs to be taken into account, even though it does not necessarily serve a
linguistic purpose in defining particular vowels, because f0 generally varies as
a function of vowel height. Secondly, F1 and F2 are crucial acoustic features
since these determine vowel quality, along with F3 to a lesser extent, and they
also provide a rough approximation of articulation. Thirdly, any change in
formant frequencies over the production of a vowel’s duration needs to be
tracked because formant movement is a defining feature of diphthongs, for
which there is tongue movement during their articulation. Lastly, vowel
duration is a salient acoustic property because it systematically varies across
vowels in accents of Dutch and English.

2. Review of previous research
20
2.3.4. Phonetic variation effects on the acoustic properties of vowels
The five acoustic properties outlined in 2.3.3. are useful in determining
individual vowel sounds because they provide a way of distinguishing vowel
sounds from one another. One of the key features of speech in general is the
‘lack of invariance’ in the acoustic signal (Appelbaum, 1996). While it is
possible to describe speech sounds in terms of their acoustic properties, there
are many factors which can affect the acoustic signal such that the acoustic
properties of two segments that would count phonologically as the ‘same’
speech sound can be quite different. This is what is meant by ‘phonetic
variation’ (for a review, see Lindblom, 1990). In acoustic analyses of vowels, or
any other speech sounds for that matter, phonetic variation needs to be
accounted for. For example, different sized vocal tracts and different voice
properties exhibited between male and female speakers result in inherently
different resonance characteristics and f0 frequencies, significantly influencing
the spectral properties of vowels. Furthermore, vowel segments are
particularly affected by what sounds precede and follow them (referred to as
coarticulation). Thus construing speech sounds as discrete segments is a
problematic notion because there are not always obviously clear-cut
boundaries between individual sounds in the acoustic signal. Additionally,
speech style and speech rate (e.g., clear speech, rapid speech) have an impact
on the resulting acoustic properties of speech sounds. A useful perspective for
examining phonetic variation is to observe it between speakers (inter-speaker
variation) and within speakers (intra-speaker variation) (Lindblom, 1990). This
subsection reviews some of the most important inter- and intra-speaker sources
of phonetic variation that influence vowel sounds.
Perhaps the most significant inter-speaker factor in which the acoustic
properties of vowel sounds can vary is whether the vowel was said by an adult
male, an adult female or a child. Recall that the glottis, the size and the length
of the vocal tract are the source and filter of the vowel sound. Differences in
anatomy and physiology (the glottis and vocal tract) affect f0 and the resulting
resonant frequencies (for a review, see Irino and Patterson, 2002). Adult

2. Review of previous research
21
females’ vocal folds typically vibrate at a rate twice that of males’ vocal folds,
with children’s vocal folds vibrating at an even more rapid rate. This results in
the adult female voice exhibiting a higher f0 and more widely spaced
harmonics than the adult male voice. Additionally and perhaps more
significantly, the distance from the glottis to the lips along the vocal tract is
typically shorter for children and adult females than for adult males, meaning
that the inherently different sized vocal tracts, regardless of configuration, will
resonate to different frequencies (Johnson, 2003; Raphael et al., 2007). Even if
the vocal tract configurations are analogous, a vowel sound said by a child or
an adult female speaker will typically exhibit amplitude peaks at higher
frequencies (i.e., higher formant frequencies) than the ‘same’ vowel sound said
by an adult male speaker because a smaller vocal tract will generate higher
resonant frequencies. The differences in formant frequencies between adult
females, adult males and children is clearly demonstrated in Peterson and
Barney’s (1952) classic study on American English vowels in which adult
females and children exhibited much higher f0, F1, F2 and F3 frequencies than
adult males. Despite the large absolute differences in frequencies, the relative
positions of F1 and F2 for each vowel were broadly similar across the three
groups of speakers.
Such between-gender differences in f0 and formant frequencies make it
problematic to directly compare the ‘same’ vowel sound said by adult male and
female speakers, regardless of other phonetic factors. Normalisation
procedures have been developed in an attempt to overcome variation between
speakers’ formant values caused by different sized vocal tracts (for a review,
see Adank, Smits and Van Hout, 2004). However, the way in which such
procedures are designed often makes comparisons of vowel systems that differ
in size and shape difficult (cf., Adank et al., 2007; Clopper et al., 2005; Geng
and Mooshammer, 2009), such as comparing vowels across different languages.
A commonly-observed between-gender difference for vowel sounds is
that female speakers tend to produce vowels with longer duration than male
speakers, regardless of the speech style or speech rate. This phenomenon has
2. Review of previous research
22
been found in several accents of Dutch (Adank et al., 2007) and in American
English (Hillenbrand et al., 1995; Jacewicz and Fox, 2012), as well as many
other languages (for a review, see Simpson, 2003). However, it is not entirely
clear why this is so. On the one hand, there are sociolinguistic explanations
which, for example, attribute the gender difference in vowel duration to social
factors such as female speakers typically adopting a more careful speech
repertoire than male speakers (Labov, 1972). On the other hand, physiological
accounts provide reasons why this tendency is observed across many
languages and cultures (Simpson, 2001; Simpson 2003). For instance, Simpson
(2003) found that there are significant differences between male and female
speakers of American English in their synchronisation of tongue tip and
tongue body movements in the vowel sound in the English word ‘light’, with
male tongue body movement beginning earlier, which could account for
female speakers’ longer vowel durations.
In addition to the inter-speaker differences in the acoustic properties of
vowels arising from anatomical and physiological differences between genders,
there is also intra-speaker phonetic variation. In other words, the five acoustic
properties of f0, F1, F2, F3 and duration of a vowel sound can all be affected by
the phonetic context in which it was produced, i.e., speech style, speech rate
and coarticulation.
Speech style and speech rate, which are closely linked, can affect the
acoustic properties of vowels. Speech style refers to the utterance type, whereas
speech rate specifically focuses on the duration of speech sounds relative to the
overall duration of an utterance. Speech style has been studied in terms of
‘clear speech’ and ‘casual speech’ or ‘normal speech’ (Moon and Lindblom,
1994), with speakers using an utterance type based on the needs of the
situation. Clear speech can be described as ‘overarticulated’ and is used in
situations such as speaking in noise, speaking to non-native speakers with
limited comprehension skills and communicating with infants (examples cited
from Moon and Lindblom, 1994). Other speaking styles, commonly used in
experimental studies, include utterances said in citation form or utterances

2. Review of previous research
23
said in sentence form, both of which exhibit different speaking rates (Stack et
al., 2006; Strange et al., 2007). Citation utterances are words said in isolation,
often at a slower pace than in a conversation, and there is usually a pause if
preceded by another utterance (Strange et al., 2007). Sentence utterances, on
the other hand, are longer and the speech rate can vary from normal to rapid
(Strange et al., 2007). It has been reported in the literature that less clear and
more rapid speech results in vowel reduction, i.e., shorter vowel duration and
formant undershoot. Formant undershoot refers to the observed shift of F1 and
F2 to the centre of the F1 and F2 vowel plane (Stevens and House, 1963).
Vowel reduction arises not only due to speech style and rate but also due to
stress patterns (Stack et al., 2006).
The acoustic properties of vowels are greatly influenced by
coarticulation, which is a temporal overlap of articulatory movement for
different sounds (Raphael et al., 2007). Coarticulation in vowel sounds has
often been regarded as phonetic vowel reduction (Strange et al., 2007), not
unlike that observed in relation to speech style, speech rate and stress above. In
this type of vowel reduction, there is an observable influence of the flanking
consonants on the vowel formants measured at vowel midpoint, which has
been found, for example, in SSBE, Danish and German (Steinlen, 2005), in
American English (Hillenbrand et al., 2001; Strange et al., 2007) and in NSD
(Van Leussen et al., 2011). Comparisons of the effects of consonantal context
on mid-vowel formant frequencies across different languages reveal that the
effects are not universal. In their comparison of phonetic context effects on
mid-vowel formant frequencies from North German, Parisian French and
American English vowels, Strange et al. (2007) found that the patterns of
change arising from different consonantal contexts varied across the three
languages. Alveolar contexts appear to shift the F1 and F2 frequencies of
vowels more than labial contexts, but the pattern of shifts was not the same in
every language. For instance, American English and Parisian French /uː/
exhibit a large shift in an alveolar context, with the shift in American English
2. Review of previous research
24
being much greater, while North German /uː/ exhibits only a small shift in an
alveolar context (Strange et al., 2007). In light of such language-specific
tendencies, Strange et al. (2007) suggest that coarticulation in vowels is
learned rather than a universal phonetic effect and it therefore not only varies
between languages but could also differ between regional accents of the same
language.
The latter point – that the acoustic properties of sounds can vary
between different regional accents of a language – is of particular relevance to
the present project. This type of phonetic variation is frequently considered in
the context of social factors and referred to as sociophonetic variation. Foulkes
and Docherty (2006: 411) define sociophonetic variation as ‘variable aspects of
phonetic or phonological structure in which alternative forms correlate with
social factors’. The differences in the production of sounds in regional accents
of the same language may be regarded as an example of inter-speaker
sociophonetic variation, such as that exhibited by differences in the vowel
inventories of SSBE and SE. The accents of SSBE and SE vary both in their
phonetic properties of their vowels and phonological structure of their vowel
inventories (subsections 2.2.3 and 2.2.4), presumably leading to differences in
the vowels’ acoustic properties. The phonetic and phonological differences in
vowels can be viewed as the alternative forms that are correlated with the
social factor of geographical region (i.e., Home Counties versus the city of
Sheffield).
2.4. Vowel perception and linguistic experience
2.4.1. Introducing speech perception
The previous section has shown that the study of the acoustic properties of
vowels is complex given the large amount of phonetic variation involved in
their production. Raphael et al. (2007: 331) define speech perception simply as
the ‘understanding of speech’. In order to understand speech, a listener must
assign meaning to the speech signal (input sound) based on the information

2. Review of previous research
25
that is heard in it. Hence an important goal of research on speech perception
has been to uncover what information in the acoustic signal determines what
speech sounds are heard by the listener to make up linguistically meaningful
utterances.
In order to recognise speech sounds, the units that make up words and
sentences in speech, infants must learn them in their ambient language. Even
before infants can identify individual speech sounds, they are able to
discriminate between them and evidence shows that infants can discriminate
most speech sounds in any language before the age of around 8 months (e.g.,
Best and McRoberts, 2003). As adults, this apparent ability to discriminate
between speech sounds from any language in the world declines considerably,
making the discrimination of non-native speech sounds much more difficult
(e.g., Goto, 1971; Werker and Tees, 1984; Iverson et al., 2003) and
concomitantly the discrimination of native speech sounds almost effortless.
Theories have attempted to account for these observations regarding infants’
development of phonetic abilities. Early theories posited that infants possess an
innate capacity to distinguish all speech sounds and, with linguistic experience,
these are maintained or lost, such as that proposed in the phonetic feature
detector account (Eimas, 1975) or motor theory (Liberman and Mattingly,
1985). The phonetic feature detector account relies on an individual’s
responsiveness to acoustic events for phonetic distinctions, while motor theory
is rooted in an individual’s knowledge of the vocal tract which guides speech
perception. The mechanisms behind the two theories are quite different but
they both share the notion of selection: infants’ innate phonetic abilities are
fine-tuned by the selection of those properties that relevant for sounds in their
ambient language. Theories based on the idea of selection have been
challenged by subsequent studies on animals’ perception of human speech
sounds and by studies on infants’ discrimination of non-speech sounds. Such
studies provided little support for the notion of infants exhibiting innate
phonetic capabilities. Studies on the perception of speech in animals have
repeatedly shown that perception is possible after training and resembles
2. Review of previous research
26
humans’ perception (e.g., chinchillas’ discrimination of English /t-d/ reported
in Kuhl, 1981) and studies on infants discriminating non-speech stimuli (e.g.,
Jusczyk et al., 1980). Taken together, infants’ apparent early abilities are most
likely a reflection of general auditory and perceptual properties and are not a
result of any universal innate phonetic capabilities. Current theories on native
language learning and the perception of non-native sounds therefore stress the
importance of linguistic experience.
As noted above, in the first half of the first year of their life, infants are
able to perceive speech sounds in a general manner, as shown in their ability
with non-native speech sounds, and between six and 12 months they become
attuned to their native language resulting in a decrease in non-native
perception but an increased sensitivity to native perception. During this time,
they move from general perception to language-specific phonetic perception.
Kuhl et al.’s (2008) native language magnet theory, expanded (NLM-e), a
revised version of Kuhl’s (1994) native magnet model, outlines some principles
of the development of phonetic perception in infants. In the first phase, infants
begin life being able to discriminate all speech sounds. Acoustic salience
involved in a particular contrast also plays a part. In phase two, phonetic
learning takes off. Infants become sensitive to the distributional patterns,
facilitated by infant directed speech and social interaction. In addition, the link
between speech perception and production is forged. The detection of native
phonetic cues is enhanced, while sensitivity to non-native patterns is reduced.
In phase three, phonetic learning is translated into word-learning and in phase
four the result of analysing incoming speech is relatively stable neural
representations. Kuhl et al. (2008) describe this as ‘native language neural
commitment’ and point out how this commitment constrains learning the
sounds of a new language in adulthood. Evidence from both behavioural and
neuroimaging studies support this proposal (e.g., Zhang et al., 2005).
Other accounts of the development aspects of speech perception find
similar results but they are based on different theoretical principles. For
example, the account within the framework of the Perceptual Assimilation
2. Review of previous research
27
Model (PAM) (Best, 1995; discussed further relating to adults’ cross-language
speech perception in 2.4.2) states that phonetic development occurs first and
language experience leads to discovering phonetically contrastive functions of
phonetic units (Best and McRoberts, 2003), especially with the onset of word
learning (Best et al., 2009). PAM provides an account for the observation that
six to eight-month-old infants are able to discriminate most speech sounds, like
Kuhl et al.’s (2008) NLM-e, but PAM places great emphasis on the fact that the
subsequent decline in non-native discrimination is not uniform. PAM stresses
the importance of the detection of articulatory information, rather than simply
acoustic or auditory information, in phonetic and phonological development.
In this way, PAM explicitly posits that the discrimination of non-native
contrasts by adults is gradient rather than uniform depending on how the two
members of a contrast are contrasted in relation to the native language’s
phonetic properties. Nevertheless, in common with Kuhl et al.’s (2008) NLM-e,
PAM attaches great significance to linguistic experience. Many further studies
demonstrate that adults’ linguistic experience affects or interferes with
learning the sounds of an unfamiliar or new language and this topic is
discussed in the next subsection.
2.4.2. Cross-language speech perception and the Perceptual
Assimilation Model
It is well known that adult learners’ linguistic experience, beginning in infancy,
affects their perception of non-native speech sounds (e.g., Zhang et al. 2005)
and it has long been noted adult learners of a second language (L2) struggle to
perceive and produce all L2 sounds accurately. Theories which attempt to
explain these observations posit that perceived similarity and dissimilarity of
non-native sounds to native categories predicts the difficulties learners will
face in learning the L2 speech sounds. In research carried out on non-native
speech perception, three main areas have garnered interest. The first area is
the perception of speech in accents or varieties of the same language, referred
to as cross-dialect perception (e.g., Evans and Iverson, 2004; Kitamura et al.,

2. Review of previous research
28
2006; Dufour et al., 2007; Tuinman, 2011; Clopper, 2011). The dialect or accent
of the listener will not match exactly that of the speech signal but it will
contain a great deal of phonetic and phonological similarity. The second area
of research is cross-language speech perception, which typically examines the
perception of speech in an unfamiliar non-native language. The final area of
non-native speech perception research is L2 speech perception, which
investigates the L2 learners’ perception of speech in their L2. Typically, this
may involve L2 learners who have varying degrees of experience with their L2
(e.g., MacKay et al., 2001; Flege and McKay, 2004). This subsection focuses
mainly on the second area, cross-language speech perception, and PAM was
formulated specifically with this kind of research in mind. While there is
naturally much overlap between the three branches of non-native speech
perception named above, only the relationship between the latter two, cross-
language speech perception and L2 speech perception, has been examined in
detail in the literature; this relationship is also discussed below.
Research on cross-language speech perception has typically centred on
the perception of non-native contrasts by naïve non-native listeners, i.e.,
listeners with little or no linguistic experience of the phonetic inventory of the
non-native language (e.g., Best et al., 2001; Strange et al., 2009; Strange et al.,
2011). In other words, the listeners in studies on cross-language speech
perception are ‘functional monolinguals’. That is, individuals who are not
actively learning or using the non-native language and are linguistically naïve
to the non-native language’s speech sounds (Best and Tyler, 2007). Results of
this type of research help to describe the ‘initial state’ of L2 learners as they
begin to learn the L2 phonological system (Strange, 2007; Gilichinskaya and
Strange, 2010; Escudero and Williams, 2011). Cross-language speech
perception also reveals the ‘origins of phonetically relevant perception and
possible developmental change in early abilities’ by investigating the impact of
differential language exposure on perception (Werker and Lalonde, 1988).
Research on cross-language speech perception should not be conflated with
research on L2 speech perception. Studies on L2 speech perception (and
2. Review of previous research
29
production) typically feature an entirely different kind of listener, i.e.,
individuals who are actively engaged in learning the L2, not functional
monolinguals, and who therefore display some evidence of perceptual
learning (e.g., MacKay et al., 2001). L2 learners’ perception of L2 sounds and
contrasts may only resemble naïve non-native listeners’ perception of the same
non-native sounds and contrasts at the very start of the learning process, before
substantial L2 exposure. There are many factors of L2 learners’ L2 experience
that can affect perceptual learning, such as formal language instruction by a
teacher with a foreign accent, L2 learners’ motivation to learn the L2, length of
residence in an L2-speaking country etc. (Best and Tyler, 2007). Rather
obviously, these factors cannot be said to affect naïve listeners’ non-native
perception.
PAM is an influential model of cross-language speech perception that
has been developed within the direct-realist account of speech perception (Best,
1995). The direct-realist account of speech perception is based on the
ecological theory of perception (Gibson and Gibson, 1955), stemming from a
philosophical viewpoint regarding perceptual knowledge that is compatible
with articulatory phonology (Browman and Goldstein, 1989). PAM states that
‘the perceiver directly apprehends the perceptual object and does not
merely apprehend a representative or “deputy” from which the object
must be inferred’ (Best, 1995: 173).
In other words, the listener directly perceives dynamic articulatory gestures of
the vocal tract carried in the speech signal, such as active articulators,
constriction locations and degrees of constriction (Best and McRoberts, 2003)
and not representations of these.
The basic premise of PAM is that non-native speech sounds
‘tend to be perceived according to their similarities to, and
discrepancies from, the native segmental constellations that are in
closest proximity to them in the native phonological space’ (Best, 1995:
193).
Similarity is based on the spatial layout of the vocal tract as well as the
dynamic properties of articulatory gestures, since these define phonetic

2. Review of previous research
30
properties and native phonology. A native phonological category is therefore
defined as ‘a functional equivalence class of articulatory variants that serve a
common phonological function’ (Best et al., 2001: 777).
PAM states that cross-language speech perception is influenced by
listeners’ knowledge of native phonological equivalence classes. Specifically,
listeners perceptually assimilate non-native sounds to native phonological
categories wherever possible, based on the detection of similarities in
articulatory properties. Likewise, listeners are expected to detect articulatory
discrepancies, particularly if these are large. It is possible that some non-native
sounds are not assimilated strongly to any particular native sound and this can
be so extreme that a non-native sound may be perceived as nonspeech.
Perceptual assimilation is tapped by behavioural tests that measure
identification (labelling), classification or categorisation (possibly including
goodness ratings) of non-native sounds (e.g., Best et al., 2003; Nishi et al., 2008;
Strange et al., 2011). There are three possible assimilation patterns: the non-
native sound (1) is assimilated to a native category, (2) is assimilated as an
‘uncategorizable speech sound’ or (3) not assimilated to any speech sound or
non-speech sound (Best, 1995; Best et al., 2001). The degree of assimilation to a
native category can vary from being a good fit to the native category to being
a deviant match. ’Uncategorizable’ refers to the non-native speech sound being
assimilated within native phonological space but it is not a ‘clear exemplar of
any particular native category (i.e., it falls within native phonological space but
in between specific native categories)’ (Best, 1995: 194).
Perceptual assimilation patterns involving non-native contrasts (pairs
of non-native sounds) have been of particular interest in the framework of
PAM. The assimilation of each member of the non-native contrast is indicative
of perceptual discrimination of the two non-native sounds from one another.
These pairwise assimilation patterns outlined in PAM are summarised as
follows in Table 2.4.
Although PAM relates specifically to cross-language speech perception,
the relevance of PAM’s predictions to L2 learners’ speech perception has
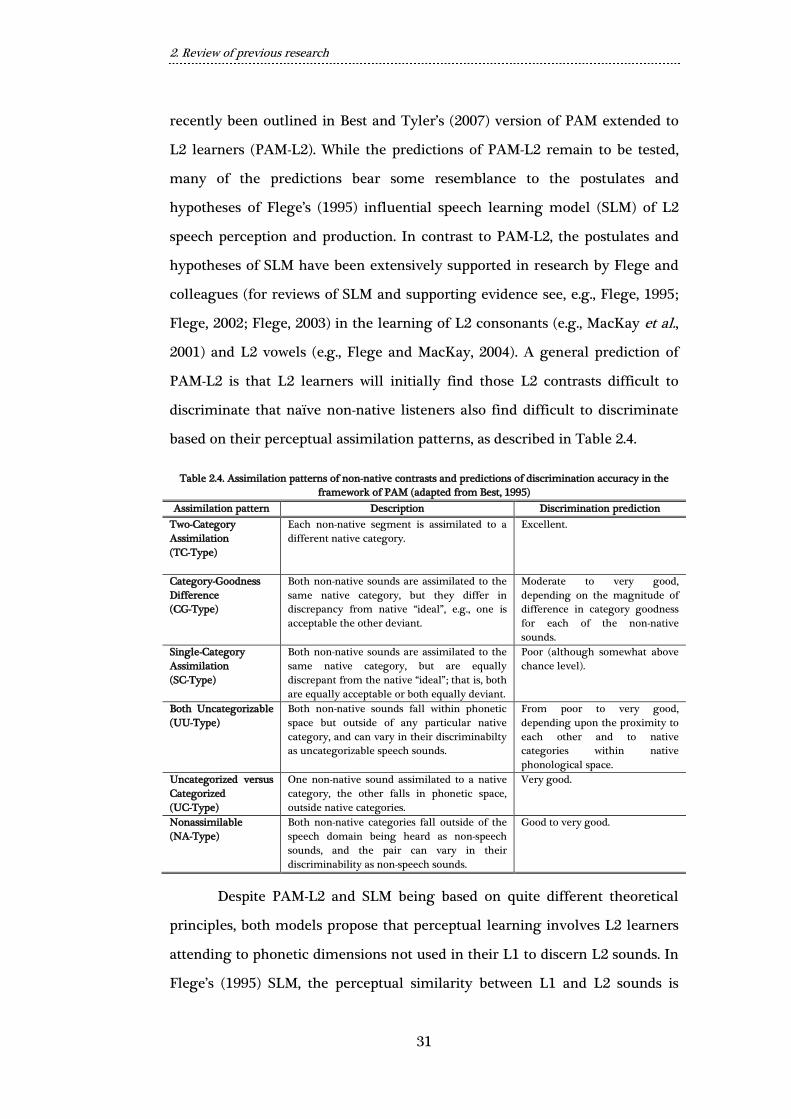
2. Review of previous research
31
recently been outlined in Best and Tyler’s (2007) version of PAM extended to
L2 learners (PAM-L2). While the predictions of PAM-L2 remain to be tested,
many of the predictions bear some resemblance to the postulates and
hypotheses of Flege’s (1995) influential speech learning model (SLM) of L2
speech perception and production. In contrast to PAM-L2, the postulates and
hypotheses of SLM have been extensively supported in research by Flege and
colleagues (for reviews of SLM and supporting evidence see, e.g., Flege, 1995;
Flege, 2002; Flege, 2003) in the learning of L2 consonants (e.g., MacKay et al.,
2001) and L2 vowels (e.g., Flege and MacKay, 2004). A general prediction of
PAM-L2 is that L2 learners will initially find those L2 contrasts difficult to
discriminate that naïve non-native listeners also find difficult to discriminate
based on their perceptual assimilation patterns, as described in Table 2.4.
Table 2.4. Assimilation patterns of non-native contrasts and predictions of discrimination accuracy in the
framework of PAM (adapted from Best, 1995)
Assimilation pattern Description Discrimination prediction
Two-Category
Assimilation
(TC-Type)
Each non-native segment is assimilated to a
different native category.
Excellent.
Category-Goodness
Difference
(CG-Type)
Both non-native sounds are assimilated to the
same native category, but they differ in
discrepancy from native “ideal”, e.g., one is
acceptable the other deviant.
Moderate to very good,
depending on the magnitude of
difference in category goodness
for each of the non-native
sounds.
Single-Category
Assimilation
(SC-Type)
Both non-native sounds are assimilated to the
same native category, but are equally
discrepant from the native “ideal”; that is, both
are equally acceptable or both equally deviant.
Poor (although somewhat above
chance level).
Both Uncategorizable
(UU-Type)
Both non-native sounds fall within phonetic
space but outside of any particular native
category, and can vary in their discriminabilty
as uncategorizable speech sounds.
From poor to very good,
depending upon the proximity to
each other and to native
categories within native
phonological space.
Uncategorized versus
Categorized
(UC-Type)
One non-native sound assimilated to a native
category, the other falls in phonetic space,
outside native categories.
Very good.
Nonassimilable
(NA-Type)
Both non-native categories fall outside of the
speech domain being heard as non-speech
sounds, and the pair can vary in their
discriminability as non-speech sounds.
Good to very good.
Despite PAM-L2 and SLM being based on quite different theoretical
principles, both models propose that perceptual learning involves L2 learners
attending to phonetic dimensions not used in their L1 to discern L2 sounds. In
Flege’s (1995) SLM, the perceptual similarity between L1 and L2 sounds is

2. Review of previous research
32
expressed in terms of ‘new’, ‘similar’ and ‘equivalent’ phones. Both PAM-L2 and
SLM agree that learning operates in a common ‘perceptual space’ occupied by
both the L1 and L2, but the models diverge in their treatment of phonological
categories. SLM draws mainly on phonetic considerations in determining
equivalent and similar phones, for example, whereas PAM-L2 expresses
equivalence and similarity as the perceptual assimilation of non-native/L2
sounds to native phonological categories; in PAM-L2 phonetic properties only
determine the goodness of fit to a phonological category. As for the learning
of ‘new’ phones, SLM hypothesises that new sounds are learned by the creation
of new phonetic categories and this task is easier if the perceived phonetic
dissimilarity between the L2 sound and closest L1 sound is great. PAM-L2
proposes an analogous scenario but based on different principles: a new
phonological category may be created if the L2 sound is ‘uncategorizable’ (as
in Table 2.4) because it falls within the native phonetic space.
Other approaches to cross-language speech perception and L2
perception are more explicit with regard to ‘uncategorizable’ non-native sounds.
Escudero’s (2005) Second Language Perception Model (L2LP) exploits cross-
language speech perception to make predictions on beginning L2 learners’
perception of their L2. This assumes that listeners are optimal perceivers of
their native language and when starting out to learn an L2, learners will
perceive the non-native language’s speech sounds in terms of their native
language’s categories. In this way, a central tenet of L2LP, in common with
PAM, concerns perceptual assimilation patterns. Unlike PAM’s assimilation
patterns outlined in Table 2.4, L2LP allows for multiple category assimilation.
While PAM and PAM-L2 regard non-native sounds that are not assimilated to
any particular native category as ‘uncategorizable’, L2LP does consider them to
categorised by assuming they are assimilable (i.e., perceived as similar) to
more than one native category rather than falling between native categories.
PAM frames perceptual similarity in terms of perceived gestural or
articulatory similarity. However, describing vowels in terms of gestural
constellations in the framework of PAM has so far not been completed, even in
2. Review of previous research
33
studies conducted within its framework and testing its predictions (e.g., Best et
al., 1996; Best et al., 2003). Besides research by Strange and colleagues (e.g.,
Strange et al., 2004; Strange et al., 2005; Nishi et al., 2008; Gilichinskaya and
Strange, 2010; Strange et al., 2011), relatively less attention has been paid to
the cross-language speech perception of vowels and vowel contrasts (but, e.g.,
Flege et al., 1994; Polka and Bohn, 1996; Willerman and Kuhl, 1996). This is
perhaps in part due to the continuous nature of vowels in their articulation and
acoustic structure (Strange, 2007). Additionally, the dynamic nature of vowels
and the influence of the context in which they are produced make their
perception all the more challenging to examine (see subsection 2.3.4).
Nevertheless, the gestural constellations for vowels and other speech sounds
have frequently been described in terms of an articulatory target. In order to
determine the articulatory target, research has focussed on the acoustic
properties of vowels because perception relies on the presence of this
information in the acoustic signal. Stack et al. (2006: 2399) summarise this
common approach by stating that
‘the vocalic nuclei provides information about acoustic vowel targets,
usually represented as the relative frequencies of the first two formants
measured within a single spectral cross section at the acoustic midpoint
of the syllable or at formant maxima/minima’ (authors’ italics).
In many cross-language studies, an acoustic proxy for vowel targets is formant
frequencies as measured at vowel midpoint, i.e., formant frequency values
taken from the steady-state vocalic nucleus. These types of acoustic
measurements, however, have only been used for the vowel targets of
monophthongs. Recall that the articulation of diphthongs is characterised by
the changing shape of the vocal tract throughout their duration, resulting in
their formants moving from one frequency to another. Few cross-language
studies have incorporated diphthongs and hence no precedent exists for
determining the vowel targets of diphthongs.

2. Review of previous research
34
2.5. Acoustic similarity and perceptual similarity of speech
sounds and the role of native accent
2.5.1. Measuring acoustic similarity of vowels
As outlined in 2.3.3, the defining acoustic properties of vowels are vowel
duration, f0 and the first three formants. Using acoustic properties such as
these, the acoustic similarity of vowels can be measured quantitatively in a
statistical procedure called discriminant analysis. This procedure has been
used extensively for this purpose by Strange and colleagues (e.g., Strange et al.,
2004; Strange et al., 2005; Gilichinskaya and Strange, 2010) and has been
adopted by others (e.g., Escudero and Vasiliev, 2011; Escudero et al., 2012). This
method has been particularly useful for making comparisons of vowels both
within and across languages. By allowing such comparisons to be made,
acoustic similarity can be taken as an empirical indication of phonetic
similarity (Strange, 2007; Jacewizc and Fox, 2012). Recall that cross-language
phonetic similarity is central to theories on cross-language speech perception
and L2 perception (e.g., PAM, PAM-L2, SLM and L2LP). In addition, using
acoustic data in discriminant analyses also avoids the need for vowel
normalisation techniques, which are not currently well-suited for use in cross-
language comparisons.
Aside from using acoustic data in discriminant analysis, there are other
methods of quantitatively gauging phonetic similarity which do not require
information on the acoustic properties of individual speech sounds. For
instance, McMahon et al. (2007) measured phonetic similarity quantitatively by
comparing phonetic transcriptions of strings of segments in cognate words
across several English accents in order to gauge how phonetically
similar/dissimilar the different accents were to one another. Transcriptional
data were used on this occasion because a further aim of the research was to
measure the phonetic similarity of contemporary varieties of English with
much older historical varieties, for which audio recordings are not available.
This methodological approach also serves a purpose quite distinct from that of

2. Review of previous research
35
studies on cross-language phonetic similarity. Namely, McMahon et al. (2007)
sought to examine the phonetic similarity between strings or sets of segments
(i.e., words), whereas cross-language studies typically seek to establish the
phonetic similarities between individual speech sounds rather than words.
Strange (2007: 45) defines discriminant analysis as
‘a method by which sets of tokens of multiple categories (specified in
terms of their acoustic parameters) can be classified, based on the
establishment of a multidimensional parameter space in which the
parameters are weighted to provide optimal separation of categories’.
This means that the vowel tokens said by speakers of language A can be
classified in terms of vowel tokens said by speakers of language B if both
language A and language B’s vowels are specified by some predefined acoustic
properties, such as vowel duration and formant frequencies. It is the proportion
of vowel tokens belonging to the vowel category x in language B classified as
the vowel category z in language A that acts as measure for the degree of
acoustic similarity of vowel x in language B to vowel z in language A.
In order to conduct cross-language discriminant analyses of vowels,
two sets of vowel data are needed, one for each of the languages involved. Each
set of data needs to contain acoustic measurements of multiple vowel tokens
for each vowel category that is to be included in the analysis. One set of data
functions as the training set and the other as the test set. The goal is to classify
the vowel tokens of the test set in terms of vowel categories of the training set.
Acoustic measurements for all the tokens of each vowel category from the
training set are entered into the model for the specified acoustic parameters.
The procedure then generates linear discriminant functions of these
parameters that best characterise each separate vowel category. The test set is
then introduced, which includes the same acoustic parameters as the training
set but for entirely different vowel categories from another language. Each
individual vowel token from the test set is then classified on the basis of its
acoustic measurements for the specified acoustic parameters according to the
closest linear discriminant function generated from the training set. The result
is that each individual vowel token from the test set is assigned a new vowel
2. Review of previous research
36
category label from the training set. The number of times a vowel token of a
particular vowel category from the test set is classified in terms of a vowel
category from the training set is summed and converted into a percentage.
This percentage figure is what acts as a measure of acoustic similarity of the
vowel category from the test set to the vowel category from the training set
because it is effectively a measure of acoustic closeness.
While Strange and colleagues have examined acoustic similarity of
vowels by means of formant measurements made at vowel midpoint to
represent vowel targets of monophthongs (e.g., Strange et al., 2004; Strange et
al., 2005), it is important to bear in mind that vowel formants may not remain
more or less the same throughout a vowel’s duration, as is the case with
diphthongs. As outlined in 2.4.2, describing vowels in terms of a single spectral
target resolves the potential difficulties arising from the variable nature of
vowels (Stack et al., 2006). Indeed, it is common for acoustic descriptions of
monophthongs to make use of formant measurements made only at vowel
midpoint (e.g., Adank et al., 2004; Adank et al., 2007; Escudero et al., 2009;
Chládková et al., 2011). However, monophthongs have been found to exhibit
some degree of formant movement in North American English (Hillenbrand
et al., 1995), though typically far less than diphthongs, and this has been found
to play some role in monophthong perception by American English listeners
(Hillenbrand and Nearey, 1999) and also by British English listeners (Iverson
and Evans, 2007). Accounting for formant movement exhibited by
monophthongs in discriminant analyses could therefore generate more
consistent classifications, which has been recently demonstrated by Escudero
and Vasiliev (2011). Specifically, a discriminant analysis which classified
Canadian English monophthong vowel tokens in terms of Peruvian Spanish
vowel tokens generated less than consistent classifications when formant
measurements made only at vowel midpoint were included. When formant
measurements from three time points (25% duration, midpoint and 75%
duration) were used, the Canadian English vowel tokens were classified much
more consistently in terms of the Peruvian Spanish vowels tokens; the greater
2. Review of previous research
37
consistency generated by the latter discriminant analysis was interpreted as
being a more reliable measure of acoustic similarity. Likewise, a recent study
examining two accents of American English found that accounting for
formant movement in discriminant analyses involving monophthongs also
provided more reliable classification results (Jacewicz and Fox, 2012).
It should be mentioned that it is not immediately clear whether there is
a need to include information on the dynamic spectral characteristics of
monophthongs, i.e., information on formant movement, in discriminant
analyses. There is evidence to suggest that the need to do so is actually
language-specific. In the two examples cited above (Escudero and Vasiliev,
2011; Jacewicz and Fox, 2012), the discriminant analyses were conducted on
vowel tokens of monophthongs from North American English accents and it is
known that a degree of formant movement is indeed characteristic of
American English monophthongs, also noted above (Hillenbrand et al., 1995;
Hillenbrand and Nearey, 1999). Escudero and Vasiliev (2011) also report on
discriminant analyses involving only Canadian French and Peruvian Spanish
vowel tokens. In these analyses, it was found that adding formant
measurements at 25% and 75% duration (in addition to those from midpoint)
to the model did not improve the consistency of resulting classifications. In
other words, including information on formant movement was only necessary
when the discriminant analyses included Canadian English vowel tokens.
On the basis of the available research, accounting for formant
movement in discriminant analyses involving monophthongs for the purpose
of measuring cross-language acoustic similarity is not strictly necessary, but it
can be helpful for providing more consistent results when vowel tokens from
North American English accents are used. This may well also be the case for
other accents of English. In any case, accounting for formant movement in
monophthongs does not appear to make the classification results from
discriminant analyses less consistent. Moreover, if diphthongs were to be
included in discriminant analyses, formant movement would undoubtedly
need to be accounted for, given their characteristic spectrally dynamic nature.

2. Review of previous research
38
2.5.2. Measuring perceptual similarity
Perceptual similarity is a listener’s assessment of how close one speech sound
is to another. In cross-language speech perception, this involves judging how
close a non-native speech sound is to a native speech sound. Measuring
perceptual similarity is a challenging task and there is no widely-accepted
paradigm for testing or measuring this. Most studies adopt a behavioural
approach in that listeners are presented with utterances and are asked to then
make a judgment on similarity. Some use qualitative methods, while others
attempt to quantify perceptual similarity.
Strange (2007) provides a review of the most common ways in which
perceptual similarity has been measured in the literature on cross-language
speech perception. She notes that researchers working within the framework of
PAM have often investigated cross-language perceptual similarity by
presenting listeners with instances of a non-native speech sound and then
asking them to orthographically transcribe the non-native sound in terms of
the closest native speech sound and sometimes also asking listeners to add
their own qualitative judgments such as ‘didn’t sound like speech at all’ (e.g.,
Best et al., 2001). However, one problem in this approach is the inconsistency
of listeners’ transcriptions and there are also problems with adequately
representing sounds in orthography, regardless of whether the speech sounds
presented to listeners are native or non-native. A more quantitative approach
has been developed by Flege and his colleagues. For example, in Flege et al.
(1994) listeners were presented with an instance of a non-native and a native
speech sound and then asked to rate on a nine-point Likert scale whether the
two sounds were ‘very similar’ or ‘very dissimilar’ to one another. In her review
of this approach by Flege et al. (1994), Strange (2007) asserts that there are
some advantages over a transcriptional approach since it circumvents the use
of orthographic labels and the use of a scale allows non-native sounds to be
ranked in the order of similarity to a native sound. However, this technique
also has the disadvantage of listeners directly comparing the non-native speech
sound to a native speech sound said by someone else. Therefore it does not
2. Review of previous research
39
directly tap into listeners’ perception of similarity to their own native speech
sound.
An approach like that in Flege et al., (1994) has been utilised by
Strange and her colleagues in which non-native utterances are presented to
listeners with a choice of predetermined orthographic labels (e.g., Strange et al.,
2004; Strange et al., 2005; Gilichinskaya and Strange, 2010; but, Levy, 2009b).
This experimental paradigm is a multiple-alternative forced-choice task where
listeners must select one of a limited range of predetermined options. Upon
hearing the non-native speech sound, listeners select the most similar speech
sound represented in the options presented to them and immediately
afterwards rate how similar the non-native speech sound was to their chosen
option on a seven-point or nine-point Likert scale that ranges from ‘a bad
example’ to ‘a good example’. By using a predetermined range of response
options, the experimenter can make it clear to listeners beforehand which
native speech sound is intended by each label without actually presenting
instances of the native speech sound to listeners. In this way, listeners are
basing their similarity judgments directly on their own intuitions of their
native language’s speech sounds. As with approach taken in Flege et al. (1994),
the addition of ratings provides a quantitative measure of the degree of
perceptual similarity.
While the use of Likert scales seems like a reasonable idea, in practice
it is by no means a perfect tool for measuring perceptual similarity. The
general criticisms regarding the use scales also apply in the context of cross-
language speech perception experiments. For instance, when presenting
averages of ratings, it is not advisable to use mean ratings since, technically
speaking, scales are ordinal and not interval. In other words, the difference in
perceptual similarity between, say, two and six on a nine-point Likert scale
might not be the same as the difference between, say, five and nine, even
though the difference in points is numerically the same. Instead of means,
averages can be presented with median ratings, but this makes it difficult to
implement parametric statistical procedures. Another issue with the use of

2. Review of previous research
40
Likert scales relates to two problems of listeners’ rating behaviour. The first
problem is that some listeners may make full use of the scale, whereas others
may prefer to use only part of it. It remains unclear to the researcher whether
this means there are any substantial differences between the listeners’
similarity judgments or whether it is simply to do with how listeners
interpreted the use of the scale.
One study which highlights the issues regarding Likert scales is Levy
(2009a). In this study, naïve listeners as well as two groups of L2 American
English learners of French completed a perceptual assimilation task in which
they were played Parisian French vowels in nonsense words. Listeners were
first played the stimulus and asked to select which of 13 English vowel
response options was the same vowel as that in the target word. Once the
option had been selected, listeners then heard the stimulus again and were
asked to rate the similarity of their choice on a nine-point Likert scale, with
one indicating ‘most foreign sounding’ and nine indicating ‘most English
sounding’. The focus of Levy’s (2009a) subsequent analysis is on response
percentages (percentage of times a non-native vowel was classified as a
particular native vowel) rather than the obtained similarity ratings because the
range of median similarity ratings was not large.
The issue of using rating scales is addressed again in Levy (2009b) who
reports on the same perceptual experiment as Levy (2009a) as well as a
discrimination task involving pairs of Parisian French vowels. The author
asserts that models on perception, such as PAM, formulate similarity
qualitatively and that there is currently no established objective measure for
perceptual similarity between native and non-native speech sounds. In order to
resolve this, a novel method is proposed that quantifies perceptual similarity
referred to as the ‘assimilation overlap method’. This method makes use of
listeners’ classification percentages from the perceptual assimilation task,
rather than only similarity ratings, in a calculation that indicates the degree of
perceived similarity of a pair of two contrasting non-native vowels to a single
native vowel. Specifically, the assimilation overlap is quantified by ‘the smaller
2. Review of previous research
41
percentage of responses when two members of a [non-native vowel] pair [are]
assimilated to a particular [native] vowel category’ (Levy, 2009b: 2678). The
smaller percentages from each vowel pair are then tallied to produce the
assimilation overlap score. The validity of this method of quantifying
perceptual similarity is tested on discrimination error scores for several French
vowel pairs and reveals a significant positive correlation between assimilation
overlap scores and discrimination error scores. That is, the higher the
assimilation overlap score (the more often two non-native vowels assimilate to
a single native vowel), the greater the level of discrimination errors.
Quantifying perceptual similarity by using response percentages rather than
similarity ratings appears to be a useful and reliable method, particularly for
testing the prediction of PAM that the greater the perceptual similarity of two
contrasting non-native speech sounds to a single native speech sound results in
poorer discrimination accuracy between the two non-native speech sounds.
While the concept of cross-language perceptual similarity appears quite
straightforward, as it is formulated qualitatively in models such as PAM,
attempting to measure it is a challenging task. At present, the most useful
behavioural technique appears to lie in looking at the frequency of responses
given by listeners to a particular non-native speech sound. In doing so,
perceptual similarity can be quantified and evidence (Levy, 2009b) suggests
that could be a promising technique to use.
2.5.3. Accent variation in cross-language speech perception
Studies on cross-language speech perception typically focus on the perceptual
assimilation of non-native speech sounds to those in listeners’ native language
with the goal of predicting perceptual difficulties for new learners of the target
language (or potential L2). The observed perceptual assimilation patterns are
predictive of discrimination difficulties, as stated within the framework of
Best’s (1995) PAM, and indicate speech sounds or non-native contrasts that will
be difficult to learn. Studies often involve listeners of a single language variety
listening to speech sounds from a single accent of a non-native language.
2. Review of previous research
42
Recent research, however, has drawn attention to variation within languages,
notably to different accents of a non-native language. Such research
investigates whether individuals from the same language background exhibit
the same or differential perceptual assimilation patterns when listening to the
speech sounds of two or more accents of the same non-native language. If
listeners do indeed exhibit different perceptual assimilation patterns for
different accents of a language, it suggests that learners will follow different
paths of learning the speech sounds of the different accents. That is, learners
will adopt different strategies depending on the specific variety of the
language they are learning, and therefore the specific variety of the target
language is a significant part of the learning process – a factor which has often
been overlooked in the literature.
As investigating accent variation in cross-language speech perception is
a developing research topic, there is limited evidence to refer to. One recent
study is Escudero and Chládková (2010), who report on a perceptual
assimilation experiment in which Peruvian Spanish listeners with very little
foreign-language experience classified synthetic vowel tokens based on
formant frequency values for nine American English monophthongs and nine
corresponding SSBE monophthongs in terms of the five Spanish
monophthongs. The results of this experiment show that some of the nine
English monophthongs were labelled differently. For instance, SSBE /æ/
(authors’ notation for SSBE TRAP) was classified most frequently as Spanish /a/,
whereas American English /æ/ was most frequently classified as Spanish /e/.
On the basis of the perceptual assimilation patterns, the authors make
predictions of how Peruvian Spanish learners of American English and SSBE
may differ in how they learn the nine English monophthongs, highlighting
some potential differences. The study underscores the significance of the
accent of the target language and specifically of how individuals may be faced
with different paths for L2 development. Thus accent variation in the target
2. Review of previous research
43
language does appear to be an important factor in cross-language speech
perception.
2.5.4. Accent variation in second-language speech perception
As is the case with accent variation in cross-language speech perception, there
has been relatively little research done on accent variation in the perception of
L2 speech sounds by L2 learners. One example is Escudero and Boersma (2004)
who investigated Spanish learners of Scottish English and SSBE. The study
demonstrates that the English /iː-ɪ/ vowel contrast (authors’ notation for
FLEECE and KIT, respectively) is realised differently in the two accents of
English, namely that in Scottish English the two vowels do not differ much in
vowel duration but vary in F1, whereas in SSBE the two vowels differ greatly in
vowel duration as well as in F1, and that for both accents /iː/ exhibits a higher
F1 than /ɪ/ but the F1 difference in SSBE is much greater than that in Scottish
English.
In the listening experiment conducted by Escudero and Boersma (2004),
Spanish learners were presented with synthetic stimuli based on formant
values for the Scottish English /iː-ɪ/ vowel contrast. The stimuli varied in six
equal auditory steps in F1 and F2, covering the ranges of average F1 and F2
values for naturally produced Scottish English /iː/ and /ɪ/, and each stimulus
was also presented with seven different durations. Listeners were asked to
select the English vowel they thought they heard by clicking on a picture of a
ship (= /ɪ/) or sheep (= /iː/). An analysis of the results shows that Spanish
learners whose target accent was SSBE tended to make use of durational cues
to mark the contrast, whereas those with Scottish English as a target language
tended to use spectral cues. This finding is in line with the acoustic
information available to listeners for this vowel contrast in the two English
accents. Namely, the main acoustic cue to distinguish the two vowels in
Scottish English is F1, while in SSBE the cue of F1 is also available but there is
also a large durational difference between the two vowels that Spanish learners

2. Review of previous research
44
seem to be particularly sensitive to. Ultimately, the results demonstrate that
Spanish learners of English adopt different strategies to learn the English /iː-ɪ/
contrast depending on how it is realised in the accent that they are exposed to.
2.5.5. Accent variation in cross-dialect and cross-language speech
perception
While it has been demonstrated in the literature that the accent of the non-
native language individuals are exposed to affects how speech sounds are
perceived (Escudero and Chládková, 2010) and subsequently learned (Escudero
and Boersma, 2004), far less attention has been paid to the inverse scenario,
namely what role listeners’ own native accent has in the perception of speech
sounds of a non-native language. Theoretical motivation for such an
investigation is borne out of PAM’s claim that the perception of non-native
speech sounds is shaped by native phonetic and phonological knowledge,
coupled with recent evidence from cross-dialect speech perception that
suggests the perception of speech sounds in other accents of the same native
language is also influenced by the native accent of the listener.
In cross-dialect speech perception studies, infants have been found to
discriminate between the accent around them and other unfamiliar accents of
the same language (Butler et al., 2011) and they have been shown to become
familiar with other accents after exposure via the media (Kitamura et al., 2006).
Familiar words spoken in an unfamiliar non-native accent are more difficult
for younger toddlers to recognise than older toddlers (Best and Tyler, 2006;
Best et al., 2009), indicating that there is an early phonetic bias to the native
accent and adaptation to non-native accents occurs with phonological
development at the onset of word learning. This apparent bias toward the
native accent can extend into adulthood. For example, word recognition in
noise is more accurate when listening to talkers with the same native accent
rather than non-native accents (Clopper and Tamati, 2010). Nevertheless,
listeners are still able to adapt to unfamiliar accents, even after limited
exposure (Maye et al., 2008) and the phonetic similarity between listeners’ and

2. Review of previous research
45
talkers’ native accents is a crucial factor in cross-dialect perception (Sumner et
al., 2006). Le et al. (2007) clearly demonstrate the relevance of phonetic
similarity. The authors found that Australian English listeners are better at
recognising words said in a South African accent than in a Jamaican Mesolect,
despite both non-native accents being unfamiliar, due to the greater phonetic
similarity of listeners’ native accent to the South African accent than to the
Jamaican Mesolect accent. Furthermore, some speech sounds are more
difficult to perceive for non-native accent listeners, especially when
phonological contrasts are involved that do not exist in listeners’ native accent.
Clopper (2011) found that Northern American English listeners (i.e., listeners
with the Northern regional accent as their native accent) exhibited greater
processing effort in the perception of /æ/ and /ɛ/ than General American
English because in the Northern American English accent these two vowels
are not as phonetically distinct from one another as in the General American
English accent. Phonological differences between listeners’ native accent and
non-native accents play an important role and have been repeatedly shown to
pose perceptual problems to non-native accent listeners. For example,
Southern French listeners of Standard French fail to discriminate the French
contrast /e-ɛ/ in word-final position in behavioural experiments (Dufour et al.,
2007) and neurophysiological evidence also supports this finding (Brunellière
et al., 2009; Brunellière et al., 2011). Similar neurophysiological evidence has
also been reported for listeners from American English accents (Conrey et al.,
2005).
Of particular relevance to the present project is a study by Evans and
Iverson (2004) who investigated how Northern British English listeners
adjusted their perception of English vowels depending on the English accent
they were listening to. As stated previously, one major way in which Northern
and Southern British English accents differ in their vowel inventories is that
most Northern British English accents lack a separate vowel category for the
SSBE STRUT vowel. In their study, Northern British English listeners were
2. Review of previous research
46
presented with two tasks in which they heard synthesised words embedded in a
carrier sentence. The two tasks were identical in every respect with the only
difference being the carrier sentence in which the synthesised words were
presented: in one task the carrier sentence was said in an SE accent
(representing an accent of Northern British English) and in the other task the
carrier sentence was said in an SSBE accent (representing a Southern British
English accent). Listeners were presented with an orthographic representation
of the target word and were asked to rate whether the stimulus was a good or
bad exemplar of it. The vowel sound in each target word changed in F1, F2 and
duration based on listeners’ goodness ratings over successive trials. The vowel
of the target word that received the highest goodness rating in the final set of
trials was used as listeners’ best exemplar of that vowel. The results showed
that Northern British English listeners chose Northern-like vowels regardless
of the accent in which the sentence was produced. Most notably, Northern
British English listeners’ best exemplar location for the SSBE STRUT vowel was
very unlike how SSBE speakers actually produce it and resembled how it is
produced in Northern British English accents, i.e., the same as the FOOT vowel.
The results of this experiment suggest that individuals’ native English accent
can clearly affect how the vowels of another English accent are perceived,
especially when there is a phonological category that does not exist in listeners’
native accent.
The issues associated with Northern British English listeners’
perception of the SSBE STRUT vowel found by Evans and Iverson (2004) also
relate to Northern British English individuals who have lived in the South of
England for an extended period of time. Evans and Iverson (2004) also report
on a virtually identical experiment to the one outlined above, but this time it
was presented to Northern British English listeners who had been living in the
South of England for an average of 8.6 years and SSBE listeners. The Northern
British English listeners’ best exemplar locations in this experiment did indeed
shift according to the accent of the carrier sentence (either SE or SSBE). For
the SSBE STRUT vowel, there was a reliable shift to a higher F1 when the words
2. Review of previous research
47
were presented in an SSBE sentence, which is in the direction of how this vowel
is produced in SSBE (i.e., [ʌ] is a more open vowel than [ʊ]). Nevertheless, the
Northern British English listeners’ best exemplar locations were still reliably
unlike those of Southern British English listeners, whose best exemplar
locations matched how the vowel is actually realised in SSBE. Although
Northern British English listeners were able to perceive a difference between
SE and SSBE, they still did not achieve native-like perception.
The profound effect of listeners’ linguistic experience in cross-dialect
perception has also been demonstrated for Southern French listeners of the
Standard French contrast /e-ɛ/ in word-final position. Dufour et al., (2010)
presented Southern French listeners with a series of explicit training tasks on
this non-native Standard French contrast, resulting in listeners successfully
distinguishing the contrasting vowels in word-final position. However, listeners
did not use this knowledge acquired in training in the recognition of words
that they already knew, demonstrating the effect of native accent in cross-
dialect perception even after training.
Studies on cross-dialect speech perception, such as those cited above,
very clearly demonstrate the significance of individuals’ particular native
accent in speech perception. Despite listeners being able to adapt to non-native
dialects to some extent, these studies highlight that listeners from different
native accent backgrounds, who have observable differences in their vowel
production, nevertheless exhibit differences in their phonetic knowledge of the
vowels of the same language. The fact that listeners from different accent
backgrounds may exhibit different native phonetic and phonological
representations of the vowels of their native language could play a significant
role in cross-language speech perception and perceptual assimilation of non-
native sounds to native sounds because listeners do not share the exact same
native representations.
A recent study by Chládková and Podlipský (2011) demonstrates that
differences in the phonetic properties of some of the vowels in the vowel
2. Review of previous research
48
inventories of two different accents of the same language can indeed have
direct consequences in cross-language speech perception. The authors report
on a perceptual assimilation task in which naïve Bohemian Czech (BC) and
naïve Moravian Czech (MC) listeners were presented with words containing
the 12 NSD vowels /i, y, ɪ, ʏ, ø, e, ɛ, a, ɑ, ɔ, o, u/. Participants were instructed to
choose from one of 10 Czech words represented in Czech orthography that
each contained a different Czech vowel. A major difference between BC and
MC is how the Czech /ɪ-iː/ contrast is realised: in BC the contrast is made by
both spectrum and duration (/iː/ has a lower F1 and is longer than /ɪ/), while
durational differences mainly contrast these two vowels in MC (/iː/ is longer
than /ɪ/, but with little difference in F1). As the NSD vowels /ɪ/ and /i/ are
contrasted by spectral properties and not by durational differences, the authors
hypothesised that BC listeners will assimilate the two NSD vowels to their
Czech /ɪ/ and /iː/ categories, respectively, and MC listeners will assimilate the
same two Dutch vowels mainly to their Czech /ɪ/ category only. The results of
the experiment confirmed this. As BC listeners mostly assimilated the two
NSD vowels to separate Czech vowel categories, discrimination is expected to
be good. As MC listeners assimilated both NSD vowels mainly to a single
Czech category, it is expected that discrimination of this NSD contrast will be
poorer and, as a result, it will be more difficult to learn. This study confirms
the significance of listeners’ native accent in cross-language speech perception
because different phonetic properties of the same vowel categories resulted in
differential perceptual assimilation patterns.
While Chládková and Podlipský (2011) draw attention to the influence
of native accent in cross-language speech perception by naïve listeners,
Escudero et al.’s (2012) recent study examines cross-language vowel perception
by L2 learners whose accent of their native language differs. The L2 English
learners (with SSBE as their target) in the experiment were native speakers of
either Flemish Dutch or North Holland Dutch and the experiment itself
2. Review of previous research
49
focused on the perceptual assimilation of the SSBE /æ-ɛ/ contrast (authors’
notation for SSBE TRAP and DRESS) to Dutch vowels. Listeners were presented
with a multiple-alternative forced-choice task in which they were told they
were going to hear Dutch words and select one of 12 response options
corresponding to the 12 Dutch vowels /i, y, ɪ, ʏ, ø, e, ɛ, a, ɑ, ɔ, o, u/. The stimuli
were various nonsense words containing the SSBE vowels /æ/ and /ɛ/. In
Flemish Dutch, the Dutch vowels /ɪ, ɛ, a, ɑ/ are realised with higher F1 values
and the Dutch vowels /ɪ, ɛ, ɑ/ are realised with lower F2 values than in North
Holland Dutch (Adank et al., 2007). To predict the possible perceptual
assimilation patterns by the two groups of listeners, acoustic data (F1, F2, F3
and duration) were submitted to a discriminant analysis to determine acoustic
similarity of the SSBE /æ/ and /ɛ/ vowels to the Dutch vowels /ɪ, ɛ, a, ɑ/ in
either Flemish Dutch or North Holland Dutch. The analysis revealed some
noticeable differences. For instance, 30% of the SSBE /ɛ/ tokens were classified
as Flemish Dutch /ɪ/, while none were classified as this vowel for North
Holland Dutch, as all were classified as Dutch /ɛ/. For North Holland Dutch, 50%
of the SSBE /æ/ tokens were classified as Dutch /ɑ/ and 50% classified as Dutch
/ɛ/, whereas for Flemish Dutch 100% of the SSBE /æ/ tokens were classified as
Dutch /ɛ/. In the perceptual assimilation tasks, North Holland and Flemish
Dutch listeners classified the two vowels in a remarkably similar way to the
classifications from the discriminant analysis.
These divergent patterns of cross-language perceptual similarity
between Flemish Dutch and North Holland Dutch affected L2 vowel
identification. In a second task, the two groups of listeners in Escudero et al.
(2012) were tested on their identification accuracy of SSBE vowels. The task
was the same as the cross-language task but only differed in that the response
options were written with English words to represent SSBE vowels. Flemish
Dutch listeners were more accurate at correctly identifying SSBE /æ/ than
North Holland Dutch listeners whereas North Holland Dutch listeners were

2. Review of previous research
50
more accurate at identifying SSBE /ɛ/. In each case, the group with the lower
accuracy more frequently confused the SSBE vowel with another SSBE vowel
than the other group: Flemish Dutch listeners erroneously identified SSBE /ɛ/
as SSBE /ɪ/ and North Holland Dutch listeners erroneously identified SSBE /æ/
as SSBE /ɛ/ more frequently than the other group. The pattern of results
corresponded to the listeners’ perceptual assimilation patterns. Taken together,
the two experiments suggest that the perceptual similarity of the vowels in
individuals’ native accents to those in an L2 can affect L2 vowel perception,
even after experience of actively learning the L2.
2.6. Summary
This chapter has reviewed previous research that is useful for the present
project by looking at well-established research as well as some very recent
studies. The vowels in the vowel inventories of NSD, SE and SSBE have been
identified. The source-filter model of vowel production relates vowel
articulation to vowel acoustics and in doing so it highlights some important
acoustic characteristics that define different vowel sounds. In particular, the
first three formants (F1, F2, F3), which are resonant frequencies of the vocal
tract, appear to be very important in determining the quality of vowels.
Languages can also make use of other acoustic properties for vowels and for
accents of English and Dutch these are duration and formant movement. Some
vowels have a longer relative duration than others and the formants of
diphthongs change considerably over their duration. Nevertheless, vowels are
rather difficult to describe acoustically due to the many phonetic factors.
Consequently, vowels are frequently construed in terms of acoustic targets,
such as midpoint formant frequencies.
Many similar and compatible observations have been made in theories
of speech perception, even if their theoretic foundations vary. Early in life
infants are able to discriminate virtually all speech sounds in the languages of
the world, but this ability declines as they become more attuned to the
2. Review of previous research
51
phonetic properties of their native language and to phonology when word
learning takes off. Linguistic experience with individuals’ native language
constrains the perception of non-native speech sounds, such as when learning a
new language, though this does not affect all speech sounds uniformly. Cross-
language speech perception examines the perception of non-native sounds by
naïve listeners and this provides a baseline for L2 learners’ initial state when
they come to learn the non-native language as an L2. Specifically, cross-
language speech perception has examined the perception of non-native speech
in terms of native phonological categories by investigating perceptual
similarity (via perceptual assimilation) since the perceived similarity of the
non-native speech sounds to native categories may lead to difficulties in the
perception of the non-native speech sounds, such as in discrimination as
proposed in Best’s (1995) PAM. PAM provides a theoretical framework for
cross-language speech perception. It is based on principles that are compatible
with articulatory phonology, though vowel sounds in particular have not yet
been described by PAM in articulatory terms. An empirical method of
measuring phonetic similarity is discriminant analysis, which classifies non-
native vowels in terms of the acoustically closest native vowels. The review in
this chapter of the most commonly used methods in cross-language speech
perception concludes that quantitative methods are preferable since they can
be applied consistently, but they are still not without their problems.
Studies on cross-language speech perception have not typically taken
into account the particular accents of listeners. However, recent studies are
beginning to show that accent variation in both speakers and listeners is by no
means trivial and, in fact, appears to be a significant factor in cross-language
speech perception and also L2 perception. Furthermore, studies on cross-
dialect perception demonstrate that listeners from different native accent
backgrounds may perceive some sounds of another accent of the same
language differently, especially when accents differ phonologically. This
suggests that accents do not only differ in speech production but also in speech
perception. Since native phonological categories and the phonetic properties
2. Review of previous research
52
can vary between accents of the same language, perceived similarity of the
sounds of a non-native language to these categories of one’s particular native
accent may vary. That is, listeners may exhibit different perceptual
assimilation patterns in cross-language perception and this has already been
demonstrated in a recent study. Further recent evidence demonstrates that
native accent variation in listeners extends to L2 speech perception.
Accent variation in cross-language speech perception is only beginning
to be investigated and at present there has been very little research carried out
on this precise issue. The research from this project will therefore provide a
valuable addition. Unlike the few studies reviewed in this chapter, this project
considers whole vowel inventories, rather than specific sounds, and therefore
provides a more complete picture of how listeners’ native accents may have an
effect. After all, accents of a particular language exhibit many similarities as
well as large and more subtle differences, and by investigating whole vowel
inventories, these will become clear.
3. The four studies: research framework and methodology
53
3.
The four studies: research
framework and methodology
3.1. Introduction to Chapter 3
This chapter identifies four research questions that provide the motivation for
this project. Each of the four questions is addressed by an experimental study
and this chapter introduces the methodology for each of them. Subsequent
chapters are devoted to the presentation and interpretation of the results from
the four studies (Chapters 4-7) and discussion of the results (Chapter 8). As the
four studies are data-driven, this chapter provides an overview of the
participants and the experimental variables involved in the experiments. The
present areas of research are cross-language acoustic comparisons of vowels
and cross-language speech perception. Section 3.2 outlines the main research
questions involved in this project. Section 3.3 identifies the variables under
investigation. Section 3.4 presents the backgrounds of the participants who
took part in this project. Sections 3.5 to 3.8 outline the methods used for each
of the four studies, i.e., the participants, stimuli and procedures employed and
section 3.9 summarises the present chapter.
3.2. Research questions
The aim of this project is to investigate the role of listeners’ native accent in
the cross-language acoustic and perceptual similarity of vowels. Currently, it is
not well understood how systematic differences between vowel inventories of
accents of a given language influence the cross-language perception of vowels.
While studies are beginning to investigate this (Chládková and Podlipský, 2011;
Escudero et al., 2012), none have tackled whole vowel inventories and none
have included non-native diphthongs. In the acoustic properties of speech
sounds in accents of the same language, there is bound to be a lot in common,

3. The four studies: research framework and methodology
54
but also differences and these may be reflected in cross-language perception.
This project uses established methods that have been employed in previous
cross-language acoustic comparisons and cross-language speech perception
studies but applies them to two groups of listeners who differ in their
particular native accent. The vowel inventories involved in the present project
are NSD, SSBE and SE. The NSD vowel inventory is made up of the 15
phonological vowel categories /i, y, ɪ, ʏ, ø, e, ɛ, a, ɑ, ɔ, o, u, ʌu, ɛi, œy/, the
SSBE vowel inventory contains 16 phonological vowel categories represented
by Wells’ (1982) lexical sets as FLEECE, KIT, DRESS, NURSE, TRAP, PALM, LOT,
STRUT, THOUGHT, FOOT, GOOSE, FACE, PRICE, CHOICE, GOAT and MOUTH and the
SE vowel inventory contains 15 phonological categories equivalent to those in
the SSBE vowel inventory minus an equivalent to the SSBE STRUT vowel. NSD
acts as the non-native vowel inventory, whereas the two native vowel
inventories are SSBE and SE, i.e., two accents of British English. In the
experimental work involved in this project, these are the two groups of English
listeners that are both unfamiliar with Dutch and the NSD accent. While both
groups are naïve listeners and native speakers of English, their linguistic
experience with English is presumed to differ. To examine the main goal of
investigating the role of listeners’ native accent in the cross-language acoustic
and perceptual similarity of vowels, the following four more specific questions
have been identified and each one is addressed in greater detail by one of the
four studies.
I. How do the vowels of NSD compare acoustically with the vowels of
SSBE and the vowels of SE?
II. How do SSBE and SE listeners differ in their perceptual identification
of English vowel quality?
III. How accurately do SSBE and SE listeners perceptually discriminate five
NSD vowel contrasts?
IV. How do SSBE and SE listeners perceptually assimilate NSD vowels to
vowels in their native vowel inventories?

3. The four studies: research framework and methodology
55
Question I is directly investigated in Study I, described in 3.5. This question
addresses several issues relating to vowel production. First of all, it seeks to
describe the vowels of the NSD vowel inventory. As has been shown in the
previous chapter, the NSD vowel inventory has been fairly well documented in
terms of its vowel categories and these have been investigated in several
acoustic descriptions (Pols et al., 1973; Van Nierop et al., 1973; Adank et al.,
2004; Adank et al., 2007). However, as will become clear in 3.5 below, it is
necessary to obtain new acoustic data. The second issue concerns SE. Unlike
NSD or SSBE, there is only one recent study which includes a description of its
vowels, Stoddart et al. (1999). Critically, very little is known about the acoustic
properties of SE vowels as Stoddart et al.’s (1999) study relies on transcriptions
based on auditory impressions. The lack of acoustic information on SE vowels
makes any acoustic comparison with NSD impossible. Hence acoustic data
must be collected. The third issue relates to comparability of different datasets.
As Question I centres on acoustic comparisons, it is preferable for all acoustic
data to have been collected following the same procedure. This point is
important since keeping the data collection procedure consistent minimises
artefacts resulting from variable data collection procedures and makes clearer
variation resulting from speakers themselves. In order to thoroughly address
Question I, new data are required on the acoustic properties of the vowels in
the vowel inventories of NSD, SSBE and SE so that acoustic similarity between
vowel categories can be reliably investigated. The main theoretical motivation
behind Question I, gauging acoustic similarity, is to use this as an indication of
cross-language phonetic similarity (Strange, 2007) – a notion that is central in
cross-language speech perception as outlined in PAM (Best, 1995; Best and
Tyler, 2007).
Question II is investigated in Study II, described in 3.6. This question
addresses whether SSBE and SE listeners differ in their use of spectral cues (i.e.,
vowel formants) that determine vowel quality for native English vowels. It is
expected that SSBE and SE speakers’ realisation of some vowels will differ in
their quality in speech production in Study I, but it is not clear whether this

3. The four studies: research framework and methodology
56
extends to their perceptual identification of vowel quality. Differences in native
vowel quality perception reveal the effects of different linguistic experience
between the two groups of listeners on vowel perception, as has been found in
cross-dialect perception studies (e.g., Evans and Iverson, 2004; Dufour et al.,
2007; Clopper, 2011).
Question III is investigated in Study III, outlined in 3.7. Theoretical
models on cross-language speech perception, such as PAM, posit that some
non-native contrasts are more difficult than others. Question III examines
whether SSBE and SE listeners are able to discriminate five NSD vowel
contrasts equally well or differently. The five particular NSD contrasts were
chosen on the basis of L2 learners’ perceptual difficulties with them (Williams,
2010).
Question IV is directly examined in Study IV, described in 3.8. Question
IV addresses the core of theories on cross-language speech perception, such as
PAM, namely the perceptual similarity of non-native vowels to native vowels.
Given that there is expected to be some phonetic and phonological variation
between SSBE and SE speakers’ vowel inventories, it is also expected that the
perceptual similarity of NSD vowels to English vowels may vary between the
two groups of listeners. PAM expresses the notion of perceptual similarity in
cross-language speech perception as perceptual assimilation. That is, if a non-
native vowel is perceived as a sufficiently good exemplar of a native vowel
category, it will be categorised as that native category. The more similar the
non-native vowel is perceived to be to the native category, the more often
instances of the non-native vowel will be assimilated to the same native vowel
category, as demonstrated by Levy (2009b).
The four research questions relate to one another in the following
three ways and these are addressed in Chapter 8. Firstly, cross-dialect
perception studies have shown that listeners from different native accent
backgrounds may make differential use of phonetic properties to perceive
speech sounds and this appears to be related to their native accent (e.g., Evans
and Iverson, 2004; Dufour et al., 2007; Clopper, 2011). The acoustic properties

3. The four studies: research framework and methodology
57
of SSBE and SE vowels revealed in Study I could be compared to the acoustic
information SSBE and SE listeners use to identify these vowels in Study II.
Secondly, previous cross-language speech perception studies have used
acoustic comparisons as a basis for explaining perceptual assimilation patterns
(e.g., Strange et al., 2005, Escudero et al., 2012). The acoustic comparisons from
Study I can therefore be used to elucidate the perceptual assimilation patterns
uncovered from Study IV. According to PAM, if two contrasting non-native
vowels are perceptually assimilated to the same native category, the two non-
native vowels will be difficult to discriminate, though the level of difficulty
depends on the degree of assimilation of each non-native vowel to the same
native vowel category. Lastly, predictions made on the basis of the perceptual
assimilation patterns from Study IV should be borne out in the discrimination
results from Study III.
3.3. Experimental variables
Now that the four questions have been formulated, the possible variables in
experiments designed to address them will be identified and discussed.
The first variable to name is vowel inventory, which was outlined for
NSD, SSBE and SE in 2.2. Vowel inventory varies per accent group of
participants. Within each vowel inventory are the variables vowel categories.
For the purpose of the present study, the NSD vowel inventory is composed of
the 15 vowels /i, y, ɪ, ʏ, ø, e, ɛ, a, ɑ, ɔ, o, u, ʌu, ɛi, œy/. Similarly, the vowel
inventories of SSBE and SE both contain the 15 vowel categories FLEECE, KIT,
DRESS, NURSE, TRAP, PALM, LOT, THOUGHT, FOOT, GOOSE, FACE, PRICE, CHOICE,
GOAT and MOUTH and SSBE contains an additional vowel category for STRUT.
NSD, SSBE and SE have vowel categories which can be classified as
monophthongs or diphthongs based on their reported acoustic-phonetic
characteristics. For NSD, the monophthong vowel categories are /i, y, ɪ, ʏ, ɛ, a,
ɑ, ɔ, u/ and the diphthong vowel categories are /ø, e, o, ʌu, ɛi, œy/. For SSBE
and SE, the monophthong vowel categories are FLEECE, KIT, DRESS, NURSE, TRAP,
3. The four studies: research framework and methodology
58
PALM, LOT, THOUGHT, FOOT and GOOSE and SSBE has the additional
monophthongal category for STRUT. The diphthong categories for both SSBE
and SE are FACE, PRICE, CHOICE, GOAT and MOUTH. Note that in the NSD, SSBE
and SE vowel inventories, schwa /ǝ/ also occurs but will not be investigated in
this project. This is because in both English and Dutch schwa does not occur in
stressed syllables, as is addressed below in the methodology of Study I in
section 3.5.
The third set of variables to be considered is the acoustic properties of
vowel sounds. The most important acoustic properties for defining vowel
sounds are vowel duration, f0, F1, F2 and F3. Additionally, the spectral
properties of vowels may not remain constant throughout a vowel’s duration
and this is particularly apparent for diphthongs where there is a clear change
in shape of the vocal tract modifying its resonant characteristics over time,
resulting in formant movement. Even though monophthongs exhibit vowel
formants that are not always completely static (e.g. in varieties of American
English, Hillenbrand et al., 1995; Jacewicz and Fox, 2012), they can still be
described in terms of their steady-state formant characteristics or vowel target
(Stack et al., 2006; Strange, 2007; Strange et al., 2007; Van Leussen et al., 2011).
For diphthongs, on the other hand, formant movement should be taken into
account as this is a defining characteristic (Harrington and Cassidy, 1994).
There are many phonetic factors that can influence the acoustic
properties of vowel sounds. A goal of the present project is to investigate the
acoustic similarity of vowels and it is therefore crucial to minimise phonetic
variation as much as possible within and across the vowels in the vowel
inventories under study. Thus phonetic context can be considered to consist of
several variables. The first is vocal tract size, typically relating to gender. The
second is consonantal context, i.e., the consonants flanking a vowel. The third
relates to stress and syllable number. Stressed closed monosyllables (CVC) are
possible in accents of English and Dutch and all vowels can appear in this
situation, except for schwa. The use of a closed CVC structure allows not only
for a more naturalistic setting for speakers to produce various vowel sounds

3. The four studies: research framework and methodology
59
(rather than in isolation), but it also provides a clearer indication where the
vowel is located in the waveform of the syllable in subsequent acoustic
analyses. Additionally, using stressed syllables avoids any possible vowel
reduction or undershoot that can occur in unstressed syllables in accents of
English and Dutch. Finally, the utterance type should be kept constant as this
can also lead to vowel reduction or formant undershoot. As the present aim is
to examine acoustic similarity of the vowels themselves and not to provide a
comparison of how phonetic context effects can affect vowel acoustics across
NSD, SSBE and SE, the same phonetic context will be applied throughout in
order to minimise variation arising from different phonetic contexts.
Lastly, the perception of vowels will be examined by behavioural
methods and listeners’ responses to auditory stimuli are another set of
variables to be considered and these are split by the accent group of listeners.
The particular response variable depends on the specific experimental task and
these will be outlined in the relevant method sections below.
3.4. Participants
A total of 57 participants were involved in this project, split into three
groups of roughly equal size according to their linguistic experience, i.e., one
group for NSD, SSBE or SE individuals (Appendices A-C). The four research
questions presented above involve vowel production by native speakers of all
three linguistic experience backgrounds. As the research questions also
involve vowel perception by SSBE and SE listeners (and not NSD listeners), the
majority of the participants in the SSBE and SE groups took part in perception
tasks as well.
In total, 20 NSD participants were involved in this study and these are a
subset of the 22 NSD participants reported in Van Leussen et al. (2011). All
NSD participants were recruited through the Amsterdam Center for Language
and Communication at the University of Amsterdam and were either current
students or recent graduates. 10 NSD participants were male and 10 were
female. The median age of the NSD participants was 22, with ages ranging

3. The four studies: research framework and methodology
60
from 18 to 28. Appendix A displays the age and gender of each NSD
participant who took part in this project. The NSD participants had all grown
up and lived in the centre-west region of the Netherlands, i.e., in the provinces
of North Holland, South Holland and Utrecht, and reported that they
habitually spoke NSD. The NSD participants reported no knowledge of any
other language, except English, greater than four on a scale of zero (= no
knowledge) to seven (= native speaker). Note that it is very common for young
people in the Netherlands to have a good command of English and therefore
knowledge of English was not a criterion for taking part in this project. None
of the NSD participants reported any speech, language or hearing problems.
A total of 17 SSBE participants were recruited for this project through
the Division of Psychology and Language Sciences at University College
London. All were current students or recent graduates. 10 SSBE participants
were female and seven were male. The median age of the SSBE participants
was 23, ranging from 18 to 30. All SSBE participants reported habitually
speaking SSBE and were born and raised in the South East of England
(Bedfordshire, Cambridgeshire, East Sussex, Essex, Hampshire, Kent,
Middlesex, Surrey and West Sussex, all of which are in the ‘Home Counties’
region) and were living in London at the time of testing. No SSBE participant
reported knowledge of any language other than English greater than three on
the same scale of zero to seven used with the NSD participants above.
Appendix B provides background information for each SSBE participant
separately. None of the SSBE participants reported having any speech,
language or hearing problems.
20 SE participants were recruited for the project via the University of
Sheffield. 11 SE participants were female and the remaining nine were male.
The median age of the SE participants at the time of testing was 22, with an
age range of 18 to 30. All participants were born in the county of South
Yorkshire, with the majority (=15) born in the city of Sheffield itself. Three
participants were born in Rotherham, a town adjoining the north-eastern part
of the city of Sheffield. In addition, one participant was born in Doncaster and
3. The four studies: research framework and methodology
61
one was born in Barnsley, two towns close to Sheffield also situated in the
county of South Yorkshire. Although five of the 20 SE participants were not
born in Sheffield, they had grown up and lived in Sheffield for most of their
lives. All 15 participants who were born in Sheffield had also been raised in
Sheffield for all their lives. At the time of testing, all 20 SE participants resided
in the city of Sheffield and reported that they habitually spoke with a SE accent.
None of the SE participants reported having knowledge of any other language
greater than three on a scale of zero to seven. Appendix C shows complete
background information for each of the 20 SE participants. None of the SE
participants reported having any speech, language or hearing problems.
In terms of background factors, the NSD, SSBE and SE groups are
broadly similar, except for the obvious factors of linguistic experience
background and geographical location. All were university students or recent
university graduates. The three groups were of similar ages at the time of
testing. A one-way ANOVA with group as a factor (NSD, SSBE, SE) and age (in
years) as the dependent variable reveals no significant difference between the
NSD, SSBE and SE participants (F(2,54) = 0.43, p = 0.65). The similarity in ages
and spread of ages is visible in the median ages for the three groups of
participants (NSD = 22, SSBE = 23, SE = 22) and age ranges (NSD = 18-28, SSBE
= 18-30, SE = 18-30). One difference between the three groups is the knowledge
of other languages. The NSD group were all proficient in English, as is
common for young people in the Netherlands. Nevertheless, no NSD
participant reported any knowledge of other languages (besides English)
greater than four on a scale of zero to seven. As for the SSBE and SE
participants, none reported having knowledge of any other language greater
than three on the same scale. No SSBE or SE participant could be considered a
proficient speaker of any language other than English and therefore they can
all be considered functional monolinguals.
All participants completed background questionnaires, signed consent
forms in accordance with the University of Sheffield’s School of Modern
Languages and Linguistics ethics committee and received payment for taking
3. The four studies: research framework and methodology
62
part. Note that not all SSBE and SE participants were available to take part in
all four studies but that participants took part in all four studies unless
otherwise indicated.
3.5. Study I: Acoustic similarity of NSD vowels to SSBE and
SE vowels
3.5.1. Introduction to Study I
Study I directly addresses Question I, which is (repeated):
I. How do the vowels of NSD compare acoustically with the vowels of
SSBE and the vowels of SE?
This question seeks to examine which NSD vowels are acoustically most
similar to which SSBE and SE vowel categories as a means of measuring
phonetic similarity. Before this can be determined, it is necessary to find out
how the vowel categories in NSD, SSBE and SE are characterised acoustically
independently of one another. The most important acoustic properties for
describing vowel sounds are vowel duration, f0, F1, F2 and F3. For
monophthongs, F1, F2 and F3 can be measured at the steady-state part of the
vowel, vowel midpoint, whereas for diphthongs, formant movement should be
taken into account as well.
An established way of determining acoustic similarity, used extensively
by Strange and colleagues (e.g., Strange et al., 2004; Strange et al., 2005), is
linear discriminant analysis (LDA). Acoustic measurements from NSD, SSBE
and SE speakers’ vowel productions can be used as data in such an analysis.
Importantly, the vowel data must have been collected along similar lines to
avoid phonetic context effects as well as any possible effects of differences in
the recording procedure.
Study I draws on data on the acoustic properties of NSD, SSBE and SE
vowels. Although recent acoustic data on the vowels of NSD exists by Adank et
al. (2004) and Adank et al. (2007), it was decided to collect new acoustic data
and this was primarily motivated by Bank’s (2009) reanalysis of data from

3. The four studies: research framework and methodology
63
Adank et al.’s (2004) study. Bank (2009) calls into question the reliability of the
quality of Adank et al.’s (2004) recordings commenting that perceptually they
sound ‘dull’ and that Adank et al.’s (2004) reported F1 and F2 estimates appear
biased toward lower frequencies. Bank’s (2009) reanalysis of 600 vowel tokens
from Adank et al. (2004) using different formant estimation techniques
obtained even lower F1 and F2 frequencies than those originally reported.
Furthermore, a comparison with a small sample of newly collected NSD vowel
data shows that the F1 and F2 frequencies of the new data set are generally
higher and more noticeably affected by consonantal context than Adank et
al.’s (2004) results.
It was decided that new data be collected on SSBE and SE vowels as
well. Although acoustic information has been reported on SSBE vowels, no
single study has provided a comprehensive acoustic overview of all vowels.
The most complete are perhaps Deterding (1997) and De Jong et al. (2007)
since these report on several vowel categories simultaneously, but none, for
instance, includes details on diphthongs. There are, however, acoustic studies
on modern varieties of Received Pronunciation, such as Hawkins and Midgley
(2005), which are likely to have a lot in common with SSBE. As mentioned
earlier, little is known about the acoustic properties of SE vowels, thus new
data on the vowels of this accent are necessary. Nevertheless, acoustic
information has been reported on the vowels in various other accents of
Northern British English, such as Ferragne and Pellegrino (2010), which are
likely to share some characteristics with SE. Finally, few studies have reported
on phonetic context effects on the acoustic properties of vowels in SSBE
(Steinlen, 2005) and none have done so for SE, though many more studies have
been conducted on American English (e.g., Hillenbrand et al., 2001; Strange et
al., 2005; Strange et al., 2007). Since Study I involves cross-language
comparisons, it is necessary to minimise phonetic context effects. Chapter 2
reviewed various factors that can affect the acoustic properties of vowels and
Strange et al. (2007) found that the phonetic context effects are not universal
across languages and this also appears to be the case across accents of the

3. The four studies: research framework and methodology
64
same language (Chládková et al., 2011; Williams, 2012). Thus phonetic context
effects need to be kept constant in the experiment design.
3.5.2. Method: participants
All 20 NSD participants and all 17 SSBE participants were involved in this
study. 19 of the 20 SE participants took part in this study. Participant SE07 was
unable to attend the session devoted to Study I and as a result no data was
collected on her speech.
3.5.3. Method: stimuli
The stimuli consisted of written sentence prompts incorporating nonsense
monosyllables and disyllables that contained the vowel categories of each
vowel inventory in a variety of phonetic contexts. There were two separate but
analogous stimuli designs: one for Dutch-speaking participants (the NSD
group) and one for English-speaking participants (the SSBE and SE groups).
Footnote * explains the motivation behind the particular experiment design.
The NSD stimuli consisted of Dutch sentence prompts, each in the
format CVC. In CVC en CVCǝ zit de V (‘CVC. In CVC and CVCǝ we have V’). V
was one of the 15 NSD vowels /i, y, ɪ, ʏ, ø, e, ɛ, a, ɑ, ɔ, o, u, ʌu, ɛi, œy/ and CVC
was one of six consonantal contexts /fVf, pVp, sVs, tVt, kVk, tVk/*. All
sentence prompts were written using Dutch orthography which is relatively
unambiguous regarding the vowels and consonants involved in the task. An
example sentence is Fif. In fif en fiffe zit de “i” to elicit the target CVC and
CVCǝ syllables /fɪf/ and /fɪfə/, respectively. There were a total of 90 different
Dutch sentence stimuli (= 15 vowel categories X 6 consonantal contexts). The English sentence stimuli were analogous to the NSD sentence
stimuli. The English sentences were of the format CVC. In CVC and CVCǝ we
have V. V was one of the 16 SSBE vowel categories FLEECE, KIT, DRESS, NURSE,
TRAP, PALM, LOT, THOUGHT, FOOT, GOOSE, STRUT, FACE, PRICE, CHOICE, GOAT and
MOUTH. CVC corresponded to one of the six consonantal contexts /fVf, bVp,

3. The four studies: research framework and methodology
65
sVs, dVt, gVk, dVk/*. Altogether, there were 96 English sentence stimuli (= 16
vowel categories X 6 consonantal contexts).
As the spelling of the 16 vowel categories is not always transparent in
English orthography, extra care was taken in the preparation of the sentence
prompts to elicit the desired vowel. Specifically, each of the English sentence
stimuli described above was preceded by a sentence of a similar format
containing syllables based on the lexical set labels for each SSBE vowel
category. For instance, the sentence prompt Gake. In gake and gaka we have “a”
was preceded by the sentence prompt Face. In face and fasa we have “a” based
on the label face corresponding to the FACE vowel category. Thus each English
sentence prompt consisted of a couplet of sentences.
In addition to the sentence couplets, SSBE and SE participants were
presented with a list of English word prompts that consisted of the 16 SSBE
lexical set labels and examples of three other real English words containing a
vowel of the same category for each of the 16 labels.
Note that the English sentence stimuli included prompts for the STRUT
vowel for both SSBE and SE participants. Recall that SE and other accents of
Northern British English do not exhibit the STRUT-FOOT split. The inclusion of
this prompt for SE speakers was to test whether speakers of SE did indeed lack
a separate vowel category. It was expected that there would be no difference in
the realisation of the vowels prompted by the labels for STRUT and FOOT by SE
speakers. Conversely, including this prompt also verified whether speakers of
SSBE did indeed exhibit separate STRUT and FOOT vowel categories.
* The six Dutch and six English consonantal contexts were chosen to match those of Escudero et al.’s (2009)
and Chládková et al.’s (2011) studies on Brazilian and European Portuguese and Peruvian and Iberian
Spanish vowels, respectively. While Dutch and English permit flanking alveolar stops, as reflected in the
/tVt/ context for the Dutch sentences and the /dVt/ context for the English sentences, Portuguese and
Spanish do not and in the two aforementioned studies the alveolar context was adapted to /tVk/. This is the
rationale in the present study for also including /tVk/ for the Dutch sentences and /dVk/ for the English
sentences so that comparisons can be made with Portuguese and Spanish in the future. The remaining five
consonantal contexts in the present study were also based on those in Escudero et al. (2009) and Chládková
et al. (2011). Note that the initial stop consonants for the English sentences are the phonologically voiced /b,
d, g/ whereas for the Dutch sentences the corresponding initial consonants are the phonologically voiceless
/p, t, k/. However, all of these initial stop consonants are in fact phonetically voiceless and exhibit short-lag
voice onset times (Collins and Mees, 2004), meaning that the English /b, d, g/ are phonetically similar to the
Dutch /p, t, k/.
3. The four studies: research framework and methodology
66
3.5.4. Method: procedures
The NSD participants were recorded in a sound-proof chamber in the
Amsterdam Center for Language and Communication at University of
Amsterdam using a Sennheiser microphone and an Edirol UA-25 sound card
with a sampling rate of 44.1 kHz and 32-bit quantization. Before the task began,
participants were given as many practice sentences to read aloud as necessary
in order to ensure that they understood the task and produced the intended
vowels correctly. When participants were ready, recording began. A total of
180 sentences were recorded for each NSD participant, i.e., each of the 90
Dutch sentence prompts was presented twice, but in a random order so that
each sentence was never followed by the same sentence. Participants were
instructed by a native NSD speaker to read the sentences aloud as close to their
normal speech style and speech rate as possible. They were also instructed to
take pauses in between reading each sentence out as well as being given breaks
after every 15 sentences. If participants made a mistake (e.g., showed hesitation
or misread any of the sentence) they were asked to reread the whole sentence
stimulus. The task took each NSD participant approximately 10 minutes to
complete.
The SSBE participants were recorded in a sound-proof room in the
Division of Psychology and Language Sciences at University College London
and the SE participants were recorded in a sound-attenuated booth in the
Department of Computer Science at the University of Sheffield. Both SSBE and
SE participants were recorded using a Sennheiser MD425 Super Cardioid
Dynamic microphone fed into a Marantz PMD670 Solid State Recorder at a
sampling rate of 44.1 kHz and 32-bit quantization. Before the task began,
participants were given a training exercise in which they were asked to read
the list of 16 English word prompts with other example words and pay
attention to the vowel sounds and not the spellings. Then they were asked first
to read aloud to the experimenter the 16 English word prompts and second to
say the vowel sound in each word prompt, but not the word itself, until
satisfied that the vowel sound in each word was recognised. After this,

3. The four studies: research framework and methodology
67
participants were given a practice round of reading aloud some sentence
prompt couplets. They were asked to use the same vowel sounds in the CVC
syllables as those in the words in the preceding sentence which were based on
the 16 real English words in the list from the training round (the lexical set
labels). Participants were given as many practice sentences to read aloud as
necessary in order to ensure that they understood the task and produced the
intended vowel sounds in the CVC syllables. Once participants were ready,
recording could begin. A total of 192 sentence couplets were recorded for each
English-speaking participant, i.e., each of the 96 English sentence stimuli was
presented twice, but in a random order so that each sentence was never
repeated twice in a row. Participants were instructed to read the sentences
aloud as close to their normal speech style and speech rate as possible.
Furthermore, participants were asked to pause briefly between each sentence,
including each sentence in each sentence couplet, and were given breaks after
every 15 sentence couplets. If participants made an error (e.g., hesitation or
misreading) they were asked to reread the whole sentence couplet. The
training and practice rounds took approximately 10 minutes and the task itself
took approximately 15 minutes to complete.
3.5.5. Method: acoustic analysis
The procedure for the acoustic analysis is largely based on those reported in
Escudero et al. (2009), Chládková et al. (2011) and Van Leussen et al. (2011).
Altogether, there were 31,536 analysable vowel tokens. For the NSD
participants, there were 10,800 analysable vowel tokens (20 speakers X 15
vowels X 6 CVC contexts X 3 occurrences of each CVC per sentence X 2
sentence repetitions), for the SSBE participants, there were 9,792 vowel tokens
(17 speakers X 16 vowels X 6 CVC contexts X 3 occurrences of each CVC per
sentence X 2 sentence repetitions) and for the SE participants, there were
10,944 analysable vowel tokens (19 speakers X 16 vowels X 6 CVC contexts X 3
occurrences of each CVC per sentence X 2 sentence repetitions). The start and
end points of the vowel tokens in the CVC syllables were manually located in
3. The four studies: research framework and methodology
68
the digitised waveforms for three speakers per participant group and labelled
in the computer program Praat (Boersma and Weenink, 2011). The start and
end points for each vowel token were defined as
‘the zero crossings associated with the first and the last period of the
waveform that were judged to have considerable amplitude and a
shape resembling that of the central periods of the vowel’ (Chládková
et al., 2011: 419).
To label and locate the start and end points of the remaining participants’
vowel tokens, a partially automated procedure was utilised provided by Rob
Van Son (University of Amsterdam). This procedure scans the manually
labelled vowel tokens for the three speakers per participant group and then
applies the labels and start and end points to the other speakers’ recordings
from the same participant group. The start and end points for every vowel
token were then adjusted manually in the digitised waveform to match the
criteria above. Any vowel tokens that the procedure failed to assign the correct
vowel label to were relabelled appropriately. The segmented vowel tokens
were then analysed for the five acoustic properties of vowel duration, f0, F1, F2
and F3 also in the program Praat.
Vowel duration was measured as the time between the start and end
points of each vowel token, as had been located in the digitised waveform.
f0 was obtained by the cross-correlation method following a procedure
reported in Escudero et al. (2009) and Van Leussen et al. (2011). For male
speakers, the pitch range was set to 60-400 Hz and for female speakers it was
set to 120-400 Hz. f0 was measured in steps of 1 ms in the central 40% portion
of the vowel token, thus excluding the first and last 30% portions. The median
f0 measurement from the 40% portion was taken to represent f0 for the whole
vowel token. This provides a more robust measure for f0 than a simple
midpoint measurement or the mean of several measurements from several
time points by avoiding any possible influence of adjacent consonants on the f0
contour.

3. The four studies: research framework and methodology
69
Formant estimates (F1, F2, F3) were obtained for three time points
throughout each vowel token’s duration, namely 25%, 50% (midpoint) and
75%. At each of the three time points, F1, F2 and F3 were measured in single
window by the Burg algorithm built into Praat. Since there were a large
number of tokens per vowel category per speaker (36 tokens of each vowel per
speaker = 3 occurrences per sentence X 6 CVC contexts X 2 repetitions), it was
possible to minimise within-speaker formant estimation errors by using
Escudero et al.’s (2009) ‘optimal formant ceiling’ method. By finding a formant
ceiling that is optimised per vowel category per speaker, rather than applying a
single arbitrary ceiling for either male or female speakers, the chance of
unlikely formant values is reduced. The method works by determining the
first five formants 201 times by setting the ceiling in 10 Hz steps between 4,500
and 6,500 Hz for female speakers and between 4,000 and 6,000 Hz for male
speakers. For each vowel category per speaker, the ceiling that yields the
lowest within-speaker variation in F1 and F2 between the 36 tokens is chosen as
the optimal ceiling for that vowel for that speaker. As formant estimates were
made at three time points throughout the duration, each vowel category per
speaker had three separate formant ceilings computed for each of the three
time points (at 25%, midpoint and 75% duration).
3.6. Study II: Perception of native vowel quality
3.6.1. Introduction to Study II
The question that this study addresses is repeated:
II. How do SSBE and SE listeners differ in their perceptual identification
of English vowel quality?
This question centres on vowel quality. As was discussed in 2.3, the most
important acoustic characteristics of vowels that define its quality are spectral
properties, which roughly correspond to vowel height and vowel frontness,
respectively. A further acoustic characteristic which is important for some
vowels is F3. It is expected that some English vowels will differ in their

3. The four studies: research framework and methodology
70
realisation between SSBE and SE speakers and that differences may be
observed in the use of spectral properties to identify English vowels by
listeners from different accent backgrounds (cf., Evans and Iverson, 2004).
Study II is an experiment that sought to determine whether the
acoustic correlates of vowel quality (spectral properties of vowels, mainly F1
and F2 but also F3) for the English monophthongs are the same or different
across SSBE and SE listeners. The monophthongal vowel categories that SSBE
and SE share are FLEECE, KIT, DRESS, NURSE, TRAP, PALM, LOT, THOUGHT, FOOT
and GOOSE, and SSBE has the additional vowel category for the STRUT vowel.
3.6.2. Method: participants
All 20 SE participants and 16 of the 17 SSBE took part in this study because
SS12 was unable to attend the experimental session.
3.6.3. Method: stimuli
The stimuli consisted of synthetic vowel tokens that cover the possible F1-F2
acoustic vowel space and were the same as those reported in Ter Schure et al.
(2011). F1 ranged from 260 Hz to 1200 Hz and F2 from 800 Hz to 3000 Hz. F1
and F2 were sampled from the lowest F1 or F2 value to the highest F1 or F2
value in Mel steps. Mel steps were used rather than equal Hz steps to better
approximate equal auditory/perceptual steps rather than equal acoustic steps.
This produced 194 synthetic vowel tokens, which then had three possible F3
values added, either 2,900 Hz, 3,277 Hz or 3,700 Hz, yielding a total of 582
synthetic vowel tokens (194 X 3). For those tokens with an F2 that would be
higher than F3, the F3 value was increased to 200 Hz above the F2 value. The
tokens were modelled on a female voice, with a rise-fall f0 contour ranging
from 220 Hz to 270 Hz to 180 Hz. All tokens had a duration of up to 148.5 ms
(see also below) and created with the Klatt synthesiser in Praat.
3.6.4. Method: procedure
Before the task began, listeners were trained on 11 English orthographic vowel
labels for monophthongs using a procedure similar to that in Study I. The 11
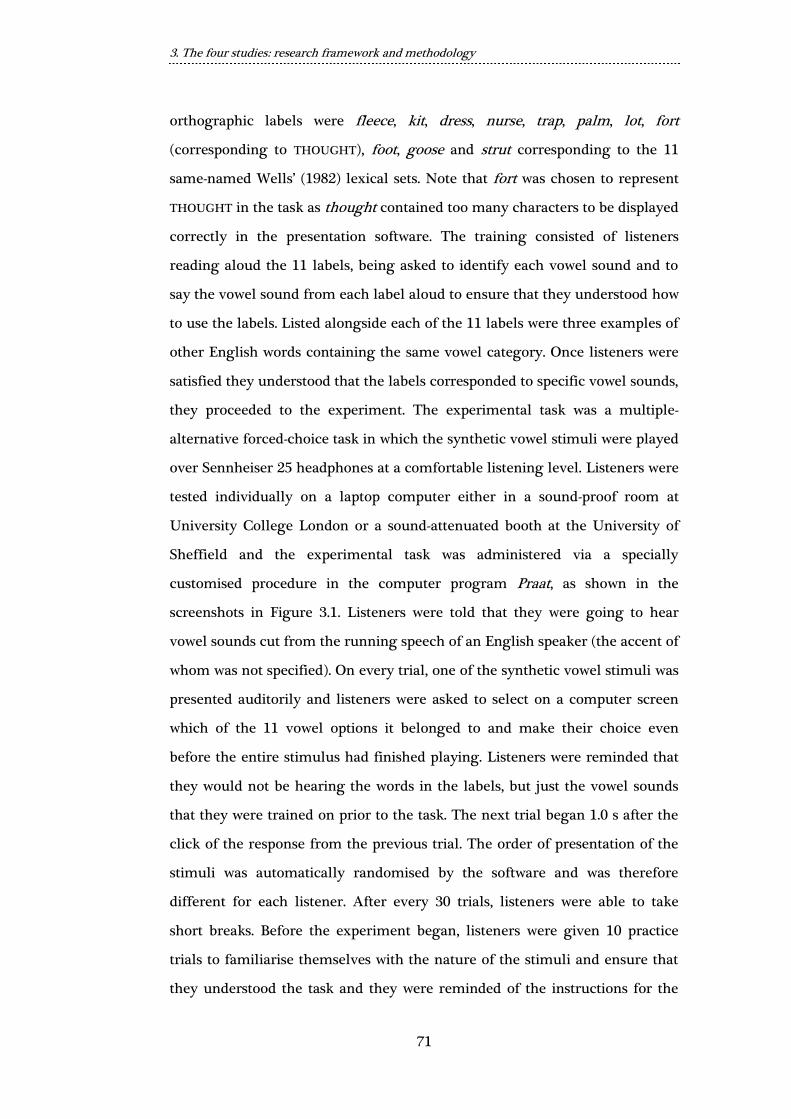
3. The four studies: research framework and methodology
71
orthographic labels were fleece, kit, dress, nurse, trap, palm, lot, fort
(corresponding to THOUGHT), foot, goose and strut corresponding to the 11
same-named Wells’ (1982) lexical sets. Note that fort was chosen to represent
THOUGHT in the task as thought contained too many characters to be displayed
correctly in the presentation software. The training consisted of listeners
reading aloud the 11 labels, being asked to identify each vowel sound and to
say the vowel sound from each label aloud to ensure that they understood how
to use the labels. Listed alongside each of the 11 labels were three examples of
other English words containing the same vowel category. Once listeners were
satisfied they understood that the labels corresponded to specific vowel sounds,
they proceeded to the experiment. The experimental task was a multiple-
alternative forced-choice task in which the synthetic vowel stimuli were played
over Sennheiser 25 headphones at a comfortable listening level. Listeners were
tested individually on a laptop computer either in a sound-proof room at
University College London or a sound-attenuated booth at the University of
Sheffield and the experimental task was administered via a specially
customised procedure in the computer program Praat, as shown in the
screenshots in Figure 3.1. Listeners were told that they were going to hear
vowel sounds cut from the running speech of an English speaker (the accent of
whom was not specified). On every trial, one of the synthetic vowel stimuli was
presented auditorily and listeners were asked to select on a computer screen
which of the 11 vowel options it belonged to and make their choice even
before the entire stimulus had finished playing. Listeners were reminded that
they would not be hearing the words in the labels, but just the vowel sounds
that they were trained on prior to the task. The next trial began 1.0 s after the
click of the response from the previous trial. The order of presentation of the
stimuli was automatically randomised by the software and was therefore
different for each listener. After every 30 trials, listeners were able to take
short breaks. Before the experiment began, listeners were given 10 practice
trials to familiarise themselves with the nature of the stimuli and ensure that
they understood the task and they were reminded of the instructions for the
3. The four studies: research framework and methodology
72
task onscreen, as shown in Figure 3.1. The task took approximately 20-25
minutes to complete.
Figure 3.1. Screenshots from the experimental task in Study II
Screen 1 Screen 2
Screen 3 Screen 4
Screens 5-14 Screen 15
Screens 16 Screen 17

3. The four studies: research framework and methodology
73
Screens 18 Screen 19 onwards
3.7. Study III: Non-native vowel discrimination
3.7.1. Introduction to Study III
Predictions on the perceptual discrimination of non-native sound contrasts is
one of the key claims of PAM. Study III addresses the following question:
III. How accurately do SSBE and SE listeners perceptually discriminate five
NSD vowel contrasts?
The particular NSD vowel contrasts in this study were targeted because a
previous study found that they were difficult for native English L2 learners of
Dutch (of various English accent backgrounds) to correctly identify, leading to
the members of each contrast being perceptually confused with one another
(Williams, 2010). The five NSD vowel contrasts are /i-ɪ/, /ɑ-ɔ/, /u-y/, /ø-o/ and
/ʌu-œy/.
3.7.2. Methods: participants
All 20 SE participants and all 17 SE participants took part in Study III. 10 of the
NSD participants were randomly selected for the creation of the auditory
stimuli (five male, five female).
3.7.3. Methods: stimuli
The vowel stimuli were excised from the sentences recorded by the 10
randomly selected NSD participants in Study I. The stimuli consisted of 20
physically different instances of each of the 10 NSD vowel categories /i, ɪ, ɑ, ɔ,
u, y, ø, o, ʌu, œy/. Specifically, each vowel token was excised from the
3. The four studies: research framework and methodology
74
underlined fVf monosyllable from the sentence FVf. In fVf en fVfǝ zit de V.
Note that each stimulus was an isolated vowel sound and the fricative either
side of it was not included. As each sentence was repeated twice, there were two
vowel tokens of each of the 10 NSD vowels for each of the 10 speakers,
yielding a total of 200 NSD vowel stimuli. The 200 naturally produced vowel
stimuli were normalised for peak amplitude.
3.7.4. Methods: procedure
This experiment followed an AXB paradigm. That is, on each trial, participants
were presented with a triad of vowel stimuli in a row (i.e., AXB) and were asked
to select which stimulus, either the first (A) or the third (B), was most similar
to the second stimulus (X). Participants were tested individually on a laptop
computer either in a sound-proof room at University College London or in a
sound-attenuated booth at the University of Sheffield. The options A or B were
presented on the computer screen in the computer program Praat as ‘Sound 1’
or ‘Sound 3’, respectively, as in Figure 3.2 and the auditory stimuli were played
over Sennheiser 25 headphones at a comfortable listening level. In each triad
of vowel stimuli, two stimuli were from the same vowel category (but two
physically different instances of it) and the other stimulus was from the
contrasting vowel category. The vowel stimuli in each triad were excised from
sentences said by the same speaker. There were four possible presentation
orderings of the vowel triads: AAB, BAA, BBA and ABB and each of these four
orderings occurred once for each NSD speaker, yielding 40 vowel triads for
each of the five NSD contrasts /i-ɪ/, /ɑ-ɔ/, /u-y/, /ø-o/ and /ʌu-œy/. In total there
were 200 experimental trials (40 triads X five vowel contrasts). The
interstimulus interval – the time between the presentation of each vowel
stimulus in each triad – was set at 1.0 s. There was also 1.0 s between the
listener’s response and the presentation of the next triad of stimuli on the next
trial. The order in which the triads were presented was randomised
automatically by the program and was different for each participant.
Participants were given breaks after every 25 trials. Before the task began,

3. The four studies: research framework and methodology
75
participants completed a practice round of 10 trials, featuring two trials for
each of the five contrasts, to familiarise them with the nature of the task and
the stimuli and make sure they understood what to do (see Figure 3.2). The
whole experiment lasted approximately 10-15 minutes.
Figure 3.2. Screenshots from the experimental task in Study III
Screen 1 Screens 2-11
Screen 12 Screen 13 onwards
3.8. Study IV: Cross-language vowel perception
3.8.1. Introduction to Study IV
This study addresses the perceptual assimilation patterns of the 15 NSD vowels
to native English vowel categories by SSBE and SE participants by testing how
these listeners classify the NSD vowels in terms of the perceptually most
similar native English vowel categories.
3.8.2. Methods: participants
All 17 SSBE and all 20 SE participants took part. All 20 NSD participants were
involved in the creation of the auditory stimuli.
3. The four studies: research framework and methodology
76
3.8.3. Methods: stimuli
The stimuli consisted of 300 naturally produced NSD vowel tokens cut from
the underlined fVf monosyllables in the sentence FVf. In fVf en fVfǝ zit de V.
Like the experiment reported in Study III, the flanking consonants were not
included in the vowel stimuli. As there were two repetitions of the NSD
sentences per NSD speaker, only the vowel token from one of the sentences
was used and this was picked at random. There were thus 20 instances of each
of the 15 NSD vowel categories, each said by a different speaker (10 male, 10
female), yielding the 300 NSD vowel stimuli (20 speakers X 15 NSD vowel
categories).
3.8.4. Methods: procedure
This experimental task made use of an adapted version of the customised
procedure for the experiment in Study II run in Praat and as a result was very
similar in appearance. Before the task began, participants were trained on the
16 English orthographic vowel labels fleece, kit, dress, nurse, trap, palm, lot,
fort, foot, goose, strut, face, price, choice, goat and mouth in the same manner
as in Study I and Study II. Participants were instructed to make use of only one
label and be consistent with their labelling choices if they thought that
multiple labels corresponded to the same English vowel sound. Once
participants were satisfied they understood the labels and how to use them,
they proceeded to the experiment. The experimental task was a multiple-
alternative forced-choice task in which the naturally produced NSD vowel
stimuli were played over Sennheiser 25 headphones at a comfortable listening
level. Participants were tested individually on a laptop computer either in a
sound-proof room at University College London or in a sound-attenuated
booth at the University of Sheffield. Participants were not told that they would
be listening to foreign speech sounds; they were told that they were going to
hear vowel sounds cut from running speech of several English speakers (e.g.,
Screen 15 in Figure 3.3). No further details of the speakers were given. On
every trial, one of the 300 NSD vowel stimuli was presented and participants

3. The four studies: research framework and methodology
77
were asked to select on a computer screen which of the 16 vowel options it
belonged to. As in Study II, participants were reminded that they would not be
hearing the words in the labels, but just the vowel sounds that they were
trained on prior to the task. The following trial began 1.0 s after the click of the
response from the previous trial. The order of the stimuli was randomised by
the software and therefore was different for every participant. After every 30
trials, participants were able to take short breaks. Before the task began, full
instructions were presented onscreen and participants were given 15 practice
trials to familiarise themselves with the nature of the stimuli and make sure
they understood task. The task took approximately 15-20 minutes to complete.
Figure 3.3. Screenshots from the experimental task in Study IV
Screen 1 Screen 2
Screen 3 Screen 4

3. The four studies: research framework and methodology
78
Screens 5-14 Screen 15
Screens 16 Screen 17
Screens 18 Screen 19 onwards
3.9. Summary
This chapter has identified the four core questions of this project and how each
of them is addressed in four studies in order to examine the role of listeners’
native accent in the cross-language acoustic and perceptual similarity of
vowels. It was deemed necessary to collect new acoustic information of the
vowels of NSD, SSBE and SE, especially in the context of making acoustic
comparisons required in Study I. This was to ensure all the data have been
collected along similar lines. Study I adopts a similar approach to studies by
Strange and colleagues that make use of acoustic similarity as a means of
objectively measuring phonetic similarity in vowels (Strange, 2007). Study II
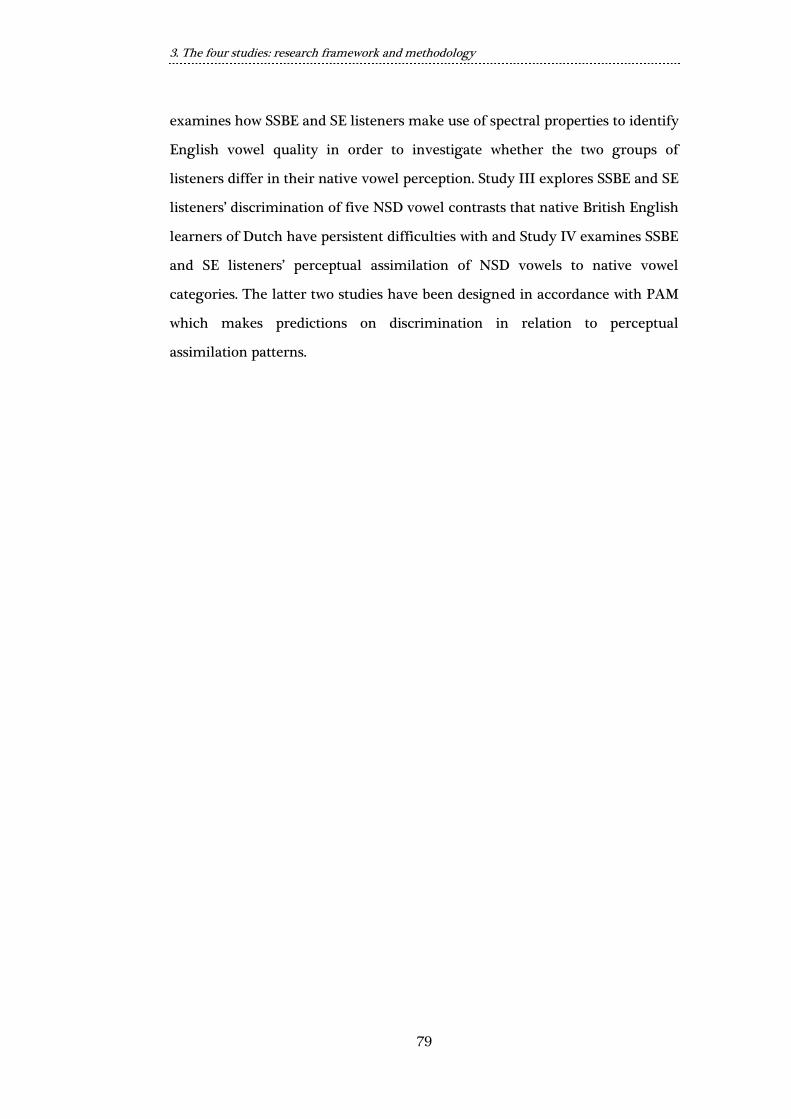
3. The four studies: research framework and methodology
79
examines how SSBE and SE listeners make use of spectral properties to identify
English vowel quality in order to investigate whether the two groups of
listeners differ in their native vowel perception. Study III explores SSBE and SE
listeners’ discrimination of five NSD vowel contrasts that native British English
learners of Dutch have persistent difficulties with and Study IV examines SSBE
and SE listeners’ perceptual assimilation of NSD vowels to native vowel
categories. The latter two studies have been designed in accordance with PAM
which makes predictions on discrimination in relation to perceptual
assimilation patterns.

4. Study I: Acoustic similarity of NSD vowels to SSBE and SE vowels
80
4.
Study I: Acoustic similarity of NSD
vowels to SSBE and SE vowels
4.1. Introduction to Chapter 4
The main purpose of this chapter is to address the research question behind
Study I, namely how the vowels of NSD compare acoustically with the vowels
of SSBE and the vowels of SE. Before Study I can be tackled in earnest, three
acoustic descriptions of the vowels of NSD, SSBE and SE, respectively, are
required in order to provide an overview of the newly collected acoustic data
which have previously not been reported.
Before Study I is addressed, sections 4.2, 4.3 and 4.4 serve as acoustic
descriptions or overviews of the vowels in the vowel inventories of NSD, SSBE
and SE, respectively, and therefore follow a similar format to previous acoustic
descriptions of vowel inventories. Namely, monophthongs are described in
terms of vowel duration, f0 and formant (F1, F2, F3) frequencies measured at
vowel midpoint (e.g., Adank et al., 2004; Escudero et al., 2009; Chládková et al.,
2011) and diphthongs are described on the basis of vowel duration, f0 and
formant (F1, F2, F3) measurements made at two time points (e.g., Adank et al.,
2004; Adank et al., 2007). Likewise, as the purpose of these sections is
descriptive, the acoustic measurements were obtained from vowel tokens
produced in just one phonetic context. The acoustic descriptions of the vowels
of SSBE and SE are compared with one another in section 4.5 and this also
includes a brief examination of the STRUT-FOOT split in SSBE and lack of it in
SE. The research question behind Study I is addressed in section 4.6 by
presenting an analysis of how the vowels of SSBE and SE compare acoustically
(i.e., both temporally and spectrally) to the vowels of NSD by means of linear
discriminant analyses (LDAs). The chapter is then summarised in section 4.7.

4. Study I: Acoustic similarity of NSD vowels to SSBE and SE vowels
81
4.2. An acoustic description of NSD vowels
4.2.1. NSD vowel data
The NSD vowel tokens under analysis in the present acoustic description were
produced in monosyllabic fVf pseudowords underlined in the Dutch carrier
sentence FVf. In fVf en fVfǝ zit de V (“in fVf and fVfǝ we have V”), where V is
one of the 15 NSD vowels /i, y, ɪ, ʏ, ø, e, ɛ, a, ɑ, ɔ, o, u, ʌu, ɛi, œy/. Vowel
tokens from the isolated fVf monosyllabic pseudoword and from the disyllabic
fVfǝ pseudoword are not considered in the present description. This is to
minimise the potential phonetic context effects of consonantal context,
syllable number and sentence position on the acoustic properties of the vowels
in the subsequent acoustic comparison with SSBE and SE vowels (section 4.6).
Each of the 20 NSD speakers (10 male, 10 female) was recorded saying each
sentence twice, meaning that there are two analysable tokens of each NSD
vowel per speaker. In total, acoustic measurements for vowel duration, f0, F1,
F2 and F3 were made for 600 NSD vowel tokens (= 2 repetitions x 15 vowels x
20 speakers).
First, the acoustic properties of the nine NSD monophthongs /i, y, ɪ, ʏ,
ɛ, a, ɑ, ɔ, u/ are reported on in subsection 4.2.2 and, second, the six NSD
diphthongs /ø, e, o, ʌu, ɛi, œy/ are examined in subsection 4.2.3.
4.2.2. The nine NSD monophthongs
Table 4.1 below displays the geometric means of the values for duration, f0, F1,
F2 and F3 of the nine NSD monophthongs. The formant measurements (F1, F2,
F3) were made at the midpoint of each vowel token using the formant
estimation procedure outlined in Chapter 3. As can be seen from the data, the
nine NSD monophthongs /i, y, ɪ, ʏ, ɛ, a, ɑ, ɔ, u/ can be separated fairly well in
terms of their F1 and F2 values and /a/ appears to have a considerably longer
duration than the other vowels.

4. Study I: Acoustic similarity of NSD vowels to SSBE and SE vowels
82
Table 4.1. Geometric means for duration, f0, F1, F2 and F3 of the nine NSD monophthongs
Measure Gender NSD monophthong
i y ɪ ʏ ɛ a ɑ ɔ u
Duration
(ms)
M 94 90 88 84 95 174 97 85 87
F 96 94 92 91 104 173 101 93 91
f0 (Hz) M 157 155 146 153 137 135 141 141 156
F 243 241 239 239 218 213 226 226 240
F1 (Hz) M 316 324 411 421 527 736 619 456 343
F 349 373 473 481 653 968 796 463 388
F2 (Hz) M 2115 1686 1804 1462 1564 1314 1117 819 874
F 2612 2004 2203 1785 1894 1553 1258 940 942
F3 (Hz) M 2838 2227 2558 2214 2311 2332 2312 2373 2185
F 3223 2665 2876 2658 2706 2604 2682 2703 2599
Figure 4.1 plots the F1 and F2 means of the nine NSD monophthongs for both
males and females. As expected, the acoustic vowel spaces of male and female
speakers differ, with female speakers’ vowels exhibiting higher F1 and F2
values and consequently their vowel space lies toward the lower left-hand
corner of the figure. Despite this difference, the relative spacings of the vowels
on the F1 and F2 dimensions appear to be similar across the genders.
In order to explore whether the nine NSD monophthongs can be
reliably separated in terms of their acoustic properties, a repeated-measures
analysis of variance (ANOVA) was run on logarithmic values of duration, f0, F1,
F2 and F3 measurements. For each vowel per speaker, there was one
measurement per acoustic variable, which was a mean of each speaker’s two
tokens. In the ANOVA, the within-subjects factor was vowel category (nine
levels for the NSD monophthongs) and the between-subjects factor was gender
(two levels for two genders). Note that in the following ANOVA and all
ANOVAs reported in this chapter and subsequent chapters, if Mauchly’s Test
of Sphericity was violated, Huynh-Feldt corrections are applied to reduce the
number of the degrees of freedom by a factor ε.
4. Study I: Acoustic similarity of NSD vowels to SSBE and SE vowels
83
Figure 4.1. Mean F1 and F2 values of the nine NSD monophthongs
Unsurprisingly, there were main effects of vowel category on all five measures,
namely for duration (F[8,160] = 129.77; p < 0.001), for f0 (F[8ε,160ε, ε = 0.61] =
4.89; p = 0.001), for F1 (F[8ε,160ε, ε = 0.52] = 4.52; p < 0.001), for F2 (F[8ε,160ε, ε
= 0.54] = 4.90; p < 0.001) and for F3 (F[8ε,160ε, ε = 0.79] = 10.28; p < 0.001),
suggesting that the nine NSD monophthongs can indeed be separated well on
these five acoustic measures. As expected, there were main effects of gender
on f0 (F[1,20] = 87.76; p < 0.001), on F1 (F[1,20] = 89.64; p < 0.001), on F2 (F[1,20]
= 111.81; p < 0.001) and on F3 (F[1,20] = 42.44; p < 0.001). These gender effects
on F1 and F2 are visible in Figure 4.1 above in which the average male and
female F1 and F2 values are clearly distinct. However, there was no main effect
of gender on vowel duration (p > 0.05), suggesting that male and female NSD
speakers do not differ on this measure. Finally, the lack of vowel category X
gender interactions on any of the acoustic measures indicates that male and
female NSD speakers do not vary significantly in their relative productions of
the nine NSD monophthongs.
Red = NSD males
Blue = NSD females
4. Study I: Acoustic similarity of NSD vowels to SSBE and SE vowels
84
4.2.3. The six NSD diphthongs
In order to capture the dynamic spectral nature of six NSD diphthongs /ø, e, o,
ʌu, ɛi, œy/, the following analysis not only makes use of vowel duration and f0,
but also takes into account formant (F1, F2, F3) measurements at two time
points during the vowel, namely toward the beginning (at 25% duration) and
toward the end (at 75% duration), and a measurement of the direction and
degree of formant movement (cf., Adank et al., 2004; Adank et al., 2007).
Formant measurements made at two different time points throughout a
vowel’s duration and a measurement of formant movement are necessary to
describe diphthongs due to their spectrally dynamic nature. The degree of
formant movement is defined here as the ratio between the logarithmic value
of F1, F2 or F3 frequency at 75% and that at 25% of a vowel’s duration; a value
greater than 1 indicates a rising formant and a value less than 1 indicates a
falling formant (Chládková and Hamann, 2011). Formant movement can also
be measured in terms of the absolute change in frequency from time 75% to
time 25%, as shown in Table 4.2 below, and used in the acoustic description of
NSD diphthongs in Adank et al. (2004). However, this method makes it more
difficult to directly compare male speakers and female speakers as female
speakers’ acoustic vowels spaces are larger (as per Figure 4.1) which results in
much larger differences. A proportionate measure, using a ratio, is therefore
preferred in the following analysis.

4. Study I: Acoustic similarity of NSD vowels to SSBE and SE vowels
85
Table 4.2. Geometric means for duration, f0, F1, F2 and F3 values at two time points and absolute F1, F2, F3
change of the six NSD diphthongs
NSD
diphthong Gender
Measure
Duration
(ms) f0 (Hz)
F1 (Hz) F2 (Hz) F3 (Hz)
25% 75% Δ 25% 75% Δ 25% 75% Δ
e M 162 140 484 388 89 1718 1973 228 2434 2555 124
F 163 222 512 441 47 2146 2401 197 2818 3018 193
ø M 156 139 500 419 69 1446 1571 91 2373 2290 91
F 154 222 516 446 56 1723 1899 91 2556 2697 125
o M 160 136 519 440 63 1023 923 83 2269 2379 106
F 165 218 585 471 86 1149 1035 90 2202 2510 274
ɛi M 166 134 629 481 125 1497 1800 280 2378 2430 59
F 173 215 802 545 224 1842 2215 314 2702 2967 268
œy M 168 134 610 496 94 1387 1578 155 2202 2300 96
F 172 209 779 546 207 1708 1897 150 2608 2649 45
ʌu M 163 136 675 530 115 1224 1077 111 2185 2192 19
F 175 213 855 575 219 1448 1172 241 2511 2477 21
In order to explore whether the six NSD diphthongs can be separated on these
11 acoustic variables, a repeated-measures ANOVA was run on logarithmic
values for duration, f0, F1 at 25% and 75%, F2 at 25% and 75%, F3 at 25% and
75%, F1 movement, F2 movement and F3 movement. There were main effects
of vowel category on 10 of the 11 measures, namely on duration (F[5,100] =
3.73; p = 0.004), on f0 (F[5ε,100ε, ε = 0.66] = 3.76; p = 0.012), on F1 at 25%
(F[5ε,100ε, ε = 0.71] = 157.51; p < 0.001) and at 75% (F[5,100] = 68.12; p < 0.001),
on F2 at 25% (F[5ε,100ε, ε = 0.78] = 163.30; p < 0.001) and at 75% (F[5ε,100ε, ε =
0.50] = 442.15; p < 0.001), on F3 at 25% (F[5ε,100ε, ε = 0.48] = 4.42; p = 0.013) and
at 75% (F[5ε,100ε, ε = 0.51] = 6.42; p = 0.002), on F1 movement (F[5ε,100ε, ε =
0.68] = 10.24; p < 0.001) and on F2 movement (F[5ε,100ε, ε = 0.96] = 70.71; p <
0.001). There was no effect of vowel category on F3 movement (p > 0.05). As
expected, main effects of gender were revealed for f0 (F[1,20] = 113.83; p < 0.001)
and for the formant measurements, namely for F1 at 25% (F[1,20] = 38.99; p <
0.001) and at 75% (F[1,20] = 11.69; p = 0.003), for F2 at 25% (F[1,20] = 138.67; p <
0.001) and at 75% (F[1,20] = 132.38; p < 0.001), and for F3 at 25% (F[1,20] = 13.12;
p = 0.002) and at 75% (F[1,20] = 17.01; p = 0.001). However, there were no
significant main effects of gender on vowel duration, F1 movement, F2
movement or F3 movement (p > 0.05). The lack of gender effects on these
latter four measures indicates that male and female NSD speakers do not

4. Study I: Acoustic similarity of NSD vowels to SSBE and SE vowels
86
reliably differ in their diphthong durations and that the degree and direction
of F1, F2 and F3 movement is similar across both genders.
Figure 4.2. Mean F1 and F2 trajectories for the six NSD diphthongs
NSD female speakers
NSD male speakers
The results of the ANOVA are clearly visible in Figure 4.2. The beginning (25%
duration) and end (75% duration) F1 and F2 locations are clearly distinct for
the six vowels. The effects of gender are also evident, reflecting the different
sized vowel spaces. Formant movement does vary depending on the vowel

4. Study I: Acoustic similarity of NSD vowels to SSBE and SE vowels
87
category, i.e., the six NSD diphthongs exhibit different degrees and directions
of formant movement.
4.3. An acoustic description of SSBE vowels
4.3.1. The SSBE vowel data
The SSBE vowels are FLEECE, KIT, DRESS, NURSE, TRAP, PALM, LOT, STRUT,
THOUGHT, FOOT, GOOSE, FACE, PRICE, CHOICE, GOAT and MOUTH. The vowel
tokens to be described were produced in the underlined monosyllabic fVf
pseudoword in the English carrier sentence FVf. In fVf and fVfǝ we have V,
where V is one of the 16 SSBE vowels. Each SSBE speaker (7 male, 10 female)
was recorded saying each sentence twice, meaning that there are two
analysable tokens of each SSBE vowel per speaker. In total, acoustic
measurements for vowel duration, f0, F1, F2 and F3 were made for 544 SSBE
vowel tokens (2 repetitions x 16 vowels x 17 speakers). In the ANOVAs in the
following sections, means of the two repetitions per speaker have been used.
The acoustic properties of the 11 SSBE monophthongs FLEECE, KIT, DRESS,
NURSE, TRAP, PALM, LOT, STRUT, THOUGHT, FOOT and GOOSE are covered first and
then the acoustic properties of the six diphthongs FACE, PRICE, CHOICE, GOAT
and MOUTH are described.
4.3.2. The 11 SSBE monophthongs
Table 4.3 below displays the geometric means of the values for duration, f0, F1,
F2 and F3 of the 11 SSBE monophthongs. The formant measurements (F1, F2,
F3) were made at the midpoint of each vowel token using the formant
estimation procedure outlined in Chapter 3.

4. Study I: Acoustic similarity of NSD vowels to SSBE and SE vowels
88
Table 4.3. Geometric means for duration, f0, F1, F2 and F3 of the 11 SSBE monophthongs
Table 4.3 indicates that the durations of the 11 monophthongs vary greatly,
with KIT, DRESS, STRUT, LOT and FOOT being relatively short vowels, FLEECE,
TRAP and GOOSE being fairly long vowels and PALM, NURSE and THOUGHT being
the longest vowels. It appears that f0 does not vary per vowel, being relatively
similar across all vowel categories. F1, F2 and F3, on the other hand, appear to
vary greatly. In order to test the effect of vowel category on duration, f0, F1, F2
and F3, a repeated-measures ANOVA was run on logarithmic values for these
variables taken from speaker means of the fVf vowel tokens. The within-
subjects factor was vowel category (11 levels for the 11 monophthongs) and
the between-subjects factor was gender (two levels). There were main effects of
vowel category on four of the five measures, namely on duration (F[10ε, 150ε, ε
= 0.46] = 106.63; p < 0.001), on F1 (F[10ε,150ε, ε = 0.50] = 252.09; p < 0.001), on F2
(F[10ε,150ε, ε = 0.69] = 352.31; p < 0.001) and on F3 (F[10ε, 150ε, ε = 0.46] = 14.41;
p < 0.001). However, there was no main effect of vowel category on f0 (p > 0.05),
indicating that f0 does not reliably vary depending on the monophthong. As
expected, there were main effects of gender on f0 (F[1,15] = 41.05; p < 0.001)
and on the formants, namely on F1 (F[1,15] = 30.08; p < 0.001), on F2 (F[1,15] =
145.87; p < 0.001) and on F3 (F[1,15] = 69.63; p < 0.001). The analysis did not
yield a main effect of gender on vowel duration (p > 0.05), suggesting that
there is no reliable difference between male and female SSBE speakers’
durations for the 11 monophthongs.
Measure Gender
SSBE monophthong
FL
EE
CE
KIT
DR
ES
S
TR
AP
PA
LM
ST
RU
T
NU
RS
E
LO
T
FO
OT
TH
OU
GH
T
GO
OS
E
Duration
(ms)
M 111 72 83 99 161 82 154 83 75 140 110
F 108 71 88 91 172 76 160 77 68 147 113
f0 (Hz) M 132 117 125 114 121 117 122 123 122 123 130
F 218 220 219 212 214 215 221 219 224 223 216
F1 (Hz) M 300 426 585 745 605 614 564 531 448 414 312
F 343 508 769 962 781 779 768 628 484 457 347
F2 (Hz) M 2279 1891 1633 1332 1030 1158 1386 958 1182 755 1571
F 2780 2136 1872 1595 1252 1408 1648 1166 1636 903 2207
F3 (Hz) M 2967 2562 2474 2436 2313 2195 2484 2260 2190 2289 2189
F 3246 2984 2887 2775 2753 2672 2884 2758 2692 2934 2728

4. Study I: Acoustic similarity of NSD vowels to SSBE and SE vowels
89
Figure 4.3 plots average F1 and F2 values for the 11 SSBE
monophthongs for both male and female speakers. As can be seen, the
monophthongs can be separated fairly well on their F1 and F2 values and, as
expected, male and female speakers exhibit different sized acoustic vowel
spaces.
Figure 4.3. Mean F1 and F2 values of the 11 SSBE monophthongs
4.3.3. The five SSBE diphthongs
As with the NSD diphthongs, the five SSBE diphthongs are characterised by
their dynamic spectral characteristics and the same 11 acoustic measures will
be used. In order to establish whether the vowels can be reliably separated on
these 11 measures, a repeated-measures ANOVA was conducted on
logarithmic values. The within-subjects factor was vowel category (five levels
for the five SSBE diphthongs) and the between-subjects factor was gender (two
levels). The analysis uncovered main effects of vowel category on 10 of the 11
measures, that is on duration (F[4,60] = 9.44; p < 0.001), on F1 at 25% (F[4,60] =
94.95; p < 0.001) and at 75% (F[4ε,60ε, ε = 0.78] = 59.10; p < 0.001), on F2 at 25%
Red = SSBE males
Blue = SSBE females
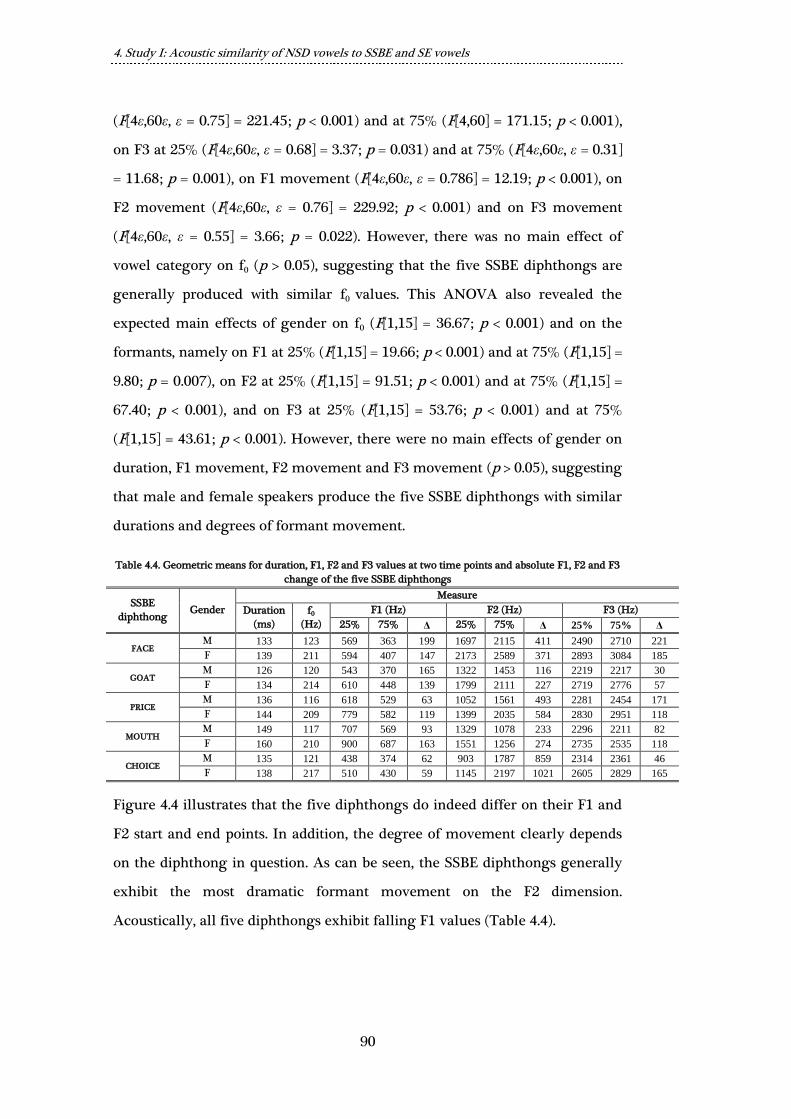
4. Study I: Acoustic similarity of NSD vowels to SSBE and SE vowels
90
(F[4ε,60ε, ε = 0.75] = 221.45; p < 0.001) and at 75% (F[4,60] = 171.15; p < 0.001),
on F3 at 25% (F[4ε,60ε, ε = 0.68] = 3.37; p = 0.031) and at 75% (F[4ε,60ε, ε = 0.31]
= 11.68; p = 0.001), on F1 movement (F[4ε,60ε, ε = 0.786] = 12.19; p < 0.001), on
F2 movement (F[4ε,60ε, ε = 0.76] = 229.92; p < 0.001) and on F3 movement
(F[4ε,60ε, ε = 0.55] = 3.66; p = 0.022). However, there was no main effect of
vowel category on f0 (p > 0.05), suggesting that the five SSBE diphthongs are
generally produced with similar f0 values. This ANOVA also revealed the
expected main effects of gender on f0 (F[1,15] = 36.67; p < 0.001) and on the
formants, namely on F1 at 25% (F[1,15] = 19.66; p < 0.001) and at 75% (F[1,15] =
9.80; p = 0.007), on F2 at 25% (F[1,15] = 91.51; p < 0.001) and at 75% (F[1,15] =
67.40; p < 0.001), and on F3 at 25% (F[1,15] = 53.76; p < 0.001) and at 75%
(F[1,15] = 43.61; p < 0.001). However, there were no main effects of gender on
duration, F1 movement, F2 movement and F3 movement (p > 0.05), suggesting
that male and female speakers produce the five SSBE diphthongs with similar
durations and degrees of formant movement.
Table 4.4. Geometric means for duration, F1, F2 and F3 values at two time points and absolute F1, F2 and F3
change of the five SSBE diphthongs
SSBE
diphthong Gender
Measure
Duration
(ms)
f0
(Hz)
F1 (Hz) F2 (Hz) F3 (Hz)
25% 75% Δ 25% 75% Δ 25% 75% Δ
FACE M 133 123 569 363 199 1697 2115 411 2490 2710 221
F 139 211 594 407 147 2173 2589 371 2893 3084 185
GOAT M 126 120 543 370 165 1322 1453 116 2219 2217 30
F 134 214 610 448 139 1799 2111 227 2719 2776 57
PRICE M 136 116 618 529 63 1052 1561 493 2281 2454 171
F 144 209 779 582 119 1399 2035 584 2830 2951 118
MOUTH M 149 117 707 569 93 1329 1078 233 2296 2211 82
F 160 210 900 687 163 1551 1256 274 2735 2535 118
CHOICE M 135 121 438 374 62 903 1787 859 2314 2361 46
F 138 217 510 430 59 1145 2197 1021 2605 2829 165
Figure 4.4 illustrates that the five diphthongs do indeed differ on their F1 and
F2 start and end points. In addition, the degree of movement clearly depends
on the diphthong in question. As can be seen, the SSBE diphthongs generally
exhibit the most dramatic formant movement on the F2 dimension.
Acoustically, all five diphthongs exhibit falling F1 values (Table 4.4).

4. Study I: Acoustic similarity of NSD vowels to SSBE and SE vowels
91
Figure 4.4. Average F1 and F2 trajectories for the five SSBE diphthongs
SSBE female speakers
SSBE male speakers

4. Study I: Acoustic similarity of NSD vowels to SSBE and SE vowels
92
4.4. An acoustic description of SE vowels
4.4.1. The SE vowel data
While SSBE has 16 separate vowel categories, SE has 15 vowel categories
because it lacks a separate STRUT category as it does not display the STRUT-
FOOT split. This is discussed and confirmed in the comparison of SSBE and SE
vowels in 4.5. The 15 SE vowel categories are FLEECE, KIT, DRESS, NURSE, TRAP,
PALM, LOT, THOUGHT, FOOT, GOOSE, FACE, PRICE, CHOICE, GOAT and MOUTH. Like
SSBE, the SE vowel categories can be divided into monophthongs and
diphthongs: the 10 SE monophthongs are FLEECE, KIT, DRESS, NURSE, TRAP, PALM,
LOT, THOUGHT, FOOT and GOOSE and the five diphthongs are FACE, PRICE,
CHOICE, GOAT and MOUTH.
The SE speakers performed exactly the same production task as the
SSBE speakers (see Chapter 3). The vowel tokens under analysis were produced
in the underlined monosyllabic fVf pseudoword in the English carrier sentence
FVf. In fVf and fVfǝ we have V, where V is one of the 15 SE vowels. Each SE
speaker (9 male, 10 female) was recorded saying each sentence twice, meaning
that there are two analysable tokens of each SE vowel per speaker. In total,
acoustic measurements for vowel duration, f0, F1, F2 and F3 were made for 570
SE vowel tokens (2 repetitions x 15 vowels x 19 speakers). In the ANOVAs in
the following sections, means of the two repetitions per speaker have been
used.
4.4.2. The 10 SE monophthongs
In order to test whether the 10 SE monophthongs can be separated on vowel
duration, f0, F1, F2 and F3, a repeated-measures ANOVA was run on
logarithmic values of these five measures with vowel category as a within-
subjects factor (10 levels for 10 monophthongs) and gender as a between
subjects factor (two levels). There were main effects of vowel category on
duration (F[9,153] = 129.92; p < 0.001), on f0 (F[9ε,153ε, ε = 0.56] = 4.68; p =
0.001), on F1 (F[9ε,153ε, ε = 0.45] = 166.47; p < 0.001), on F2 (F[9ε,153ε, ε = 0.48]
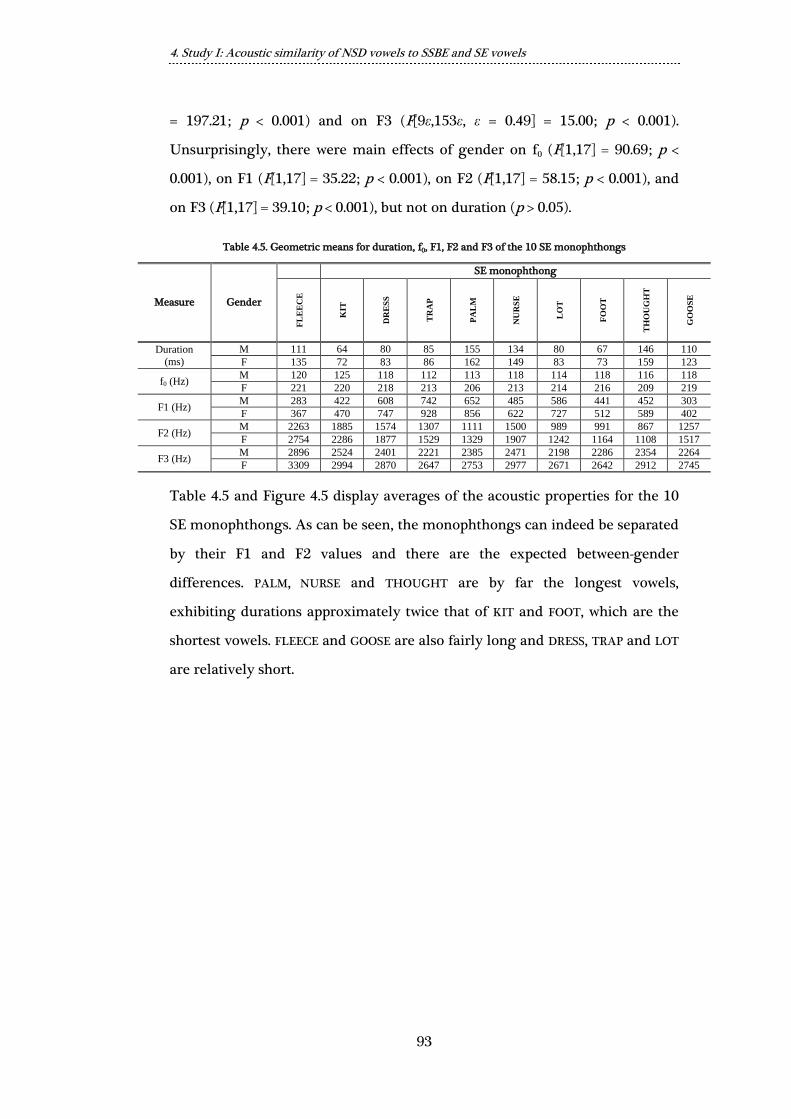
4. Study I: Acoustic similarity of NSD vowels to SSBE and SE vowels
93
= 197.21; p < 0.001) and on F3 (F[9ε,153ε, ε = 0.49] = 15.00; p < 0.001).
Unsurprisingly, there were main effects of gender on f0 (F[1,17] = 90.69; p <
0.001), on F1 (F[1,17] = 35.22; p < 0.001), on F2 (F[1,17] = 58.15; p < 0.001), and
on F3 (F[1,17] = 39.10; p < 0.001), but not on duration (p > 0.05).
Table 4.5. Geometric means for duration, f0, F1, F2 and F3 of the 10 SE monophthongs
Table 4.5 and Figure 4.5 display averages of the acoustic properties for the 10
SE monophthongs. As can be seen, the monophthongs can indeed be separated
by their F1 and F2 values and there are the expected between-gender
differences. PALM, NURSE and THOUGHT are by far the longest vowels,
exhibiting durations approximately twice that of KIT and FOOT, which are the
shortest vowels. FLEECE and GOOSE are also fairly long and DRESS, TRAP and LOT
are relatively short.
Measure Gender
SE monophthong
FL
EE
CE
KIT
DR
ES
S
TR
AP
PA
LM
NU
RS
E
LO
T
FO
OT
TH
OU
GH
T
GO
OS
E
Duration
(ms)
M 111 64 80 85 155 134 80 67 146 110
F 135 72 83 86 162 149 83 73 159 123
f0 (Hz) M 120 125 118 112 113 118 114 118 116 118
F 221 220 218 213 206 213 214 216 209 219
F1 (Hz) M 283 422 608 742 652 485 586 441 452 303
F 367 470 747 928 856 622 727 512 589 402
F2 (Hz) M 2263 1885 1574 1307 1111 1500 989 991 867 1257
F 2754 2286 1877 1529 1329 1907 1242 1164 1108 1517
F3 (Hz) M 2896 2524 2401 2221 2385 2471 2198 2286 2354 2264
F 3309 2994 2870 2647 2753 2977 2671 2642 2912 2745
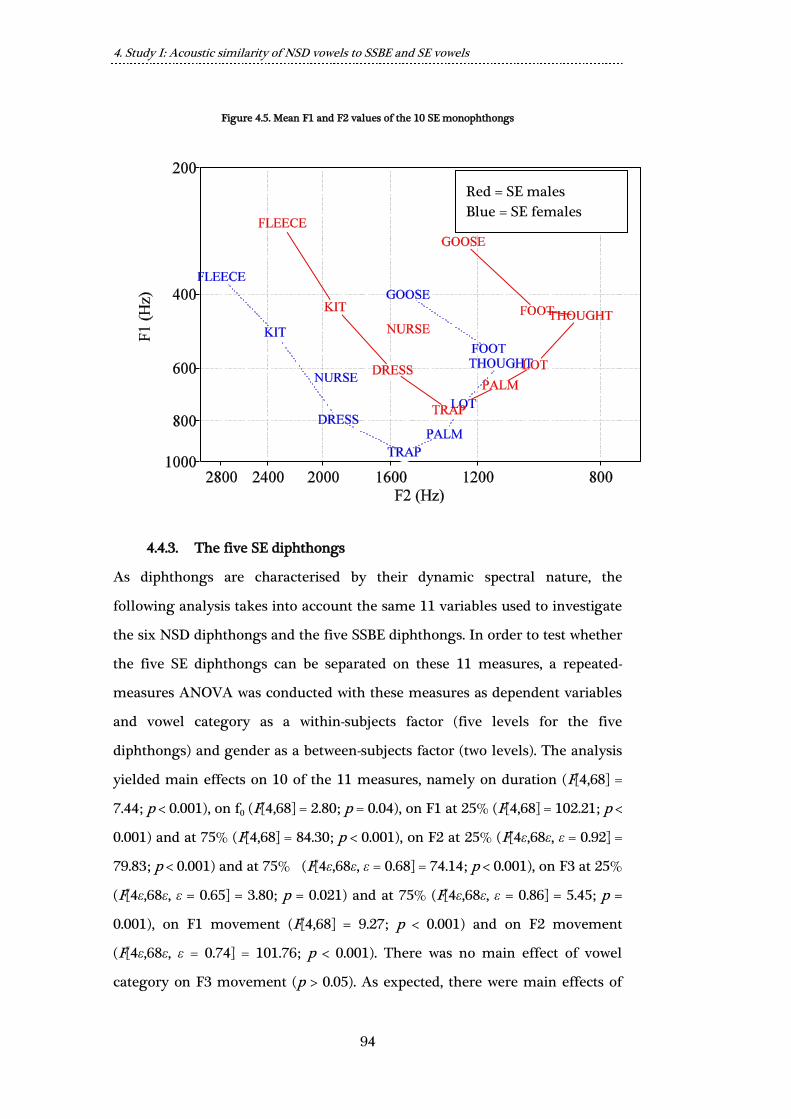
4. Study I: Acoustic similarity of NSD vowels to SSBE and SE vowels
94
Figure 4.5. Mean F1 and F2 values of the 10 SE monophthongs
4.4.3. The five SE diphthongs
As diphthongs are characterised by their dynamic spectral nature, the
following analysis takes into account the same 11 variables used to investigate
the six NSD diphthongs and the five SSBE diphthongs. In order to test whether
the five SE diphthongs can be separated on these 11 measures, a repeated-
measures ANOVA was conducted with these measures as dependent variables
and vowel category as a within-subjects factor (five levels for the five
diphthongs) and gender as a between-subjects factor (two levels). The analysis
yielded main effects on 10 of the 11 measures, namely on duration (F[4,68] =
7.44; p < 0.001), on f0 (F[4,68] = 2.80; p = 0.04), on F1 at 25% (F[4,68] = 102.21; p <
0.001) and at 75% (F[4,68] = 84.30; p < 0.001), on F2 at 25% (F[4ε,68ε, ε = 0.92] =
79.83; p < 0.001) and at 75% (F[4ε,68ε, ε = 0.68] = 74.14; p < 0.001), on F3 at 25%
(F[4ε,68ε, ε = 0.65] = 3.80; p = 0.021) and at 75% (F[4ε,68ε, ε = 0.86] = 5.45; p =
0.001), on F1 movement (F[4,68] = 9.27; p < 0.001) and on F2 movement
(F[4ε,68ε, ε = 0.74] = 101.76; p < 0.001). There was no main effect of vowel
category on F3 movement (p > 0.05). As expected, there were main effects of
Red = SE males
Blue = SE females
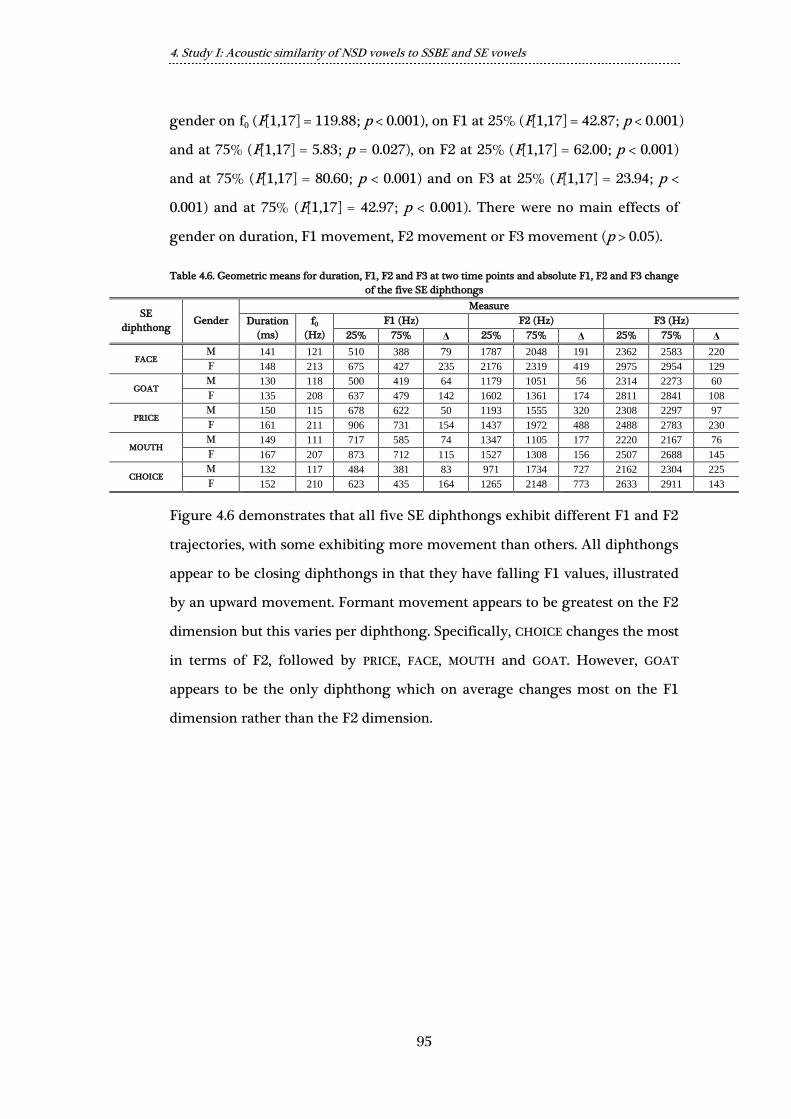
4. Study I: Acoustic similarity of NSD vowels to SSBE and SE vowels
95
gender on f0 (F[1,17] = 119.88; p < 0.001), on F1 at 25% (F[1,17] = 42.87; p < 0.001)
and at 75% (F[1,17] = 5.83; p = 0.027), on F2 at 25% (F[1,17] = 62.00; p < 0.001)
and at 75% (F[1,17] = 80.60; p < 0.001) and on F3 at 25% (F[1,17] = 23.94; p <
0.001) and at 75% (F[1,17] = 42.97; p < 0.001). There were no main effects of
gender on duration, F1 movement, F2 movement or F3 movement (p > 0.05).
Table 4.6. Geometric means for duration, F1, F2 and F3 at two time points and absolute F1, F2 and F3 change
of the five SE diphthongs
SE
diphthong Gender
Measure
Duration
(ms)
f0
(Hz)
F1 (Hz) F2 (Hz) F3 (Hz)
25% 75% Δ 25% 75% Δ 25% 75% Δ
FACE M 141 121 510 388 79 1787 2048 191 2362 2583 220
F 148 213 675 427 235 2176 2319 419 2975 2954 129
GOAT M 130 118 500 419 64 1179 1051 56 2314 2273 60
F 135 208 637 479 142 1602 1361 174 2811 2841 108
PRICE M 150 115 678 622 50 1193 1555 320 2308 2297 97
F 161 211 906 731 154 1437 1972 488 2488 2783 230
MOUTH M 149 111 717 585 74 1347 1105 177 2220 2167 76
F 167 207 873 712 115 1527 1308 156 2507 2688 145
CHOICE M 132 117 484 381 83 971 1734 727 2162 2304 225
F 152 210 623 435 164 1265 2148 773 2633 2911 143
Figure 4.6 demonstrates that all five SE diphthongs exhibit different F1 and F2
trajectories, with some exhibiting more movement than others. All diphthongs
appear to be closing diphthongs in that they have falling F1 values, illustrated
by an upward movement. Formant movement appears to be greatest on the F2
dimension but this varies per diphthong. Specifically, CHOICE changes the most
in terms of F2, followed by PRICE, FACE, MOUTH and GOAT. However, GOAT
appears to be the only diphthong which on average changes most on the F1
dimension rather than the F2 dimension.

4. Study I: Acoustic similarity of NSD vowels to SSBE and SE vowels
96
Figure 4.6. Average F1 and F2 trajectories for the five SE diphthongs
SE female speakers
SE male speakers
4.5. An acoustic comparison of SSBE and SE vowels
4.5.1. Introduction
Sections 4.3 and 4.4 described the main acoustic properties of the vowel
categories of SSBE and SE and this section presents a comparison using vowel
tokens from the same fVf monosyllabic pseudowords. First, acoustic evidence
for the STRUT-FOOT split in SSBE and lack of it in SE is presented. It is necessary

4. Study I: Acoustic similarity of NSD vowels to SSBE and SE vowels
97
to investigate the STRUT-FOOT split because it determines how the following
comparison of SSBE and SE vowels can be conducted. As discussed in Chapter
2, it was decided that the SSBE FOOT category is equivalent to the SE FOOT
category while there is no comparable equivalent of the SSBE STRUT vowel in
SE because the SE FOOT vowel is used in equivalent SE phonological contexts.
Second, the 10 monophthongs that SSBE and SE share are compared. Third,
the five SSBE and SE diphthongs are compared. The section concludes with a
summary of the main acoustic similarities and dissimilarities of SSBE and SE
vowels.
4.5.2. Acoustic evidence for the STRUT-FOOT split in SSBE but not in SE
If the STRUT-FOOT split exists, the vowels in the two lexical sets STRUT and FOOT
should not rhyme with one another, i.e., the vowels should be acoustically
distinguishable when said in exactly the same phonetic context. On the other
hand, if the two vowels are not contrasted, then it can be assumed that no split
exists and STRUT and FOOT are not separate vowel categories.
Recall that the 17 SSBE speakers and 19 SE speakers performed a
speaking task in which they were asked to produce sentences containing fVf
pseudowords which rhymed with Wells’ (1982) lexical sets that included STRUT
and FOOT as stimuli (see Chapter 3). The SSBE and SE speakers from Study I
each produced two repetitions of fVf monosyllables rhyming with STRUT and
two repetitions rhyming with FOOT. The five acoustic measures of vowel
duration, f0, F1, F2 and F3, with the formant measurements being taken at
vowel midpoint, are used in the following analysis.
In order to test whether SSBE and SE speakers produced STRUT and
FOOT differently, repeated-measures ANOVAs were conducted separately for
SSBE speakers and SE speakers on logarithmic values for duration, f0, F1, F2
and F3 values with word stimulus as a within-subjects factor (two levels for the
fVf monosyllables rhyming with STRUT and FOOT) and gender as a between-
subjects factor (two levels). The ANOVA for SE speakers revealed no
significant differences for any of the five measures (p > 0.05). On the other

4. Study I: Acoustic similarity of NSD vowels to SSBE and SE vowels
98
hand, the ANOVA for SSBE speakers yielded significant differences for three
of the five measures, namely for vowel duration (F[1,15] = 5.27; p = 0.036), for
F1 (F[1,15] = 313.28; p < 0.001) and for F2 (F[1,15] = 16.36; p = 0.001).
Differences were not found for SSBE speakers’ f0 or for F3 (p > 0.05). Upon
inspection of the data in Table 4.7, it appears that the SSBE STRUT vowel is on
average 7.5 ms longer, exhibits a higher F1 and lower F2 than SSBE FOOT,
which clearly suggests that SSBE STRUT is realised more open and further back
than SSBE FOOT, as well as being slightly longer in duration. On the other
hand, there are no reliable differences between the vowels in SE: duration, F1
and F2 are on average very similar. The lack of acoustic differences for these
SE vowels clearly suggests there is no separate STRUT vowel category and
confirms that SSBE does indeed exhibit the STRUT-FOOT split, whereas SE does
not.
As SE lacks a vowel category that SSBE has, comparisons of SSBE and
SE vowels must exclude this vowel, since there is no equivalent vowel category
in SE to perform a comparison on. This leaves 10 directly comparable
monophthong vowel categories and five directly comparable diphthong vowel
categories in SSBE and SE.
Table 4.7. Geometric means for duration, f0, F1, F2 and F3 of SE and SSBE monosyllables rhyming with
STRUT and FOOT
Measure Gender
SE SSBE
ST
RU
T
FO
OT
ST
RU
T
FO
OT
Duration
(ms)
M 67 67 82 75
F 71 73 76 68
f0 (Hz) M 118 118 117 122
F 223 216 215 224
F1 (Hz) M 442 441 614 448
F 530 512 779 484
F2 (Hz) M 999 991 1158 1182
F 1222 1164 1408 1636
F3 (Hz) M 2313 2286 2195 2190
F 2731 2642 2672 2692
4.5.3. A comparison of the acoustic properties of 10 SSBE and SE
monophthongs
The 10 SSBE and SE equivalent monophthong vowel categories are FLEECE, KIT,
DRESS, NURSE, TRAP, PALM, LOT, THOUGHT, FOOT and GOOSE. The five measures

4. Study I: Acoustic similarity of NSD vowels to SSBE and SE vowels
99
used for monophthongs are the same as used previously for monophthongs in
the acoustic descriptions of NSD, SSBE and SE above, namely vowel duration,
f0, F1, F2 and F3. The present analysis uses exactly the same data reported in
4.3 and 4.4 for SSBE and SE monophthongs, namely speaker means for vowel
tokens from fVf monosyllables. In order to test whether SSBE and SE speakers
differ on any of the five acoustic measures for the 10 SSBE and SE
monophthongs, a repeated-measures ANOVA was conducted with vowel
category coded as a within-subjects factor (10 levels for 10 monophthongs) and
gender (two levels) and accent group (two levels for SSBE and SE speakers)
coded as between-subjects factors. The ANOVA revealed main effects of vowel
category on all five measures: on duration (F[9ε,288ε, ε = 0.72] = 236.49; p <
0.001), on f0 (F[9ε,288ε, ε = 0.71] = 2.67; p = 0.014), on F1 (F[9ε,288ε, ε = 0.51] =
376.49; p < 0.001), on F2 (F[9ε,288ε, ε = 0.57] = 476.95; p < 0.001) and on F3
(F[9ε,288ε, ε = 0.69] = 31.61; p < 0.001), which is similar to what was found
separately for SSBE and SE monophthongs and once more indicates that the 10
monophthongs reliably differ on these five measures. Vowel category X accent
interactions were found for duration (F([9ε,288ε, ε = 0.72] = 2.59; p = 0.017), for
F1 (F[9ε,288ε, ε = 0.51] = 10.09; p < 0.001) and for F2 (F[9ε,288ε, ε = 0.57] = 27.28;
p < 0.001), but not for f0 or F3 (p > 0.05), suggesting that SSBE and SE speakers
reliably differ in duration, F1 and F2, but not f0 or F3, for some of the 10
monophthongs.
The significant vowel category X accent interactions involving duration,
F1 and F2 prompted further analysis in order to determine which of the 10
monophthongs SSBE and SE speakers differed on. To do so, three multivariate
ANOVAs were run on logarithmic values for duration, F1 and F2 and for each
ANOVA the fixed factors were gender and accent group. The ANOVA for
duration did not reveal any significant differences between SSBE and SE
speakers for any of the 10 monophthongs, despite the significant vowel
category X accent interaction above. The ANOVA for F1, on the other hand,
revealed significant differences for LOT (F[1,32] = 9.35; p = 0.004), NURSE (F[1,32]
= 38.81; p < 0.001), PALM (F[1,32] = 6.94; p = 0.013) and THOUGHT (F[1,32] =

4. Study I: Acoustic similarity of NSD vowels to SSBE and SE vowels
100
18.63; p < 0.01). A difference in F1 approaching significance was revealed for
KIT (F[1,32] = 3.86; p = 0.058). Significant differences in F2 were revealed for
FOOT (F[1,32] = 58.73; p < 0.001), GOOSE (F[1,32] = 28.27; p < 0.001), NURSE
(F[1,32] = 23.17; p < 0.001), PALM (F[1,32] = 9.25; p = 0.005) and THOUGHT (F[1,32]
= 27.81; p < 0.001) and marginally for TRAP (F[1,32] = 3.39; p = 0.057).
The results of the multivariate ANOVAs regarding F1 and F2 are
consistent with the average F1 and F2 locations of the 10 monophthongs for
SSBE and SE male and female speakers displayed in Figure 4.7. For instance,
the F1 of LOT is lower for SSBE speakers, the F1 for NURSE differs considerably
between the two accents with SSBE exhibiting a much lower F1, PALM exhibits
a lower F1 for SSBE speakers and THOUGHT has a lower F1 for SE speakers.
There are large differences in F2 between SSBE and SE speakers’ realisations of
FOOT and GOOSE, with these vowels consistently having a much higher F2 for
SSBE speakers. THOUGHT has a much higher F2 for SE speakers and PALM and
NURSE both exhibit a lower F2 for SSBE speakers than SE speakers. Lastly, TRAP
appears to have a slightly higher F2 in SSBE than in SE.

4. Study I: Acoustic similarity of NSD vowels to SSBE and SE vowels
101
Figure 4.7. Mean F1 and F2 values of the 10 shared SSBE and SE monophthongs
SSBE and SE female speakers
SSBE and SE male speakers
Red = SSBE females
Blue = SE females
Red = SSBE males
Blue = SE males

4. Study I: Acoustic similarity of NSD vowels to SSBE and SE vowels
102
4.5.4. A comparison of the acoustic properties of five SSBE and SE
diphthongs
In order to test for differences between the five SSBE and SE diphthongs, a
repeated-measures ANOVA was run on logarithmic values of the 11 dependent
measures of vowel duration, f0, F1 at 25% and at 75%, F2 at 25% and at 75%, F3
at 25% and at 75%, F1 movement, F2 movement and F3 movement with vowel
category as a within-subjects factor (five levels for the five diphthongs) and
gender (two levels) and accent group (two levels) as between-subjects factors.
The analysis revealed main effects of vowel category on all 11 measures: on
vowel duration (F[4,128] = 16.82; p < 0.001), on f0 (F[4ε,128ε, ε = 0.77] = 2.73; p =
0.047), on F1 at 25% (F[4ε,128ε, ε = 0.93] = 216.99; p < 0.001) and at 75% (F[4ε,
128ε, ε = 0.83] = 154.68; p < 0.001), on F2 at 25% (F[4ε,128ε, ε = 0.96] = 225.36; p <
0.001) and at 75% (F[4ε,128ε, ε = 0.82] = 165.52; p < 0.001), on F3 at 25%
(F[4ε,128ε, ε = 0.64] = 7.23; p < 0.001) and at 75% (F[4ε,128ε, ε = 67] = 22.18; p <
0.001), on F1 movement (F[4,128] = 225.36; p < 0.001), on F2 movement
(F[4ε,128ε, ε = 0.72] = 238.03; p < 0.001) and on F3 movement (F[4ε,128ε, ε = 0.61]
= 3.09; p = 0.041), indicating that the five diphthongs can be separated well on
these 11 measures, as was found separately for SSBE and SE. The ANOVA also
uncovered vowel category X accent interactions for six of the 11 measures,
namely for F1 at 25% (F[4ε,128ε, ε = 0.93] = 9.80; p < 0.001) and at 75%
(F[4ε,128ε, ε = 0.83] = 3.78; p = 0.01), for F2 at 25% (F[4ε,128ε, ε = 0.96] = 6.57; p <
0.001) and at 75% (F[4ε,128ε, ε = 0.82] = 16.43; p < 0.001), for F1 movement
(F[4,128] = 6.53; p < 0.001) and for F2 movement (F[4ε,128ε, ε = 0.72] = 7.22; p <
0.001). No vowel category X accent interactions were found for f0, duration or
the three measures involving F3 (p > 0.05). In addition to these interactions,
there were main effects of accent group on F2 movement (F[1,32] = 65.80; p <
0.001), on F2 at 75% (F[1,32] = 26.43; p < 0.001) and a marginally significant
main effect of accent group on F1 at 75% (F[1,32] = 4.04; p = 0.053). This
implies that the five diphthongs do not always start and end in the same place
and the degree and direction of formant movement is not always the same in

4. Study I: Acoustic similarity of NSD vowels to SSBE and SE vowels
103
SSBE and SE. However, it also suggests that the duration, f0 and F3 of the
diphthongs do not differ reliably between SSBE and SE.
The above vowel category X accent interactions involving F1 and F2
prompted further analysis by means of six multivariate ANOVAs to examine
how the five diphthongs differ between the two accents in terms of F1 at 25%
and 75%, F2 at 25% and 75%, F1 movement and F2 movement. The significant
results of the six ANOVAs are summarised in Table 4.8. According to the
ANOVAs, SSBE and SE do not significantly differ on any measure for the
MOUTH diphthong. For the FACE diphthong, there are differences involving
only F2 movement. For the CHOICE, GOAT and PRICE diphthongs, a variety of
differences were revealed on most measures, indicating that these vowels not
only exhibit different starting and end points in the two accents but also that
the degree and direction of formant movement are reliably different.
Table 4.8. Significant differences from six multivariate ANOVAs between five SSBE and SE diphthongs
Diphthong
F-values and p-values
(Degrees of freedom = [1,32])
F1 25% F1 75% F1
movement F2 25% F2 75%
F2
movement
FACE - - - - - 7.67, p =
0.009
GOAT - 5.28, p =
0.028
6.62, p =
0.015
6.88, p =
0.013
55.50, p <
0.001
66.24, p <
0.001
PRICE 12.48, p <
0.001
13.00, p =
0.001 -
6.55, p =
0.015 -
6.88, p =
0.013
MOUTH - - - - - -
CHOICE 21.76, p <
0.001 -
11.12, p =
0.002
4.56, p =
0.041 -
6.68, p =
0.015
Inspection of Figure 4.8, which displays average F1 and F2 trajectories for the
five SSBE and SE diphthongs, illustrates that MOUTH hardly differs between
SSBE and SE and FACE only differs in that F2 changes more for SSBE. It also
demonstrates that the F1 and F2 trajectories for CHOICE do indeed begin
differently. While the GOAT vowel appears to start in the same place at least on
the F1 dimension for both SSBE and SE, the F1 and F2 trajectories are
considerably different, taking completely opposite directions on the F2
dimension. The PRICE vowel starts in different places in terms of both F1 and
F2 and ends at a different F1 location but not F2.
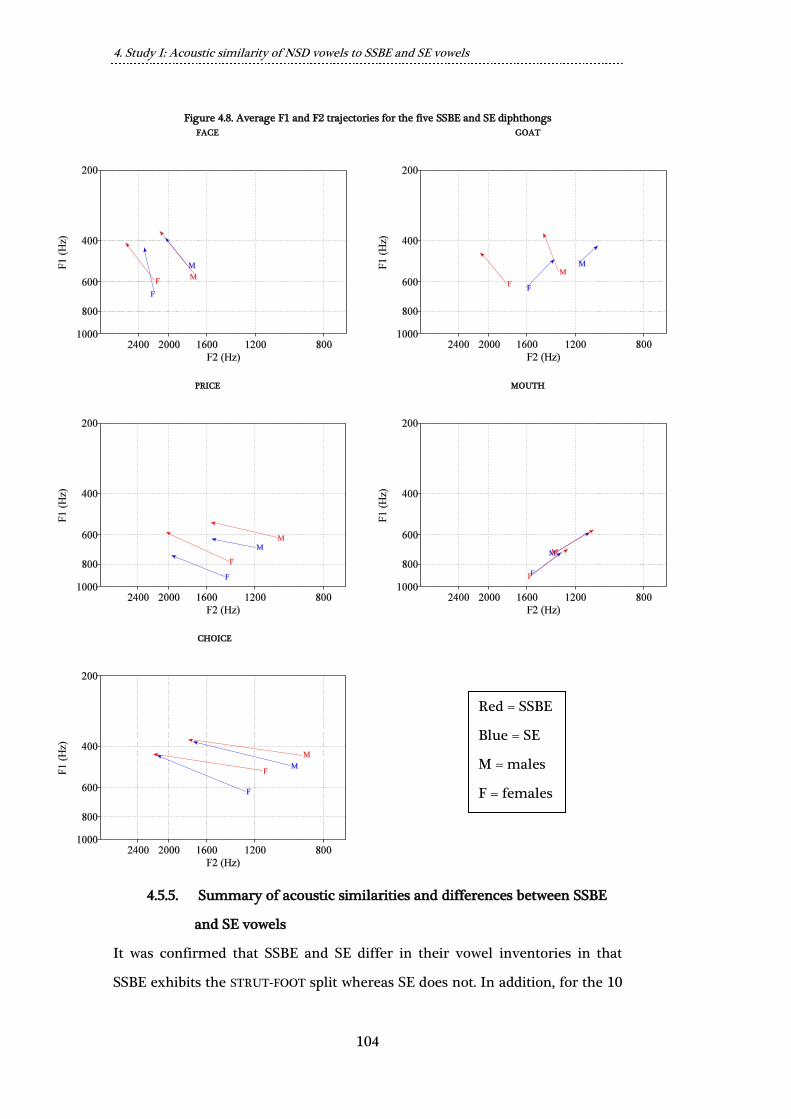
4. Study I: Acoustic similarity of NSD vowels to SSBE and SE vowels
104
Figure 4.8. Average F1 and F2 trajectories for the five SSBE and SE diphthongs
FACE GOAT
PRICE MOUTH
CHOICE
4.5.5. Summary of acoustic similarities and differences between SSBE
and SE vowels
It was confirmed that SSBE and SE differ in their vowel inventories in that
SSBE exhibits the STRUT-FOOT split whereas SE does not. In addition, for the 10
Red = SSBE
Blue = SE
M = males
F = females

4. Study I: Acoustic similarity of NSD vowels to SSBE and SE vowels
105
monophthong vowel categories that SSBE and SE share, reliable differences
were found for six monophthongs: LOT, NURSE, PALM, THOUGHT, FOOT and
GOOSE, indicating different phonetic properties for these vowel categories.
Furthermore, some less reliable acoustic differences were found for KIT and
TRAP. For four of the five diphthongs reliable acoustic differences were found
and these were most evident in the three diphthongs GOAT, PRICE and CHOICE.
Out of all 10 monophthongs and all five diphthongs, only FLEECE, DRESS and
MOUTH were not found to exhibit any significant or any marginally significant
acoustic differences, suggesting that these three vowel categories are
acoustically most similar in SSBE and SE.
4.6. The acoustic similarity of NSD vowels to SSBE and SE
vowels
4.6.1. Linear discriminant analyses (LDAs)
The previous section established that for the majority of SSBE and SE vowels,
there are acoustic differences and that the differences occur on several
different measures. The goal of this section is to determine which SSBE and
SE vowel categories are acoustically most similar to the 15 NSD vowel
categories and the degree of this similarity to the 15 NSD vowel categories.
Due to the acoustic differences uncovered between the two English accents, it
is expected that some of the 15 NSD vowels may well turn out to be
acoustically similar to different English vowel categories. In order to
determine acoustic similarity, the statistical procedure linear discriminant
analysis (LDA) will be used. As described in Chapter 2 and Chapter 3,
discriminant analyses have been utilised in the literature to examine the cross-
language acoustic similarity of vowels (e.g., Strange et al., 2004; Strange et al.,
2005; Escudero et al., 2012). A summary of the procedure is as follows. As
outlined in Chapter 2, two sets of vowel data are required, which are referred to
as the training set and the test set, respectively. The test set is the data that is to
be classified in terms of the training set. The training set variables are entered

4. Study I: Acoustic similarity of NSD vowels to SSBE and SE vowels
106
into the model for various acoustic measures, such as duration, F1 and F2, for
tokens of each vowel category. The procedure then generates linear
discriminant functions of these variables that best characterise each separate
vowel category. The test set is then introduced, which includes the same
acoustic measures as the training set but for entirely different vowel categories.
Each individual vowel token from the test set is then classified on the basis of
its acoustic variables according to the closest linear discriminant function
generated from the training set. The result is that each individual vowel token
from the test set is assigned a vowel category label from the training set. The
number of times a vowel token of a particular vowel category from the test set
is classified in terms of a vowel category from the training set is summed and
converted into a percentage. This percentage figure acts as a measure of
acoustic similarity of the vowel category from the test set to the vowel
category from the training set.
In the following LDAs, the training set always consisted of acoustic
data on either SSBE or SE vowel tokens and the test set was always acoustic
data on NSD vowel tokens. Furthermore, the training set and test set always
consisted of vowel data originating from speakers of the same gender, as
genders were kept separate to minimise variation in vowel formants caused by
different sized vocal tracts. Four LDAs were run and the combinations of data
sets are indicated with a cross (x) in Table 4.9.
Table 4.9. Summary of the four LDAs
Parameter LDA 1 LDA 2 LDA 3 LDA 4
Training Test Training Test Training Test Training Test
Male x x x x
Female x x x x
NSD x x x x
SSBE x x
SE x x
The NSD data sets consisted of the same NSD vowel tokens used in the
analysis in 4.2. That is, vowel tokens taken from monosyllabic fVf pseudowords
said twice by 10 male and 10 female NSD speakers for the 15 NSD vowels /i, y,
ɪ, ʏ, ø, e, ɛ, a, ɑ, ɔ, o, u, ʌu, ɛi, œy/. There were two test sets for the four LDAs,
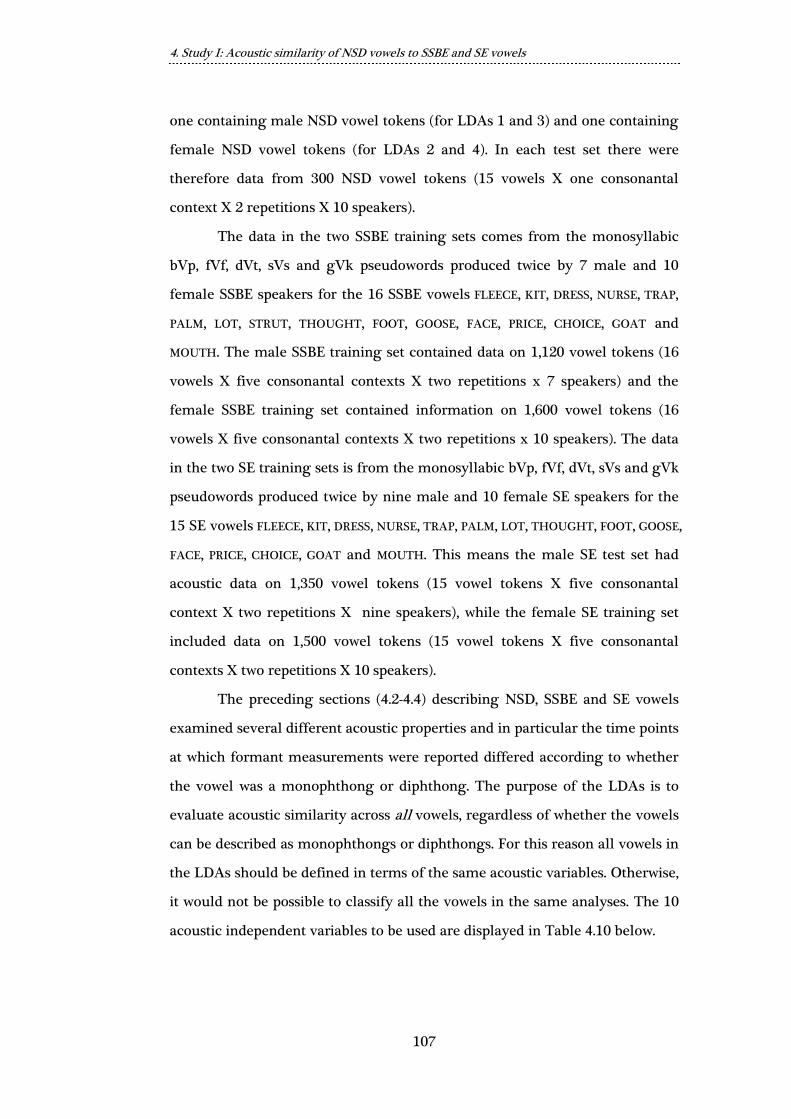
4. Study I: Acoustic similarity of NSD vowels to SSBE and SE vowels
107
one containing male NSD vowel tokens (for LDAs 1 and 3) and one containing
female NSD vowel tokens (for LDAs 2 and 4). In each test set there were
therefore data from 300 NSD vowel tokens (15 vowels X one consonantal
context X 2 repetitions X 10 speakers).
The data in the two SSBE training sets comes from the monosyllabic
bVp, fVf, dVt, sVs and gVk pseudowords produced twice by 7 male and 10
female SSBE speakers for the 16 SSBE vowels FLEECE, KIT, DRESS, NURSE, TRAP,
PALM, LOT, STRUT, THOUGHT, FOOT, GOOSE, FACE, PRICE, CHOICE, GOAT and
MOUTH. The male SSBE training set contained data on 1,120 vowel tokens (16
vowels X five consonantal contexts X two repetitions x 7 speakers) and the
female SSBE training set contained information on 1,600 vowel tokens (16
vowels X five consonantal contexts X two repetitions x 10 speakers). The data
in the two SE training sets is from the monosyllabic bVp, fVf, dVt, sVs and gVk
pseudowords produced twice by nine male and 10 female SE speakers for the
15 SE vowels FLEECE, KIT, DRESS, NURSE, TRAP, PALM, LOT, THOUGHT, FOOT, GOOSE,
FACE, PRICE, CHOICE, GOAT and MOUTH. This means the male SE test set had
acoustic data on 1,350 vowel tokens (15 vowel tokens X five consonantal
context X two repetitions X nine speakers), while the female SE training set
included data on 1,500 vowel tokens (15 vowel tokens X five consonantal
contexts X two repetitions X 10 speakers).
The preceding sections (4.2-4.4) describing NSD, SSBE and SE vowels
examined several different acoustic properties and in particular the time points
at which formant measurements were reported differed according to whether
the vowel was a monophthong or diphthong. The purpose of the LDAs is to
evaluate acoustic similarity across all vowels, regardless of whether the vowels
can be described as monophthongs or diphthongs. For this reason all vowels in
the LDAs should be defined in terms of the same acoustic variables. Otherwise,
it would not be possible to classify all the vowels in the same analyses. The 10
acoustic independent variables to be used are displayed in Table 4.10 below.

4. Study I: Acoustic similarity of NSD vowels to SSBE and SE vowels
108
Table 4.10. 10 acoustic independent variables used in the LDAs
Variable
1. Vowel duration (ms)
2. F1 at 25% duration (Bark)
3. F1 at 50% duration (Bark)
4. F1 at 75% duration (Bark)
5. F2 at 25% duration(Bark)
6. F2 at 50% duration (Bark)
7. F2 at 75% duration (Bark)
8. F3 at 25% duration (Bark)
9. F3 at 50% duration (Bark)
10 F3 at 75% duration (Bark)
The inclusion of these particular 10 variables follows that of Escudero and
Vasiliev’s (2011) LDA involving Peruvian Spanish vowels (training set) and
Canadian English vowels (test set), as outlined in subsection 2.5.1 in Chapter 2.
The authors found it necessary to include not only F1, F2 and F3 values
measured at vowel midpoint, but also F1, F2 and F3 values at 25% and 75%
duration in order to provide more consistent classifications and therefore more
reliable results on acoustic similarity. As the present project includes
monophthongs as well as diphthongs, including formant measurements at
three time points is necessary because this captures not only the steady-state
spectral properties but also the dynamic spectral properties of the vowels
involved (Harrington and Cassidy, 1994). As formant movement is
characteristic of diphthongs, any cross-language discriminant analysis is
highly likely to be affected by this. The present LDAs follow Escudero and
Vasiliev’s (2011) method in a further way: namely their training set contained
data on vowel tokens produced in various different consonantal contexts rather
than the same consonantal contexts that the vowels in the test set were
produced in. In the present LDAs, the training sets for SSBE and SE contain
vowel tokens produced in five different consonantal contexts, while the test
sets for NSD are composed of only vowel tokens produced in an fVf context.
This is to better correspond to the fact that listeners in Study III and Study IV
were presented with NSD vowel tokens from the fVf context only and were not
exposed to NSD vowels from other consonantal contexts and the acoustic
properties of vowels vary according to the consonantal context in which they
were produced (e.g., as demonstrated for NSD by Van Leussen et al., 2011).
4. Study I: Acoustic similarity of NSD vowels to SSBE and SE vowels
109
The classification percentages derived from LDAs 1 and 2 were
averaged across male and female vowel tokens to give overall percentage
classifications of NSD vowels in terms of SSBE vowels. Similarly, the
classification percentages from LDAs 3 and 4 were averaged across both
genders to produce overall percentage classifications of NSD vowels in terms
of the SE vowels.
4.6.2. Classification of NSD vowels in terms of the 16 SSBE and the 15
SE vowel categories
The classification percentages from LDAs for SSBE are displayed in Table 4.11
and the corresponding results for SE are displayed in Table 4.12. On the whole,
the 15 NSD vowels were only moderately consistently classified in SSBE and
SE as reflected by the means across all modal classification percentages of 66%
for SSBE and 68% for SE. A modal classification is the most often occurring
categorisation of an NSD vowel in terms of one particular SSBE or SE vowel
category. Some NSD vowels were not categorised in terms of any single
English vowel most of the time. That is, sometimes the modal classification
percentage was less than 50% of the time. On this basis, the NSD vowels that
were not consistently classified for SSBE are /a, ɛi, o, œy/ and /ʏ/ and /y/ for SE.
The lack of consistent classification of these NSD vowels may indicate that
there is no single English vowel category that is acoustically very similar and
instead the overall acoustic similarity of the NSD vowels overlaps two or more
English vowel categories.
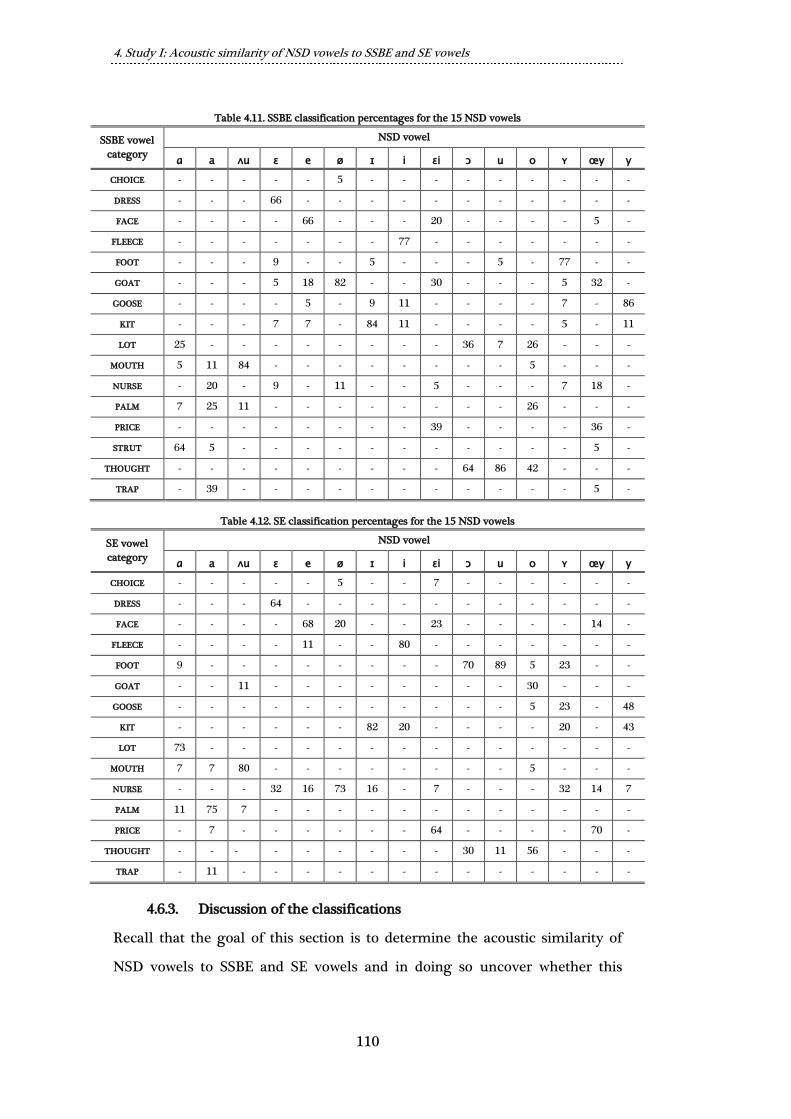
4. Study I: Acoustic similarity of NSD vowels to SSBE and SE vowels
110
Table 4.11. SSBE classification percentages for the 15 NSD vowels
SSBE vowel
category
NSD vowel
ɑ a ʌu ɛ e ø ɪ i ɛi ɔ u o ʏ œy y
CHOICE - - - - - 5 - - - - - - - - -
DRESS - - - 66 - - - - - - - - - - -
FACE - - - - 66 - - - 20 - - - - 5 -
FLEECE - - - - - - - 77 - - - - - - -
FOOT - - - 9 - - 5 - - - 5 - 77 - -
GOAT - - - 5 18 82 - - 30 - - - 5 32 -
GOOSE - - - - 5 - 9 11 - - - - 7 - 86
KIT - - - 7 7 - 84 11 - - - - 5 - 11
LOT 25 - - - - - - - - 36 7 26 - - -
MOUTH 5 11 84 - - - - - - - - 5 - - -
NURSE - 20 - 9 - 11 - - 5 - - - 7 18 -
PALM 7 25 11 - - - - - - - - 26 - - -
PRICE - - - - - - - - 39 - - - - 36 -
STRUT 64 5 - - - - - - - - - - - 5 -
THOUGHT - - - - - - - - - 64 86 42 - - -
TRAP - 39 - - - - - - - - - - - 5 -
Table 4.12. SE classification percentages for the 15 NSD vowels
SE vowel
category
NSD vowel
ɑ a ʌu ɛ e ø ɪ i ɛi ɔ u o ʏ œy y
CHOICE - - - - - 5 - - 7 - - - - - -
DRESS - - - 64 - - - - - - - - - - -
FACE - - - - 68 20 - - 23 - - - - 14 -
FLEECE - - - - 11 - - 80 - - - - - - -
FOOT 9 - - - - - - - - 70 89 5 23 - -
GOAT - - 11 - - - - - - - - 30 - - -
GOOSE - - - - - - - - - - - 5 23 - 48
KIT - - - - - - 82 20 - - - - 20 - 43
LOT 73 - - - - - - - - - - - - - -
MOUTH 7 7 80 - - - - - - - - 5 - - -
NURSE - - - 32 16 73 16 - 7 - - - 32 14 7
PALM 11 75 7 - - - - - - - - - - - -
PRICE - 7 - - - - - - 64 - - - - 70 -
THOUGHT - - - - - - - - - 30 11 56 - - -
TRAP - 11 - - - - - - - - - - - - -
4.6.3. Discussion of the classifications
Recall that the goal of this section is to determine the acoustic similarity of
NSD vowels to SSBE and SE vowels and in doing so uncover whether this

4. Study I: Acoustic similarity of NSD vowels to SSBE and SE vowels
111
differs depending on the English accent in question. In order to provide an
initial overview of this, the modal classifications of the 15 NSD vowels in terms
of both SSBE and SE vowel categories are shown in Table 4.13. The modal
classifications can be considered the acoustically most similar SSBE or SE
vowel categories to the 15 NSD vowels. As can be seen, the nine NSD vowels
/ʌu, ɛ, e, ɪ, i, ɛi, o, œy, y/ were classified most often in terms of the same SSBE
and SE vowel categories, namely MOUTH, DRESS, KIT, FLEECE, PRICE, THOUGHT,
PRICE and GOOSE, respectively. The remaining six NSD vowels /ɑ, a, ø, ɔ, u, ʏ/,
on the other hand, were classified most often in terms of different SSBE and SE
vowel categories.
Table 4.13. Modal classifications of NSD vowels in terms of SSBE and SE vowel categories
English
accent
NSD vowel
ɑ a ʌu ɛ e ø ɪ i ɛi ɔ u o ʏ œy y
SSBE
ST
RU
T
TR
AP
MO
UT
H
DR
ES
S
FA
CE
GO
AT
KIT
FL
EE
CE
PR
ICE
TH
OU
GH
T
TH
OU
GH
T
TH
OU
GH
T
FO
OT
PR
ICE
GO
OSE
SE
LO
T
PA
LM
MO
UT
H
DR
ES
S
FA
CE
NU
RSE
KIT
FL
EE
CE
PR
ICE
FO
OT
FO
OT
TH
OU
GH
T
NU
RSE
PR
ICE
GO
OSE
These different modal classifications are indicative of differences in acoustic
similarity. To summarise, the main differences are that (1) NSD /ɑ/ is most
similar to STRUT in SSBE (64%) and LOT in SE (73%); (2) NSD /a/ is most
similar to TRAP in SSBE (39%) and PALM in SE (75%); (3) NSD /ø/ is most
similar to GOAT in SSBE (82%) and NURSE in SE (73%); (4) NSD /ɔ/ is most
similar to THOUGHT (64%) in SSBE and FOOT in SE (70%); (5) NSD /u/ is most
similar to THOUGHT (86%) in SSBE and FOOT in SE (89%) and that (6) NSD /ʏ/
is most similar to FOOT in SSBE (77%) and NURSE in SE (32%). These
differences are visible in Figures 4.9-4.12 below which plot mean F1 and F2
values (in Hz) from the data that were submitted to the above LDAs.
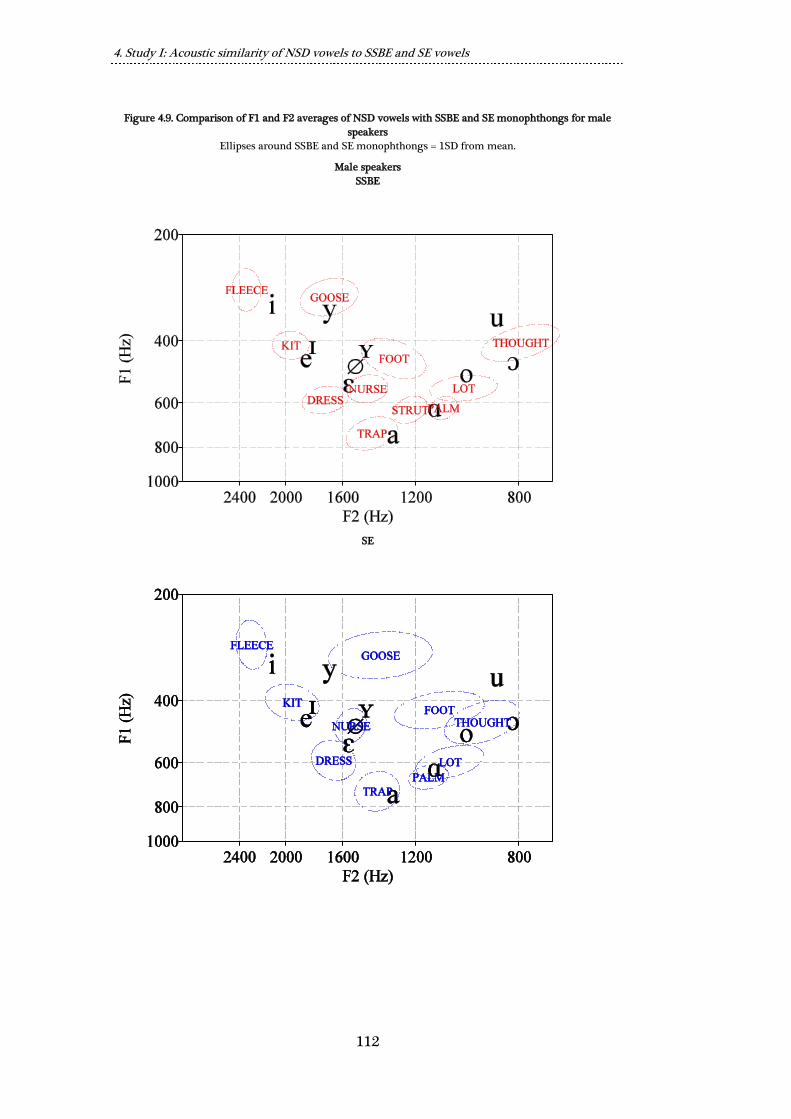
4. Study I: Acoustic similarity of NSD vowels to SSBE and SE vowels
112
Figure 4.9. Comparison of F1 and F2 averages of NSD vowels with SSBE and SE monophthongs for male
speakers
Ellipses around SSBE and SE monophthongs = 1SD from mean.
Male speakers
SSBE
SE

4. Study I: Acoustic similarity of NSD vowels to SSBE and SE vowels
113
Figure 4.10. Comparison of F1 and F2 averages of NSD vowels with SSBE and SE monophthongs for female
speakers
Ellipses around SSBE and SE monophthongs = 1SD from mean.
Female speakers
SSBE
SE

4. Study I: Acoustic similarity of NSD vowels to SSBE and SE vowels
114
Figure 4.11. Comparison of average F1 and F2 trajectories for NSD, SSBE and SE diphthongs for male
speakers
Male speakers
SSBE
SE

4. Study I: Acoustic similarity of NSD vowels to SSBE and SE vowels
115
Figure 4.12. Comparison of average F1 and F2 trajectories for NSD, SSBE and SE diphthongs for female
speakers
Female speakers
SSBE
SE
Most of the differences between SSBE and SE vowels uncovered in 4.5 also
feature in the differences in acoustic similarity of NSD vowels to SSBE or SE
vowels. The most obvious difference relates to the SSBE STRUT vowel, which

4. Study I: Acoustic similarity of NSD vowels to SSBE and SE vowels
116
the LDAs revealed is acoustically most similar to NSD /ɑ/, whereas the SE LOT
vowel is acoustically most similar to this NSD vowel. As SE does not have an
equivalent to the STRUT vowel, it is not surprising that a different vowel
category – the LOT vowel – was found to be acoustically most similar to NSD
/ɑ/. Moreover, the LOT vowel was found to differ between SSBE and SE which
may also have contributed to the different classifications of NSD /ɑ/. The
NURSE, PALM, THOUGHT, FOOT and GOAT vowels also differ between the two
English accents and differences involving these vowel categories are apparent
in the classification of NSD vowels in the LDAs. For instance, NSD /ø/ was
classified most often as GOAT in SSBE (82%) and NURSE in SE (73%), NSD /a/
was categorised as PALM only 25% of the time in SSBE but 75% of the time in
SE, and NSD /ɔ/ and /u/ were both found to be acoustically most similar to
THOUGHT in SSBE but FOOT in SE. Nevertheless, some of the differences
between vowels in SSBE and SE did not affect how the NSD vowels were
classified: differences in the production of GOOSE, PRICE and CHOICE did not
result in any clear differences in the modal classifications of NSD vowels in
terms of SSBE or SE vowels. This is presumably because both SSBE and SE
exhibit other vowels which are acoustically most similar to NSD vowels,
suggesting these vowels in both SSBE and SE are acoustically unlike any NSD
vowel.
4.7. Summary
Study I sought to address Question I which asks how the vowels of NSD
compare acoustically with the vowels of SSBE and the vowels of SE. There are
several phonetic context effects that can affect vowel acoustics, so tokens were
matched as closely as possible on phonetic context across the NSD, SSBE and
SE. New acoustic data had to be collected in order to perform the comparison
of the vowels in the vowel inventories of NSD, SSBE and SE because no
appropriate data were available and the first part of this chapter provided a
general overview of this newly collected acoustic data. It was confirmed that

4. Study I: Acoustic similarity of NSD vowels to SSBE and SE vowels
117
SSBE and SE do indeed differ in their vowel inventories: SSBE exhibits the
STRUT-FOOT split whereas SE does not. Additionally, many differences were
found between the acoustic properties of SSBE and SE vowels. In the second
part of the chapter, NSD vowels (both monophthongs and diphthongs) were
compared acoustically with SSBE and SE vowels by means of LDAs. The
resulting classifications of NSD vowels in terms of either SSBE or SE vowels
provide a measure of acoustic similarity. It has been established that some
NSD vowels are acoustically most similar to entirely different vowel categories
in SSBE and SE while other NSD vowels are acoustically similar to the same
SSBE and SE vowel categories but the degree of similarity differs.
5. Study II: The use of spectral properties in the identification of English monophthongs by SSBE
and SE listeners
118
5.
Study II: The use of spectral
properties in the identification of
English monophthongs by SSBE
and SE listeners
5.1. Introduction to Chapter 5
The purpose of Study II was to investigate how SSBE and SE listeners use
spectral properties to identify vowel quality for English monophthongs
(Question II). It is expected that SSBE and SE listeners may differ in how they
use steady-state spectral properties to determine the identity of at least some
English monophthongs as previous studies have demonstrated that listeners of
different native accent backgrounds exhibit different perceptual exemplars for
some vowels (e.g., Evans and Iverson, 2004; Dufour et al., 2007) and Study I
showed that a number of acoustic differences exist in the production of
English vowels by SSBE and SE speakers.
The experiment in this study is limited to only the 11 English
monophthongs FLEECE, KIT, DRESS, NURSE, TRAP, PALM, LOT, THOUGHT, FOOT,
GOOSE and STRUT, and therefore excludes the five English diphthongs CHOICE,
FACE, GOAT, MOUTH and PRICE. This was because diphthongs exhibit a much
greater degree of formant movement and an experiment that incorporates the
wide-ranging formant trajectories of English diphthongs was beyond the scope
of the present study. The experimental task consisted of listeners identifying
synthetic vowel stimuli that varied in equal auditory steps on F1, F2 and F3 in
terms of English vowel categories (see method in section 3.6).
5.2. Results
Geometric means of F1, F2 and F3 were calculated from all the stimuli that a
listener labelled as a particular English monophthong vowel category. That is,
for each listener, average F1, F2 and F3 values were obtained for each of the 10

5. Study II: The use of spectral properties in the identification of English monophthongs by SSBE
and SE listeners
119
vowels FLEECE, KIT, DRESS, NURSE, TRAP, PALM, LOT, THOUGHT, FOOT and GOOSE
and additionally for each SSBE listeners’ average F1, F2 and F3 values were
calculated for STRUT. Overall means of F1, F2 and F3 (in Hz) for each English
monophthong for both listener groups are displayed in Table 5.1. Figure 5.1
displays means of F1 and F2 (in Mel) for the 11 SSBE monophthongs, shown as
squares, and for the 10 SE monophthongs, shown as circles. The plot also
shows the F1 and F2 values of the individual auditory stimuli used in the
experiment and these are represented by crosses. Note that the formant values
in the plot are displayed in Mel rather than Hz in order to show how the
stimuli were spaced from one another in equal auditory steps (see Chapter 3).
Table 5.1. Mean F1, F2 and F3 values (Hz) of SSBE and SE listeners’ identification of English monophthongs
Measure Listener
Accent
English monophthong label
DR
ES
S
FO
OT
FL
EE
CE
TH
OU
GH
T
GO
OSE
KIT
LO
T
NU
RS
E
PA
LM
TR
AP
ST
RU
T
F1 (Hz) SE 584 413 301 617 294 419 658 467 734 945 -
SSBE 589 391 292 524 285 412 592 539 826 977 640
F2 (Hz) SE 2144 1307 2431 1317 1264 2486 1056 1689 1441 1499 -
SSBE 2178 1344 2496 1099 1288 2370 995 1703 1286 1571 1473
F3 (Hz) SE 3122 3128 3269 3093 3049 3188 3124 3120 3172 3110 -
SSBE 3118 3106 3305 3094 3047 3254 3138 3105 3111 3058 3156
The following analysis is largely based on that in Chládková and Escudero
(2012) which involved a similar listening experiment. Since only SSBE listeners
made use of the STRUT vowel option to label the stimuli, it is not possible to
conduct an analysis with this vowel that compares both SSBE and SE listeners’
responses. For the 10 English monophthongs FLEECE, KIT, DRESS, NURSE, TRAP,
PALM, LOT, THOUGHT, FOOT and GOOSE, a repeated-measures ANOVA was run
on all listeners’ logarithmic mean values for F1, F2 and F3 with vowel category
coded as a within-subjects factor (10 levels for the 10 monophthongs) and
listener’s accent coded as a between-subjects factor (two levels for the two
accent groups). As to be expected, there were main effects of vowel category
on all three measures: F1 (F[9ε, 306ε, ε = 0.58] = 341.77; p < 0.001), F2 (F[9ε, 306ε,
ε = 0.34] = 262.11; p < 0.001) and F3 (F[9ε, 306ε, ε = 0.51] = 13.79; p < 0.001),
indicating that listeners identified these 10 monophthongs with different F1,
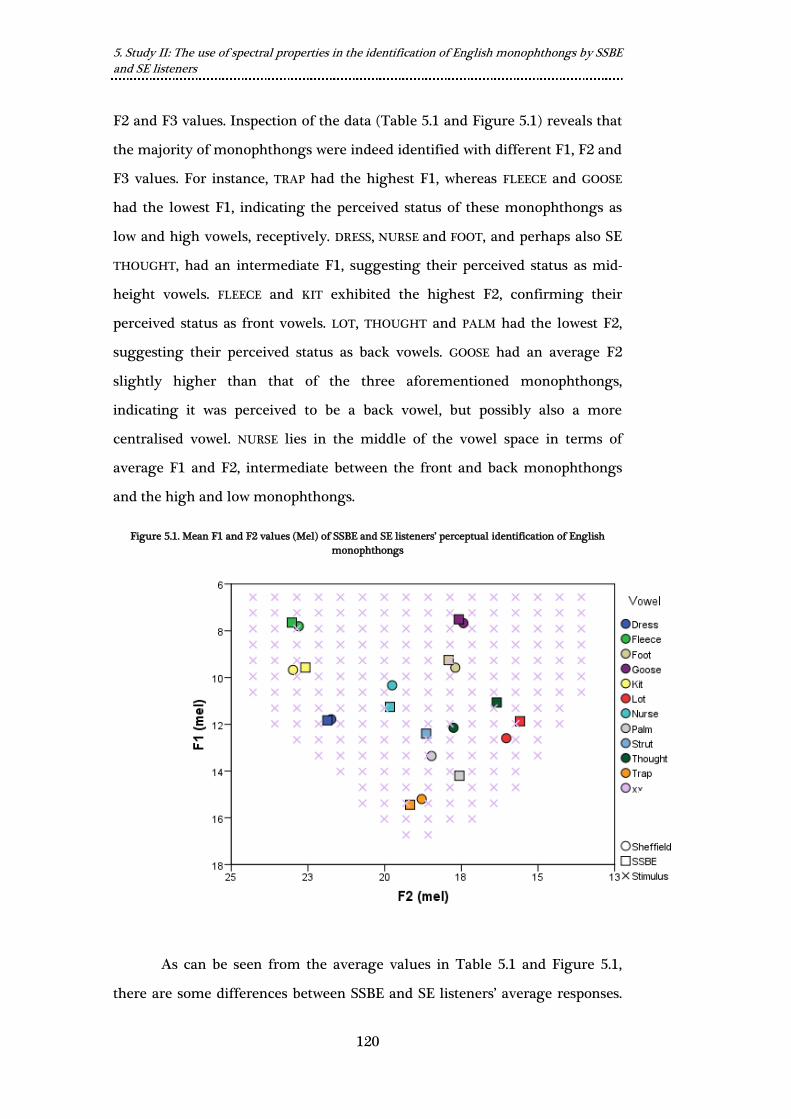
5. Study II: The use of spectral properties in the identification of English monophthongs by SSBE
and SE listeners
120
F2 and F3 values. Inspection of the data (Table 5.1 and Figure 5.1) reveals that
the majority of monophthongs were indeed identified with different F1, F2 and
F3 values. For instance, TRAP had the highest F1, whereas FLEECE and GOOSE
had the lowest F1, indicating the perceived status of these monophthongs as
low and high vowels, receptively. DRESS, NURSE and FOOT, and perhaps also SE
THOUGHT, had an intermediate F1, suggesting their perceived status as mid-
height vowels. FLEECE and KIT exhibited the highest F2, confirming their
perceived status as front vowels. LOT, THOUGHT and PALM had the lowest F2,
suggesting their perceived status as back vowels. GOOSE had an average F2
slightly higher than that of the three aforementioned monophthongs,
indicating it was perceived to be a back vowel, but possibly also a more
centralised vowel. NURSE lies in the middle of the vowel space in terms of
average F1 and F2, intermediate between the front and back monophthongs
and the high and low monophthongs.
Figure 5.1. Mean F1 and F2 values (Mel) of SSBE and SE listeners’ perceptual identification of English
monophthongs
As can be seen from the average values in Table 5.1 and Figure 5.1,
there are some differences between SSBE and SE listeners’ average responses.
5. Study II: The use of spectral properties in the identification of English monophthongs by SSBE
and SE listeners
121
The above ANOVA revealed that there were vowel X accent interactions for F1
(F[9ε, 306ε, ε = 0.58] = 4.51; p < 0.001) and for F2 (F[9ε, 306ε, ε = 0.34] = 4.36; p =
0.006), but not for F3 (p > 0.05), suggesting SSBE and SE listeners made use of
F1 and F2 differently for labelling some of the 10 monophthongs. Additionally,
there was a main effect of listener’s accent on F2 (F[1, 34] = 4.60; p = 0.039), but
not on F1 or F3 (p > 0.05), indicating that the two listener groups reliably
differed in their overall labelling of the monophthongs on the F2 dimension.
Since the ANOVA revealed interactions or main effects relating only to
F1 and F2, the differences and similarities between SSBE and SE listeners’
labelling of the stimuli can be discussed with reference to Figure 5.1 which
displays only F1 and F2 averages. The most striking difference is perhaps that
SSBE listeners used the STRUT response option to label the vowel stimuli.
Unlike SSBE speakers’ production of STRUT, their use of F1 to identify STRUT is
rather low. As for the remaining monophthongs, there are large differences
between SSBE and SE listeners in their average F1 and F2 values for the vowels
PALM, LOT and THOUGHT. Specifically, PALM has a much higher F2 for SE
listeners, which is consistent with the acoustic comparison of speakers’ vowel
productions in Study I (Chapter 4), but also a much lower F1 for SE listeners,
which is at odds with speakers’ productions. SSBE speakers perceived LOT to
have a lower F1 and F2 than SE speakers which is indeed reflected in how this
vowel is produced in the respective accents. Namely, SE LOT is lower and more
fronted, as indicated by a higher F1 and a higher F2. SSBE speakers produced
THOUGHT with a much lower F1 and F2 than SE speakers and this is mirrored
in how the stimuli were labelled. In addition to these salient differences in F1
and F2 in the identification of these monophthongs, smaller differences are
apparent between SSBE and SE listeners’ identification of the stimuli as NURSE
and TRAP. For SE listeners, NURSE had a lower F1 which is reflected in how this
vowel is produced by SE speakers, but NURSE was also produced with a much
higher F2 by SE listeners and this is not entirely clear in the present perception
results. As for TRAP, SSBE speakers were found to produce this vowel with a
marginally significant higher F2 than SE speakers in Study I and a comparable
5. Study II: The use of spectral properties in the identification of English monophthongs by SSBE
and SE listeners
122
difference can be seen in the labelling of the auditory stimuli. There appears to
be a difference in the average F2 of the vowel KIT, with SE listeners preferring
a higher F2. In the production task, no such difference was found on the F2
dimension, although a marginal difference between SSBE and SE speakers was
found on the F1 dimension.
For the remaining four monophthongs FLEECE, DRESS, GOOSE and FOOT,
only very small differences between the SSBE and SE listeners are visible.
While it might be expected that there are no differences in listeners’ average
F1 and F2 values of some monophthongs, e.g., FLEECE and DRESS which are
mirrored in production, it is surprising that there are only marginal
differences between SSBE and SE listeners’ average F1 and F2 for GOOSE and
FOOT values considering that very large differences were found between these
monophthongs in production. That is, in Study I, SE speakers produced both
GOOSE and FOOT with considerably lower F2 values than SSBE speakers, but
this does not appear to be reflected in the present perception results.
5.4. Discussion
While correspondences have been found between the perception of the
spectral properties of the synthetic stimuli and the spectral properties of
vowels as produced in real speech, a degree of caution is necessary when
generalising the results of the present experiment to how listeners may
perceive real speech sounds. The tokens used as stimuli were synthetic vowel
sounds and therefore did not match entirely the features found in real speech
(Ter Schure et al., 2011). The most significant limitation is that the formants in
the vowel stimuli were quite static and therefore did not capture the dynamic
spectral properties exhibited by some American English monophthongs
(Hillenbrand and Nearey, 1999). It is not yet clear how important formant
movement is in the identification of monophthongs by native British English
listeners and how this acoustic cue might vary depending on the particular
vowel in question, since this has only been indirectly investigated before (e.g.,
Iverson and Evans, 2007). The stimuli did include varying F1 and F2 values
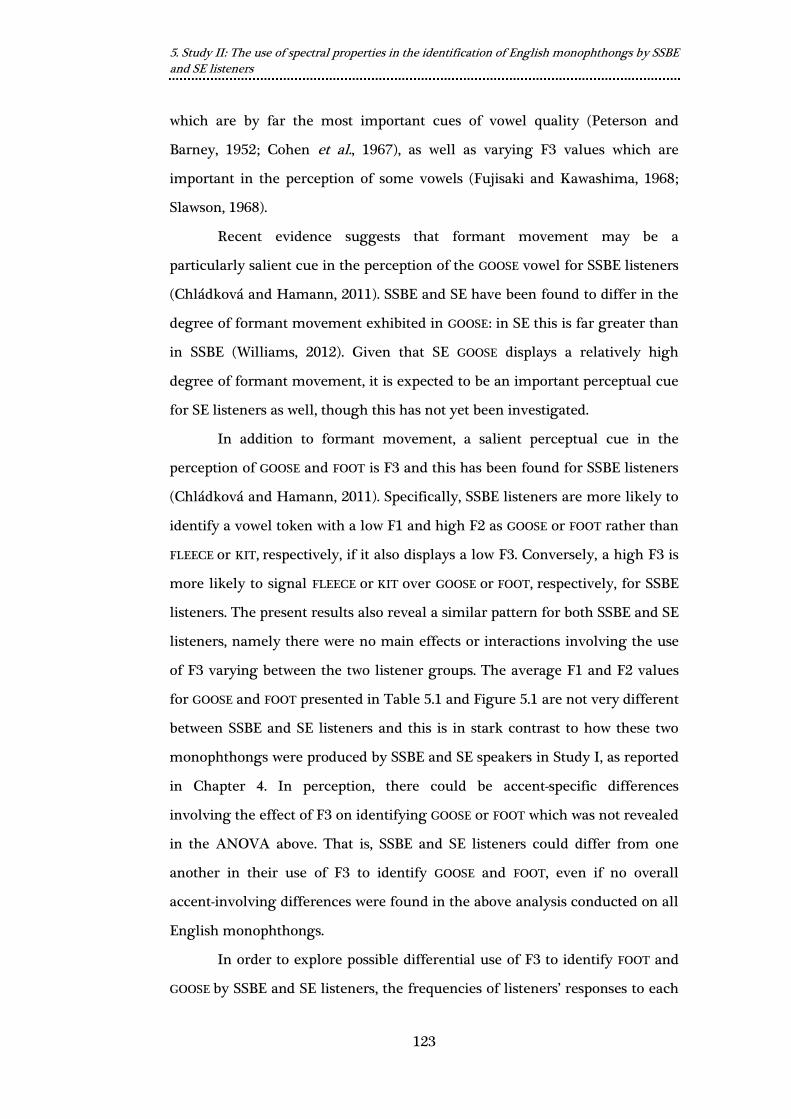
5. Study II: The use of spectral properties in the identification of English monophthongs by SSBE
and SE listeners
123
which are by far the most important cues of vowel quality (Peterson and
Barney, 1952; Cohen et al., 1967), as well as varying F3 values which are
important in the perception of some vowels (Fujisaki and Kawashima, 1968;
Slawson, 1968).
Recent evidence suggests that formant movement may be a
particularly salient cue in the perception of the GOOSE vowel for SSBE listeners
(Chládková and Hamann, 2011). SSBE and SE have been found to differ in the
degree of formant movement exhibited in GOOSE: in SE this is far greater than
in SSBE (Williams, 2012). Given that SE GOOSE displays a relatively high
degree of formant movement, it is expected to be an important perceptual cue
for SE listeners as well, though this has not yet been investigated.
In addition to formant movement, a salient perceptual cue in the
perception of GOOSE and FOOT is F3 and this has been found for SSBE listeners
(Chládková and Hamann, 2011). Specifically, SSBE listeners are more likely to
identify a vowel token with a low F1 and high F2 as GOOSE or FOOT rather than
FLEECE or KIT, respectively, if it also displays a low F3. Conversely, a high F3 is
more likely to signal FLEECE or KIT over GOOSE or FOOT, respectively, for SSBE
listeners. The present results also reveal a similar pattern for both SSBE and SE
listeners, namely there were no main effects or interactions involving the use
of F3 varying between the two listener groups. The average F1 and F2 values
for GOOSE and FOOT presented in Table 5.1 and Figure 5.1 are not very different
between SSBE and SE listeners and this is in stark contrast to how these two
monophthongs were produced by SSBE and SE speakers in Study I, as reported
in Chapter 4. In perception, there could be accent-specific differences
involving the effect of F3 on identifying GOOSE or FOOT which was not revealed
in the ANOVA above. That is, SSBE and SE listeners could differ from one
another in their use of F3 to identify GOOSE and FOOT, even if no overall
accent-involving differences were found in the above analysis conducted on all
English monophthongs.
In order to explore possible differential use of F3 to identify FOOT and
GOOSE by SSBE and SE listeners, the frequencies of listeners’ responses to each

5. Study II: The use of spectral properties in the identification of English monophthongs by SSBE
and SE listeners
124
of the 582 vowel stimuli were examined. That is, the average number of times
a listener labelled a synthetic vowel stimulus as FOOT or GOOSE. Figures 5.2 and
5.3 below display the overall frequency of responses to each vowel stimulus
involving FOOT and GOOSE labels, respectively, as a percentage of total
responses per stimulus per accent group. Each rectangle represents one of the
582 synthetic vowel stimuli. The blank rectangles are the vowel stimuli that
received labels other than GOOSE or FOOT most of the time and the red-shaded
rectangle represent vowel stimuli that were given the label FOOT (Figure 5.2)
or GOOSE (Figure 5.3); the degree of shading corresponds to the percentage of
times a particular stimulus was labelled as either FOOT or GOOSE. Recall that
the vowel stimuli were presented with three possible F3 values (see method in
section 3.6), hence Figures 5.2 and 5.3 show the FOOT and GOOSE responses to
the stimuli per F3 value. In the figures, ‘Low’ refers to the vowel stimuli with
an F3 of 23.72 Mel (= 2,708 Hz), ‘Medium’ refers to 24.97 Mel (= 3,131 Hz) and
‘High’ corresponds to 26.21 Mel (= 3,611 Hz). In Figures 5.2 and 5.3, the FOOT
and GOOSE vowel categories form clear clusters in the F1 and F2 vowel space
and this also appears to be affected somewhat by F3 of the vowel stimulus,
similar to the effect reported by Chládková and Hamann (2011) mentioned
earlier. GOOSE spans the uppermost portion of the F1-F2 space (Figure 5.3),
whereas FOOT covers a space directly below GOOSE and takes up less of the
front F1-F2 space as indicated by generally lower F2 values (Figure 5.2).
Figure 5.2 suggests that SE FOOT occupies a much larger area of the F1-
F2 space than SSBE FOOT. F3 has a clear effect on FOOT responses for both
SSBE and SE listeners, but the effect of F3 on responses by SSBE listeners
appears to be greater. That is, as F3 decreases, it is more likely the vowel
stimulus will be identified as FOOT. For SE listeners, on the other hand, this
effect of F3 is far weaker if apparent at all (compare the three rows in Figure
5.2). Thus it appears that F3 may well be a much more salient cue in the
identification of FOOT for SSBE listeners than SE listeners.
Identifying the vowel stimuli as GOOSE also seems to be affected by F3.
Specifically, as F3 increases GOOSE has a decreasing F2. The F1-F2 space
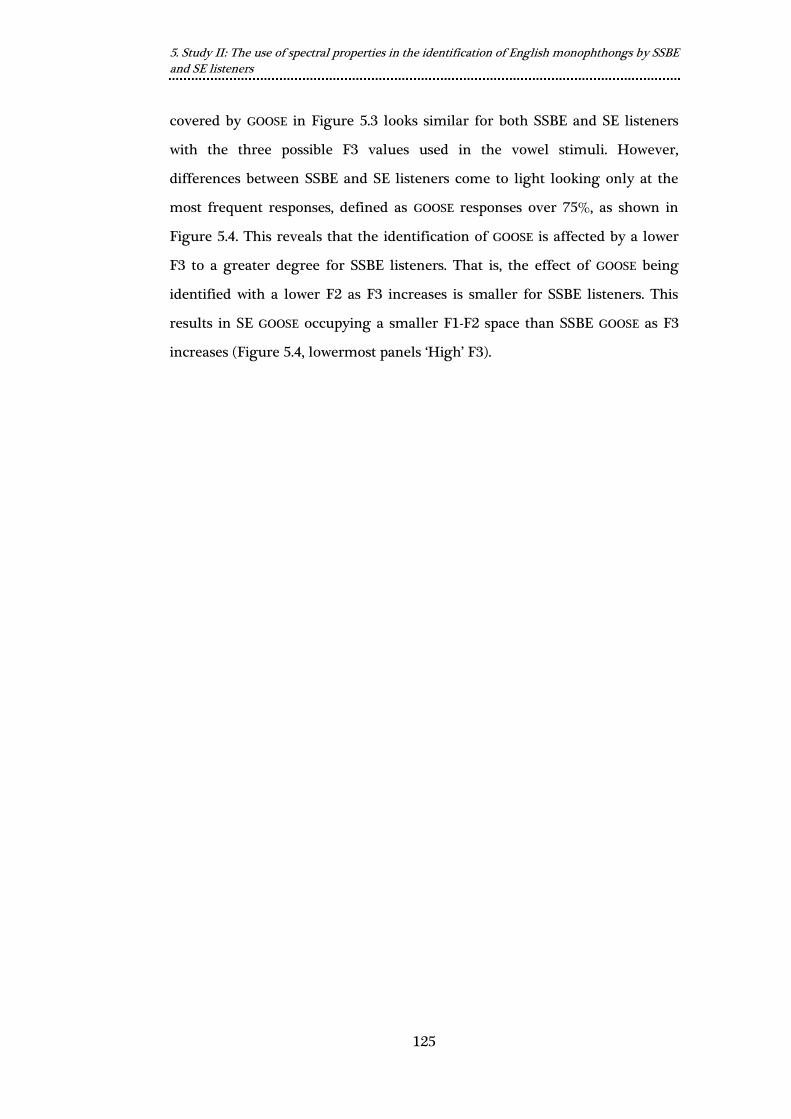
5. Study II: The use of spectral properties in the identification of English monophthongs by SSBE
and SE listeners
125
covered by GOOSE in Figure 5.3 looks similar for both SSBE and SE listeners
with the three possible F3 values used in the vowel stimuli. However,
differences between SSBE and SE listeners come to light looking only at the
most frequent responses, defined as GOOSE responses over 75%, as shown in
Figure 5.4. This reveals that the identification of GOOSE is affected by a lower
F3 to a greater degree for SSBE listeners. That is, the effect of GOOSE being
identified with a lower F2 as F3 increases is smaller for SSBE listeners. This
results in SE GOOSE occupying a smaller F1-F2 space than SSBE GOOSE as F3
increases (Figure 5.4, lowermost panels ‘High’ F3).
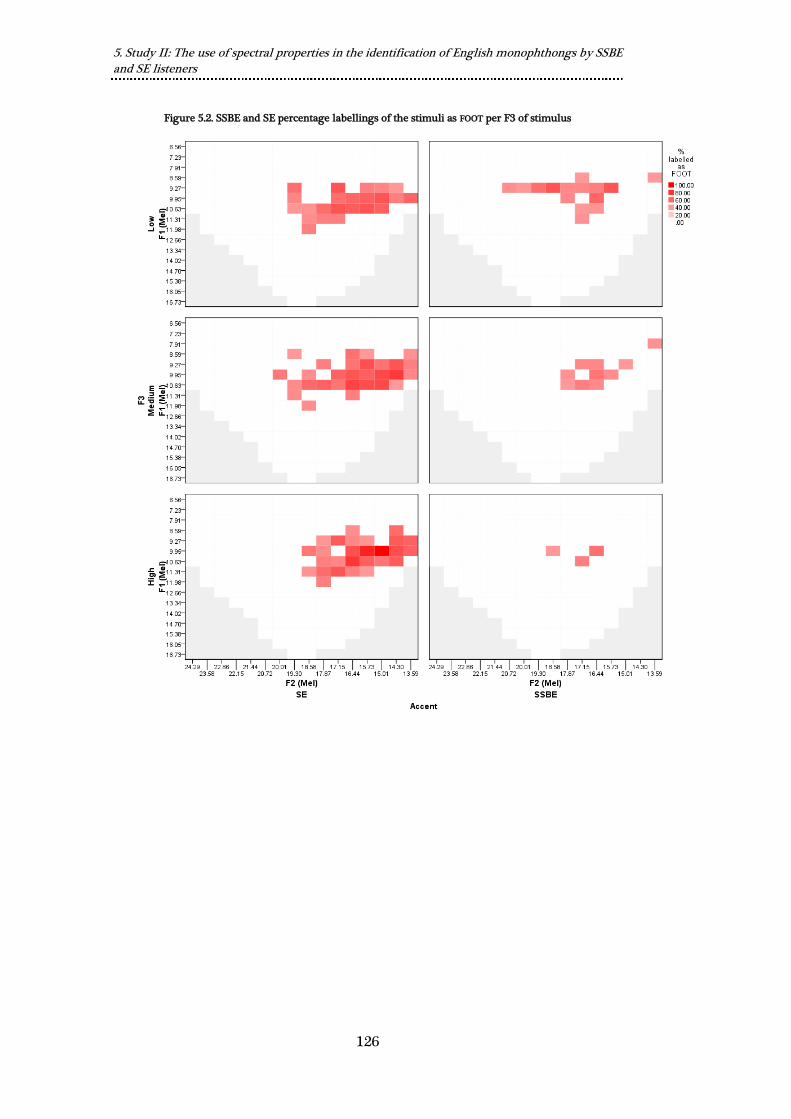
5. Study II: The use of spectral properties in the identification of English monophthongs by SSBE
and SE listeners
126
Figure 5.2. SSBE and SE percentage labellings of the stimuli as FOOT per F3 of stimulus
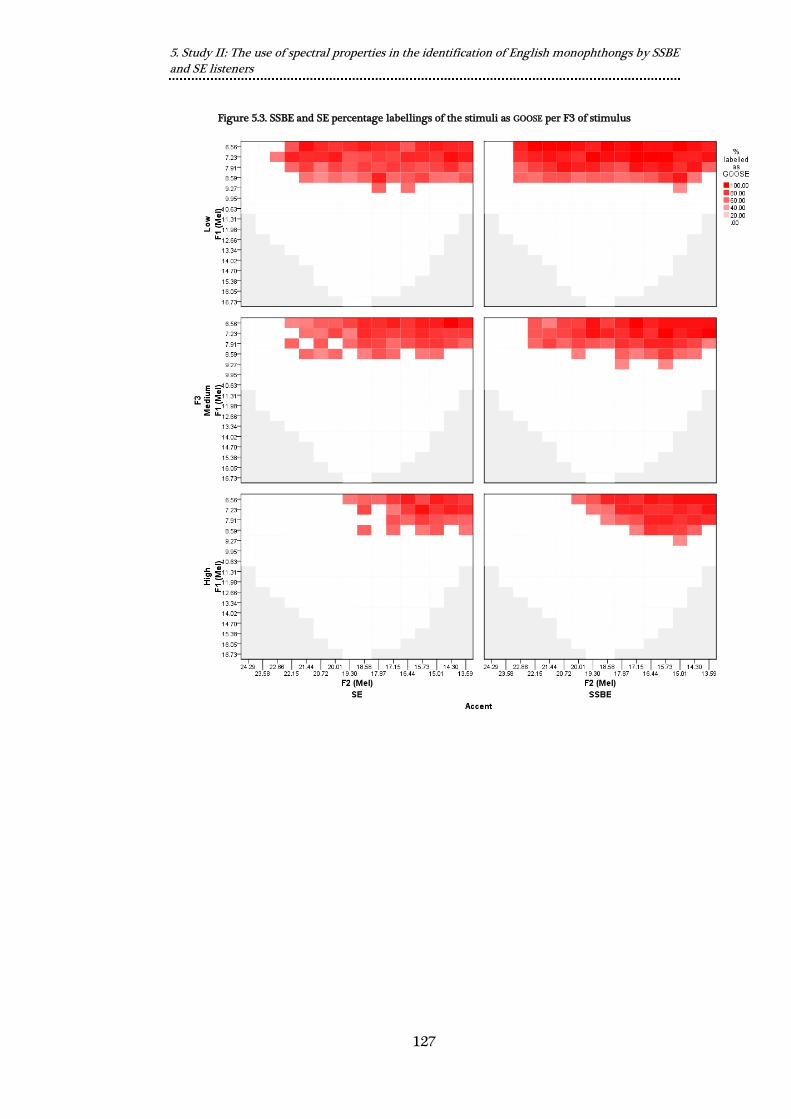
5. Study II: The use of spectral properties in the identification of English monophthongs by SSBE
and SE listeners
127
Figure 5.3. SSBE and SE percentage labellings of the stimuli as GOOSE per F3 of stimulus
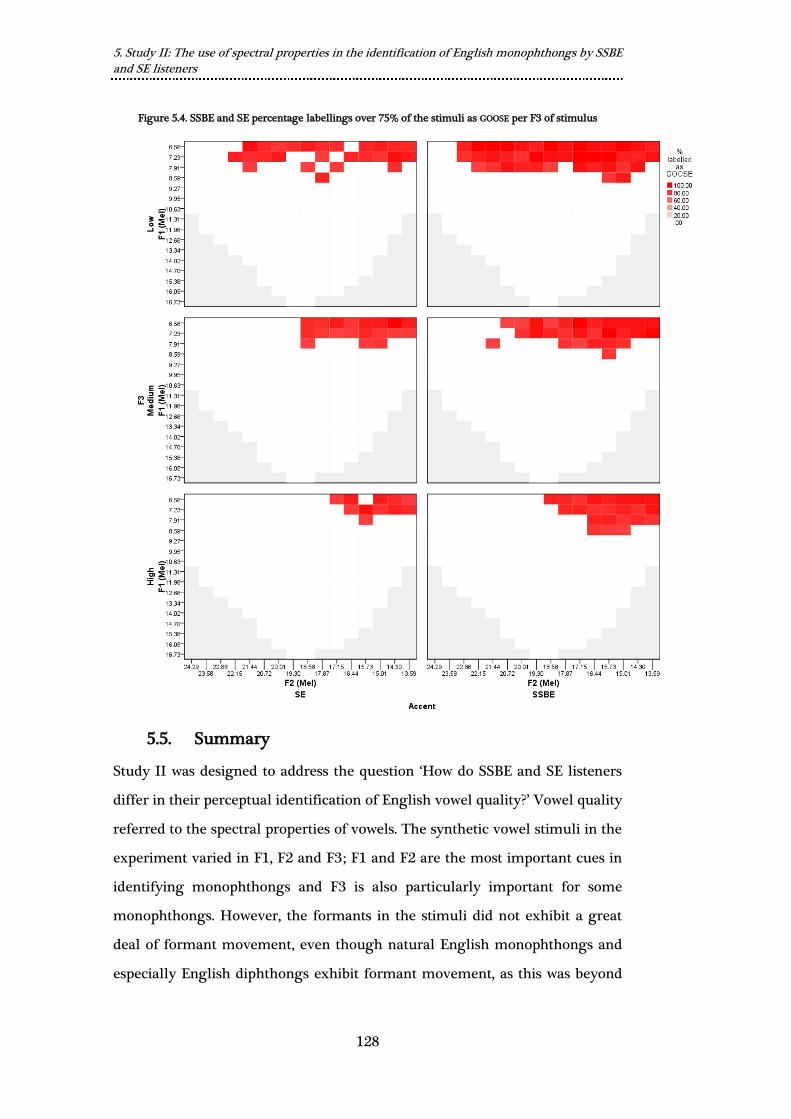
5. Study II: The use of spectral properties in the identification of English monophthongs by SSBE
and SE listeners
128
Figure 5.4. SSBE and SE percentage labellings over 75% of the stimuli as GOOSE per F3 of stimulus
5.5. Summary
Study II was designed to address the question ‘How do SSBE and SE listeners
differ in their perceptual identification of English vowel quality?’ Vowel quality
referred to the spectral properties of vowels. The synthetic vowel stimuli in the
experiment varied in F1, F2 and F3; F1 and F2 are the most important cues in
identifying monophthongs and F3 is also particularly important for some
monophthongs. However, the formants in the stimuli did not exhibit a great
deal of formant movement, even though natural English monophthongs and
especially English diphthongs exhibit formant movement, as this was beyond
5. Study II: The use of spectral properties in the identification of English monophthongs by SSBE
and SE listeners
129
the scope of the experiment design. The results show that the SSBE and SE
listeners identified each of the English monophthongs on average with
different F1, F2 and F3 values. The two accent groups reliably differed overall
in their use of F2 to identify the English monophthongs and there were also
some differences in their use of F1. The most notable differences between
SSBE listeners and SE listeners involved labelling the vowel stimuli as TRAP,
PALM, NURSE, LOT and THOUGHT. The differences in average F1 and F2 values
generally corresponded to the direction of F1 and F2 differences found in these
vowels’ production by SSBE and SE speakers as reported in Chapter 4. While
there were large differences between the average F2 values of SSBE and SE
speakers’ productions of the English monophthongs FOOT and GOOSE, the
initial examination of the results from Study II did not reveal such a
correspondingly large difference in listeners’ use of this formant in their vowel
identification. Further analysis focusing on F3 suggested that for these two
monophthongs there were some differences between the two accent groups’
use of F3. While F3 undoubtedly is an important cue for both groups, a low F3
appears to be a stronger or more salient cue to identifying FOOT and GOOSE for
SSBE listeners than for SE listeners, which is supported by previous evidence
for SSBE listeners (Chládková and Hamann, 2011). In addition, GOOSE has been
found to display some degree of formant movement in SSBE and SE (Williams,
2012) and this could be a perceptual cue to this vowel for SSBE listeners
(Chládková and Hamann, 2011). As recent evidence has also found that GOOSE
is produced with a greater degree of formant movement in SE (Williams, 2012),
formant movement could also be a perceptual cue for SE listeners.
Nevertheless, as the synthetic stimuli in Study III did not include a great deal
of formant movement, the effect of this on the perception of GOOSE by SSBE
and SE listeners and any possible differences between the two accent groups
cannot be ruled out.

6. Study III: Discrimination of five NSD vowel contrast by SSBE and SE listeners
130
6.
Study III: Discrimination of five
NSD vowel contrasts by SSBE and
SE listeners
6.1. Introduction to Chapter 6
This chapter reports on the results of Study III which investigated categorical
discrimination of five NSD vowel contrasts by SSBE and SE listeners.
Specifically, this study focused on non-native perceptual discrimination
accuracy, i.e. how well listeners can differentiate two contrasting non-native
(i.e., NSD) vowels. Models on cross-language speech perception, such as PAM,
state that the perceptual similarity of two contrasting non-native vowels to
native vowel categories can predict the relative ease or difficulty in
perceptually discriminating the two non-native sounds from one another. The
five non-native vowel contrasts were NSD /ɑ-ɔ/, /ʌu-œy/, /ø-o/, /i-ɪ/ and /u-y/
which were selected because they were found by Williams (2010) to be the
most problematic for English learners of Dutch to identify and to discriminate
out of the other possible NSD vowel pairings. The present study involved an
AXB discrimination task in which listeners were presented with two vowel
stimuli from the same non-native category and one vowel stimulus from the
contrasting non-native vowel category (see method in 3.7). Listeners were
asked to choose whether the first (A) or third vowel stimulus (B) was the same
as the second vowel stimulus (X). Recent studies have shown that
discrimination accuracy of vowel contrasts in a non-native language can be
affected by native accent or dialect of listeners and that this also depends on
the non-native contrast in question (Escudero and Williams, 2012). Given the
differences in vowel production and perception uncovered thus far in Study I
and Study II, respectively, the present study is expected to find effects of
listeners’ native accent.

6. Study III: Discrimination of five NSD vowel contrast by SSBE and SE listeners
131
6.2. Results
As each listener was presented with each of the five NSD contrasts 40 times in
an AXB format, the number of correct responses per NSD contrast (i.e., when a
listener’s response (A or B) was indeed from the same NSD vowel category as
the X vowel stimulus) were tallied to create a score out of 40. The correct
responses were then converted into percent correct scores for each listener and
the medians of these scores for each listener group are presented in Table 6.1.
Thus if a listener correctly discriminated all 40 instances of a particular vowel
contrast, they would have achieved a 100% accuracy score. These percent
correct scores were used in the following analysis to determine discrimination
accuracy.
Table 6.1. Median discrimination accuracy (percent correct) scores for the five NSD vowel contrasts by
listener group
NSD
contrast
Median % correct scores
SE (N = 20) SSBE (N = 17)
ɑ-ɔ 85 85
ʌu-œy 71 82
ø-o 72 85
i-ɪ 72 72
u-y 78 85
All contrasts 75 82
On all five contrasts, SSBE and SE listeners scored well above chance on
average (i.e., over 50%), indicating relatively good discrimination accuracy.
However, listeners did not perform equally well on all five contrasts. Listeners
found the vowels in the NSD contrast /i-ɪ/ most difficult to discriminate, as
shown by the lowest median accuracy scores of 72% correct for SSBE and SE
listeners, whereas the vowels in the NSD contrast /ɑ-ɔ/ were least difficult to
discriminate, with scores of 85% for both groups. The fact that the five contrast
posed different levels of difficult is clear in Figure 6.1. Furthermore, it appears
that SSBE listeners outperformed SE listeners in their discrimination accuracy
for some of the NSD contrasts. A closer examination of the results reveals that
there are differences between the two listener groups in their percent correct
scores for the two NSD contrasts /ʌu-œy/ and /ø-o/, which are clearly visible in
the boxplots displayed in Figure 6.1. SE listeners had greater difficulty
6. Study III: Discrimination of five NSD vowel contrast by SSBE and SE listeners
132
discriminating NSD /ʌu-œy/ and /ø-o/, with SE listeners scoring 71% and 72%
correct on average, respectively, and SSBE listeners scoring 82% and 85%
correct on average, respectively. There is also a smaller difference between
SSBE and SE listeners in their discrimination accuracy of the vowels in the
NSD contrast /u-y/, as demonstrated by the median percent correct of 85% for
SSBE listeners and 78% for SE listeners.
In order to test for any differences in discrimination accuracy scores on
the five NSD contrasts between the two listener groups, a repeated-measures
ANOVA was run on arcsine-transformed percent correct scores with NSD
vowel contrast coded as a within-subjects factor (five levels for the five vowel
contrasts) and accent group coded as a between-subjects factor (two levels for
two accent groups). The analysis revealed a significant main effect of vowel
contrast (F[4,140] = 22.71; p < 0.001), confirming that percent correct scores
varied per vowel contrast, as can be seen in Figure 6.1. There was also a
significant vowel contrast X accent group interaction (F[4,140] = 3.51; p =
0.009), suggesting that variation in percent correct scores over the five
contrasts differed for SE and SSBE listeners, as has been observed above. In
addition, there was a significant main effect of accent group (F[1,35] = 4.37; p =
0.044), suggesting SE listeners’ scores were indeed generally lower than SSBE
listeners’ scores, as reflected by the large difference in the overall median
percent correct scores displayed in Table 6.1 above.

6. Study III: Discrimination of five NSD vowel contrast by SSBE and SE listeners
133
Figure 6.1. Boxplots showing discrimination accuracy (percent correct) scores for SE and SSBE listeners
The boxes represent the quartile ranges of discrimination accuracy scores with the whiskers showing the
range and outliers displayed as circles. Median discrimination accuracy scores for each of the contrasts are
shown as thick black lines.
6.3. Discussion
Given that these five NSD vowel contrasts targeted in the experiment were
found to be particularly difficult for learners of Dutch, as reported in Williams
(2010), it is surprising that the naïve listeners in the present study were
relatively accurate overall, generally scoring significantly above chance on
each contrast with average scores ranging from 71% to 85%. Some listeners
even achieved near-ceiling scores on the four contrasts NSD /ɑ-ɔ/, /ʌu-œy/, /ø-
o/ and /u-y/, as can be seen by the quartile ranges in Figure 6.1 above. However,
no listener achieved near-ceiling scores on the NSD contrast /i-ɪ/ and some
listeners discriminated these vowels at around chance level, indicating that
this was clearly the most difficult contrast for all listeners. SE listeners
generally achieved lower accuracy scores than SSBE listeners, especially for
the two NSD contrasts /ʌu-œy/ and /ø-o/ but also for NSD /u-y/ to a lesser
extent. A more detailed discussion of the results focusing on the differences in
discrimination accuracy observed between SSBE and SE listeners is provided in
Chapter 8 in a comparison of the results from this study with those from the
next study, Study IV.
6. Study III: Discrimination of five NSD vowel contrast by SSBE and SE listeners
134
6.4. Summary
The experiment in Study III addressed the Question III ‘How accurately do
SSBE and SE listeners perceptually discriminate five NSD vowel contrasts?’
The five NSD vowel contrasts were /ɑ-ɔ/, /ʌu-œy/, /ø-o/, /i-ɪ/ and /u-y/ which
were selected because they have been previously reported to pose particular
perceptual problems for native English learners of Dutch. SSBE and SE
listeners were fairly accurate at discriminating these five contrasts but on the
whole SE listeners made more errors in discriminating most of the five
contrasts, although the size of the difference between the two listener groups
varied per contrast. For instance, both groups were least accurate at
discriminating the NSD contrast /i-ɪ/ and the largest differences in
discrimination accuracy scores between the two groups were found for the two
NSD contrasts /ʌu-œy/ and /ø-o/, with SE listeners making just over 10% more
errors than SSBE listeners, and a smaller average difference of around 7% was
found between the listener groups’ discrimination accuracy for the NSD
contrast /u-y/.
7. Study IV: Cross-language perceptual similarity of NSD vowels to English vowels by SSBE and
SE listeners
135
7.
Study IV: Cross-language
perceptual similarity of NSD vowels
to English vowels by SSBE and SE
listeners
7.1. Introduction to Chapter 7
This chapter presents the results of Study IV which investigated the perceptual
similarity of NSD vowels to English vowels by SSBE and SE listeners. This
study involved a cross-language perceptual assimilation task in which listeners
were presented with instances of non-native vowels and were asked to
categorise them into the perceptually most similar native English vowel
categories. The purpose of this study was to determine how SSBE and SE
listeners perceptually assimilate NSD vowels to different English vowel
categories and to what extent. The strength of assimilation was determined by
the frequency with which a listener selected a particular English vowel label
upon presentation of each NSD vowel. Models on cross-language speech
perception, such as PAM, posit that the assimilation patterns and the strength
of assimilation determine non-native discrimination accuracy. PAM’s claims
will be discussed below in section 7.3 in light of the perceptual assimilation
results of this study and predictions on discrimination accuracy are made in
the framework of PAM on the five NSD contrast involved in Study III. The
predictions resulting from this study are evaluated against the results of Study
III in Chapter 8.
7.2. Results
As listeners heard 20 instances of each NSD vowel, there were 20 English
vowel label responses per NSD vowel per listener. For each listener, the
number of times a particular English vowel label was selected was tallied per
NSD vowel and then converted into a classification percentage. For instance, if
7. Study IV: Cross-language perceptual similarity of NSD vowels to English vowels by SSBE and
SE listeners
136
a listener labelled 17 out of the 20 instances of the NSD vowel /ʌu/ as MOUTH
and labelled the remaining three instances as GOAT, the MOUTH responses for
this vowel would be calculated as 85% (i.e., 17/20) and the GOAT responses as
15% (i.e., 3/20). Table 7.1 shows the classification percentages averaged across
SSBE and SE listeners’ data separately. For the majority of the 15 NSD vowels,
both groups of listeners frequently selected more than one English vowel label,
suggesting that many NSD vowels were perceived to be similar to more than
one English vowel category. By looking at the classification percentages, it
becomes clear how similar each NSD vowel was perceived to be to the selected
English vowel label. While several English vowel labels may have been used
for each NSD vowel, there is usually just one that made up the majority of
responses, i.e., the modal response. For instance, SSBE and SE listeners selected
the label DRESS for NSD /ɛ/ much more often (52% and 54% of the time,
respectively) than they selected FOOT, KIT or NURSE (each < 15%).
Given that the experiment involved quite a large number of non-native
vowel categories and listeners were able to choose from a full range of
response options, it is not surprising that listeners made use of several English
vowel response options. Before any further analysis can take place, the
consistency of responses must be examined in order to establish whether there
was significant variation as a result of inter- and intra-listener differences.
Following the analysis of the results from a similarly designed perceptual
assimilation experiment reported in Levy (2009a) (that also included multiple
non-native vowels as stimuli and multiple English vowel label response
options), an internal consistency analysis was performed on the present results.
Internal consistency refers to the frequency of each listener’s modal response
to each NSD vowel regardless of the actual English vowel label.

7. Study IV: Cross-language perceptual similarity of NSD vowels to English vowels by SSBE and SE listeners
137
Table 7.1. Percentage of NSD vowel tokens classified in terms of 16 English vowel categories by SSBE and SE listeners
Only percentages over 5% are shown. * next to a NSD vowel indicates that there was a significant accent group difference in the multinomial logistic regression analysis.
Modal responses are shown in bold and underlined.
← N
SD
vow
el English vowel category
CHOICE DRESS FACE FOOT FLEECE GOAT GOOSE KIT LOT MOUTH NURSE PALM PRICE STRUT THOUGHT TRAP
SE
SSB
E
SE
SSB
E
SE
SSB
E
SE
SSB
E
SE
SSB
E
SE
SSB
E
SE
SSB
E
SE
SSB
E
SE
SSB
E
SE
SSB
E
SE
SSB
E
SE
SSB
E
SE
SSB
E
SE
SSB
E
SE
SSB
E
SE
SSB
E
ɑ * - - - - - - - - - - 7 - - - - - 37 23 - 6 - - 9 9 - - - 38 6 - 24 14
a * - - - - - - - - - - - - - - - - - - 7 - 6 6 34 20 - - - - 13 - 29 55
ʌu * - - - - - - - - - - 21 10 - - - - - - 56 81 - - - - - - - - 12 - - -
ɛ - - 54 52 - - 8 10 - - - - - - 5 7 - - - - 14 12 - - - - - 8 - - - -
e * - - - - 52 48 - - - 8 16 17 6 11 - - - - - - - - - - - - - - - - - -
ø - - - - 5 - - - - - 43 54 14 20 - - 8 - 17 15 - - - - - - - - - - - -
ɪ * - - 9 15 11 - 13 9 - - - - - 8 42 45 - - - - 13 6 - - - - - - - - - -
i - - 9 - - - - - 48 55 - - 7 12 22 20 - - - - - - - - - - - - - - - -
ɛi - - - - 40 47 - - - - 22 28 - - - - 6 - 12 20 - - - - 8 - - - - - - -
ɔ * - - - - - - 40 14 - - 23 18 7 8 - - 22 43 - - - - - - - - - - - 8 - -
u * - - - - - - 33 22 - - 12 11 43 51 - - - 7 - - - - - - - - - - - - - -
o * - - - - - - - - - - 66 69 - - - - 13 7 13 14 - - - - - - - - 6 - - -
ʏ * - - 6 10 - - 44 36 - - - - 9 11 6 - - - - - 23 20 - - - - - 13 - - - -
œy * - - - - - - - - - - 43 61 - - - - - - 42 30 - - - - - - - - - - - -
y * - - - - - - 22 14 - - - - 52 74 6 - - - - - 8 - - - - - - - - - - -
7. Study IV: Cross-language perceptual similarity of NSD vowels to English vowels by SSBE and
SE listeners
138
Internal consistency is calculated as the percentage of times a listener selected
their modal English vowel category per NSD vowel; a high internal
consistency score demonstrates a listener very frequently assigned the same
label to a particular NSD vowel. On the other hand, a low internal consistency
score indicates that a listener consistently chose several English vowel labels
for a particular NSD vowel. In order to compare internal consistency scores
between the two listener groups, an ANOVA was performed on all listeners’
internal consistency scores with accent group (two levels for the two groups) as
a between-subjects factor, but this did not reach significance (F[1,553] = 2.66; p
= 0.103), suggesting that there was no significant difference in internal
consistency scores between the two groups. Inspection of the data in Table 7.1
indicates that both SE and SSBE were generally only moderately consistent in
their perceptual assimilation patterns, with mean internal consistency scores of
60% for SE listeners and 63% for SSBE listeners. Such scores suggest listeners
chose more than one English vowel label for the majority of the 15 NSD
vowels. For each NSD vowel, there were on average two to three English vowel
labels selected. Despite this relatively diverse range of English vowel responses,
the modal response for each NSD vowel generally made up the majority of
responses for that vowel (at least half of responses), as indicated by the mean
internal consistency scores above.
In order to test for effects of NSD vowel on the classification
percentages between SSBE and SE listeners, an exploratory repeated-measures
ANOVA was run on their arcsine-transformed classification percentages with
NSD vowel (15 levels for the 15 NSD vowels) and English vowel label (16
levels for the 16 possible response options) coded as within-subjects factors and
accent group coded as a between-subjects factor (two levels). There was, as
expected, a main effect of NSD vowel (F[14ε, 490ε, ε = 0.92] = 10.46; p < 0.001),
indicating that listeners chose different English vowel labels to different
extents depending on which NSD vowel they heard. There was a main effect of
English vowel label (F[15ε, 525ε, ε = 0.0.47] = 39.31; p < 0.001), suggesting that
listeners differed in how often they used the labels, .i.e., some English vowel

7. Study IV: Cross-language perceptual similarity of NSD vowels to English vowels by SSBE and
SE listeners
139
labels were used more often than others. For instance, the labels PRICE and
CHOICE were seldom selected to label any NSD vowel, whereas FOOT, GOAT and
MOUTH were used to label several different NSD vowels. Importantly, the
analysis revealed a significant three-way interaction of NSD vowel X English
vowel label X accent group (F[210ε, 7,350ε, ε = 0.11] = 2.65; p < 0.001),
indicating that the two accent groups differed significantly in how often they
selected the English vowel labels for at least some of the NSD vowels.
The significant accent group-involving interaction in the ANOVA
prompted a more detailed analysis of the perceptual assimilation patterns in
order to determine how the two accent groups differed, i.e., in their choice of
English vowel labels and in their frequency of responses. For this, a
multinomial logistic regression model was fitted to the data. This analysis
predicts the probability of listeners selecting particular English vowel labels
for each of the 15 NSD vowels. In order to minimise significant differences
between the two listener groups being driven by infrequent or minor responses,
only those English vowel labels that were chosen 10% or more of the time for
a given NSD vowel by at least one of the two listener groups were included
(following a procedure on similar data reported in Levy, 2009a). For the
analysis to be run, a reference category, i.e., one of the English vowel labels,
must be used and for this purpose the SE listeners’ modal English vowel label
responses were arbitrarily chosen. The results of this analysis revealed that
perceptual assimilation patterns significantly differed as a function of accent
group for 11 of the 15 NSD vowels: /ɑ/ (χ2(2) = 204.88; p < 0.001), /a/ (χ2(2) =
61.50; p < 0.001), /ʌu/ (χ2(2) = 45.32; p < 0.001), /e/ (χ2(2) = 6.56; p = 0.038), /ɪ/
(χ2(4) = 42.90; p < 0.001), /ɔ/ (χ2(2) = 73.50; p < 0.001), /u/ (χ2(2) = 10.72; p =
0.005), /o/ (χ2(2) = 6.52; p = 0.038), /ʏ/ (χ2(3) = 70.47; p < 0.001), /œy/ (χ2(2) = 7.53;
p = 0.006) and /y/ (χ2(1) = 2.14; p < 0.001).
According to the above analysis, the perceptual assimilation patterns
for NSD /i, ø, ɛ, ɛi/ did not significantly differ as a function of accent group (p >
0.05). NSD /i/ was most often classified as FLEECE by SSBE and SE listeners, but

7. Study IV: Cross-language perceptual similarity of NSD vowels to English vowels by SSBE and
SE listeners
140
it was also assimilated to KIT some of the time and to GOOSE to a lesser extent.
NSD /ø/ was assimilated mainly to GOAT by SSBE and SE listeners, but also to
GOOSE and MOUTH to a lesser extent. NSD /ɛ/ was categorised most often as
DRESS by SSBE and SE listeners, but it was also assimilated to FOOT, KIT and
NURSE to a much smaller degree, and it was infrequently assimilated to STRUT
by SSBE listeners only. SSBE and SE listeners assimilated NSD /ɛi/ to FACE most
of the time and also to GOAT some of the time as well as to MOUTH; it was also
assimilated much less frequently to PRICE and LOT by SE listeners only. Despite
some small differences in the frequency of certain responses to NSD /ɛ/ and /ɛi/,
there were no reliable differences in the odds ratio (OR) of selecting a
particular English vowel label over the reference category (p > 0.05), as
outlined in the regression analysis above.
The remainder of this section examines in more detail the perceptual
assimilation patterns of the 11 NSD vowels /ɑ, a, ʌu, e, ɪ, ɔ, u, o, ʏ, œy, y/ that
were found to differ between SSBE and SE listeners. Schemas of the two
listener groups’ perceptual assimilations of the NSD monophthongs and the
NSD diphthongs to English vowel categories are presented in Figure 7.1 and
Figure 7.2, respectively. Below there is a focus on differences in the two listener
groups’ odds ratios of selecting a particular English vowel label over the
arbitrarily chosen reference category. In the odds ratios presented in the next
few subsections, values closer to 1 suggest a smaller chance of one listener
group differing from the other in their perceptual assimilation.
7.2.1. Perceptual assimilation of NSD /ɑ/
The perceptual assimilation patterns involving NSD /ɑ/ are not strongly
consistent for both SE and SSBE listeners as the modal English vowel label
responses were both less than 50% of responses. The lack of consistency
suggests that SE and SSBE listeners do not perceive NSD /ɑ/ to be greatly
similar to their modal responses, LOT (37% of the time) and STRUT (38% of the
time), respectively, since this NSD vowel was also perceived to be (albeit even

7. Study IV: Cross-language perceptual similarity of NSD vowels to English vowels by SSBE and
SE listeners
141
less) similar to other English vowel categories. The most striking difference
between the two listener groups was that their choice of modal English vowel
category response was different. Unsurprisingly, for the perceptual
assimilation of NSD /ɑ/ to STRUT versus that of the reference category LOT
there was a significant accent group difference in the estimated odds (OR =
0.004, p < 0.001), since SE listeners did not make use of the STRUT option.
Although SE listeners assimilated NSD /ɑ/ to TRAP 24% of the time and SSBE
listeners did so 14% of the time, there was no significant accent group
difference in selecting TRAP versus the reference category LOT (OR = 1.019, p =
0.984).
7.2.2. Perceptual assimilation of NSD /a/
SE and SSBE listeners differed in their modal responses for NSD /a/, with this
being PALM for SE listeners (34% of the time) and TRAP for SSBE listeners (55%
of the time). Notably, SE listeners were less consistent than SSBE listeners with
their modal response, representing less than half of responses. SSBE listeners
also selected PALM, but only did so 20% of the time, and SE listeners also
selected TRAP, but only 29% of the time. This led to a significant accent group
difference in the odds of perceptually assimilating NSD /a/ to TRAP versus the
reference category PALM (OR = 0.315, p < 0.001). Interestingly, SE listeners
sometimes assimilated NSD /a/ to THOUGHT (13% of the time), whereas SSBE
listeners did not do so at all, resulting in a significant accent group difference
for this assimilation pattern (OR = 2.02, p = 0.041). The difference in
consistency between SSBE and SE listeners’ modal responses suggests that
SSBE listeners perceived NSD /a/ to be a better match to their TRAP vowel than
SE listeners perceived this NSD vowel to be to their PALM vowel. In fact, SE
listeners perceived NSD /a/ to match both their TRAP and PALM vowels in more
or less equal proportions (29% and 34%, respectively), whereas SSBE listeners
had a much clearer preference for TRAP over PALM (55% versus 20%,
respectively). Thus, while both SE and SSBE listeners perceived NSD /a/ in
7. Study IV: Cross-language perceptual similarity of NSD vowels to English vowels by SSBE and
SE listeners
142
terms of TRAP and PALM, this NSD vowel is clearly more similar to one of the
categories for SSBE listeners (TRAP) but less so for SE listeners.
7.2.3. Perceptual assimilation of NSD /ʌu/
NSD /ʌu/ was strongly assimilated to MOUTH by SSBE listeners, accounting for
81% of labellings for this NSD vowel, whereas its assimilation to MOUTH by SE
listeners was somewhat weaker, accounting for 56% of responses. It appears
that this is because NSD /ʌu/ was also classified in terms of GOAT (21%) and
THOUGHT (12%) by SE listeners but much less often in terms of GOAT (10%)
and THOUGHT (4%) by SSBE listeners. Indeed, there were significant accent
group differences in the odds of assimilating NSD /ʌu/ to THOUGHT (OR =
4.316, p < 0.001) and GOAT (OR = 2.96, p < 0.001) compared to the reference
category MOUTH. The strength of assimilation to MOUTH by SSBE listeners
indicates that this NSD vowel was perceived to be a very good match, whereas
this NSD vowel seems less of a good match to MOUTH by SE listeners since it
was also partially perceptually similar to GOAT and THOUGHT.
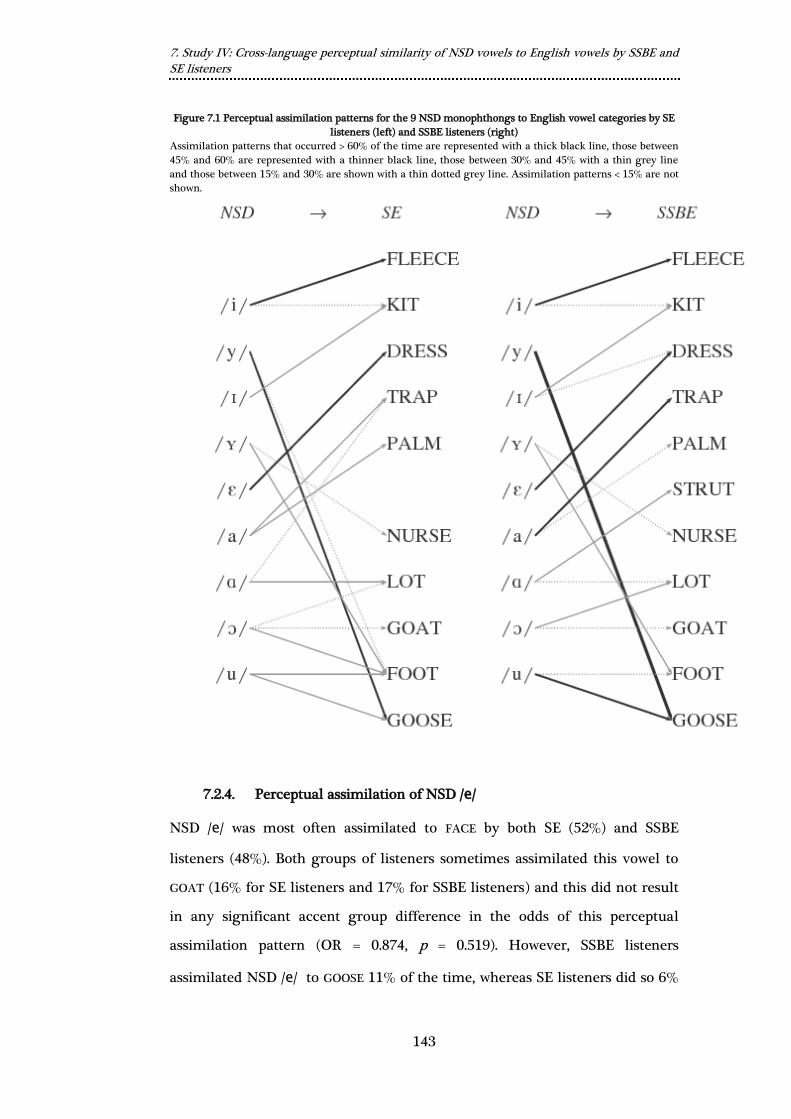
7. Study IV: Cross-language perceptual similarity of NSD vowels to English vowels by SSBE and
SE listeners
143
Figure 7.1 Perceptual assimilation patterns for the 9 NSD monophthongs to English vowel categories by SE
listeners (left) and SSBE listeners (right)
Assimilation patterns that occurred > 60% of the time are represented with a thick black line, those between
45% and 60% are represented with a thinner black line, those between 30% and 45% with a thin grey line
and those between 15% and 30% are shown with a thin dotted grey line. Assimilation patterns < 15% are not
shown.
7.2.4. Perceptual assimilation of NSD /e/
NSD /e/ was most often assimilated to FACE by both SE (52%) and SSBE
listeners (48%). Both groups of listeners sometimes assimilated this vowel to
GOAT (16% for SE listeners and 17% for SSBE listeners) and this did not result
in any significant accent group difference in the odds of this perceptual
assimilation pattern (OR = 0.874, p = 0.519). However, SSBE listeners
assimilated NSD /e/ to GOOSE 11% of the time, whereas SE listeners did so 6%
7. Study IV: Cross-language perceptual similarity of NSD vowels to English vowels by SSBE and
SE listeners
144
of the time, resulting in a significant accent difference in the odds of this
particular assimilation pattern (OR = 0.493, p = 0.012).
7.2.5. Perceptual assimilation of NSD /ɪ/
SSBE and SE listeners did not differ on their modal responses to NSD /ɪ/, as SE
listeners chose KIT 42% of the time and SSBE listeners chose this vowel label
45% of the time. In both cases, the modal response was moderately consistent
and thus the differences between SE and SSBE listeners mainly stemmed from
differences in the selection of English vowel category labels other than KIT. In
fact five other response options were used (DRESS, FACE, FOOD, GOOSE, NURSE).
The main differences were that SE listeners selected FACE 11% of the time,
whereas SSBE listeners did not make use of this option (OR = 6.92, p < 0.001),
and that SE listeners also assimilated NSD /ɪ/ to NURSE 13% of the time
whereas SSBE listeners did so only 6% of the time (OR = 2.22, p = 0.004). Both
SE and SSBE listeners assimilated NSD /ɪ/ to DRESS (9% for SE listeners and 15%
for SSBE listeners) and FOOT some of the time (13% for SE listeners and 9% for
SSBE listeners), but there were no significant accent differences in the odds of
these perceptual assimilation patterns versus selecting the reference category
KIT (DRESS: OR = 0.63, p = 0.63; FOOT: OR = 1.49, p = 0.119). The inconsistent use
of several response options by both SSBE and SE listeners suggests that both
groups had some level of difficulty trying to categorise NSD /ɪ/ in terms of a
single English vowel category, indicating it is only a moderately good fit to the
modal response category KIT.
7.2.6. Perceptual assimilation of NSD /ɔ/
SE and SSBE listeners differed greatly in their modal vowel category response
to NSD /ɔ/. This was FOOT for SE listeners (40%) and LOT for SSBE listeners
(43%). These modal responses are, however, only moderately consistent
because both listener groups made use of other English vowel labels some of
the time. SE listeners made use of the LOT label as well, but for only 20% of
7. Study IV: Cross-language perceptual similarity of NSD vowels to English vowels by SSBE and
SE listeners
145
responses, and SSBE listeners also selected FOOT but for only 14% of the time.
Unsurprisingly, there was a significant accent group difference in the odds of
perceptually assimilating NSD /ɔ/ to LOT over the reference category FOOT (OR
= 0.178, p < 0.001). Both groups of listeners also made some use of the GOAT
vowel label; for SE listeners this was 23% of the time and for SSBE listeners
this was 18% of the time and this assimilation pattern revealed a significant
accent group difference (OR = 0.446, p = 0.001).
7.2.7. Perceptual assimilation of NSD /o/
Both SE and SSBE listeners assimilated NSD /o/ to GOAT to similar extents,
accounting for 66% of SE responses and 69% of SSBE responses. Both groups
of listeners also assimilated this vowel to MOUTH to similar degrees, 13% and
14% for SE and SSBE listeners, respectively. Unsurprisingly, the accent
difference in the odds of this latter assimilation pattern did not reach
significance (OR = 0.947, p = 0.805). Puzzlingly, SE listeners selected LOT 13%
of the time whereas SSBE listeners did so only 7% of the time, resulting in a
significant accent group difference in the odds of this particular assimilation
pattern (OR = 1.89, p = 0.016).
7.2.8. Perceptual assimilation of NSD /ʏ/
As for NSD /ʏ/, both SSBE and SE listeners’ modal response category was the
same, namely FOOT. While the assimilation patterns were relatively
inconsistent for both groups of listeners, the assimilation to FOOT appears to be
strongest for SE listeners (44% for SE versus 36% for SSBE). Notably, SSBE
listeners made use of the STRUT option 13% of the time, whereas SE listeners
did not make use of this option, and there was therefore a significant accent
difference in the odds of this assimilation pattern (OR = 0.016, p < 0.001). SE
and SSBE listeners also assimilated NSD /ʏ/ to other vowel categories, namely
GOOSE and NURSE, but no significant accent group differences were found
(GOOSE: OR = 0.680, p = 0.137; NURSE: OR = 0.695, p = 0.925).

7. Study IV: Cross-language perceptual similarity of NSD vowels to English vowels by SSBE and
SE listeners
146
Figure 7.2. Perceptual assimilation patterns for the six NSD diphthongs to English voweL CATEgories by SE
listeners (left) and SSBE listeners (right)
Assimilation patterns that occurred > 60% of the time ARE represented with a thick black line, those between
45% and 60% are represented with a thinner black line, those betwEEN 30% and 45% with a thin grey line
and those between 15% and 30% are shown with a thin dotted grey line. Assimilation patterns < 15% are not
shown.
7.2.9. Perceptual assimilation of NSD /œy/
For NSD /œy/, both SE and SSBE listeners shared the same modal response
category GOAT, but differed in the frequency of choosing this English vowel
label, with SE listeners selecting it 43% of the time and SSBE listeners selecting
it more frequently at 61% of the time. Interestingly, SE listeners also
perceptually assimilated NSD /œy/ with virtually the same frequency to

7. Study IV: Cross-language perceptual similarity of NSD vowels to English vowels by SSBE and
SE listeners
147
MOUTH as they did to GOAT (42%), whereas SSBE listeners did so less frequently
(30%). The analysis revealed a significant accent difference in the odds of
assimilating NSD /œy/ to MOUTH compared to the reference category GOAT
(OR = 1.578, p = 0.006). Thus NSD /œy/ was assimilated equally to GOAT and
MOUTH for SE listeners, but more frequently to GOAT than MOUTH for SSBE
listeners (see Figure 7.2), indicating that NSD /œy/ was perceived to be a better
match to GOAT than MOUTH for SSBE listeners, whereas NSD /œy/ was an
equally good/poor match to MOUTH and GOAT for SE listeners.
7.2.10. Perceptual assimilation of NSD /y/
While both SSBE and SE listeners shared the same modal response GOOSE for
NSD /y/, it appears that there is a striking difference between the two accents’
assimilation frequencies: SSBE listeners selected GOOSE far more often than SE
listeners with 75% versus 52% of responses, respectively. Additionally, SE
listeners assimilated this NSD vowel to their FOOT category 22% of the time,
whereas SSBE listeners did so only 14% of the time. Indeed, there was a
significant accent group difference in the odds of assimilating NSD /y/ to FOOT
as compared to the reference category GOOSE (OR = 2.12, p < 0.001). These
patterns of assimilation suggest that this NSD vowel is perceptually a much
better match to GOOSE for SSBE listeners than it is for SE listeners.
7.2.11. Perceptual assimilation of NSD /u/
While the multinomial logistic regression analysis found that assimilation
patterns reliably differed as a function of accent group, no specific reliable
differences could be found in the odds ratios of SSBE listeners’ assimilation
patterns occurring compared to those of SE listeners. The difference could be
driven by SE listeners selecting FOOT more often than SSBE listeners, as
inspection of the data in Table 7.1 and Figure 7.1 show.

7. Study IV: Cross-language perceptual similarity of NSD vowels to English vowels by SSBE and
SE listeners
148
7.3. Discussion: PAM’s predictions on discrimination
SE and SSBE listeners’ assimilation patterns will now be discussed with
reference to Best’s (1995) PAM. Recall that the type of experiment involved in
this study was used to gauge the perceived similarity or dissimilarity between
phonetic properties of the non-native NSD vowel stimuli and those of the two
accent groups’ native vowel categories. PAM provides a framework to make
predictions on the discrimination accuracy for non-native contrasts on the
basis of assimilation types. PAM identifies six types: Two-Category
Assimilation (TC-Type), Category-Goodness Assimilation (CG-Type), both
Uncategorizable (UU-Type), Uncategorizable versus Categorized (UC-Type)
and Nonassimilable (NA-Type), all of which are outlined in Table 2.4 in
Chapter 2. As it is not possible to provide an exhaustive account on all NSD
vowel contrasts (there are over 100!), the present discussion is restricted to
classifying the five NSD contrasts /ɑ-ɔ/, /ʌu-œy/, /ø-o/, /i-ɪ/ and /u-y/ from Study
III in terms of PAM’s assimilation types. In doing so, it is possible to draw up
predictions on relative discrimination accuracy for each contrast and, where
relevant, any expected differences between SSBE and SE listeners. Whether
PAM’s predictions on discrimination accuracy were indeed borne out in Study
III is evaluated in Chapter 8.
Before the five NSD contrasts can be classified as one of PAM’s
assimilation types, each of the members of each contrast must be characterised
as ‘categorized’, ‘uncategorizable’ or ‘non-speech’ because PAM’s assimilation
types are based on these three assimilation patterns (see 2.4.2 in Chapter 2 for a
fuller description). As the design of the experiment in Study IV did not allow
for listeners to select a ‘non-speech’ option, the NA-Type assimilation is not
relevant here. Thus it only needs to be decided whether the members of each
of the five contrasts are ‘categorized’ or ‘uncategorizable’. According to PAM, a
‘categorized’ non-native speech sound is assimilated to a native category and
can be perceived as being a very good to a deviant match, whereas an
‘uncategorizable’ speech sound falls within native phonological space but is not

7. Study IV: Cross-language perceptual similarity of NSD vowels to English vowels by SSBE and
SE listeners
149
assimilated to any specific native category. In other words, a ‘categorized’ non-
native speech sound maps onto a native phonological category, whereas an
‘uncategorizable’ speech does not. As for interpreting experimental data, this
distinction has been operationalised in various ways, including being omitted
altogether. For instance, in a perceptual assimilation task reported in Best et al.
(2001), a non-native sound is ‘uncategorizable’ if listeners wrote down
something such as ‘between native sound X and native sound Y’ in their
responses to the non-native stimuli, though no listener actually did this since
they classified all the non-native sounds in terms of concrete native categories.
Harnsberger (2001) made the distinction based on listeners’ classification
percentages – a non-native sound was ‘uncategorizable’ if it was assimilated
less than 90% of the time and ‘categorized’ is it was assimilated more than 90%
of the time. This high cut-off led many of the non-native speech sounds being
classed as ‘uncategorizable’. Since the present study did not use orthographic
responses in the same way as Best et al. (2009), adopting that particular
approach is not possible. The high 90% cut-off used by Harnsberger (2001) is
also not particularly suitable for the present study, given that the average
internal confidently scores for SSBE and SE listeners were 63% and 60%,
respectively. Other approaches, such as Levy (2009b), abandon classing non-
native contrasts in terms of PAM’s assimilation types in favour of only
focusing on perceptual overlap, i.e., the degree to which the two members of a
non-native contrast are perceived as being similar to native categories, as this
alone can be used to predict discrimination accuracy.
As noted in 7.2 above, the results from Study IV suggest that, while
NSD vowels were perceived as being similar to more than one native category,
the modal responses did generally form a majority of responses, indicating a
clear preference for a single native category but at the same time a smaller
degree of perceptual similarity to one or more other native categories. For the
present results, it therefore seems reasonable to use a relative approach rather
than the absolute approach of Harnsberger (2001) to determine whether a non-
native speech sound can be viewed as ‘categorized’ or ‘uncategorizable’. In the

7. Study IV: Cross-language perceptual similarity of NSD vowels to English vowels by SSBE and
SE listeners
150
following subsections, an NSD vowel is regarded as ‘categorized’ if the modal
response was selected with at least double the frequency of the next most
popular response. This ensures the clearness of listeners’ preference for the
modal response. If this criterion is not met, then the NSD vowel is deemed
‘uncategorizable’, since the modal response does not form a clear majority and
the next most popular response was also relatively frequently selected. In line
with Levy (2009b), there will also be a focus on perceptual overlap in addition
to PAM’s assimilation types.
7.3.1. PAM’s predictions on discrimination of NSD /ɑ-ɔ/
The two listener groups displayed remarkably different assimilation patterns
for the two NSD vowels /ɑ/ and /ɔ/: SE listeners’ modal response for /ɑ/ was LOT,
while SSBE listeners’ was STRUT, meaning this NSD vowel assimilated to
different English phonological vowel categories by SE and SSBE listeners.
However, the strength of the assimilation for both listener groups was only
moderate because the NSD vowel also assimilated to TRAP for both SE and
SSBE listeners and it was also assimilated to LOT for SSBE listeners. The
observed pattern of results suggests that both SE and SSBE listeners perceived
NSD /ɑ/ to be phonetically a low and back vowel, like SSBE STRUT and SE LOT,
but also perhaps even lower like TRAP. The diverse assimilation patterns
involving NSD /ɑ/ are confirmed by the fact the the modal responses for both
SSBE and SE listeners are less than double the next most popular responses,
suggesting that this NSD vowel is an example of an ‘uncategorized’ non-native
vowel in PAM by falling somewhere between native phonological categories.
Despite there being one native category that is perceptually most similar there
are further native categories that are also relatively perceptually similar (Best
et al., 2001).
As with NSD /ɑ/, SE and SSBE listeners exhibited different modal
responses to NSD /ɔ/, with SE listeners choosing FOOT and SSBE listeners
choosing LOT. SE and SSBE listeners perceived this NSD vowel to native

7. Study IV: Cross-language perceptual similarity of NSD vowels to English vowels by SSBE and
SE listeners
151
categories that are also back and high. This NSD vowel can also be considered
an example of an ‘uncategorized’ vowel since the modal response categories
did not make up more than twice the responses of the next most popular
response categories, highlighting that this NSD vowel frequently assimilated
to more than one category for both listener groups.
Since both NSD /ɑ/ and /ɔ/ can be considered ‘uncategorized’ vowels for
both listener groups, the NSD /ɑ-ɔ/ contrast can be regarded as an example of
PAM’s uncategorized-uncategorized (UU-Type) assimilation pattern (Table 2.4
in Chapter 2). A basic tenet of PAM is that native phonetic and phonological
knowledge should aid discrimination when two non-native sounds are
separated by native phonological boundaries but not so if both sounds are
assimilated to the same native category. UU-Type assimilations, according to
PAM, are less strongly affected by phonological equivalence classes, predicting
that discrimination ranges from fair to good depending on the perceived
similarity of non-native sounds to each other and to the set of nearby native
categories (Best et al., 2001). As there have been few investigations on UU-
Type assimilations, no established precedent exists from which testable
predictions can be formed (e.g., as asserted by Harnsberger, 2001) unlike the
other types of assimilation described in PAM. Note also that another model
involving cross-language speech perception, Escudero’s (2005) L2LP, would not
construe the present vowels in this NSD contrast as both ‘uncategorizable’
because it allows multiple category assimilation, i.e., that fact that both non-
native vowels assimilated to more than one native category.
Although the assimilation patterns between SSBE and SE listeners are
different in that the most selected English vowel categories are different for
both members of the NSD /ɑ-ɔ/ contrast, the frequencies are remarkably
similar, suggesting that discrimination will also be similar for both SE and
SSBE listeners. For both listener groups, NSD /ɑ/ and /ɔ/ were not frequently
assimilated to the same single native category. The only native vowel category
where the assimilation patterns for NSD /ɑ/ and /ɔ/ overlapped was for LOT: SE

7. Study IV: Cross-language perceptual similarity of NSD vowels to English vowels by SSBE and
SE listeners
152
listeners assimilated NSD /ɑ/ and /ɔ/ to LOT 37% and 22% of the time,
respectively, and SSBE listeners did so 23% and 40% of the time, respectively.
While SE and SSBE listeners might therefore perceive some similarity between
NSD /ɑ/ and /ɔ/, listeners also detected phonetic information that made these
two NSD vowels distinct from one another by being perceived as similar to
further separate native categories. On this basis, it is expected that
discrimination accuracy will be moderate to good.
It is a novel finding that discrimination is expected to be similar for the
two accent groups despite different modal responses in their assimilation
patterns. This is due to the frequencies with which the two modal responses
were selected are roughly the same, indicating the same degree of perceptual
assimilation.
7.3.2. PAM’s predictions on discrimination of NSD /ʌu-œy/
SE and SSBE listeners most frequently assimilated NSD /ʌu/ to MOUTH, but the
degree of perceptual similarity varied between the two groups: NSD /ʌu/ was
consistently perceived to be similar to MOUTH by SSBE listeners but much less
so by SE listeners, as it was also assimilated to GOAT and THOUGHT some of the
time. For SE and SSBE listeners, NSD /ʌu/ may be considered a ‘categorized’
exemplar of MOUTH, the modal response, because the next most popular
response option occurred with less than half the frequency of this. However,
NSD /ʌu/ is notably a poorer match to MOUTH for SE listeners since it also
assimilated to goat some of the time, whereas NSD /ʌu/ may be regarded as a
very good exemplar of MOUTH for SSBE listeners.
NSD /œy/ was assimilated fairly strongly to two native categories for
both listener groups, which is reflected by the fact that the modal response
GOAT does not make up twice the amount of responses as the next most
popular response MOUTH, suggesting this is an example of an ‘uncategorized’
speech sound. However, SE and SSBE listeners perceived NSD /œy/ to be
7. Study IV: Cross-language perceptual similarity of NSD vowels to English vowels by SSBE and
SE listeners
153
similar to GOAT to different degrees as NSD /œy/ was perceived to be a better
match by SSBE listeners and a poorer exemplar of GOAT by SE listeners.
The assimilation patterns involving the NSD contrast /ʌu-œy/ can be
viewed as a UC-Type in PAM since NSD /ʌu/ was categorised mainly as MOUTH
while NSD /œy/ was assimilated mainly to more than one category (i.e., the
modal response GOAT did not make up twice the number of responses as the
next most popular category MOUTH). Given this is a UC-Type, both listener
groups should be able to discriminate the two NSD vowels reasonably well, but
not with excellent accuracy due to the overlap in perceptual similarity that
both NSD /ʌu/ and NSD /œy/ have with MOUTH and GOAT.
There are, however, some important differences between the two
listener groups regarding the degree of perceptual similarity, as judged by the
frequency of responses, which is predicted to have an effect on discrimination.
Firstly, NSD /ʌu/ was assimilated to MOUTH 81% of the time by SSBE listeners
but only 56% of the time by SE listeners. Secondly, NSD /œy/ was also
assimilated to MOUTH 42% of the time by SE listeners and 30% of the time by
SSBE listeners. While there is some overlap in perceptual similarity exhibited
by both groups, this is much larger for SE listeners. Looking at the other
assimilation patterns involving NSD /œy/ also reveals greater overlap in
similarity for SE listeners since this vowel assimilated to GOAT 43% of the time
and NSD /ʌu/ also assimilated to GOAT 21% of the time. SSBE listeners, on the
other hand, perceived NSD /œy/ to be more similar to GOAT than SE listeners
(61% of the time) but also perceived NSD /ʌu/ to be less similar to GOAT than
SE listeners (10% of the time). The differences in degrees of perceptual
similarity involving NSD /ʌu-œy/ are clearly illustrated in Figure 7.2. Taken
together, the vowels in the NSD /ʌu-œy/ contrast assimilate more strongly to
separate native vowel categories for SSBE listeners, especially the perceived
goodness of fit of NSD /ʌu/ to MOUTH, than for SE listeners, for whom there is

7. Study IV: Cross-language perceptual similarity of NSD vowels to English vowels by SSBE and
SE listeners
154
a greater level of perceptual overlap. Within the framework of PAM, this UC-
Type assimilation operates in slightly different ways for the two groups of
listeners: the perceptually poorer fit of NSD /ʌu/ to MOUTH for SE listeners and
the greater degree of perceptual overlap between NSD /ʌu/ and /œy/ involving
GOAT suggest that SE listeners will find the NSD /ʌu-œy/ contrast more
difficult to discriminate than SSBE listeners.
7.3.3. PAM’s predictions on discrimination of NSD /ø-o/
Both listener groups assimilated NSD /ø/ most frequently to GOAT, more than
twice as often as the next most popular choices GOOSE and MOUTH. While the
assimilation of NSD /ø/ to GOAT was only moderately consistent for SE and
SSBE listeners, it can be considered ‘categorized’, though perhaps not an
excellent exemplar. NSD /o/ was also mainly assimilated to GOAT but to a
higher degree, suggesting it was perceived as a better exemplar of GOAT by
both groups of listeners. NSD /o/ was also assimilated some of the time to
MOUTH and to LOT (< 15%). As NSD /o/ was assimilated to GOAT more than
twice as often than it was to any other category, it can be regarded as
‘categorized’ in terms of PAM.
The assimilation pattern of the NSD /ø-o/ contrast is thus a CG-Type,
since both members of the contrast were assimilated mainly to a single native
category (GOAT) and one member of the contrast (i.e., NSD /ø/) was perceived
as a poorer exemplar of the native category. PAM would predict moderate to
good discrimination. As there were no substantial differences between SSBE
and SE listeners in their perceptual assimilation of the vowels in the NSD /ø-o/
contrast to English vowel categories, there should be little observable
difference between two groups’ discrimination accuracy scores.
7. Study IV: Cross-language perceptual similarity of NSD vowels to English vowels by SSBE and
SE listeners
155
7.3.4. PAM’s predictions on discrimination of NSD /i-ɪ/
Both SSBE and SE listeners assimilated NSD /ɪ/ to KIT most often and to similar
extents. However, the selection of this modal response was only moderately
consistent for both groups as five other response options were chosen, albeit
much less frequently than the modal. As NSD /ɪ/ was assimilated to KIT with at
least double the frequency of the next most popular response option, it can be
considered ‘categorized’, though perhaps only a fairly good exemplar of KIT.
NSD /i/ was assimilated most often to FLEECE by both listener groups,
but only moderately consistently, as it was also assimilated to KIT by both
listener groups (20-22%) and to other English vowel categories (< 12%). In the
above analysis, no significant differences were found between the two accent
groups’ assimilation patterns involving NSD /i/. Again, it appears NSD /i/ was
only a moderately good exemplar of the modal response FLEECE. Nevertheless,
it can be considered ‘categorized’ since it assimilated to the modal response
FLEECE with more than double the frequency as the next most popular
categories.
There appears to be a degree of perceptual overlap involving NSD /i/
and /ɪ/ since both were perceived as being similar to KIT, although NSD /i/ was
perceived to be less similar to this category than NSD /ɪ/. The NSD /i-ɪ/ contrast
could be therefore construed as CG-Type assimilation. Given that NSD /i/ also
assimilated to FLEECE, whereas NSD /ɪ/ did not, listeners were sensitive to the
differences between the two NSD vowels. However, there is some overlap since
both NSD vowels were assimilated to KIT, with NSD /ɪ/ being a better match
and NSD /i/ a more deviant match. Discrimination is expected to be moderate
to good. No accent-specific differences are expected in discrimination. Both
listener groups perceived NSD /i/ in similar ways and only differed in their
perception of NSD /ɪ/. However, the differences revealed for NSD /ɪ/ related to
the choices of English vowel label other than the modal response category KIT,
7. Study IV: Cross-language perceptual similarity of NSD vowels to English vowels by SSBE and
SE listeners
156
which was very similar in frequency across both groups, and as the other
choices were rather diverse and inconsistent for both groups, it may simply be
a reflection of some level of difficulty both groups had in classifying NSD /ɪ/ in
terms of an English vowel category.
7.3.5. PAM’s predictions on discrimination of NSD /u-y/
NSD /u/ was most frequently assimilated to GOOSE by both listener groups, and
it was also assimilated less frequently to FOOT and to GOAT, indicating that it
was not perceived as an excellent exemplar of the modal response category
GOOSE. SE listeners perceived NSD /u/ to be significantly more similar to FOOT
than SSBE listeners (33% versus 22%). In the framework of PAM, it appears
that NSD /u/ is ‘categorized’ for SSBE listeners since the second most popular
response category FOOT made up less than half of the amount of responses as
the modal category GOOSE. For SE listeners, on the other hand, this NSD vowel
may be ‘uncategorizable’ due to the second modal response category GOOSE not
exhibiting double the responses as the next most popular category FOOT.
NSD /y/ was also assimilated most frequently to GOOSE by both listener
groups, but much more frequently by SSBE listeners, indicating NSD /y/ is a
very good match to GOOSE for SSBE listeners but less so for SE listeners. In the
framework of PAM, NSD /y/ is ‘categorized’ since it was assimilated primarily
to GOOSE and the next most often selected category made up less than half the
amount of modal responses for both SSBE and SE listeners.
For both listener groups, it is clear that there is a high level of
perceptual overlap between NSD /u/ and /y/ because both NSD vowels most
frequently assimilated to a single native category, namely GOOSE. For SSBE
listeners, the NSD contrast /u-y/ can be regarded as a CG-Type assimilation,
with one member of the non-native vowel pair being a better match (NSD /y/)
and the other being a more deviant match (NSD /u/) to a single native category
(GOOSE). While there is a high degree of overlap in assimilation patterns, NSD

7. Study IV: Cross-language perceptual similarity of NSD vowels to English vowels by SSBE and
SE listeners
157
/y/ is sufficiently closer to GOOSE to predict moderately accurate discrimination
of NSD /u-y/ for both SSBE and SE listeners. For SE listeners, the UC-Type
assimilation presents a possibility that discrimination will be more difficult for
this group as NSD /y/ is not as strong a match to GOOSE.
7.4. Summary
The experiment in Study IV aimed to uncover the perceptual similarity of the
15 NSD vowels to native English vowel categories by SSBE and SE listeners.
The experiment employed a perceptual assimilation task in which listeners
categorised the non-native vowel stimuli in terms of native English vowel
categories. Perceptual assimilation patterns were judged by the choice of
English vowel category label and the strength of the assimilation was
determined by the frequency of responses. Overall, listeners were only
moderately consistent with their selection of English vowel labels, suggesting
that the majority of NSD vowels were perceived to be similar to more than one
English vowel category. This is perhaps not surprising given that listeners were
presented with a large number of different non-native vowel categories and
were able to select from a large range of response options. Nevertheless, the
modal response nearly always represented a majority of responses and there
were no differences found between the internal consistency scores for both
SSBE and SE listeners. Analysis of the results revealed that the two listener
groups reliably differed in their perceptual assimilation patterns for 11 of the
15 NSD vowels, namely /ɑ, a, ʌu, e, ɪ, ɔ, u, o, ʏ, œy, y/. A closer analysis of the
patterns demonstrated that some of the differences related to differences in the
frequency that the modal response was selected and differences between the
groups’ selection of less frequently chosen response options. The perceptual
assimilation patterns of the vowels involved in the five NSD contrasts /ɑ-ɔ/, /ʌu-
œy/, /ø-o/, /i-ɪ/ and /u-y/ featured in Study III were examined in the framework
of PAM in order to generate predictions on non-native discrimination accuracy,
particularly regarding differences between SSBE and SE listeners. These
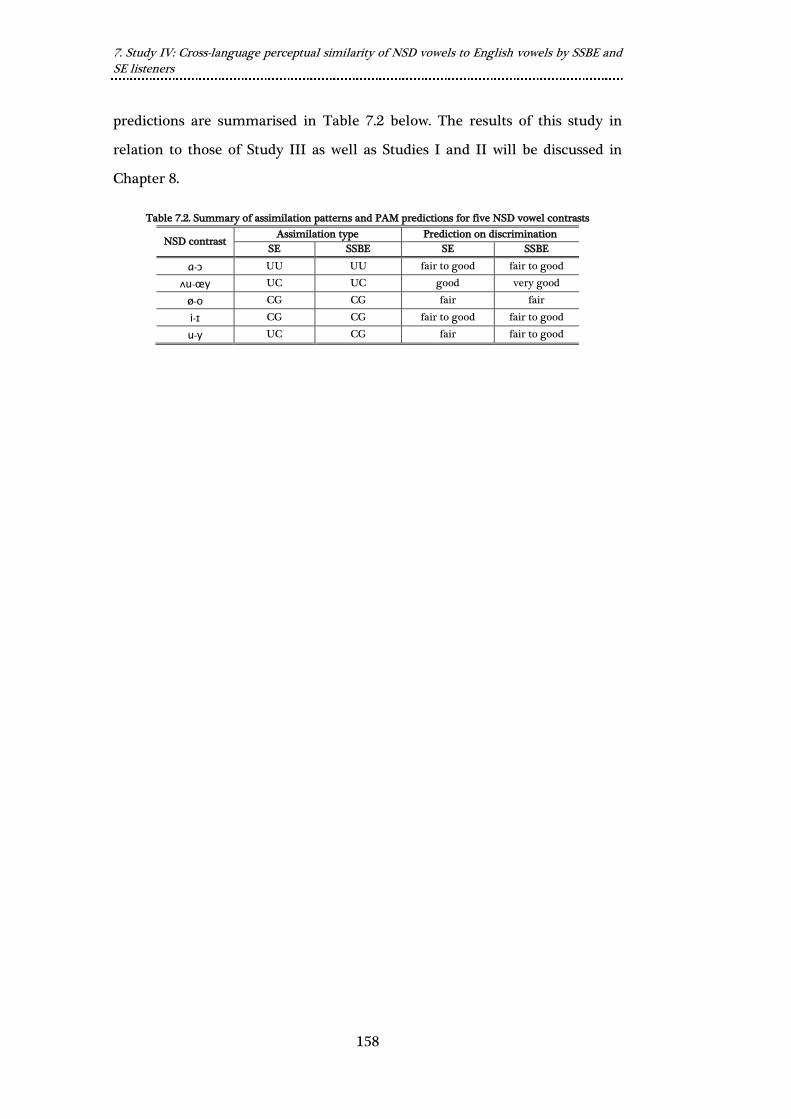
7. Study IV: Cross-language perceptual similarity of NSD vowels to English vowels by SSBE and
SE listeners
158
predictions are summarised in Table 7.2 below. The results of this study in
relation to those of Study III as well as Studies I and II will be discussed in
Chapter 8.
Table 7.2. Summary of assimilation patterns and PAM predictions for five NSD vowel contrasts
NSD contrast Assimilation type Prediction on discrimination
SE SSBE SE SSBE
ɑ-ɔ UU UU fair to good fair to good
ʌu-œy UC UC good very good
ø-o CG CG fair fair
i-ɪ CG CG fair to good fair to good
u-y UC CG fair fair to good

8. Discussion and implications
159
8.
Discussion and implications
8.1. Introduction to Chapter 8
This chapter sets out to discuss in a broader context the results of the four
studies contained in this project. Firstly, the research questions and the four
studies are returned to in 8.2. Secondly, as the aim of this project is to
investigate the role of listeners’ native accents in the acoustic and perceptual
similarity of vowels, there is a discussion of how the findings of the four
studies relate to one another. This is achieved by reviewing how English vowel
production relates to vowel perception by SSBE and SE individuals in 8.3, by
examining how native accent influences perceptual assimilation in 8.4 and by
evaluating how perceptual assimilation affects non-native vowel
discrimination in 8.5. The implications of the general findings are discussed in
the context of previous research in 8.6 and the discussion and implications of
this research are summarised in 8.7.
8.2. The research questions and the four studies
To examine the role of listeners’ native accents in the acoustic and perceptual
similarity of vowels, four research questions were formulated and were
addressed separately in the four studies, as summarised in Table 8.1. In light of
the results, the answers to the questions can be summarised as follows.
Study I found numerous differences between the acoustic properties of
the vowels of SSBE and SE, leading to some NSD vowels comparing differently
to SSBE and SE vowels. The differences in acoustic similarity operated in two
main ways: (1) nine of the 15 NSD vowels were acoustically most similar to the
same English vowel category in SSBE and SE, but differed in the degree of
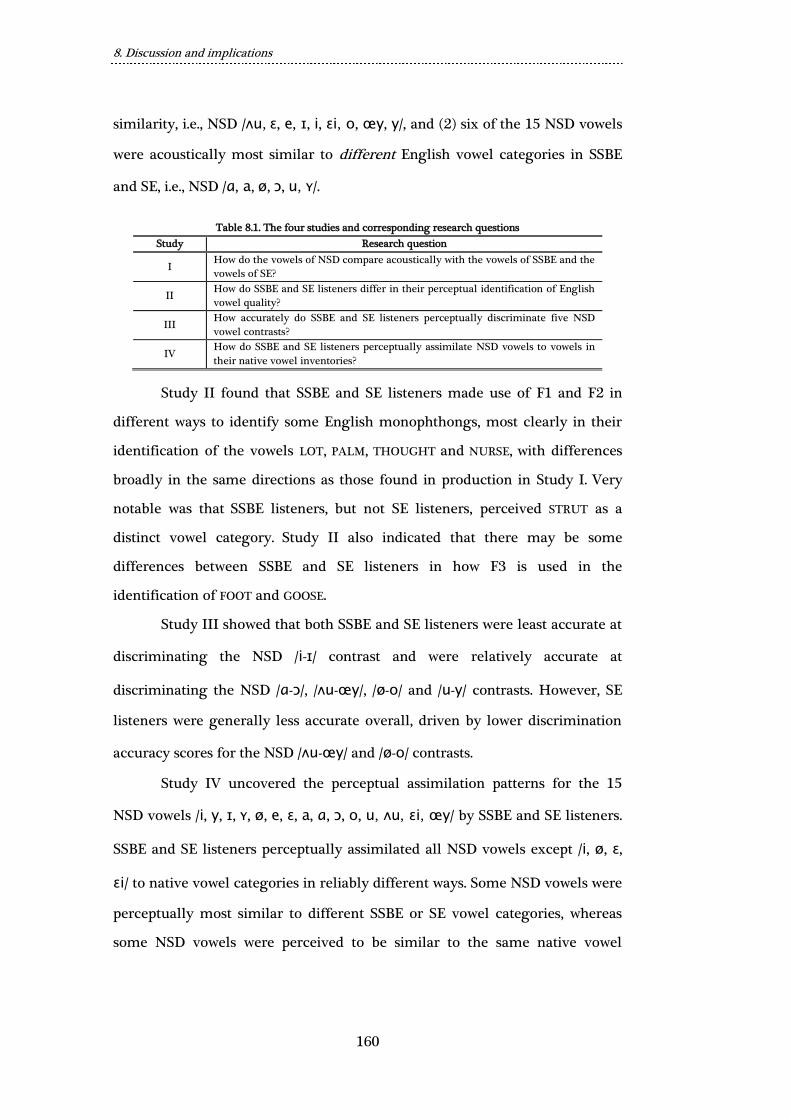
8. Discussion and implications
160
similarity, i.e., NSD /ʌu, ɛ, e, ɪ, i, ɛi, o, œy, y/, and (2) six of the 15 NSD vowels
were acoustically most similar to different English vowel categories in SSBE
and SE, i.e., NSD /ɑ, a, ø, ɔ, u, ʏ/.
Table 8.1. The four studies and corresponding research questions
Study Research question
I How do the vowels of NSD compare acoustically with the vowels of SSBE and the
vowels of SE?
II How do SSBE and SE listeners differ in their perceptual identification of English
vowel quality?
III How accurately do SSBE and SE listeners perceptually discriminate five NSD
vowel contrasts?
IV How do SSBE and SE listeners perceptually assimilate NSD vowels to vowels in
their native vowel inventories?
Study II found that SSBE and SE listeners made use of F1 and F2 in
different ways to identify some English monophthongs, most clearly in their
identification of the vowels LOT, PALM, THOUGHT and NURSE, with differences
broadly in the same directions as those found in production in Study I. Very
notable was that SSBE listeners, but not SE listeners, perceived STRUT as a
distinct vowel category. Study II also indicated that there may be some
differences between SSBE and SE listeners in how F3 is used in the
identification of FOOT and GOOSE.
Study III showed that both SSBE and SE listeners were least accurate at
discriminating the NSD /i-ɪ/ contrast and were relatively accurate at
discriminating the NSD /ɑ-ɔ/, /ʌu-œy/, /ø-o/ and /u-y/ contrasts. However, SE
listeners were generally less accurate overall, driven by lower discrimination
accuracy scores for the NSD /ʌu-œy/ and /ø-o/ contrasts.
Study IV uncovered the perceptual assimilation patterns for the 15
NSD vowels /i, y, ɪ, ʏ, ø, e, ɛ, a, ɑ, ɔ, o, u, ʌu, ɛi, œy/ by SSBE and SE listeners.
SSBE and SE listeners perceptually assimilated all NSD vowels except /i, ø, ɛ,
ɛi/ to native vowel categories in reliably different ways. Some NSD vowels were
perceptually most similar to different SSBE or SE vowel categories, whereas
some NSD vowels were perceived to be similar to the same native vowel
8. Discussion and implications
161
categories, but the degree of perceptual similarity differed. In some cases, the
differences between SSBE and SE listeners, though reliable, were subtle.
8.3. Review of native vowel production and native vowel
perception (Study I and Study II)
The aim of this section is to review and discuss the results of Study I and Study
II together (presented in Chapters 4 and 5, respectively) in order to examine
any possible associations between the perception and production of English
vowels by SSBE and SE individuals. Rather obviously, speakers of different
accents of a language produce some speech sounds differently, but it is not
well understood how this relates to the perception of sounds in their native
language. The following examination aims to shed some light on the
relationship between the production of individual vowels and the acoustic cues
used to identify them. That is, if some vowels are produced differently by
speakers of two different accents and these vowels are also perceived
differently by listeners of the two accents, then there is a clear reason to
assume that listeners of these two accents could differ in their non-native
vowel perception (i.e., motivation for Study III and Study IV). The present
comparison of the SSBE and SE production results from Study I and the
perception results from Study II can only be restricted to the English
monophthongs FLEECE, KIT, DRESS, NURSE, TRAP, PALM, STRUT, LOT, THOUGHT,
FOOT and GOOSE, since the English diphthongs (investigated in Study I) were
not included in Study II. The use of spectral properties to identify English
diphthongs was not directly tested in Study II because including the wide-
ranging formant trajectories of diphthongs in the synthetic vowel stimuli was
beyond the scope of the stimuli and experiment design.
In order to answer the question of Study I regarding an acoustic
comparison of NSD vowels with those in SSBE and SE, the following steps were
taken. The first step was to establish the vowel inventories of NSD, SSBE and
SE based on available accounts in the literature (see Chapter 2). The second
step was to determine the acoustic properties of the vowels in the inventories

8. Discussion and implications
162
of NSD, SSBE and SE since no appropriate acoustic data were available (see
Chapter 3). While a corpus of vowels for NSD does exist (Adank et al., 2004),
there could be potential difficulties in obtaining reliable acoustic
measurements (e.g., as reported in Bank, 2009, and compared with newer data
in Van Leussen et al., 2011). For SSBE vowels, the acoustic properties of all or
even the majority of the vowels have never been reported on in the literature
in a single study, thus a complete set of acoustic data is lacking. For SE vowels,
no acoustic studies have been conducted and as a result relatively little is
known about their vowel acoustics. By collecting new vowel data, it was
possible to directly compare the acoustic properties of vowels across NSD,
SSBE and SE. It is well known, for example, that the acoustic properties of
vowels are affected by the consonantal context in which they are produced and
this has been attested for NSD (Van Leussen et al., 2011) and SSBE (Steinlen,
2005). As different consonantal contexts affect vowels differently and such
effects are language or dialect-specific (Strange et al., 2005; Chládková et al.,
2011), it is challenging to compare acoustic properties of vowels across accents
and languages produced in a variety of contexts. In order to minimise the
effects of consonantal context in comparisons of vowels, as has been done in
this study, this can be kept constant. Furthermore, all speakers involved in
Study I were recorded in similar laboratory settings specifically tailored to
creating reliable audio recordings. The third step in answering the question of
Study I involved obtaining acoustic measurements from the collected
recordings. The acoustic measurements chosen were vowel duration, f0 and the
first three formants measured at three time points throughout each vowel
token’s duration (i.e., 25%, 50% and 75%). As there were a large number of
vowel tokens and obtaining the measurements was automated, the formant
frequencies were estimated using Escudero et al.’s (2009) optimal formant
ceiling method which provides reliable estimates by reducing unlikely values
caused by formant tracking errors.
According to the literature on the vowel inventories of SSBE and SE
(e.g., McMahon, 2002; Stoddart et al., 1999), the two English accents share

8. Discussion and implications
163
almost all the same phonological vowel categories, but there is one major
difference: SSBE exhibits a separate vowel category for STRUT (the STRUT-FOOT
split) whereas SE does not, and this difference was confirmed in Study I. As this
phonological difference exists, comparisons between the acoustic properties of
the equivalent vowels in the vowel inventories of SSBE and SE cannot be
drawn for STRUT. For the ten monophthongal and five diphthongal vowel
categories that SSBE and SE share (i.e., FLEECE, KIT, DRESS, NURSE, TRAP, PALM,
LOT, THOUGHT, FOOT, GOOSE and FACE, CHOICE, MOUTH, GOAT, PRICE), a number
of reliable acoustic differences were revealed.
Study I demonstrated that the acoustic differences between the
monophthongs of SSBE and SE mainly involved F1 and F2, with such
differences having been found for LOT, PALM, THOUGHT, NURSE, FOOT, GOOSE
and marginally for TRAP. Although the five diphthongs FACE, GOAT, PRICE,
MOUTH and CHOICE were not included in Study II, the differences found in
their production in Study I were quite striking. Generally, this related to
differences in the F1 and F2 of the starting and end points of the diphthongs
and SSBE diphthongs exhibited greater F2 movement.
While differences were found in the acoustic properties (essentially
only F1 and F2) of how some of the monophthongs are realised in the two
English accents, it was expected that linguistic experience of listeners would
also affect the perception of some native vowels. The question of Study II
sought to answer what spectral properties SSBE and SE listeners use to identify
English monophthongs and, in doing so, examine whether there are any
differences between SSBE and SE listeners. Recent evidence suggests that
listeners exhibit more robust representations of sounds in their native accent
than those in other accents (e.g., Dufour et al., 2007; Clopper and Tamati, 2010),
even after years of living in a non-native accent environment (Evans and
Iverson, 2004). It was expected, therefore, that SSBE and SE listeners in Study
II would make use of spectral properties that favour those observed in the
vowels in their native accent.
8. Discussion and implications
164
In comparing the results of Study I and Study II, some striking
parallels can be drawn between how SSBE and SE listeners used F1, F2 and F3
information to identify monophthongs and how SSBE and SE speakers actually
produced monophthongs. In Study II, listeners were clearly sensitive to F1 and
F2 of the synthetic stimuli and the average F1 and F2 locations used to identify
the monophthongs broadly corresponded to the production results reported
from Study I. For instance, those stimuli labelled as FLEECE exhibited the
highest F2 values and those labelled as TRAP had the highest average F1 values,
suggesting that these two vowels, respectively, perceptually occupy the
extreme front and extreme low portions of the acoustic vowel space, as was
also found in production in Study I. Notably, The analysis of the results from
Study II presented in Chapter 5 demonstrated that not all the monophthongs
shared the same F1 and F2 locations for SSBE and SE listeners. Most obviously,
SSBE listeners identified a STRUT vowel category, whereas SE listeners did not
do so. In Study I, SSBE and SE speakers produced the vowels LOT, PALM,
THOUGHT, NURSE, FOOT, GOOSE and marginally TRAP and KIT, with different F1
and F2 values. In Study II, LOT, PALM, THOUGHT, NURSE and TRAP were indeed
identified with different F1 and F2 locations by SSBE and SE listeners, with the
differences generally being in the same directions as those observed in
production in Study 1.
Although the largest differences between SSBE and SE speakers in
Study I were the differences in F2 in the production of FOOT and GOOSE, no
obvious differences were found for these two vowels in the perception results
of Study II. The discussion in Chapter 5 examined why there might be little
difference in perception vis-à-vis large differences in production by exploring
the role of F3, since this has been found to be an important cue, at least in
SSBE, for perceiving these two vowels (Chládková and Hamann, 2011). A
tentative analysis suggested a greater reliance on a low F3 for SSBE listeners in
their identification of these two vowels. In addition, a recent study suggests
that F2 movement could be an important cue in the perception of the GOOSE
and FLEECE vowels by SSBE listeners, specifically for determining the F2
8. Discussion and implications
165
boundary between these two vowels (Chládková et al., in preparation). Another
recent study has found that F2 movement and F2 location vary significantly
between SSBE and SE, with SE GOOSE exhibiting a lower F2 and greater F2
movement than SSBE GOOSE (Williams, 2012). Given that F2 movement
affected the F2 boundary for SSBE listeners in the study reported on by
Chládková et al. (in preparation), there may be a comparable effect for SE
listeners, but the size of the effect could differ between the accent groups as SE
listeners may place greater weight on the degree of F2 movement since this
was found to be much greater in their GOOSE tokens (Williams, 2012). However,
formant movement did not feature in the synthetic vowel tokens presented to
listeners in Study II, so a possible explanation involving the cue of F2
movement cannot be confirmed at present and therefore requires further
investigation.
In relation to this latter point, while the synthetic vowel stimuli in
Study II did not fully match all acoustic properties of naturally produced
vowel sounds due to the lack of formant movement, this does not undermine
the fact that F1 and F2 are undoubtedly the most significant cues for vowel
quality (Peterson and Barney, 1952) and Study I and Study II demonstrate that
there are some striking parallels between the relative locations of F1 and F2 in
the production and perception of the majority of English monophthongs by
SSBE and SE individuals, as outlined above.
To conclude the present review of Study I and Study II, the largest
acoustic differences between SSBE and SE vowels are found in diphthongs,
especially with regard to F2 movement, and there are also some notable
acoustic differences in the production of the monophthongs which generally
corresponded to differences between the use of F1 and F2 in perception.
Interestingly, the use of spectral properties to identify FOOT and GOOSE did not
differ between SSBE and SE listeners in spite of very large acoustic differences
in production, but there may be additional acoustic cues required that were not
directly tested. As perception of the monophthongs LOT, PALM, THOUGHT,
NURSE and STRUT was not the same for SSBE and SE listeners, it can reasonably

8. Discussion and implications
166
expected that there will be differences in the perception of non-native
monophthongs as well.
8.4. Relationship of native vowel production and cross-
language vowel perception (Study I and Study IV)
The results of the linear discriminant analyses (LDAs) presented in Chapter 4
provided a method of objectively determining the acoustically most similar
NSD vowels to SSBE and SE vowels. All vowel tokens entered into the model
included details on 10 acoustic variables: vowel duration, F1 at three time
points, F2 at three time points and F3 at three time points. The reason for
including formant values at three time points was because both diphthongs
and monophthongs were included in the model and because of recent
evidence of a better fitting model of acoustic similarity if at least some of the
dynamic formant characteristics of vowels are captured (Escudero and Vasiliev,
2011). However, no study has yet compared the acoustic similarity between
diphthongs. In the LDAs, the SSBE and SE vowel tokens functioned as training
sets and the NSD tokens were the test set. The measure of the degree of
acoustic similarity was the percentage of times a particular NSD vowel was
classified in terms of an SSBE or SE vowel category. Measurements on acoustic
similarity are used as a way to objectively measure phonetic similarity between
vowels across languages (for a review, see Strange, 2007), which can then in
turn be compared to listeners’ perceived phonetic similarity, i.e., perceptual
assimilation patterns, within the framework of PAM (e.g., Strange et al., 2004;
Escudero et al., 2012).
The acoustic similarity results obtained in Study I (Chapter 4) will now
be compared to the perceptual similarity results gathered from Study IV
(Chapter 7) in order to spell out the relationship between acoustic and
perceptual similarity of each NSD vowel to either SSBE or SE vowel categories.
This will be done by comparing the LDA classifications from Study I with the
perceptual assimilation patterns from Study IV separately for each of the 15
NSD vowels /ɑ, a, ʌu, ɛ, e, ø, ɪ, i, ɛi, ɔ, u, o, ʏ, œy, y/ and specifically by

8. Discussion and implications
167
examining which SSBE or SE vowel categories were involved. This is then
followed by an evaluation of the relationship between acoustic and perceptual
similarity in 8.4.16.
8.4.1. Acoustic and perceptual similarity of NSD /ɑ/
In Study I, this NSD vowel was mainly classified as STRUT for SSBE and as LOT
for SE. In Study IV, the same basic pattern was found in perceptual
assimilation. Interestingly, the most often selected English vowel category was
different for SSBE and SE listeners, with STRUT occurring for SSBE only since
SE does not have a separate vowel category for this. In Study IV NSD /ɑ/ was
not consistently categorised by both SSBE and SE listeners – far less so than
how this NSD vowel was classified in the LDA results in Study I. In line with
the results in Study I, however, NSD /ɑ/ was in Study IV assimilated some of
the time to PALM by both SSBE and SE listeners.
8.4.2. Acoustic and perceptual similarity of NSD /a/
As in Study I in which NSD /a/ was classified most often as TRAP for SSBE and
PALM for SE, SSBE listeners most often assimilated NSD /a/ to TRAP and SE
listeners to PALM. However, the classifications from Study I were far more
consistent for SE vowel tokens whereas the assimilation patterns in Study IV
were more consistent for SSBE listeners, but the same basic categorisation
patterns hold.
8.4.3. Acoustic and perceptual similarity of NSD /ʌu/
NSD /ʌu/ was very consistently classified as MOUTH in LDAs from Study I for
both SSBE and SE, and this NSD vowel was also classified some of the time as
GOAT for SE but not for SSBE. In Study IV, NSD /ʌu/ was also very consistently
assimilated to MOUTH by SSBE listeners, but much less so by SE listeners, since
it was assimilated to GOAT by SE listeners more frequently than SSBE listeners
and it was also assimilated some of the time to THOUGHT by SE listeners –
though this latter pattern did not occur in the LDAs in Study I. For SE, there

8. Discussion and implications
168
appears to be a large discrepancy in the consistencies of acoustic and
perceptual similarity of NSD /ʌu/ to MOUTH and this appears to have been
driven by the stronger perceptual similarity of this vowel to GOAT and to a
lesser extent also to THOUGHT, which did not occur for SSBE listeners.
8.4.4. Acoustic and perceptual similarity of NSD /ɛ/
In both Study I and Study IV this NSD vowel was classified and assimilated
most often to DRESS for SSBE and SE. Nevertheless, in both studies, the
consistency of this pattern was only moderate.
8.4.5. Acoustic and perceptual similarity of NSD /e/
For both SSBE and SE, the most often selected vowel category for NSD /e/ was
FACE in Study I and in Study IV. However, the consistency of this pattern was
only moderate in both. The main difference observed between SSBE and SE
was that NSD /e/ was classified some of the time as GOOSE for SSBE in Study I
and also was significantly more often perceptually assimilated to GOOSE by
SSBE listeners than SE listeners in Study IV.
8.4.6. Acoustic and perceptual similarity of NSD /ø/
In Study I, this NSD vowel was most often and very consistently classified as
GOAT for SSBE, but as NURSE for SE. However, in Study IV NSD /ø/ was
perceptually assimilated most often to GOAT by both SSBE and SE listeners and
there were no significant differences in their assimilation patterns. Thus for SE
but not for SSBE, there is a very large discrepancy between the acoustic
similarity of NSD /ø/ and its perceptual similarity to native vowel categories;
this perhaps puzzling result observed for SE will be evaluated in greater detail
in 8.4.16.
8.4.7. Acoustic and perceptual similarity of NSD /ɪ/
In Study I and Study IV, NSD /ɪ/ was most often classified as or perceptually
assimilated to KIT for both SSBE and SE. However, the acoustic similarity
8. Discussion and implications
169
appears to be much more consistent than the perceptual similarity. In Study IV,
NSD /ɪ/ was often assimilated to other vowel categories by both SSBE and SE
listeners, indicating that they encountered some difficulty in trying to
categorise it.
8.4.8. Acoustic and perceptual similarity of NSD /i/
In Study I, NSD /i/ was found to be acoustically very similar to FLEECE for both
SSBE and SE, but it was also classified some of the time as KIT for SSBE and SE
and also sometimes as GOOSE for SSBE. In Study IV, NSD /i/ was most often
perceptually assimilated to FLEECE and some of the time to KIT by both SSBE
and SE listeners and no differences were revealed in the assimilation patterns
between the two groups of listeners.
8.4.9. Acoustic and perceptual similarity of NSD /ɛi/
In Study I, this NSD vowel was most frequently classified as PRICE for both
SSBE and SE and was more consistent for SE than SSBE. In Study IV, the most
frequently occurring assimilation pattern was NSD /ɛi/ being mapped onto
FACE by both SSBE and SE listeners and no significant differences were found
between the two groups. Thus a disparity for both SSBE and SE exists in the
acoustically most similar and the perceptually most similar native vowel
categories, which is evaluated in 8.4.16 below.
8.4.10. Acoustic and perceptual similarity of NSD /ɔ/
In Study I, NSD /ɔ/ was consistently classified as THOUGHT for SSBE and FOOT
for SE. In addition, NSD /ɔ/ was classified some of the time as LOT for SSBE and
THOUGHT for SE. As is apparent, this NSD vowel was most frequently classified
in terms of different vowel categories for SSBE and SE. In Study IV, NSD /ɔ/
was most often assimilated to LOT by SSBE listeners and to FOOT by SE listeners.
Both studies have in common that NSD /ɔ/ is acoustically and perceptually
most similar to different vowel categories for SSBE and SE. However, the
8. Discussion and implications
170
consistency of responses in Study IV was far weaker than the classifications in
Study I. In contrast to SE, there is a discrepancy between the acoustically and
perceptually most similar vowel in SSBE. That is, even though NSD /ɔ/ was
found to be acoustically most similar to SSBE THOUGHT according to the LDA
results in Study I, the perceptually most similar vowel was LOT for SSBE
listeners in Study IV. This is returned to in 8.4.16.
8.4.11. Acoustic and perceptual similarity of NSD /u/
The LDA results in Study I very consistently assigned NSD /u/ to SSBE
THOUGHT and to SE FOOT. However, in Study IV this NSD vowel was most
often perceived to be similar to GOOSE by both SSBE and SE listeners. Even
though the multinomial logistic regression reported in Chapter 7 found a
significant effect of accent group, no specific differences were found in the
labelling choices for NSD /u/ by SSBE and SE listeners. While NSD /u/ was
found to be acoustically most similar to different vowels in SSBE and SE, SSBE
and SE listeners both perceptually assimilated this NSD vowel to the same
native vowel category. This discrepancy between acoustic and perceptual
similarity is examined in 8.4.16.
8.4.12. Acoustic and perceptual similarity of NSD /o/
For SSBE and SE, NSD /o/ was found to be acoustically most similar to
THOUGHT in Study I, but this classification was only moderately consistent for
both SSBE and SE because it was also sometimes classified in terms of other
English vowels. For SSBE, NSD /o/ was also acoustically similar to LOT and
PALM and for SE it was found to be also acoustically similar to GOAT. In Study
IV, both SSBE and SE listeners assimilated NSD /o/ most frequently to GOAT
and to similar extents. For NSD /o/, there is a clear discrepancy between
acoustic similarity and perceptual similarity to native vowel categories. In
Study I, NSD /o/ was never classified as GOAT for SSBE, but this was by far the
most perceptually similar vowel. For SE, on the other hand, the LDAs did
8. Discussion and implications
171
classify NSD /o/ at least some of the time in terms of the GOAT category. This is
discussed again in 8.4.16.
8.4.13. Acoustic and perceptual similarity of NSD /ʏ/
The LDA results from Study I showed that NSD /ʏ/ is acoustically most similar
to SSBE FOOT, but the classifications for SE were less clear-cut, being classified
as FOOT, GOOSE, KIT and NURSE. In Study IV, this NSD vowel was perceived to be
most similar to the FOOT category by both SSBE and SE listeners, but this
assimilation pattern was relatively inconsistent because NSD /ʏ/ was also
assimilated to NURSE. Overall, SSBE and SE listeners did not vary greatly in
their assimilation patterns for this vowel; the only reliable difference revealed
in the multinomial logistic regression in Chapter 7 was that SSBE listeners
were more likely to assimilate NSD /ʏ/ to STRUT, but this is not surprising given
that SE listeners did not make use of this label for any NSD vowel. Despite
NSD /ʏ/ being quite similar acoustically to SSBE FOOT but not acoustically
close to any particular SE vowel, both SSBE and SE listeners perceived it to be
most similar to FOOT. This result is discussed in 8.4.16.
8.4.14. Acoustic and perceptual similarity of NSD /œy/
In Study I, the LDAs classified NSD /œy/ as GOAT, NURSE and PRICE for SSBE
and mainly as PRICE for SE, but also as FACE and NURSE. In Study IV, SSBE and
SE listeners most frequently assimilated NSD /œy/ to GOAT, but it was also
assimilated to MOUTH to a lesser extent. There was a significant difference
between SSBE and SE listeners, with SE listeners assimilating NSD /œy/ more
often to MOUTH and SSBE listeners assimilating it more often to GOAT. It
appears that there is a large disparity between acoustic similarity and
perceptual similarity of this NSD vowel to native categories. Despite the
apparent acoustic similarity between NSD /œy/ and PRICE, neither SSBE nor SE
listeners perceived any similarity. Furthermore, NSD /œy/ was not found to be
acoustically similar to MOUTH, but SSBE and especially SE listeners perceived it
8. Discussion and implications
172
to be so. This disparity between acoustic and perceptual similarity is discussed
in 8.4.16.
8.4.15. Acoustic and perceptual similarity of NSD /y/
In Study I, the LDAs revealed that NSD /y/ is acoustically very similar to SSBE
GOOSE and moderately similar to SE GOOSE. It was also found to be similar to
KIT, but more so for SE than for SSBE. In Study IV, both SSBE and SE listeners
perceived NSD /y/ to be most similar to GOOSE, but the degree of perceptual
similarity was much greater for SSBE listeners.
8.4.16. Evaluation of the relationship between acoustic and perceptual
similarity of NSD vowels to native vowel categories: some
considerations
The comparisons of acoustic similarity and perceptual similarity of the 15 NSD
vowels to native vowel categories appears complex and it does not appear that
acoustic similarity always predicted perceptual similarity. In terms of how well
acoustic similarity corresponded to perceptual similarity, the following two
conclusions can be drawn. Firstly, it appears that the LDAs generally
corresponded to SSBE and SE listeners’ assimilation patterns of the front or low
NSD monophthongs /ɑ, a, ɛ, ɪ, i, y/. That is, each of these NSD monophthongs
was most often classified in Study I in terms of the same English vowel
category that listeners selected most often in Study IV. Secondly, acoustic
similarity did not correspond to the perceptual similarity results from at least
one of the two listener groups for NSD diphthongs, i.e., /ø, ɛi, o, œy/ but not /e,
ʌu/, and three of the NSD monophthongs, namely /ʏ, ɔ, u/. The following
discussion thus evaluates the apparent discrepancies between acoustic and
perceptual similarity of the the above three NSD monophthongs and the NSD
diphthongs.
There were clear correspondences between acoustic and perceptual
similarity of NSD /ʏ/ for SSBE, but not for SE, because SE listeners showed

8. Discussion and implications
173
perceptual assimilation patterns that were very comparable to those exhibited
by SSBE listeners and unlike those observed in acoustic similarity. This
suggests that SE listeners could have perceived NSD /ʏ/ to be similar to FOOT
as produced in SSBE. Recent evidence offers an explanation as to why this
interpretation could be the case. In difficult listening conditions, listeners –
regardless of their native accent background – often show a bias toward
standard variants of speech sounds, even if it is unlike how they themselves
produce it. Clopper (in press) reports on a cross-dialect listening task in which
listeners from three American English accents were presented with sentences
in noise said by talkers from four American English accents and were asked to
identify the final word. Listeners were most accurate at correctly identifying
words in the General American accent, a standard accent, than any of the other
accents, regardless of the listeners’ own native accent, suggesting a bias toward
the standard in less favourable listening conditions. It was assumed that this
was due to listeners’ familiarity with the standard accent due to its ubiquity in
the media (Clopper and Bradlow, 2008; Clopper, 2012). The present
interpretation of SE listeners exhibiting a similar assimilation pattern to SSBE
listeners could be explained along similar lines. Given that NSD /ʏ/ was not
acoustically similar to any particular SE vowel category, as demonstrated in
Study I, SE listeners probably encountered difficulty trying to categorise it.
Due to SE listeners’ familiarity with SSBE, NSD /ʏ/ may have been perceived by
SE listeners as similar to FOOT like its realisation in SSBE but unlike how it is
actually produced in SE.
This interpretation of SE listeners’ labelling of NSD /ʏ/ as FOOT due to
their familiarity with SSBE does not undermine the differences found in the
acoustic and perceptual similarity between SSBE and SE outlined above for
NSD /ɑ, a, ɛ, ɪ, i, y/. There is a growing body of research which suggests that
representations or perceptual exemplars of sounds in one’s native accent are
more robust than representations of non-native accent variants, such as in a
standard variety. For instance, Clopper and Tamati (2010) investigated the

8. Discussion and implications
174
recognition accuracy by listeners from three American English accents of
words repeated by the same talker, by a different talker from the same accent
and by a different talker from a different accent. The results showed that there
was a stronger effect on accuracy scores when listeners heard a word that was
repeated by the same or different talker from their native accent than when
the word was repeated by the same or different talker from a non-native accent.
A further study reported by Clopper (2011) demonstrates a similar
effect, namely that listeners from different accent backgrounds exhibit
different representations of the American English vowels /æ/ and /ɛ/. The
difference between how these two vowels are realised by speakers of Northern
American accents is not as large as that by speakers of General American.
General American and Northern American accent listeners were presented
auditorily with words said by General American or Northern American talkers
containing either /æ/ or /ɛ/ and also presented with a written prompt either
matching this auditory word or a word with the other vowel. Northern
American listeners found it more difficult to select the correct word than
General American listeners. Clopper (2011) suggests that for Northern
American listeners both words (containing the vowels /æ/ and /ɛ/) were
activated upon hearing the stimulus, thereby making choosing the correct
word more difficult. This is interpreted as Northern American listeners having
less robust representations of the General American vowels /æ/ and /ɛ/ which
imposed the observed greater processing effort. Other studies have found
similar effects of different representations of vowels between accents of a
language. For instance, South French listeners fail to distinguish between
Standard French word-final /e/ and /ɛ/ in behavioural experiments (Dufour et
al., 2007), even after explicit training (Dufour et al., 2010), and neurophysical
studies also find the same effect (Brunellière et al., 2009; Brunellière et al.,
2011).
Taken together, this evidence suggests that listeners with different
accent backgrounds exhibit different representations of some vowels, as was
8. Discussion and implications
175
also uncovered in Study II in which SSBE and SE listeners made differential
use of spectral properties to identify some of the English monophthongs
(including a differential effect of F3 on the use of F2 in identifying FOOT).
However, at the same time, Clopper (in press) demonstrates that listeners are
familiar with a standard accent and can make use of this familiarity in less
favourable listening conditions, but Clopper and Tamati (2010), Clopper (2011)
and Dufour et al. (2007) show that such representations of the standard by non-
native accent listeners are not as robust as those by native standard accent
listeners. This is also comparable to the study by Evans and Iverson (2004) that
found Northern British English listeners exhibited inaccurate representations
of STRUT even after many years of living in an SSBE environment.
Thus, while SE listeners apparently perceived NSD /ʏ/ to be similar to
FOOT in the same way as SSBE listeners, SE listeners’ representation of a more
SSBE-like FOOT may not be as robust or accurate as that by SSBE listeners
themselves. To confirm the current hypothesis of the SE listeners’ labelling of
NSD /ʏ/, further testing is of course required.
While Study I indicated that NSD /ɔ/ is acoustically most similar to
THOUGHT in SSBE, in Study IV SSBE listeners perceptually assimilated this
NSD vowel most often to LOT. In terms of vowel formants, NSD /ɔ/ and SSBE
THOUGHT are indeed very similar, especially with regard to a low F2, but in
terms of vowel duration, SSBE THOUGHT is considerably longer (approximately
58%) than NSD /ɔ/ (Table 4.1 and Table 4.3 in Chapter 4). SSBE LOT, on the
other hand, exhibits a vowel duration comparable to that of NSD /ɔ/, which
may have influenced SSBE listeners’ preference for assimilating it to LOT over
THOUGHT. The LDAs apparently did not weight vowel duration as heavily as
SSBE listeners did in determining which SSBE vowel NSD /ɔ/ was most similar
to. For SE, on the other hand, vowel duration was less of an issue in deciding
acoustic and perceptual similarity. Study I indicated that NSD /ɔ/ is
acoustically closest to SE FOOT. As SE FOOT exhibits a relatively low F2 as well
8. Discussion and implications
176
as a short vowel duration comparable to that of NSD /ɔ/, it was not surprising
that in Study IV SE listeners also perceptually assimilated this NSD vowel most
frequently to FOOT.
Study I showed that NSD /u/ is acoustically closest to THOUGHT in SSBE
and FOOT in SE, but Study IV found that both SSBE and SE listeners most
frequently assimilated NSD /u/ to GOOSE. Evidence involving English listeners’
perceptual assimilation of non-native /u/ (i.e., a phonetically high back vowel
or a vowel with a low F1 and low F2) shows that /u/ is most frequently
assimilated to GOOSE. For instance, in a perceptual assimilation task reported
by Levy (2009a) American English listeners very frequently assimilated
Parisian French /u/ to American English /u/, i.e., the GOOSE vowel category in
SSBE and SE. However, the F2 of American English /u/ is considerably lower
than that exhibited in either SSBE or SE. Specifically, the F2 of American
English /u/, as reported in Strange et al. (2007), is almost identical to that
reported for NSD in subsection 4.2.2†. It is therefore unsurprising that in Study
I NSD /u/ was not found to be very similar acoustically to SSBE or SE GOOSE,
especially given that NSD /u/ exhibits F1 and F2 values lower than any vowel
found in SSBE or SE.
A perceptual assimilation task reported by Mayr and Escudero (2010)
involving British English listeners (from various accent backgrounds) listening
to German monophthongs provides for a better comparison than the
American English listeners in Levy (2009a). It was found that German /uː/ was
overwhelmingly assimilated to GOOSE even though listeners produced GOOSE
with a considerably higher F2 than native German speakers’ realisation of
German /uː/. Despite the large acoustic dissimilarity between German /uː/ and
GOOSE on the F2 dimension, there was a high degree of perceptual similarity.
† The midpoint F2 values quoted of /u/ in Strange et al. (2007: 1117) are as follows: Parisian French male 7.1
Bark (≈ 780 Hz); Parisian French female 7.1 Bark (≈ 780 Hz); American English male 7.4 Bark (≈ 823 Hz);
American English female 8.2 Bark (≈ 946 Hz). Only the values in Bark are given in the original and the
values in Hz were obtained by using the inverse Bark formula in Traunmüller (1990) for comparison to Hz
values for NSD in section 4.2.2 [= acoustic measurements of NSD vowels].

8. Discussion and implications
177
The perceptual similarity of NSD /u/ to GOOSE can also be viewed in light of
the results from Study II in which SSBE and SE listeners’ labelling of the
synthetic stimuli as GOOSE was found to cover a large length of the F2
dimension, stretching from low to relatively high F2 values, but a relatively
short length on the F1 dimension (Figure 5.4 in Chapter 5). NSD /u/, exhibiting
a low F1 and a low F2, thus falls within this large space even if no SSBE or SE
vowel is actually occupied by this space in production.
The analysis of the perceptual assimilation results of NSD /u/ from
Study IV presented in Chapter 7 revealed an overall significant difference
between SSBE and SE listeners, even though both groups mainly assimilated it
to GOOSE. While no specific differences could be found, inspection of the data
revealed that SE listeners generally perceived NSD /u/ to be a somewhat more
similar to FOOT than SSBE listeners and this is not surprising given the greater
acoustic similarity of NSD /u/ to FOOT in SE found in Study I and SE listeners’
making greater use of very low F2 values to label the synthetic vowel stimuli
as FOOT in Study II (Figure 5.2 in Chapter 5).
The lack of correspondence between the acoustic and perceptual
similarity patterns for NSD diphthongs /ɛi, œy, o, ø/ remain to be explored.
SSBE and SE listeners were sensitive to the dynamic nature of the diphthongs’
spectral properties as they were all primarily assimilated to English
diphthongs, which confirms the status of formant movement as a general
perceptual cue to diphthongs (as illustrated in Figure 7.2 in Chapter 7).
However, the results from Study I and Study IV do not clarify the relative
importance of the direction or degree of formant movement in the perceptual
assimilation patterns and previous research is rather scarce and inconclusive
with regard to what specific acoustic information is relevant in the perception
of diphthongs, as will be discussed below.
NSD /ɛi/ was found to be acoustically most similar to PRICE in SE and
PRICE and GOAT in SSBE in Study I, whereas in Study IV NSD /ɛi/ was primarily

8. Discussion and implications
178
assimilated to FACE by both SSBE and SE listeners, with no reliable differences
between responses. Nevertheless, NSD /ɛi/ was also sometimes classified as
FACE for both SSBE and SE in Study I, which partially corresponds to the
perception results from Study IV.
In Study I, NSD /œy/ was acoustically most similar to PRICE in SE and
PRICE and GOAT in SSBE. In Study IV, NSD /œy/ was perceptually assimilated
mainly to GOAT by SSBE and approximately equally to GOAT and MOUTH by SE
listeners. Study I offers a partial account of SSBE listeners’ responses in Study
IV because some acoustic similarity was found between NSD /œy/ and GOAT
for SSBE only, but this does not explain why SE listeners also chose GOAT as no
such acoustic similarity was found. As noted above for the assimilation of NSD
/ʏ/, SE listeners may have responded with GOAT in Study IV due to their
familiarity of more standard variants of GOAT, like that in SSBE, due its
ubiquity in the media (cf., Clopper, in press; Clopper and Bradlow, 2008;
Clopper, 2012). Nevertheless, it is more puzzling that NSD /œy/ was fairly
frequently assimilated to MOUTH given its apparent acoustic dissimilarity in
Study I. Indeed, the formant trajectories of MOUTH and NSD /œy/ take on
opposite directions, with MOUTH exhibiting a falling F1 and F2 and NSD /œy/
displaying a rising F1 and F2 (Figure 4.11 and Figure 4.12 in Chapter 4). While
apparently a puzzling result, it is perhaps not entirely unexpected because
Witteman et al. (2011), for example, report that English learners of Dutch with
a basic proficiency in Dutch substitute NSD /œy/ with English MOUTH in their
spoken Dutch, suggesting that for NSD /œy/ there could be some perceived
similarity to English MOUTH.
NSD /o/, exhibiting a much lower F2 than any SSBE or SE vowel was
found in Study I to be acoustically most similar to THOUGHT for both SSBE and
SE, but also similar to LOT and PALM for SSBE listeners and GOAT for SE
listeners. Both SSBE and SE listeners primarily assimilated NSD /o/ to GOAT in
Study IV. As seen above for NSD /u/ and /ɔ/, a non-native vowel with a low F2

8. Discussion and implications
179
may not necessarily be perceived in terms of a native vowel category also with
a low F2 by SSBE and SE listeners (and perhaps British English listeners in
general, cf., Mayr and Escudero, 2010). Additionally, as NSD /o/ is a diphthong,
SSBE and SE listeners’ preferred to assimilate it to an English diphthong
category, which explains why THOUGHT is perceptually not a good match.
While the acoustic similarity results from Study I demonstrate some
resemblance between NSD /o/ and GOAT in SE, it is less clear why SSBE
listeners’ modal response to NSD /o/ was also GOAT, given the apparent lack of
acoustic similarity in Study I. This may be due to both SSBE and SE GOAT
exhibiting similar F1 values at onset (subsection 4.5.4 in Chapter 4) that is also
not too unlike NSD /o/ (see Figure 4.8 in Chapter 4) and the fact that the
movement in NSD /O/ makes it a closing diphthong may have prompted SSBE
and SE listeners’ to choose an English closing diphthong as well.
NSD /ø/ was found in Study I to be acoustically most similar to GOAT in
SSBE and NURSE in SE, but in Study IV SSBE and SE listeners primarily
assimilated this vowel to GOAT. While the acoustic and perceptual results
generally correspond for SSBE, this is clearly not the case for SE. It is not
surprising, however, that SE listeners assimilated this NSD diphthong to an
English diphthong category rather than the monophthong NURSE if it is
assumed SE listeners were sensitive to the salience of formant movement as
they were with the other NSD diphthongs. SE listeners may have frequently
assimilated NSD /ø/ to GOAT due to their familiarity with more standard
variants of GOAT, like that proposed for the assimilation of NSD /œy/ above.
This seems plausible given the acoustic dissimilarity of NSD /ø/ and GOAT in
SE. Specifically, the acoustic analyses of NSD, SSBE and SE vowels in Study I
showed that SE GOAT has a relatively low and falling F2, unlike NSD /ø/ which
has a much higher and rising F2, and also unlike SSBE GOAT which also has a
higher and rising F2.

8. Discussion and implications
180
The lack of correspondence between the acoustic and perceptual
similarity for the majority of NSD diphthongs may be due to the LDAs not
incorporating enough relevant information for classifying diphthongs across
languages. No previous studies have attempted to examine the acoustic
similarity of diphthongs across languages and only one study by Cebrian (2011)
has investigated the cross-language perceptual similarity of diphthongs.
Cebrian (2011) conducted a perceptual assimilation experiment on Catalan-
Spanish bilinguals listening to a selection of English diphthongs. The non-
native English diphthongs were chosen because they are phonetically similar
to Catalan diphthongs, as judged by their phonetic transcriptions rather than
by their acoustic properties. The results of the perceptual assimilation task
demonstrated that listeners assimilated the English diphthongs to the
phonetically most similar Catalan diphthongs. In other words, there was a
clear relationship between phonetic similarity and perceptual similarity. For
only two of the six non-native diphthongs from the present project, NSD /e/
and /ʌu/, there was a clear correspondence between perceptual similarity and
acoustic similarity. As can be seen in Figures 4.11 and 4.12 in Chapter 4, the
starting points and formant trajectories of NSD /e/ and /ʌu/ roughly
correspond to FACE and MOUTH, respectively, in both SSBE and SE. For the
other four NSD diphthongs /ɛi, œy, o, ø/, any correspondences of the formant
trajectories to those of English diphthongs are less clear, at least upon visual
inspection those plotted in Figures 4.11 and 4.12. Cebrian (2011) mostly found
correspondences between phonetic similarity and perceptual similarity of
diphthongs, but that study differs from Study IV in an important way: the non-
native diphthongs were specifically chosen a priori for their phonetic similarity
to native diphthongs, whereas all six NSD diphthongs were presented to
listeners in Study IV regardless of whether they could be considered to be
phonetically similar to any native diphthong. Nevertheless, it can be concluded
that the acoustic information employed in LDAs from Study I was not entirely
sufficient for measuring the acoustic similarity of diphthongs. As pointed out

8. Discussion and implications
181
earlier, LDAs have only been used in previous studies for the purpose of
measuring the acoustic similarity of monophthongs (e.g., Escudero and
Vasiliev, 2011) and therefore may not be entirely suitable for diphthongs. Thus
methods that are better able to incorporate the acoustic information necessary
to gauge the similarity of diphthongs are yet to be developed.
A more general issue is that diphthongs have largely been ignored in
previous research on speech perception, let alone in studies on cross-language
perception. The few studies available on diphthongs are inconclusive with
respect to what specific information in the acoustic signal determines the
perception of particular diphthongs in a given language. For instance, Fox
(1983) compared the perception of American English monophthongs and
diphthongs, but could not find a reliable perceptual dimension that directly
related to the salient dynamic properties of diphthongs, such as formant
movement and the direction of formant movement. Harrington and Cassidy
(1994) found that some acoustic properties in diphthongs may be irrelevant or
redundant in perception, although perception was not directly tested in their
study. In a statistical model classifying Australian English monophthongs and
diphthongs based on acoustic properties, Harrington and Cassidy (1994) found
that diphthongs required formant measurements at more than one time point
(i.e., beginning, midpoint and end) to be correctly classified, whereas
monophthongs did not. The only conclusion that can be drawn is not very
illuminating, i.e., simply that formant movement is important in the
perception of diphthongs. Harrington and Cassidy (1994) also ran further
statistical models with the same data to test whether the temporal ordering of
formant measurements would facilitate the classification of diphthongs, but
this did not make any difference. The types of acoustic measurements used by
Harrington and Cassidy (1994), such as formant measurements at three time
points and specifying their temporal ordering of the formant measurements,
were also included in the LDAs for both monophthongs and diphthongs in
Study I, but the results for diphthongs were still not as reliable as those for

8. Discussion and implications
182
monophthongs, as judged by their correspondence to listeners’ perception
results.
Given that relatively little is known about how listeners perceive
diphthongs, further investigation is certainly warranted to shed more light on
the perceptual assimilation patterns involving NSD diphthongs observed in
Study IV. As Study II only investigated monophthongs, there is no comparable
evidence to elucidate what acoustic information SSBE and SE listeners might
use to identify English diphthongs and non-native diphthongs. A starting point
for an investigation into the perception of diphthongs might look at the
approximate F1 and F2 location of the diphthongs at onset and their formant
trajectories. In the majority of the assimilation patterns observed for NSD /ɛi,
œy, o, ø/, the onsets of the NSD diphthongs very roughly corresponded to
those of the most frequently selected English diphthongs but the direction of
formant movement generally corresponded less well.
8.5. Relationship of perceptual assimilation and non-native
discrimination (Study IV and Study III)
In Chapter 7, predictions on the discrimination accuracy of the NSD contrasts
/ɑ-ɔ/, /ʌu-œy/, /ø-o/, /i-ɪ/ and /u-y/ were made in the framework of PAM on the
basis of the perceptual assimilation patterns observed by SSBE and SE listeners
in Study IV and these are summarised in Table 7.2 in Chapter 7. On
discrimination accuracy, SE listeners generally performed worse and this was
driven primarily by differences in discrimination accuracy scores for the NSD
contrast /ø-o/ and /ʌu-œy/. The following discussion evaluates the validity of
PAM’s predictions, i.e., whether listeners were as accurate as PAM predicted
and whether any expected differences between SSBE and SE listeners were in
fact borne out.
8. Discussion and implications
183
8.5.1. Perceptual assimilation and discrimination of NSD /ɑ-ɔ/
As noted in Chapter 7, the most striking observation regarding the
assimilation of the members of this vowel pair to native categories was that
SSBE and SE listeners assimilated both vowels to different native categories.
SSBE listeners primarily assimilated NSD /ɑ/ to STRUT and SE listeners to LOT.
For NSD /ɔ/, SSBE listeners perceived similarity to LOT, whereas SE listeners
found this vowel similar to FOOT. Nevertheless, the strength of assimilation of
both NSD vowels to native categories was approximately the same for the two
listener groups, resulting in similar predictions of discrimination accuracy.
Since both members were assimilated in a relatively weak fashion to native
categories, it can be regarded as UU-Type in the framework of PAM, but as
both NSD vowels were assimilated to separate native vowel categories,
discrimination accuracy was predicted to be fair to good. The results of Study
III showed that discrimination accuracy was good for both SSBE and SE
listeners and that there was virtually no difference between them. Despite the
different assimilation patterns exhibited by SSBE and SE listeners for the two
vowels in the NSD /ɑ-ɔ/ contrast, it is a novel finding that assimilation to
different native categories leads to the same levels of discrimination accuracy
due to roughly the same degrees of perceptual similarity to native categories.
8.5.2. Perceptual assimilation and discrimination of NSD /i-ɪ/
In Study IV both SSBE and SE listeners assimilated NSD /i/ and /ɪ/ in similar
ways and the only difference was found in their assimilation patterns for NSD
/ɪ/, but these were small relating to diverse assimilation patterns, possibly
arising from listeners’ difficulty categorising this NSD vowel. Crucially, there
appeared to be a degree of perceptual overlap since NSD /i/ and /ɪ/ both
assimilated to KIT, but NSD /ɪ/ was perceived to be a better match to KIT due to
the greater frequency of perceptual assimilation, leading NSD /i-ɪ/ being
regarded as a CG-Type assimilation in PAM. Hence this contrast was expected
to be discriminated at a fair to good level by both SSBE and SE listeners, but

8. Discussion and implications
184
Study III revealed that SSBE and SE listeners found this the most difficult
contrast, though it was discriminated well above the chance level of 50% with
both groups exhibiting median scores of 72%.
8.5.3. Perceptual assimilation and discrimination of NSD /ʌu-œy/
Study IV showed that SSBE and SE listeners exhibited different perceptual
assimilation patterns for the vowels in this NSD contrast. Specifically, both
listener groups assimilated NSD /ʌu/ to MOUTH, but the degree of perceived
similarity was greater for SSBE listeners. SSBE listeners perceived NSD /œy/ to
be most similar to GOAT, whereas SE listeners found it to be equally similar to
GOAT and MOUTH. While there is a degree of perceptual overlap between the
native categories that NSD /ʌu-œy/ assimilated to, this contrast was considered
as a UC-Type assimilation for both listener groups, due to NSD /œy/ being
‘uncategorizable’ since it assimilated more strongly to more than one category
than the ‘categorized’ NSD /ʌu/. However, the fact that there was greater
overlap between the members of this NSD contrast to native categories for SE
listeners led to the PAM prediction that SE listeners would perform fairly
accurately and SSBE listeners performing more accurately in discrimination.
The results of Study III confirmed this prediction because SE listeners on
average scored around 14% less than SSBE listeners (SSBE median: 82% and
SE median: 71%).
8.5.4. Perceptual assimilation and discrimination of NSD /ø-o/
In Study IV, it was observed that SSBE and SE listeners scarcely differed in
their perceptual assimilation of NSD /ø/ and /o/ to native vowel categories. For
both SSBE and SE listeners, there was a large degree of perceptual overlap
involving NSD /ø/ and NSD /o/ because both NSD vowels assimilated primarily
to a single category, namely GOAT. The two NSD vowels also assimilated to
other native categories some of the time, leading NSD /o/ to be assimilated
more strongly than NSD /ø/ to GOAT. Hence this assimilation pattern was

8. Discussion and implications
185
regarded as a CG-Type in the framework of PAM. On this basis, PAM would
expect discrimination accuracy to be fair to good for both SSBE and SE
listeners. The results of Study III showed that both listener groups performed
fairly well, but notably SE listeners performed on average approximately 13%
worse (SSBE median: 85% and SE median: 72%). As SSBE and SE listeners did
not differ in their assimilation patterns in Study IV, PAM would not have
predicted any difference in discrimination accuracy.
The fact that SE listeners performed worse is supported by the
evaluation in 8.4.16 above of SE listeners’ assimilating NSD /ø/ to GOAT in
Study IV. SE listeners may have made this assimilation due to their familiarity
with more standard variants of English GOAT, such as that in SSBE. Specifically,
SSBE GOAT has a rising F2, like NSD /ø/, rather than a falling F2, like that
exhibited in SE speakers’ realisation of GOAT. While SE listeners may be aware
of this, it is expected that representations of the standard variant (i.e., the cue of
a rising F2) will be much more robust in listeners for whom it is their native
representation, such as SSBE listeners (cf., Clopper, 2011). A rising F2 (as in
NSD /ø/ and SSBE GOAT) and a falling F2 (as in NSD /o/ and SE GOAT) could
both be perceptual cues to GOAT for SE listeners, thus leading to greater
confusion and therefore poorer discrimination of the NSD /ø-o/ contrast. For
SSBE listeners, on the other hand, a rising F2 would be expected to be a more
robust and reliable cue to GOAT, which is in stark contrast to the unfamiliar
falling F2 exhibited by NSD /o/, leading to better discrimination accuracy for
the NSD /ø-o/ contrast. To put it another way, NSD /o/ is a more deviant match
to GOAT than NSD /ø/ for SSBE listeners, whereas for SE listeners it is less clear
whether NSD /ø/ is more of a deviant match to GOAT due to interference from
the familiarity of a more standard representation of GOAT. This finding is
comparable to Clopper (2011) in which two representations were activated by
Northern American listeners, i.e., their native accent and standard variants,
leading to the task being more difficult than for General American listeners.

8. Discussion and implications
186
8.5.5. Perceptual assimilation and discrimination of NSD /u-y/
In Study IV, both NSD /u/ and /y/ were most often assimilated to GOOSE by
SSBE listeners and SE listeners. NSD /u/ was also less frequently assimilated to
FOOT and to GOAT, indicating that it was not perceived as an excellent
exemplar of GOOSE for both SSBE and SE listeners. NSD /y/, on the other hand,
was much more strongly assimilated to GOOSE by SSBE listeners than SE
listeners. For SSBE listeners, the NSD contrast /u-y/ was regarded as a CG-Type
assimilation because NSD /y/ was perceived to be much more similar to GOOSE
than NSD /u/. For SE listeners, this contrast was also construed as a UC-Type
assimilation, with NSD /y/ was also only a slightly better match for GOOSE than
NSD /u/. Due to one of the two non-native vowels being a comparatively better
match to a native category for SSBE listeners, it was expected that
discrimination accuracy of the vowels in the NSD contrast /u-y/ could be
slightly better for SSBE listeners. In Study III, it SSBE listeners did indeed
perform slightly better than SE listeners, scoring on average 7% higher than
SE listeners.
8.6. Implications of the findings
This section examines some implications of this project regarding the role of
listeners’ native accent in the cross-language acoustic and perceptual similarity
of vowels as well as some other wider implications. Firstly, the implications for
comparing vowels across languages and accents are discussed. Secondly, the
implications for research on cross-language speech perception and PAM are
outlined and lastly, implications for L2 learning are considered.
8.6.1. Implications for comparing vowels across languages and accents
Study I showed that SSBE and SE differ in their phonological vowel inventories
but that the main differences were phonetic, as indicated by differences in the
acoustic properties of some monophthongs and most of the diphthongs. The
phonological difference of the vowel inventories of SSBE and SE, namely that

8. Discussion and implications
187
SSBE exhibits the STRUT-FOOT split and thus has an additional vowel category,
led to NSD /ɑ/ being classified mainly as STRUT in SSBE but primarily as LOT in
SE on the basis of vowel acoustics. That the difference in the phonological
vowel inventories of two accents of the same language had a direct impact on
acoustic similarity of vowels to those in another language is a novel finding.
Furthermore, the acoustic differences between SSBE and SE vowels, indicating
phonetic differences (Strange, 2007), led to five further NSD vowels /a, ø, ɔ, u,
ʏ/ being acoustically most similar to different English vowel categories. The
implication here is that differences between some of the vowels in two accents
of the same language led to differences in acoustic similarity to another
language’s vowels. While this has been found before for two Czech accents
compared to NSD (Chládková and Podlipský, 2011), two Dutch accents
compared to SSBE (Escudero et al., 2012) and two Spanish accents compared to
NSD (Escudero and Williams, 2012), no study has examined as complete a set
of vowels from the vowel inventories of accents and languages involved as has
been investigated in the present project.
A major implication of the present project is that it underlines the
current lack of research and methods for investigating the acoustic and
perceptual properties of diphthongs. The inclusion of acoustic information
from different time points of a vowel’s duration and the temporal ordering of
the information from those time points generally still results in diphthongs
not being classified as diphthongs (cf., Harrington and Cassidy, 1994; Escudero
and Vasiliev, 2011; Jacewicz and Fox, 2012) despite undoubtedly being
perceived as diphthongs in the cross-language perception results from the
present project. Further research is required on the perceptual relevance of
acoustic cues in diphthongs.
8.6.2. Implications for cross-language speech perception and PAM
The most significant implications of this project relate directly to studies on
cross-language speech perception and in particular to PAM that was
specifically developed for this branch of speech perception research (Best, 1995;
8. Discussion and implications
188
Best and Tyler, 2007). As noted in Chapter 2, few studies have investigated
cross-language perceptual similarity of vowels across languages while also
incorporating different varieties of the same language. However, very recent
studies are beginning to investigate differential effects of listeners’ particular
native accent in the perception of non-native vowels and specifically with
regard to perceptual assimilation (e.g., Chládková and Podlipský, 2011;
Escudero et al., 2012). PAM does not rule out an effect of native accent since it
emphasises the roles of individuals’ environment and linguistic experience in
the development of speech perception (Best and Tyler, 2007), but it does
require clarification on this specific issue. Other models on speech perception,
on the other hand, such as exemplar-based approaches, offer greater explicit
compatibility with the present findings because native accent has at least been
mentioned and/or discussed in their frameworks in previous research (e.g.,
Evans and Iverson, 2004; Clopper, in press).
The most significant implication of this project is that listeners from
different accent backgrounds perceptually assimilate several non-native vowels
differently to native vowel categories. This demonstrates a profound effect of
individuals’ linguistic experience in cross-language speech perception that
goes beyond just native language, but also is affected by individuals’ specific
accent of their native language. A perceptual assimilation study by Chládková
and Podlipský (2011) found different perceptual assimilation patterns by
listeners from two Czech accents, but mainly for one non-native vowel. The
present project has revealed several differences between SSBE and SE listeners
in their cross-language perception, arising from a greater number of
differences between SSBE and SE speakers’ English vowel production (Study I)
and SSBE and SE listeners’ English vowel perception (Study II). Recall that
Study I demonstrated that SSBE and SE differed in their production of several
English vowels, namely LOT, NURSE, PALM, TRAP, THOUGHT, FOOT, GOOSE, GOAT,
PRICE and CHOICE. Chládková and Podlipský (2011) only found a difference in
the realisation of one Czech vowel between the two accents in their study,
namely /iː/, which affected listeners’ assimilation patterns of two NSD vowels.
8. Discussion and implications
189
Study II showed that SSBE and SE listeners differed in their use of vowel
formants to identify the English monophthongs LOT, NURSE, PALM, TRAP,
THOUGHT and tentatively also FOOT and GOOSE. Furthermore, Study I and
Study II together confirmed the phonological difference between SSBE and SE
involving STRUT in both perception and production. The implication of the
present project is that the greater the phonetic and phonological differences
between accents of a language, the greater the differences in cross-language
perception.
Although PAM is compatible with the finding of an effect of native
accent in cross-language perception, it has not yet been explicitly accounted
for. In discussing the implications of the present project for PAM, the model’s
theoretical roots must not be ignored. As mentioned in Chapter 2, PAM is
based on the direct-realist account of speech perception in which
‘the perceiver directly apprehends the perceptual object and does not
merely apprehend a representative or “deputy” from which the object
must be inferred (Best, 1995: 173; author’s own italics).
That is, PAM rejects the notion of listeners having representations of speech
sounds. Instead, perception is directly guided by listeners’ knowledge of the
dynamic articulatory gestures of the vocal tract carried in the speech signal
(Best and McRoberts, 2003). To account for the differential perceptual
assimilation patterns observed in Study IV, PAM would argue that SSBE and
SE listeners differ in their knowledge of the gestures of the vocal tract
regarding vowel sounds which would operate on two levels. The first level
relates to the difference in phonological vowel categories or ‘functional
equivalent classes’ of vowels, as termed in later formulations of PAM (e.g., Best
et al., 2001). The SSBE STRUT vowel category, for example, contains
articulatory variants that serve a common phonological function that are
distinct from those for SSBE FOOT, which is not the case for SE. The second
level relates to the phonetic differences in listeners’ knowledge of the
articulatory variants that serve the same phonological function in both SSBE
8. Discussion and implications
190
and SE. Given such differences, PAM predicts differences in the perceptual
assimilation of non-native vowels depending on the perceived similarity to (or
dissimilarity from) ‘the native segmental constellations that are in closest
proximity to them in the native phonological space’ (Best, 1995: 193). For
example, SSBE and SE exhibit the same phonological category for LOT, but its
place in phonological space differs in proximity to NSD /ɔ/, being closer in
SSBE than SE, due to the different articulatory gestures in SSBE and SE that
serve the phonological function of LOT. As noted in Chapter 2, the articulatory
variants or gestural constellations (e.g., movements of articulators, degree and
place of constriction) of vowels have so far not been completed within the
framework of PAM, providing no concrete basis on how PAM would interpret
the present example. It could be that in SSBE LOT exhibits a higher
constriction in the oral cavity than in SE (as indicated by a significantly lower
F1), therefore making NSD /ɔ/ closer to LOT in the phonological space of SSBE
than in that of SE.
The perceptual assimilation patterns from Study IV were used to make
predictions on discrimination accuracy based on PAM and the evaluation of
these in 8.5 demonstrated that the predictions were generally borne out. The
one exception was that PAM did not predict a difference in the discrimination
accuracy of the NSD /ø-o/ contrast since the assimilation results for SSBE and
SE listeners did not differ but SE listeners were actually less accurate in
discrimination. It was proposed that SE listeners’ assimilation of NSD to /ø/ to
GOAT was motivated by their familiarity with more standard variants of GOAT,
but their greater confusion of NSD /ø-o/ was a result of their less robust
knowledge of the standard variant of GOAT (cf., Clopper, 2011). PAM does not
explicitly incorporate into its framework this type of hypothesis, namely, that
native phonology may also include some familiarity with the phonetic variants
of other accents of the same language, such as a standard variety (Clopper and
Bradlow, 2008, and Clopper, in press), even if the knowledge of standard is less
robust than the native accent (Clopper and Tamati, 2010; Clopper, 2011;
8. Discussion and implications
191
Clopper, 2012; cf., also Evans and Iverson, 2004). At present, it is unclear how
this would be incorporated into the framework of PAM.
Work is currently underway in the framework of PAM that explores the
developmental aspects of non-native accent perception. Results so far have
shown that infants are not able to accurately perceive the phonological
categories of vowels produced in a non-native accent at 15 months of age by
means of a familiar word recognition task, but infants are able to do so by 19
months of age (Best et al., 2009). This finding supports a hypothesis that in the
development of speech perception there is initially a strong bias toward the
native accent, but the perception of deviant non-native variants is aided as
native phonology develops. While it has not yet been spelled out how this
would relate to cross-language perception in adults, the early bias toward the
native accent in phonological development may still persist in some way into
adulthood. Of course, further research in the framework of PAM needs to be
carried out to clarify its effect in cross-language speech perception.
Exemplar-based approaches to speech perception have been used as an
alternative theoretical account to interpret the effect of native accent in cross-
dialect speech perception (Clopper and Bradlow, 2008; Clopper, in press; cf.,
also Evans and Iverson, 2004). Exemplar-based approaches state that
phonetically detailed representations of sounds are stored in long-term
memory (Johnson, 1997). Pierrehumbert (2001: 140) describes these as being:
‘represented in memory by a large cloud of remembered tokens of that
category. These memories are organized in a cognitive map, so that
memories of highly similar instances are close to each other and
memories of dissimilar instances are far apart. The remembered tokens
display the range of variation that is exhibited in the physical
manifestations of the category’.
If tokens of a category are stored as separate exemplars, then frequently
encountered categories will be more numerous than less frequently
encountered ones. The more frequent categories have more activated

8. Discussion and implications
192
exemplars. Individuals growing up in an environment in which one accent of a
language is more frequently encountered will have many activated exemplars
for the categories in that accent in long-term memory. Nevertheless,
individuals will also have stored exemplars from many other accents,
especially the standard because this will be often encountered, for example, in
the media (Clopper and Bradlow, 2008). There will be many tokens stored the
longest in long-term memory that are from the native accent environment.
This will affect how newly, or less frequently encountered exemplars, are
stored in memory, such as those encountered in another accent. On this
account, SSBE and SE listeners in this project would have in their life time
encountered their native accent more frequently than any other accent and for
the longest time. In Study IV, listeners would have categorised the incoming
NSD vowel stimulus that matches the most similar stored exemplars of a
particular category. However, on some occasions the most similar exemplars
may be one with few exemplars, such as that from another accent. This would
apply to the cases when SE listeners selected FOOT and GOAT in a similar
manner to SSBE listeners. Given the less robust representation of more
standard-like exemplars in the GOAT category of SE listeners, being less
numerous than the more numerous and activated SE exemplars of GOAT, SE
listeners were less able to distinguish vowels belonging to this category.
Exemplar-based approaches therefore appear capable of explaining the
hypothesis that listeners are able to use phonetically different variants of a
single phonological category, such as a stored exemplar from another accent,
in perception but the representation of this variant is more poorly specified
than the more frequently encountered native ones stored in long-term
memory.
The final implication relating to cross-language perception is a
methodological issue regarding tapping into perceptual similarity. As
mentioned in Chapter 2, Likert scales were not used in Study IV to gauge
perceptual similarity judgments and the frequency of responses was used
instead, as per findings from Levy (2009a) and Levy (2009b). It appears, though,
8. Discussion and implications
193
that this was not an entirely adequate approach either. As found in the present
project, a confounding factor in tapping into perceptual similarity is that
listeners’ native category responses could be influenced by their familiarity
with other accents of their native language. Tasks that demand a greater
processing effort, such as the AXB task in Study III, tap better into listeners’
perceptual abilities (i.e., more demanding tasks like that reported in Clopper,
in press) than tasks which ask for explicit judgments of similarity.
8.6.3. Implications for L2 speech learning and L2 acquisition
One purpose of studies on cross-language speech perception has been to
uncover beginning L2 learners’ ‘initial states’ (e.g., Strange, 2007; Gilichinskaya
and Strange, 2010; Escudero and Williams, 2011). The present project suggests
that SSBE and SE individuals would have somewhat divergent initial states
when beginning to learn the vowels in the NSD vowel inventory. This is shown
most clearly in the discrimination results from Study III in which SE listeners
were on average slightly worse at discriminating NSD /ø-o/ and /ʌu-œy/.
However, in L2 learning, there are many factors that can influence perceptual
learning beyond prior linguistic experience, such as L2 exposure and input,
formal language instruction and motivation to learn the L2, and it remains to
be seen whether having an SSBE or SE accent will have any significant or
particularly noticeable effects in the long run. Notwithstanding, recent
evidence suggests that some differences between native accents of a language
can be long-lasting in L2 learning, even after years of exposure to it and living
in a L2 speaking country (Escudero and Williams, 2012).
As pointed out in the review of previous research in Chapter 2, another
factor involved in L2 learning is the particular variety of a language
individuals are exposed to. This is very evident in cross-language perception,
where differential perceptual assimilation patterns have been shown to depend
on the stimulus accent (e.g., Escudero and Chládková, 2010), and also in L2
learning, where the relevance of the particular accent of the target language
has been demonstrated (e.g., Escudero and Boersma, 2004). In line with these

8. Discussion and implications
194
previous findings, it is expected that the SSBE and SE listeners would perform
differently if presented with vowel stimuli from other varieties of Dutch, such
as Southern Standard Dutch. The most striking acoustic differences between
NSD and Southern Standard Dutch relate to diphthongs rather than the
monophthongs (Adank et al., 2004; Adank et al., 2007) and SSBE and SE
listeners could be sensitive to this in perceptual assimilation patterns, for
example.
Finally, the acoustic similarity results of NSD monophthongs from
Study I could provide a resource for teachers of Dutch as a foreign language
who use NSD as a model to teach British English learners. The acoustic
similarity results detail which English monophthongs could be used as a basis
for learning the NSD sounds. For example, learners of NSD could be informed
that in accents of Northern British English NSD /ɑ/ is similar to LOT whereas in
accents of Southern English NSD /ɑ/ is similar to STRUT. However, it cannot be
predicted how effective this advice would be in helping learners to accurately
produce NSD /ɑ/.
8.7. Summary
This chapter has summed up the responses to the questions of the four studies
and how the findings of the four studies relate to one another to investigate
the role of listeners’ native accent in the cross-language acoustic and
perceptual similarity of vowels. The results of Study I and Study II were
discussed together and it was observed that acoustic differences in the
production of English monophthongs generally corresponded to differences in
the spectral information used to identify them. The relationship between the
acoustic and perceptual similarity of each of the 15 NSD vowels to native
vowel categories by SSBE and SE listeners was evaluated because a common
finding in cross-language speech perception is that acoustic similarity predicts
perceptual assimilation. For six of the nine NSD monophthongs, this was
found to be the case. Two of the exceptions were NSD vowels with low F1 and

8. Discussion and implications
195
F2 values and in previous cross-language studies it has been found that British
English listeners perceive vowels with a low F2 to be similar to native vowels
with a much higher F2. The third exception was a monophthong that was
perceived to be similar to the same English vowel category by both SSBE and
SE listeners, despite its acoustic dissimilarity from the SE realisation. It was
suggested that SE listeners perceived this NSD vowel as an instance of a more
standard English variant. For the NSD diphthongs, acoustic similarity
generally did not reliably predict listeners’ perceptual similarity and this may
be due to the methods used to gauge acoustic similarity not being adequate for
diphthongs, despite the inclusion of dynamic spectral information, as in
previous research. It is uncertain what additional acoustic information would
be necessary to include for diphthongs because relatively little attention has
been paid to the perception of diphthongs in the literature.
PAM is an influential model in the study of cross-language speech
perception and one of its key claims is that perceptual similarity predicts non-
native discrimination accuracy. For the five NSD contrasts involved in the
discrimination task in Study III, PAM’s predictions were largely borne out,
except in one case in which SE listeners unexpectedly performed worse than
SSBE listeners. This result, that was not predicted by PAM, is consistent with
the view that SE listeners labelled one of the NSD vowels in the perceptual
assimilation task in Study IV not on the basis of a native representation, but on
the basis of a more standard variant, such as that in SSBE. This explains why
SE listeners exhibited poorer discrimination of this NSD contrast due to a
degree of perceptual confusion.
This chapter then examined some of the overall implications of this
project. Many differences were found between SSBE and SE vowels in
production, more so than in the few previous studies that have investigated
vowels across accents of the same language, and this led to differences in the
acoustic similarity of some non-native vowels to these variants of English
vowels. This project contributes to the growing number of studies that
examine the effect of listeners’ native accent in cross-language speech

8. Discussion and implications
196
perception. Unlike the few previous studies carried out thus far, the two
accents involved in the present project were found to exhibit several
differences, rather than just a few, leading to a greater number of differences
in cross-language speech perception. While PAM implicitly embraces the
finding that listeners from different native accent backgrounds perceive some
non-native vowels differently, the theory needs more explicit clarification on
its position on the matter. Furthermore, PAM also needs to account for the fact
that listeners from different accents may sometimes perceive non-native
sounds to be similar to sounds in a different (i.e., non-native) accent of their
native language. It was demonstrated that an alternative account of speech
perception, exemplar theory, provides a more explicit account for the
influence of listeners’ familiarity with other accents of their native language,
such as the standard, in cross-language speech perception. Current means of
tapping into cross-language perceptual similarity do not integrate this fact into
their methodologies. It was proposed that presenting listeners with a more
demanding perception task may better tap into judgments on perceptual
similarity. Lastly, this project has outlined some implications for L2 learning,
namely that learners from different accents will have different initial states
when starting out to learn the L2.

9. Conclusion
197
9.
Conclusion
9.1. Overall conclusion
This project has found that listeners’ native accent plays a significant role in
the cross-language acoustic and perceptual similarity of vowels. This effect of
listeners’ native accent in this context is only just beginning to be investigated
and has so far been demonstrated in only a handful of studies (Chládková and
Podlipský, 2011; Escudero et al., 2012; Escudero and Williams, 2012). The
present project surpasses the few previous studies by investigating whole vowel
inventories, rather than just a selection of vowel categories. It therefore
provides a more thorough account of what patterns of cross-language acoustic
and perceptual similarity are possible involving individuals from different
native accent backgrounds. The listeners’ native accents in this project not only
differed phonetically, but also phonologically. The vowel inventories of SSBE
and SE differ phonologically as SSBE exhibits a vowel category not found in SE,
the STRUT vowel, and this played a role in the differences in acoustic and
perceptual similarity of NSD /ɑ/ to SSBE and SE vowels, with NSD /ɑ/ being
acoustically and perceptually closest to SSBE STRUT. For the 15 vowel
categories that SSBE and SE share, reliable acoustic-phonetic differences were
found for the monophthongs LOT, NURSE, PALM, THOUGHT, FOOT and GOOSE and
marginally also for KIT and TRAP, and for the diphthongs CHOICE, GOAT, PRICE
and FACE. For these particular monophthongs, it was also shown that SSBE and
SE listeners make differential use of spectral properties to identify them.
In line with previous studies, the acoustic similarity of non-native
vowels to native vowels broadly corresponded to listeners’ perceptual similarity
(e.g., Strange et al., 2004; Strange et al., 2005; Strange et al., 2009;
Gilichinskaya and Strange, 2010; Escudero and Vasiliev, 2011; Escudero et al.,

9. Conclusion
198
2012). However, this was generally not the case for diphthongs and for
monophthongs with low F1 and F2 values, i.e., the high back vowels NSD /u/
and /ɔ/. Additionally, some non-native vowels were apparently not perceived by
SE listeners in terms of the acoustically closest vowels in their native accent,
but in terms of their knowledge of more standard accent variants of the same
phonological vowel category. This latter finding demonstrates that listeners
are able to shift their perception when confronted with unfamiliar speech
sounds to those in a non-native but familiar accent. This interpretation is not
unreasonable as it closely resembles the finding from research on cross-dialect
speech perception that listeners make use of a standard accent in their
perception of unfamiliar non-native accents (Clopper and Bradlow, 2008;
Clopper, 2012; Clopper, in press). The results from the present project also
share a finding from research on cross-dialect speech perception in a further
way: the effect of native accent is pervasive even in those situations when
listeners attempt to shift their perception (Evans and Iverson, 2004; Clopper
and Tamati, 2010; Clopper, 2011; Clopper, 2012); recall that in Study III SE
listeners were less accurate at discriminating those non-native vowels that they
perceived in terms of more standard variants in Study IV.
The theoretical model of cross-language speech perception PAM
consulted in this project fails to account explicitly for some of the above
conclusions. PAM does not explicitly account for the fact that listeners are able
to adapt to unfamiliar speech and that this may be a result of listeners’
knowledge of non-native accents, such as more standard variants of a
particular phonological category. Other approaches to speech perception, such
as exemplar theory, can offer an explicit explanation because they are capable
of incorporating the varied nature of individuals’ native language experience
and how this might influence the perception of unfamiliar non-native speech.
9.2. Evaluation and future research
There are further merits to the present project beyond the conclusions drawn
above. On the other hand, there are also some limitations which present new
9. Conclusion
199
opportunities for further research. This section evaluates the whole project and
suggests some ideas for areas of future research.
A by-product of Study I is the wealth of new acoustic data on the vowels
of NSD, SSBE and SE. Specifically, Study I offers the first complete acoustic
descriptions of the vowels of SSBE and SE. The motivation for collecting this
data was borne out of the fact that no previous studies have set out to describe
as many of the vowels of SSBE as the present project and no previous studies
have investigated the acoustic properties of the vowels of SE. Furthermore,
Study I presents a more reliable acoustic description of the vowels of NSD than
previous studies because all speakers were recorded in a speech laboratory
setting. Moreover, as the vowels in Study I were produced in a variety of
phonetic contexts (i.e., citation form, sentence form, monosyllables, disyllables,
six different consonantal contexts), the three acoustic descriptions afford a
solid basis for future research on the acoustic properties of NSD, SSBE and SE
vowels and phonetic context effects.
Much of the previous research on the acoustic properties and
perception of vowels has concentrated on monophthongs, since these can
generally be reduced to vowel targets, i.e., formant measurements made at
vowel midpoint, and therefore lend themselves more straightforwardly to
investigation. From the few studies that have focused on diphthongs, it is still
unclear what specific acoustic information is relevant for listeners. The review
of Study I and Study IV in Chapter 8 highlighted that the method used to
gauge the acoustic similarity of NSD vowels to SSBE and SE vowels was not
particularly successful with diphthongs, even though the dynamic spectral
properties of vowels were accounted for by including formant measurements
from three time points and specifying the order of them. The results from this
project thus point toward the need for further research on the perception of
diphthongs.
Study II uncovered some differences in the use of spectral properties to
identify English monophthongs by SSBE and SE listeners and demonstrated
that these mostly corresponded to acoustic differences of how these

9. Conclusion
200
monophthongs are actually produced by SSBE and SE speakers, respectively.
Given the limitations of the synthetic vowel stimuli used in Study II, i.e., they
did not exhibit a great deal of formant movement, the results cannot be
directly generalised to the perception of naturally produced vowels. This is
because formant movement may be a perceptual cue for some monophthongs
such as GOOSE for SSBE listeners (Chládková et al., in preparation) and possibly
also for SE listeners (Williams, 2012). Additionally, as formant movement is a
defining feature of diphthongs, the limited nature of the synthetic vowel
stimuli in Study II meant that English diphthongs were not included as
possible response options. Synthetic vowel stimuli could have been created
with varying degrees and directions of formant movement, but this would
have dramatically increased the number of individual stimuli and resulted in a
very impractical listening task. Despite the limitations of the synthetic vowel
stimuli, SSBE and SE listeners nevertheless displayed differential use of
formants to label some of the English monophthongs, indicating the effects of
listeners’ native accents in perception.
The naturally produced stimuli in Study III and Study IV were taken
from a single phonetic context, namely fVf monosyllables, and in doing so
these two studies did not account for possible phonetic context effects on
perceptual assimilation patterns and discrimination accuracy. It has been
reported that naïve listeners in cross-language speech perception studies are
sensitive to the phonetic context of the non-native vowel stimulus, affecting
the degree of perceptual similarity and discrimination accuracy. For example,
Levy (2009a) has shown that American English listeners perceive Parisian
French /y/ to be a better perceptual match to American English /u/ produced in
an alveolar context rather than in a labial context. This is explained by
American English /u/ exhibiting a much higher F2 in alveolar contexts,
making it acoustically closer to Parisian French /y/. Furthermore, Levy (2009b)
reports that American English listeners make more discrimination errors on
the Parisian French contrast /u-y/ when produced in an alveolar context than in

9. Conclusion
201
a labial context. It is clear that phonetic contexts, such as consonantal context
as investigated by Levy (2009a) and Levy (2009b), influence the acoustic
properties of NSD monophthongs. For instance, Van Leussen et al. (2011)
found that NSD vowels are sensitive to these phonetic context effects and
listeners could be could be affected by this in their perceptual assimilation
patterns and discrimination errors.
The present project has had much to say about the nature of listeners’
phonetic and phonological knowledge of their native language encompassing
their particular accent as well as, to a lesser extent, other accents. As discussed
in Chapter 8, two aspects of research on cross-dialect speech perception have
been particularly helpful in interpreting some of the findings from this project.
Namely, (1) that listeners may show a bias toward standard variants, especially
in difficult listening conditions, because of their familiarity with it and (2) that
there is still an overarching effect of native accent, especially in demanding
tasks such as the discrimination experiment in Study III. Taken together, these
two facets suggest that listeners’ phonetic knowledge of the speech sounds in
their native accent is more robust than that of other accents they are familiar
with. However, two aspects from the research on cross-dialect perception have
thus far been investigated independently. Future research would therefore
benefit from an investigation that combines these two facets in a single study.
Such a study would certainly elucidate the findings from the present project.
9.3. Final remarks
The present project contributes to the understanding of cross-language speech
perception by demonstrating that linguistic experience is more complex and
far-reaching than simply native language because it relates to listeners’
specific native accent. Furthermore, listeners’ linguistic experience does not
only encompass a single accent of a language as listeners can make some use
of their familiarity with non-native accents in the perception of unfamiliar
non-native speech. Nevertheless, native accent still appears to have a profound
overall effect in speech perception. Future research on speech production and

9. Conclusion
202
perception should therefore carefully consider the specific native accents of
participants.

Appendices
203
Appendices
Appendix A: NSD individuals’ background data
Participant
code Gender
Age
(yrs) Birth place
Self-reported foreign
languages
Languages Level
NS01
F 23 Utrecht, Utrecht
English
German
French
Swedish
5
4
2
2
NS02
F 26 Alkmaar, North
Holland
English
French
German
isiXhosa
4
2
2
1
NS03
F 20 Hilversum,
North Holland
English
German
French
4
3
2
NS04
F 20 Leiden, South
Holland
English
French
German
Spanish
4
3
2
3
NS05
F 27 Haarlem, North
Holland
English
French
German
7
2
3
NS06
F 25 Zoetermeer,
South Holland
English
French
German
Welsh
Irish
7
2
3
2
2
NS07
F 28 Gouda, South
Holland
English
German
French
Spanish
4
2
1
1
NS08
F 18 Amstelveen,
North Holland
English
Spanish
Frisian
5
2
2
NS09
F 20 Hoorn, North
Holland
English
French
German
5
1
2
NS10
F 18 Amsterdam,
North Holland
English
French
German
Spanish
5
2
2
3
NS11
M 22 Heerhugowaard,
North Holland
English
French
German
4
4
3
NS12
M 25 Amsterdam,
North Holland
English
German
French
7
3
3

Appendices
204
NS13
M 21 Heemstede,
North Holland
English
French
German
5
2
3
NS14
M 22 Purmerend,
North Holland
English
French
German
6
2
4
NS15
M 23 Utrecht, Utrecht
English
French
German
7
1
2
NS16 M 20
Zaandam. North
Holland
French
German
1
3
NS17
M 19 Haarlem, North
Holland
English
French
German
5
1
1
NS18
M 23 Hoorn, North
Holland
English
French
German
Spanish
6
3
3
1
NS19
M 22 Voorburg, South
Holland
English
French
German
6
4
4
NS20
M 19 Purmerend,
North Holland
English
German
French
6
4
2
Participant
code Gender
Ager
(yrs) Birth place
Self-reported foreign
languages
Languages Level

Appendices
205
Appendix B: SSBE individuals’ background data
Part-
icipant
code
English
accent
group
Gender Age
(yrs) Birth place
Places of residence Self-reported foreign
languages
Town/city Time
(yrs) Languages Level
SS01
SSBE F 23 Hampshire London 3 - -
SS02
SSBE F 20 Dover, Kent London 3 French 1
SS03 SSBE F 21
Cambridge,
Cambridges
hire
London 4 French
Spanish
2
1
SS04
SSBE F 19 Brighton,
East Sussex London 1 - -
SS05
SSBE F 23 Essex London 4
French
Italian
Spanish
3
1
3
SS06
SSBE F 25
Cambridge,
Cambridge-
shire
London 6 French
Spanish
1.5
1.5
SS07
SSBE F 19 Kingston,
Surrey
London
Hampshir
e
1 French
Spanish
1
2
SS08
SSBE F 18 Eastbourne,
East Sussex London 1 French 2
SS09
SSBE F 22 London London - Hebrew 3
SS10
SSBE F 24 London
London
Horsham,
West
Sussex
6
17
French
Spanish
1
3
SS11
SSBE M 21 London London -
French
German
Hebrew
2
1
3
SS12
SSBE M 26 Hampshire London 3 - -
SS13
SSBE M 26 Hampshire London 2 French 2
SS14
SSBE M 19 Guildford,
Surrey London 1 - -
SS15
SSBE M 30 London London -
French
Japanese
Spanish
3
3
3
SS16
SSBE M 27 Bedford,
Bedfordshire London 6 - -
SS17
SSBE M 29 Bedford,
Bedfordshire
London
4 - -

Appendices
206
Appendix C: SE individuals’ background data
Part-
icipant
code
English
accent
group
Gender Age
(yrs) Birth place
Places of residence Self-reported foreign
languages
Town/city Time
(yrs) Languages Level
SE01
SE F 22 Doncaster Sheffield 15 French 3
SE02
SE F 27 Sheffield Sheffield - - -
SE03
SE F 26 Sheffield Sheffield - Italian
Spanish
3
2.5
SE04
SE F 18 Rotherham Sheffield 16 Spanish 2
SE05
SE F 23 Sheffield Sheffield - Spanish 1
SE06
SE F 30 Sheffield Sheffield - French 1
SE07
SE F 21 Sheffield Sheffield - French 2
SE08
SE F 19 Sheffield Sheffield - French 3
SE09
SE F 22 Sheffield Sheffield - - -
SE10
SE F 20 Sheffield Sheffield - - -
SE11
SE F 20 Sheffield Sheffield - - -
SE12
SE M 20 Sheffield Sheffield - - -
SE13
SE M 24 Sheffield Sheffield - - -
SE14
SE M 22 Sheffield Sheffield - - -
SE15
SE M 19 Sheffield Sheffield - - -
SE16
SE M 20 Rotherham Sheffield 12 French
Spanish
3
3
SE17
SE M 24 Sheffield Sheffield - -

Appendices
207
Part-
icipant
code
English
accent
group
Gender Age
(yrs) Birth place
Places of residence Self-reported foreign
languages
Town/city Time
(yrs) Languages Level
SE18
SE M 22 Rotherham Sheffield 10 -
SE19
SE M 29 Barnsley Sheffield 21 -
SE20
SE M 20 Sheffield Sheffield - French 2
References
208
References
Adank, P., Smits, R. and Van Hout, R. (2004). ‘A comparison of vowel
normalization procedures for language variation research’, Journal of
the Acoustical Society of America 116, 3099-3107.
Adank, P., Van Hout, R. and Smits, R. (2004). ‘An acoustic description of the
vowels of Northern and Southern Standard Dutch’, Journal of the
Acoustical Society of America 116, 1729-1738.
Adank, P., Van Hout, R. and Smits, R. (2007). ‘An acoustic description of the
vowels of Northern and Southern Standard Dutch II: Regional varieties’,
Journal of the Acoustical Society of America 121, 1130-1141.
Appelbaum, I. (1996). ‘The lack of invariance problem and the goal of speech
perception’, in H. Bunell and W. Isardi (eds.) Proceedings of the Fourth
International Conference on Spoken Language Processing, 1541-1544
Bank, R. (2009). ‘Re-analyzing Dutch vowels. A re-analysis of the Adank 2004
data’. Unpublished term paper, University of Amsterdam.
Best, C. (1995). ‘A Direct Realist View of Cross-Language Speech Perception’, in
W. Strange (ed.) Speech Perception and Language Experience: Issues in
Cross-Language Research (Baltimore: York Press), pp. 171-204.
Best, C. and McRoberts, G. (2003). ‘Infant Perception of Non-Native Contrasts
that Adults Assimilate in Different Ways’, Language and Speech 46,
183-216.
Best, C. and Tyler, M. (2007). ‘Nonnative and second-language speech
perception: Commonalities and complementaries’, in O.-S. Bohn and M.
Munro (eds.) Language Experience in Second Language Speech
Learning. In Honor of James Emil Flege (Amsterdam: John Benjamins),
pp. 13-24.
References
209
Best, C., Faber, A. and Levitt, A. (1996). ‘Perceptual assimilation of non-native
vowel contrasts to the American English vowel system’, Journal of the
Acoustical Society of America 99, 2602.
Best, C., Hallé, P., Bohn, O.-S. and Faber, A. (2003). ‘Cross-language perception
of non-native vowels: Phonological and phonetic effects of listeners’
native language’, in M. Solé, D. Recasens and J. Romero (eds.)
Proceedings of the 15th International Congress of Phonetic Sciences,
pp. 2889-2892.
Best, C., McRoberts, G. and Goodell, E. (2001). ‘Discrimination of non-native
consonant contrasts varying in perceptual assimilation to the listener’s
native phonological system’, Journal of the Acoustical Society of
America 109, 775-794.
Best, C., Traill, A., Carter, A., Harrison, K. and Faber, A. (2003). ‘!Xóõ click
perception by English, Isizulu, and Sesotho listeners’, in M. Solé, D.
Recasens and J. Romero (eds.) Proceedings of the 15th International
Congress of Phonetic Sciences, pp. 853-856.
Best, C., Tyler, M., Gooding, T., Orlando, C. and Quann, C. (2009).
‘Development of phonological constancy: toddlers’ perception of native
and Jamaican-accented words’, Psychological Science 20, 539- 542.
Boersma, P. and Weenink, D. (2011). ‘Praat: doing phonetics by computer
(version 5.2.26)’, (computer program), http://www.praat.org/ (last viewed
26/05/2011).
Booij, G. (1995). The Phonology of Dutch (Oxford: Oxford University Press).
Browman, C. and Goldstein, L. (1989). ‘Articulatory gestures as phonological
units’, Phonology 6, 201-251.
Brunellière, A., Dufour, S., Nguyen, N., Hans Frauenfelder, N. (2009).
‘Behavioral and electrophysiological evidence for the impact of
regional variation on phoneme perception, Cognition 111, 390-396.
Brunellière, A., Dufour, S., Nguyen, N., Hans Frauenfelder, N. (2011). ‘Regional
differences in listener’s phonemic inventory affect semantic processing:
A mismatch negativity (MMN) study’, Brain and Language 117, 45-51.
References
210
Butler, J., Floccia, C., Goslin, G. (2011). ‘Infants’ discrimination of familiar and
unfamiliar accents in speech’, Infancy 16, 392-417.
Cebrian, J. (2011). ‘Cross-linguistic perception of Catalan and English
diphthongs’, in M. Wrembel, M. Kul and K. Dziubalska-Kołaczyk (eds.)
Achievements and perspectives in the acquisition of second language
speech: New Sounds 2010 Volume II, pp. 43-51.
Chládková, K. and Escudero, P. (2012). ‘Comparing vowel perception in
Spanish and Portuguese: European versus Latin American dialects’,
Journal of the Acoustical Society of America 131, EL119-EL125.
Chládková, K. and Hamann, S. (2011). ‘High vowels in Standard British English:
/u/-fronting does not result in merger’, in W. Lee and E. Zee (eds.)
Proceedings of the 17th International Congress of Phonetic Sciences,
pp. 476-479.
Chládková, K. and Podlipský, V. (2011). ‘Native dialect matters: Perceptual
assimilation of Dutch vowels by Czech listeners’, Journal of the
Acoustical Society of America 130, EL186-EL192.
Chládková, K., Escudero, P. and Boersma, P. (2011). ‘Context-specific acoustic
differences between Peruvian and Iberian Spanish vowels’, Journal of
the Acoustical Society of America 130, 416-428.
Chládková, K., Hamann, S. and Williams, D. (in preparation). ‘The possible role
of alternative perceptual cues in sound change: diphthongization in
Standard Southern British English’.
Clopper, C. (2011). ‘Effects of naturally-occurring segmental ambiguity on
cross-modal priming of minimal pairs’, Journal of the Acoustical
Society of America 129, 2659.
Clopper, C. (2012). ‘Sound change in the individual: effects of exposure on
cross-dialect speech processing’, 2nd Workshop on Sound Change,
Institute of Phonetics and Speech Processing, Munich.
Clopper, C. (in press). ‘Effects of dialect variation on the semantic predictability
benefit’, Language and Cognitive Processes.
References
211
Clopper, C. and Bradlow, A. (2008). ‘Perception of dialect variation in noise:
intelligibility and classification’, Language and Speech 51, 175-198.
Clopper, C. and Tamati, T. (2010). ‘Lexical recognition memory across dialects’,
Journal of the Acoustical Society of America 127, 1956.
Clopper, C., Pisoni, D. and De Jong, K. (2005). ‘Acoustic characteristics of the
vowel systems of six regional varieties of American English’, Journal of
the Acoustical Society of America 118, 1161-1676.
Cohen, A., Sils, I. and ‘t Hart, J. (1967). ‘On tolerance and intolerance in vowel
perception’, Phonetica 16, 65-70.
Collier, R., Bell-Berti, F. and Raphael, L. (1982). ‘Some acoustic and
physiological observations of diphthongs’, Language and Speech 25,
305-323.
Collins, B. and Mees, L. (2004). The Phonetics of English and Dutch (Leiden:
Brill).
Conrey, B., Potts, G. F. and Niedzielski, N. A. (2005). ‘Effects of dialect on
merger perception: ERP and behavioural correlates’, Brain and
Language 95, 435-449.
De Jong, G., McDougall, K, and Nolan, F. (2007). ‘Sound change and speaker
identity: an acoustic study’, in G. Müller (ed.) Speaker Classification II
(Berlin: Springer-Verlag), pp. 130-141.
Deterding, D. (1997). ‘The formants of monophthongs in Standard Southern
British English pronunciation’, Journal of the International Phonetic
Association 27, 47-55.
Deterding, D. (2004). ‘How Many Vowel Sounds Are There in English?’, TETS
Language and Communication Review 3, 19-21.
Dietrich, C., Swingley, D. And Werker, J. (2007). ‘Native language governs
interpretation of salient speech sound difference in 18 months’,
Proceedings of the National Academy of Sciences USA 104, 95-102.
Dufour, S., Nguyen, N. and Hans Frauenfelder, U. (2007). ‘The perception of
phonemic contrasts in a non-native dialect’, Journal of the Acoustical
Society of America 121, EL131-EL136.

References
212
Dufour, S., Nguyen, N., Hans Frauenfelder, U. (2010). ‘Does training on a
phonemic contrast absent in the listener’s dialect influence word
recognition?’, Journal of the Acoustical Society of America 128, EL43-
EL48.
Eimas, P. (1975). ‘Auditory and phonetic coding of the cues for speech:
discrimination of the /r-l/ distinction by young infants’, Perception and
Psychophysics 18, 341-347.
Escudero, P. (2005). Linguistic perception and second language acquisition:
Explaining the attainment of optimal phonological categorization. PhD
Thesis, Utrecht University.
Escudero, P. and Boersma, P. (2004). ‘Bridging the gap between L2 speech
perception research and phonological theory’, Studies in Second
Language Acquisition 26, 551-585.
Escudero, P., Boersma, P., Rauber, A. and Bion, R. (2009). ‘A cross-dialect
acoustic description of vowels: Brazilian versus European Portuguese’,
Journal of the Acoustical Society of America 126, 1379–1393.
Escudero, P. and Chládková, K. (2010). ‘Spanish listeners' perception of
American and Southern British English vowels: Different initial stages
for L2 development’, Journal of the Acoustical Society of America 128,
EL254-EL260.
Escudero, P., Simon, E. and Mitterer, H. (2012). ‘The perception of English front
vowels by North Holland and Flemish listeners: Acoustic similarity
predicts and explains cross-linguistic and L2 perception’, Journal of
Phonetics 40, 280-288.
Escudero, P. and Vasiliev, P. (2011). ‘Cross-language acoustic similarity predicts
perceptual assimilation of Canadian English and Canadian French
vowels’, Journal of the Acoustical Society of America 130, EL277-EL283.
Escudero, P. and Williams, D. (2011). ‘Perceptual assimilation of Dutch vowels
by Peruvian Spanish listeners’, Journal of the Acoustical Society of
America 129, EL1-EL7.
References
213
Escudero, P. and Williams, D. (2012). ‘Native dialect influences second-
language vowel perception: Peruvian versus Iberian Spanish learners of
Dutch’, Journal of the Acoustical Society of America 131, EL406-EL412.
Evans, B. and Iverson, P. (2004). ‘Vowel normalization for accent: an
investigation of best exemplar locations in northern and southern
British English sentences’, Journal of the Acoustical Society of America
115, 352-361.
Fant., G. (1960). Acoustic Theory of Speech Production (The Hague: Mouton
De Gruyter).
Ferragne, E. and Pellegrino, F. (2010). ‘Formant frequencies in 13 accents of the
British Isles’, Journal of the International Phonetic Association 40, 1-33.
Flege, J. (1995). ‘Second Language Speech Learning: Theory, Findings, and
Problems’, in W. Strange (ed.) Speech Perception and Linguistic
Experience: Issues on Cross-Language Research (Baltimore: York Press),
pp. 233-277.
Flege, J. (2002). ‘Interactions between native and second-language phonetic
systems’, in P. Burmeister, T. Piske and A. Rohde (eds.) An Integrated
View of Language Development: Papers in Honor of Henning Wode
(Trier: Wissenschaftlicher Verlag), pp. 217-244.
Flege, J. (2003). ‘Assessing constraints on second-language segmental
production and perception’, in A. Meyer and N. Schiller (eds.) Phonetics
and Phonology in Language Comprehension and Production:
Differences and Similarities (Berlin: Mouton de Gruyter), pp. 319-355.
Flege, J. and McKay, I. (2004). ‘Perceiving vowels in a second language’, Studies
in Second Language Acquisition 26, 1-34.
Flege, J., Munro, M. and Fox, R (1994). ‘Auditory and categorical effects on
cross-language vowel perception’, Journal of the Acoustical Society of
America 95, 3623-3641.
Foulkes, P. and Docherty, P. (2006). ‘The social life of phonetics and phonology’,
Journal of Phonetics 34, 409-438.
References
214
Fox, R. (1983). ‘Perceptual structure of monophthongs and diphthongs in
English’, Language and Speech 26, 21-60.
Fujisaki, H. and Kawashima, T. (1968). ‘The roles of pitch and higher formants
in the perception of vowels’, IEEE Transactions on Audio and
Electroacoustics AU-16, 73-77.
Geng, C. and Mooshammer, C. (2009). ‘How to stretch and shrink vowel
systems: Results from a vowel normalization procedure’, Journal of the
Acoustical Society of America 125, 3278-3288.
Gibson, J. and Gibson, E. (1955). ‘Perceptual learning: Differentiation or
enrichment?’, Psychological Review 62, 32-41.
Gilichinskaya, Y. and Strange, W. (2010). ‘Perceptual assimilation of American
English vowels by inexperienced Russian listeners’, Journal of the
Acoustical Society of America 128, EL80-EL85.
Goldsmith, J. (1994). ‘Tone languages’, in E. Asher and J. Simpson (eds.)
Encyclopedia of Language and Linguistics (New York: Elsevier Science),
pp. 4626-4628
Goto, H. (1971). ‘Auditory perception by normal Japanese adults of the sounds
‘L’ and ‘R’’, Neuropsychologia 9, 317-323.
Gussenhoven, C. (1999). ‘Illustrations of the IPA: Dutch’, in Handbook of the
International Phonetic Association (Cambridge: Cambridge University
Press), pp. 74-77.
Gussenhoven, C. (2004). ‘Tone in Germanic: Comparing Limburgian with
Swedish’, in G. Fant, H. Fujisaki, J. Cao and Y. Xu (eds.) Traditional
Phonology to Modern Speech Processing (Beijing: Foreign Languages
Teaching and Research Press), pp. 129-136.
Harnsberger, J. (2001). ‘On the relationship between identification and
discrimination of non-native nasal consonants’, Journal of the
Acoustical Society of America 110, 489-503.
Harrington, J. and Cassidy, S. (1994). ‘Dynamic and target theories of vowel
classification: evidence from monophthongs and diphthongs in
Australian English’, Language and Speech 37, 357-373.
References
215
Hawkins, S. and Midgley, J. (2005). ‘Formant frequencies of RP monophthongs
in four age groups of speakers’, Journal of the International Phonetic
Association 35, 183-199.
Hillenbrand, J. and Nearey, T. (1999). ‘Identification of resynthesized /hVd/
syllables: Effects of formant contour’, Journal of the Acoustical Society
of America 105, 3509–3523.
Hillenbrand, J., Clark, M. and Houde, R. (2000). ‘Some effects of duration on
vowel recognition’, Journal of the Acoustical Society of America 108,
3013-3022.
Hillenbrand, J., Clark, M. and Nearey, T. (2001). ‘Effect of consonant
environment on vowel formant patterns’, Journal of the Acoustical
Society of America 109, 748-763.
Hillenbrand, J., Getty, L., Clark, M. and Wheeler, K. (1995). ‘Acoustic
characteristics of American English vowels’, Journal of the Acoustical
Society of America 97, 3099–3111.
House, A. (1961). ‘On vowel duration in English’, Journal of the Acoustical
Society of America 33, 1174-1178.
Irino, T. and Patterson, R. (2002). ‘Segregating Information about the Size and
Shape of the Vocal Tract using a Time-Domain Auditory Model: The
Stabilised Wavelet-Mellin Transform’, Speech Communication 36, 181-
203.
Iverson, P. and Evans, B. (2007). ‘Learning English vowels with different first-
language vowel systems: Perception of formant targets, formant
movement, and duration’, Journal of the Acoustical Society of America
122, 2842–2854.
Iverson, P., Kuhl, P., Akahane-Yamada, R., Diesch, E., Tohkura, Y., Ketterman,
A. and Siebert, C. (2003). ‘A perceptual interference account of
acquisition difficulties for non-native phonemes’, Cognition 87, B47-B57.
Jacewicz, E. and Fox, R. (2012). ‘The effects of cross-generational and cross-
dialectical variation on vowel identification and classification, Journal
of the Acoustical Society of America 131, 1413-1433.
References
216
Jackson, M. and McGowan, R. (2012). ‘A study of high front vowels with
articulatory and acoustic simulations’, Journal of the Acoustical Society
of America 131, 3017-3035.
Johnson, K. (1997). ‘Speech perception without speaker normalization’, in K.
Johnson and J. Mullennix (eds.) Talker Variability in Speech Processing
(Academic Press: San Diego), pp. 145-165.
Johnson, K. (2003). Acoustic and Auditory Phonetics (Oxford: Blackwell).
Jusczyk, P., Pisoni, D., Walley A. and Murray, J. (1980). ‘Discrimination of
relative onset time of two-component tones by infants’, Journal of the
Acoustical Society of America 67, 262-270.
Kitamura, C., Panneton, R., Diehl, M. and Notley, A. (2006). ‘Attuning to the
native dialect: when more means less’, in Proceedings of the Eleventh
Australasian International Conference on Speech Science &
Technology, 124–129.
Klatt, D. (1976). ‘Linguistic uses of segmental duration in English: acoustic and
perceptual evidence’, Journal of the Acoustical Society of America 87,
820-857.
Koopmans-van Beinum, F. (1980). Vowel contrast reduction: an acoustic and
perceptual study of Dutch vowels in various speech conditions. PhD
Thesis, University of Amsterdam.
Kuhl, P. (1981). ‘Discrimination of speech by nonhuman animals: basic
auditory sensitivities conductive to the perception of speech-sound
categories’, Journal of the Acoustical Society of America 70, 340-349.
Kuhl, P. (1994). ‘Learning and representation in speech and language’, Current
Opinion in Neurobiology 4, 812-822.
Kuhl, P., Conboy, B., Coffey-Corina, S., Padden, D., Rivera-Gaxiola, M. and
Nelson, T. (2008). ‘Phonetic learning as a pathway to language: new
data and native language magnet theory expanded (NLM-e)’,
Philosophical Transactions of the Royal Society B 363, 979-1000.
Labov, W. (1972). Sociolinguistic Patterns (Oxford: Blackwell).

References
217
Ladd, D. and Silverman, K. (1984). ‘Vowel intrinsic pitch in connected speech’,
Phonetica 41, 31–40.
Ladefoged, P. (2001). A Course in Phonetics (Fort Worth: Harcourt).
Ladefoged, P. and Maddieson, I. (1996). The Sounds of the World’s Languages
(Oxford: Blackwell).
Ladefoged, P., DeClerck, J., Lindau, M. and Papcun, G. (1972). ‘An auditory-
motor theory of speech production’, UCLA Working Papers in
Phonetics 22, 48-75.
Laver, J. (1994). Principles of phonetics (Cambridge: Cambridge University
Press).
Le, J., Best, C., Tyler, M. and Kroos, C. (2007). ‘Effects of Non-native Dialects on
Spoken Word Recognition’, in Proceedings of Interspeech 2007, pp.
1589-1592.
Lehiste, I. and Peterson, G. (1961). ‘Some basic considerations in the analysis of
intonation’, Journal of the Acoustical Society of America 33, 419-425.
Levy, E. (2009a). ‘Language experience and consonantal context effects on
perceptual assimilation of French vowels by American-English learners
of French’, Journal of the Acoustical Society of America 125, 1138–1152.
Levy, E. (2009b). ‘On the assimilation-discrimination relationship in American
English adults’ French vowel learning’, Journal of the Acoustical
Society of America 126, 2670–2682.
Liberman, A. and Mattingly, I. (1985). ‘The motor theory of speech perception
revised’, Cognition 21, 1-36.
Lindblom, B. (1990). ‘Explaining phonetic variation: a sketch of the H&H
theory’, in W. Hardcastle and A. Marchal (eds.) Speech Production and
Modeling (Dordrecht: Kluwer), pp. 403-439.
MacKay, I., Flege, J., Piske, T. and Schirru, C. (2001). ‘Category restructuring
during second-language speech acquisition’, Journal of the Acoustical
Society of America 110, 516-528.
Maddieson, I. (2011). ‘Vowel Quality Inventories’, in M. Dryer and M.
Haspelmath (eds.) The World Atlas of Language Structures Online

References
218
(Munich: Max Planck Digital Library), available online at
http://wals.info/chapter/2. Accessed on 1/12/2011.
Maye, J., Aslin, R. N. and Tanenhaus, M. K. (2008). ‘The Weckud Wetch of the
Wast: Lexical Adaptation to a Novel Accent’, Cognitive Science 32, 543-
562.
Mayr, R. and Escudero, P. (2010). ‘Explaining individual variation in L2
perception: Rounded vowels in English learners of German’,
Bilingualism: Language and Cognition 13, 279-297.
McMahon, A. (2000). Lexical Phonology and the History of English
(Cambridge: Cambridge University Press).
McMahon, A. (2002). An Introduction to English Phonology (Edinburgh:
Edinburgh University Press).
McMahon, A., Heggarty, P., McMahon, R., Maguire, W. (2007). ‘The sound
patterns of Englishes: representing phonetic similarity’, English
Language and Linguistics 11, 113-142.
Moon, S.-J. and Lindblom, B. (1994). ‘Interaction between duration, context, and
speaking style in English stressed vowels’, Journal of the Acoustical
Society of America 96, 40-55.
Nishi, K., Strange, W., Akahane-Yamada, R., Kubo, R. and Trent-Brown, S.
(2008). ‘Acoustic and perceptual similarity of Japanese and American
English vowels’ Journal of the Acoustical Society of America 124, 576-
588.
Ogden, R. (2009). An Introduction to English Phonetics (Edinburgh: Edinburgh
University Press).
Peterson, G. and Barney, H. (1952). ‘Control methods used in a study of the
vowels’, Journal of the Acoustical Society of America 24, 175-184.
Pierrehumbert, J. (2001). ‘Exemplar dynamics: Word frequency, lenition and
contrast’, in J. Bybee and P. Hopper (eds.) Frequency Effects and the
Emergence of Linguistic Structure (Amsterdam: John Benjamins), pp.
137–157.
References
219
Polka, L. and Bohn, O.-S. (1996). ’A cross‐language comparison of vowel
perception in English‐learning and German‐learning infants‘, Journal
of the Acoustical Society of America 100, 577-592.
Pols, L., Tromp, H. and Plomp, R. (1973). ‘Frequency analysis of Dutch vowels
from 50 male speakers’, Journal of the Acoustical Society of America
53, 1093–1101.
Pols, L., Van der Kamp, L. and Plomp, R. (1969). ‘Perceptual and physical space
of vowel sounds’, Journal of the Acoustical Society of America 46, 458-
467.
Raphael, L., Borden, G. and Harris, K. (2007). Speech Science Primer:
Physiology, Acoustics, and Perception of Speech (Baltimore-
Philadelphia: Lippincott Williams & Wilkins).
Ripmann, W. (1911). English Sounds (London: Dent).
Roach, P. (2000). English Phonetics and Phonology: A Practical Course
(Cambridge: Cambridge University Press).
Roach, P. (2004). ‘British English: Received Pronunciation’, Journal of the
International Phonetic Association 34, 239-245.
Simpson, A. (2001). ‘Dynamic consequences of differences in male and female
vocal tract dimensions’, Journal of the Acoustical Society of America
109, 2153-2164.
Simpson, A. (2003). ‘Possible articulatory reasons for sex-specific differences in
vowel duration’, in S. Palethorpe and M. Tabain (eds.) Proceedings of
the 6th International Seminar on Speech Production (Sydney:
Macquarie University), pp. 261-266.
Slawson, A. (1968). ‘Vowel quality and musical timbre as functions of spectrum
envelope and fundamental frequency’, Journal of the Acoustical
Society of America 43, 87-101.
Stack, J., Strange, W., Jenkins, J., Clarke III, W. and Trent, S. (2006). ‘Perceptual
invariance of coarticulated vowels over variations in speaking style’,
Journal of the Acoustical Society of America 119, 2394-2405.
References
220
Steinlen, A. (2005). The influence of consonants on native and non-native
vowel production: A cross-linguistic study (Tübingen: Gunter Narr).
Stevens, K. (1998). Acoustic Phonetics (Cambridge, MA: MIT Press).
Stevens, K. and House, A. (1963). ‘Perturbations of Vowel Articulations by
Consonantal Context: An Acoustical Study’, Journal of Speech and
Hearing Research 6, 111-128.
Stoddart, J., Upton, C. and Widdowson, J. (1999). ‘Sheffield dialect in the 1990s:
revisiting the concept of NORMs’, in P. Foulkes and G. Docherty (eds.)
Urban Voices (London: Arnold), pp. 72-89.
Strange, W. (2007). ‘Cross-language phonetic similarity of vowels: Theoretical
and methodological issues’, in O.-S. Bohn and M. Munro (eds.)
Language Experience in Second Language Speech learning. In Honor
of James Emil Flege (Amsterdam: John Benjamins), pp. 35–55.
Strange, W., Bohn, O.-S., Nishi, K. and Trent S. (2005). ‘Contextual variation in
the acoustic and perceptual similarity of North German and American
English vowels’, Journal of the Acoustical Society of America 118, 1751-
1762.
Strange, W., Bohn, O.-S., Trent S. and Nishi, K. (2004). ‘Acoustic and perceptual
similarity of North German and American English vowels’, Journal of
the Acoustical Society of America 115, 1791-1807.
Strange, W., Hisagi, M., Akahane-Yamada, R. and Kubo, R. (2011). ‘Cross-
language perceptual similarity predicts categorical discrimination of
American English vowels by naïve Japanese listeners’, Journal of the
Acoustical Society of America 130, EL226-EL231.
Strange, W., Levy, E. and Law II, F. (2009). ‘Cross-language categorization of
French and German vowels by naïve American listeners’, Journal of the
Acoustical Society of America 126, 1461-1476.
Strange, W., Weber, A., Levy, E., Shafiro, V., Hisagi, M. and Nishi, K. (2007).
‘Acoustic variability within and across German, French, and American
English vowels: Phonetic context effects’, Journal of the Acoustical
Society of America 122, 1111-1129.
References
221
Sumner, M. and Samuel, A. (2009). ‘The effect of experience on the perception
and representation of dialect variants’, Journal of Memory and
Language 60, 487-501.
Sundberg, J. (1970). ‘Formant structure and articulation of spoken and sung
vowels’, Folia Phoniatrica 22, 28-48.
Ter Schure, S., Chládková, K. and Van Leussen, J.-W. (2011). ‘Comparing
identification of artificial and natural vowels’, in W. Lee and E. Zee (eds.)
Proceedings of the 17th International Congress of Phonetic Sciences,
pp. 1770-1773.
Traunmüller, H. (1990). ‘Analytical expressions for the tonotopic sensory scale’,
Journal of the Acoustical Society of America 88, 97-100.
Tuinman, A., Mitterer, H. and Cutler, A. (2011). ‘Perception of intrusive /r/ in
English by native, cross-language and cross-dialect listeners’, Journal of
the Acoustical Society of America 130, 1643-1652.
Tyler, M. and Best, C. (2006). ‘Can a MAN be a MON? Toddlers’ Spoken-Word
Familiarity Preferences in Native Versus Nonnative Dialects’, XVth
Biennial International Conference on Infant Studies.
Van de Velde, H., Van Hout, R. and Gerritsen, M. (1997). ‘Watching Dutch
Change’, Journal of Sociolinguistics 1, 361–391.
Van der Feest, S. and Swingley, D. (2011). ‘Dutch and English listeners’
interpretations of vowel duration’, Journal of the Acoustical Society of
America 129, EL57-EL63.
Van Leussen, J-W., Williams, D. and Escudero, P. (2011). ‘Acoustic properties of
Dutch steady-state vowels: Contextual effects and a comparison with
previous studies’, in W. Lee and E. Zee (eds.) Proceedings of the 17th
International Congress of Phonetic Sciences, pp. 1194-1197.
Van Nierop, D., Pols, L. and Plomp, R. (1973). ‘Frequency analysis of Dutch
vowels from 25 female speakers’, Acustica 29, 110-118.
Wells, J. (1982). Accents of English (Cambridge: Cambridge University Press).
Wells, J. (2000). Longman Pronunciation Dictionary (Harlow: Longman).

References
222
Werker, J. and Lalonde, C. (1988). ‘Cross-language speech perception: initial
capabilities and developmental change’, Developmental Psychology 24,
672-683.
Werker, J. and Tees, R. (1984). ‘Phonemic and phonetic factors in adult cross-
language speech perception’, Journal of the Acoustical Society of
America 75, 1866-1878.
Whalen, D. and Levitt, A. (1995). ‘The universality of intrinsic F0 of vowels’,
Journal of Phonetics 23, 349-366.
Willerman, R. and Kuhl, P. (1996). ‘Cross-language speech perception: Swedish,
English, and Spanish speakers’ perception of front rounded vowels’, in
H. Bunell and W. Isardi (eds.) Proceedings of the Fourth International
Conference on Spoken Language Processing, pp. 442-445.
Williams, D. (2010). ‘The relationship between cross-language phonetic
similarity and perceptual confusions of vowels in a second language’.
Unpublished poster presentation, University of Sheffield.
Williams, D. (2012). ‘Effect of consonantal context on /u/ in two British English
accents’, British Association of Academic Phoneticians 2012, Leeds.
Witteman, M., Weber, A. And McQueen, J. (2011). ‘On the relationship between
perceived accentedness, acoustic similarity, and processing difficulty in
foreign-accented speech’, in Proceedings of the 12th Annual Conference
of the International Speech Communication Association, pp. 2229-2232.
Zhang, Y., Kuhl, P., Imada, T., Kotani, M. and Tohkura, Y. (2005). ‘Effects of
language experience: Neural commitment to language-specific
auditory patterns’, NeuroImage 26, 703-720.


