

Federal Energy Regulatory Commission • Market Oversight • www.ferc.gov/oversight
2181
Pittsburgh
Boston
Calgary
City Location
Chicago
NYCOklahoma
City
DallasLos
Angeles
Sacramento
Denver
Portland
Houston
New Orleans
Miami
Vancouver
Last 30D
Lst yr 30D
5 Yr 30 D Avg
Cumulative HDDs by City 30 Day Intervals
Misc
Source: Bloomberg Weather
Atlanta
Updated
Natural Gas Trading: HDD Weather Map
807833710
735736635
31219
891910801
546500492
191243221
9451044880
552753638
321541407
173353250
647823741
8121055946
389473431
610817707
313513477
74192191
12/15/2014

Federal Energy Regulatory Commission • Market Oversight • www.ferc.gov/oversight
2181
Pittsburgh
Boston
Calgary
ChicagoNYC
OklahomaCity
DallasLos
Angeles
Sacramento Denver
Portland
Houston New Orleans Miami
Vancouver
Last 30D
Lst yr 30D
5 Yr 30 D Avg
Cumulative CDDs by City 30 Day Intervals
Source: Bloomberg Weather
Atlanta
Updated
Natural Gas Trading: CDD Weather Map
000
000
211319270
000
051
284635
000
022
141818
315451
000
000
000
000
000
2215
12/15/2014
Federal Energy Regulatory Commission • Market Oversight • www.ferc.gov/oversight
2181
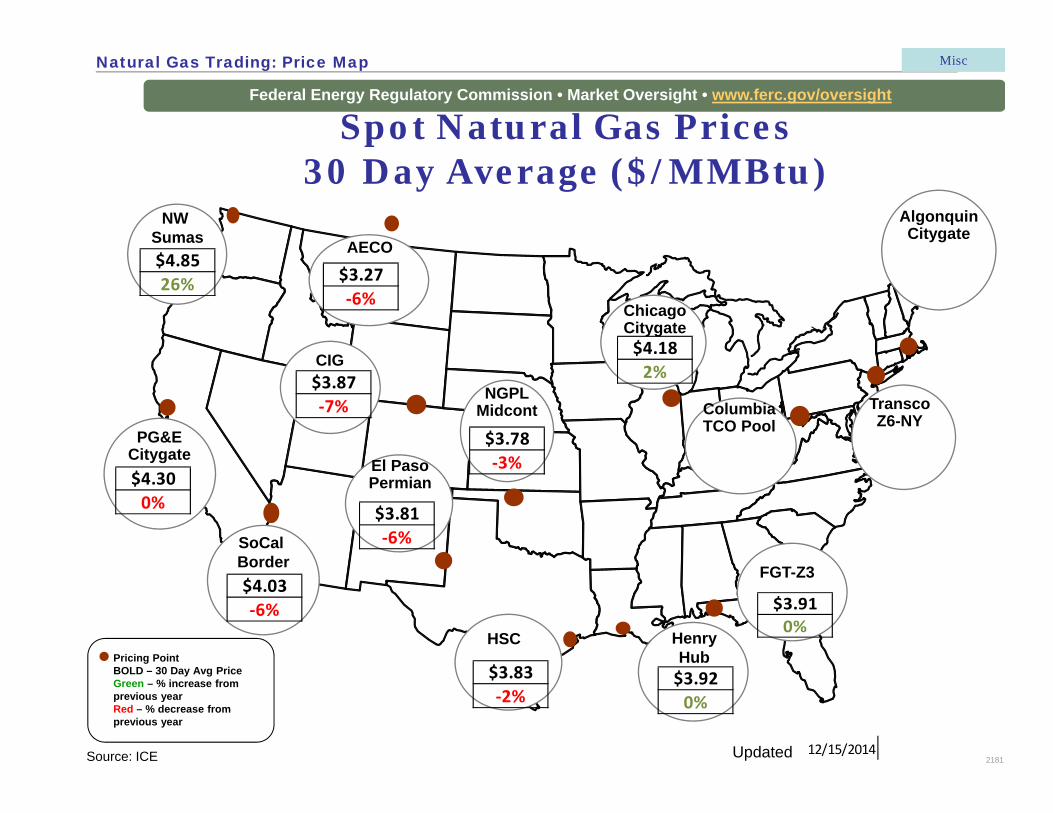
ColumbiaTCO Pool
AlgonquinCitygate
AECO
Pricing PointBOLD – 30 Day Avg PriceGreen – % increase from previous yearRed – % decrease from previous year
ChicagoCitygate
TranscoZ6-NY
NGPLMidcont
El PasoPermian
SoCal Border
PG&ECitygate
CIG
NW Sumas
HSC Henry Hub
FGT-Z3
Spot Natural Gas Prices 30 Day Average ($/MMBtu)
Misc
Source: ICE Updated
$3.920%
$4.182%
$3.78‐3%
$3.81‐6%
$3.83‐2%
$3.27‐6%
$3.87‐7%
$4.8526%
$4.300%
$4.03‐6% $3.91
0%
12/15/2014
Natural Gas Trading: Price Map

Federal Energy Regulatory Commission • Market Oversight • www.ferc.gov/oversight
2181
ColumbiaTCO Pool
AlgonquinCitygate
Pricing PointBOLD – 30 Day Avg VolumeGreen – % increase from previous yearRed – % decrease from previous year
ChicagoCitygate
TranscoZ6-NY
NGPLMidcon
El PasoPermian
SoCal Border
PG&ECitygate
CIG
NW Sumas
HSC Henry Hub
FGT-Z3
Spot Natural Gas Trading Volumes 30 Day Average (MMBtus)
Misc
Source: ICE Updated
49,590‐38%
75,157‐52%
128,22328%
400,183‐38%
325,817‐2%
745,2834%
176,750‐45%
328,580‐16%
81,883‐39%
49,470‐14%
56,47324%
763,4908%
471,030186%
12/15/2014
Natural Gas Trading: Volume Map
Federal Energy Regulatory Commission • Market Oversight • www.ferc.gov/oversight
Source: Derived from Bloomberg data Updated
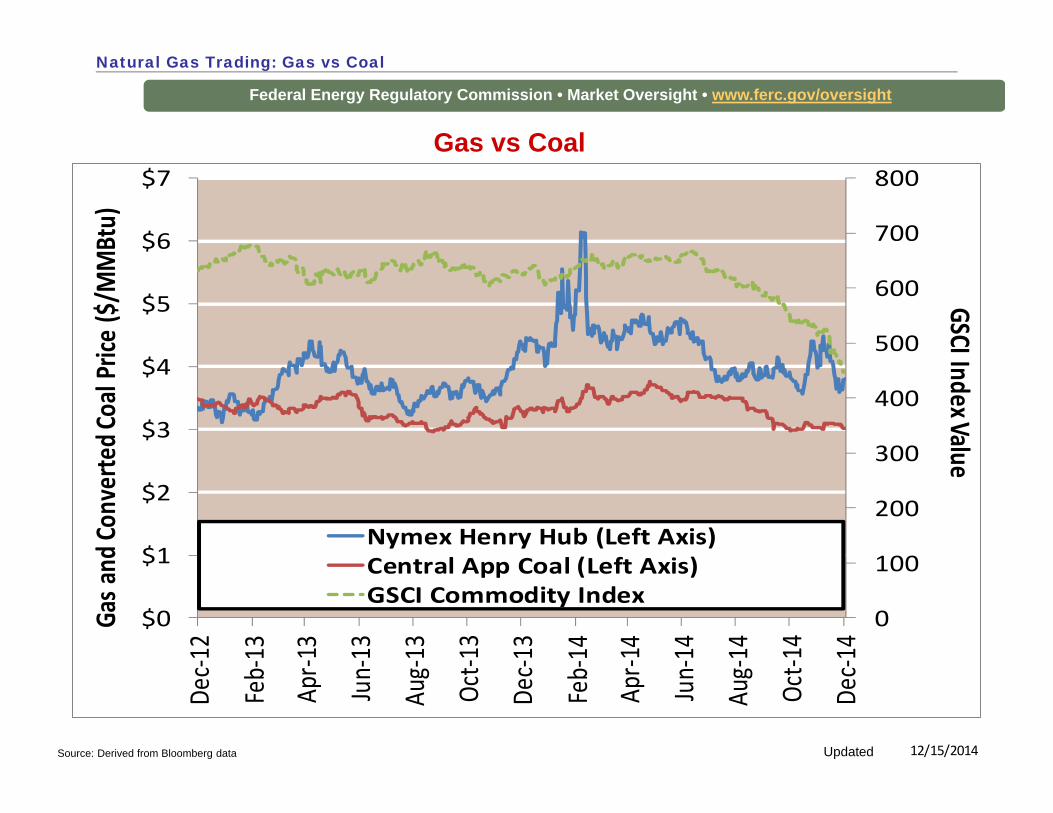
Gas vs Coal
Natural Gas Trading: Gas vs Coal
0
100
200
300
400
500
600
700
800
$0
$1
$2
$3
$4
$5
$6
$7De
c‐12
Feb‐13
Apr‐1
3
Jun‐13
Aug‐13
Oct‐1
3
Dec‐1
3
Feb‐14
Apr‐1
4
Jun‐14
Aug‐14
Oct‐1
4
Dec‐1
4
GSCI Index ValueGa
s and
Conv
erted C
oal P
rice ($/M
MBtu)
Nymex Henry Hub (Left Axis)Central App Coal (Left Axis)GSCI Commodity Index
12/15/2014
Federal Energy Regulatory Commission • Market Oversight • www.ferc.gov/oversight
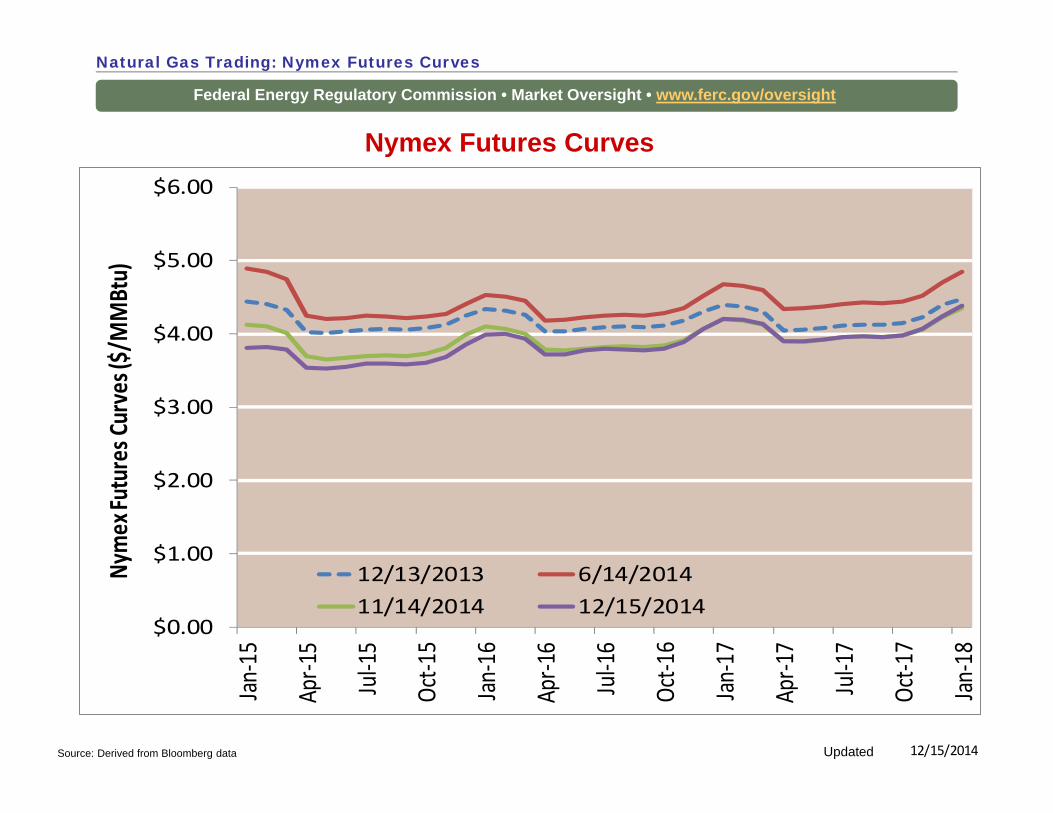
Source: Derived from Bloomberg data Updated
Nymex Futures Curves
$0.00
$1.00
$2.00
$3.00
$4.00
$5.00
$6.00
Jan‐15
Apr‐1
5
Jul‐15
Oct‐1
5
Jan‐16
Apr‐1
6
Jul‐16
Oct‐1
6
Jan‐17
Apr‐1
7
Jul‐17
Oct‐1
7
Jan‐18
Nymex Fu
tures C
urves ($/MMBtu)
12/13/2013 6/14/201411/14/2014 12/15/2014
Natural Gas Trading: Nymex Futures Curves
12/15/2014

Federal Energy Regulatory Commission • Market Oversight • www.ferc.gov/oversight
Natural Gas Market Trading : Oil Curves
Source: Derived from Bloomberg data Updated
Brent vs WTI
$60
$70
$80
$90
$100
$110
$120
$130
Oil Pric
es ($/Barrel)
WtI Oil Price
Brent Crude Oil Price
12/15/2014
Federal Energy Regulatory Commission • Market Oversight • www.ferc.gov/oversight
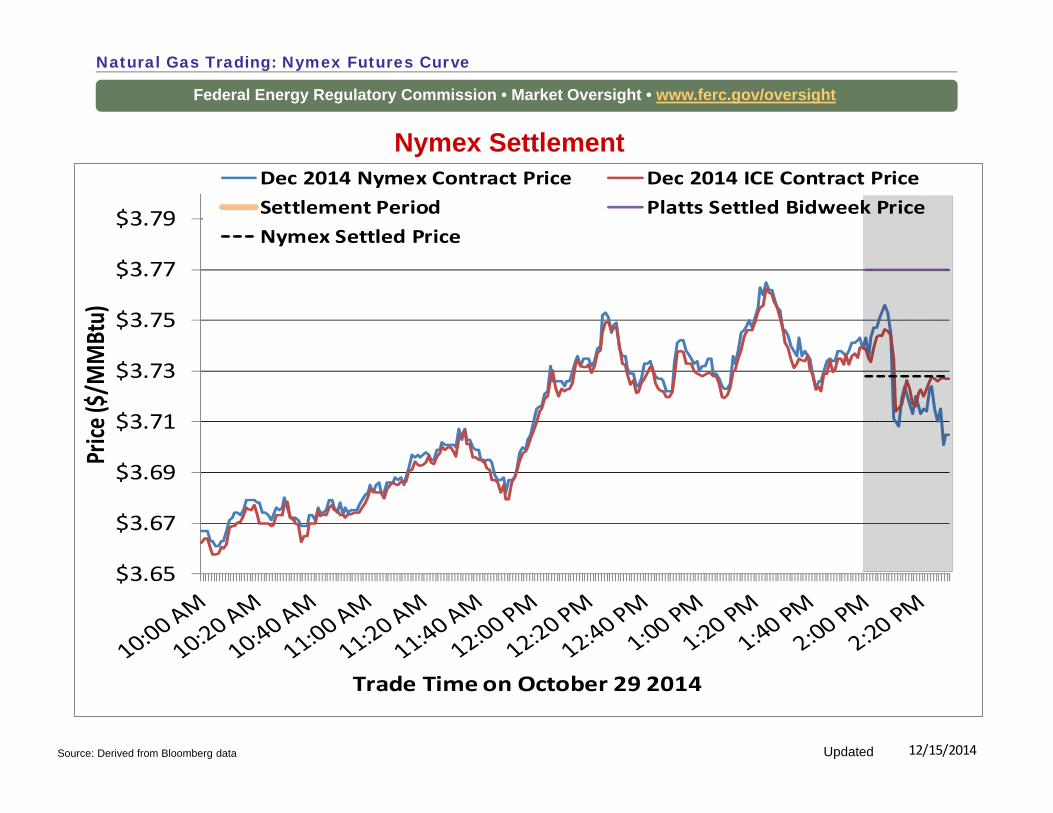
Natural Gas Trading: Nymex Futures Curve
Source: Derived from Bloomberg data Updated
Nymex Settlement
$3.65
$3.67
$3.69
$3.71
$3.73
$3.75
$3.77
$3.79
Price
($/M
MBtu)
Dec 2014 Nymex Contract Price Dec 2014 ICE Contract PriceSettlement Period Platts Settled Bidweek PriceNymex Settled Price
Trade Time on October 29 2014
12/15/2014
Federal Energy Regulatory Commission • Market Oversight • www.ferc.gov/oversight
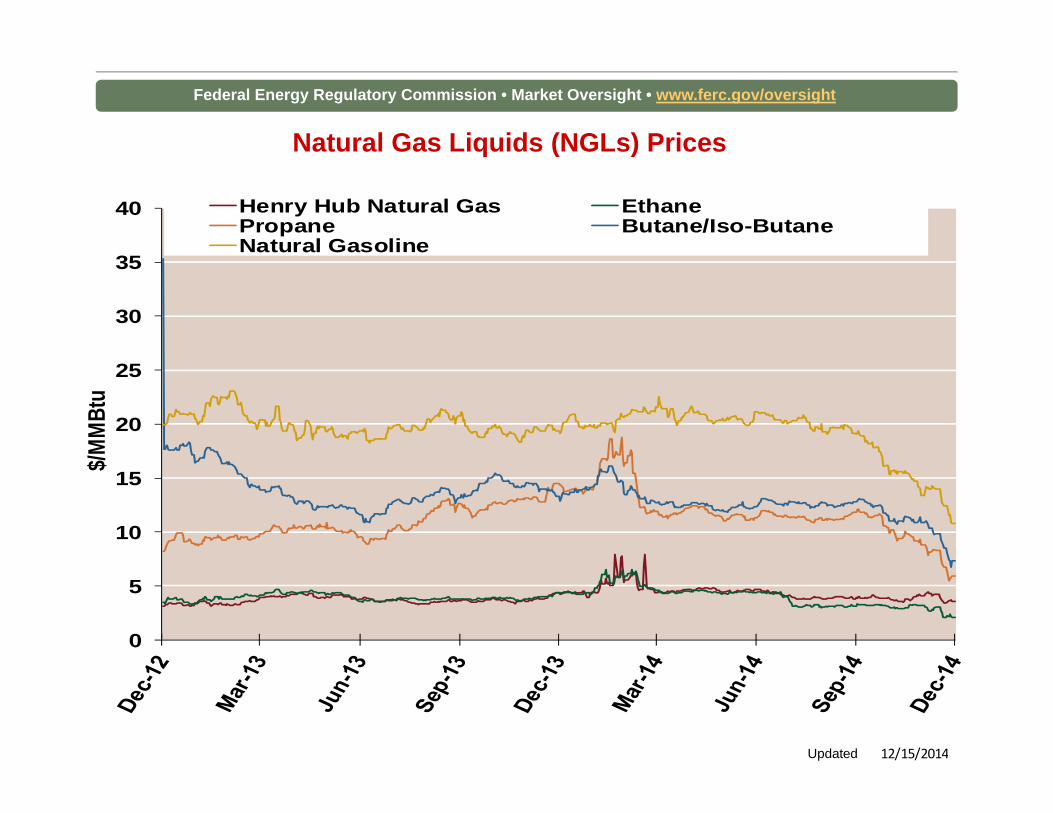
Natural Gas Liquids (NGLs) Prices
0
5
10
15
20
25
30
35
40
$/MM
Btu
Henry Hub Natural Gas EthanePropane Butane/Iso-ButaneNatural Gasoline
12/15/2014Updated


