
Dairy Globalization Refresh: 2011 Update Summary Findings Conducted by Bain & Company Commissioned by Dairy Management Inc. & U.S. Dairy Export Council
Webinar Aug. 3, 2011
Welcome
Margaret Speich Vice President Communications and Membership U.S. Dairy Export Council
2
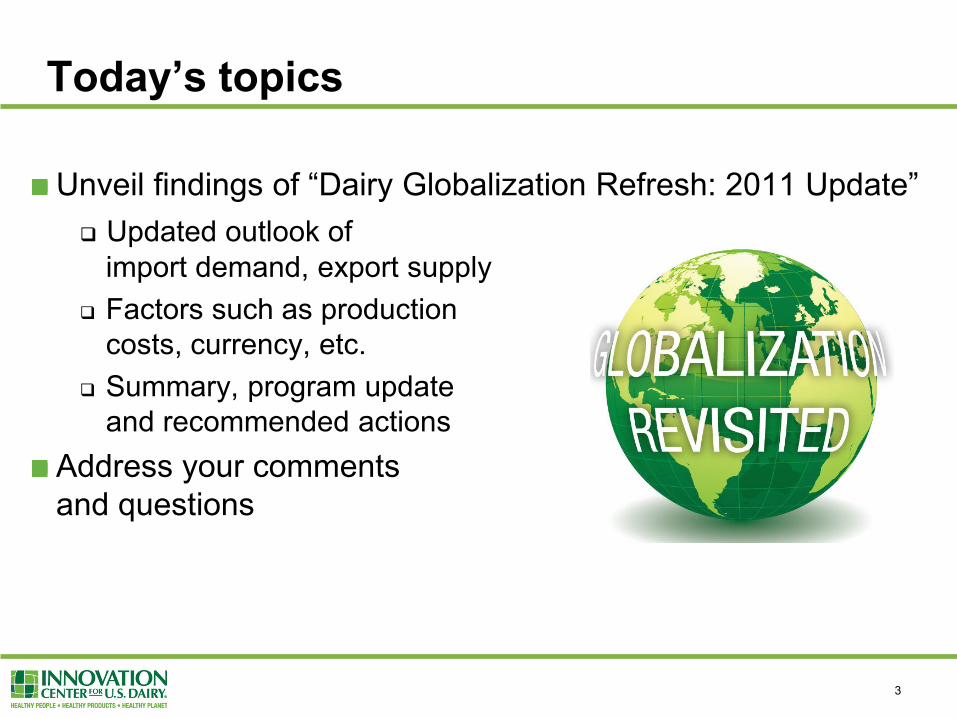
Unveil findings of “Dairy Globalization Refresh: 2011 Update” Updated outlook of
import demand, export supply Factors such as production
costs, currency, etc. Summary, program update
and recommended actions Address your comments and questions
Today’s topics
3
Webinar is being recorded Participants in listen-only mode except during Q&A To ask questions and/or pose comments By text, use on-screen Q&A panel By phone, press *1 to notify an operator
To print slides, click printer icon on bottom right of screen For technical difficulties, press *0 on telephone touchpad
Webinar guidelines
4

Alex Menendez Counsel McLeod, Watkinson & Miller
Antitrust reminder
5
Presenter and moderator
Tom Suber President U.S. Dairy Export Council
6
One of six IC programs to protect, grow dairy Globalization presents challenges, opportunities Strong participation advancing industry toward Consistent Supplier status But multi-year effort to create structural changes and improve commercial focus Industry led, USDEC staffed
Innovation Center globalization background
7

Opening remarks
Kevin Toland CEO & President Glanbia USA & Nutritionals Chair Innovation Center Globalization Operating Committee
8
Initial study examined implications of globalization But since then, industry has endured rollercoaster of economic cycles So do basic conclusions of original study still hold true? Have supply/demand changed to shrink demand gap
identified in earlier study? Have new suppliers come on board and shortened U.S.
window of opportunity? Is program to assist U.S. industry to become a globally
consistent supplier still viable?
Study background, purpose
9

10
Josh Chernoff Partner
Bain & Company
Principal presenter/commentators
Clinton Anderson Partner
Bain & Company
Brett Burgess Manager
Bain & Company
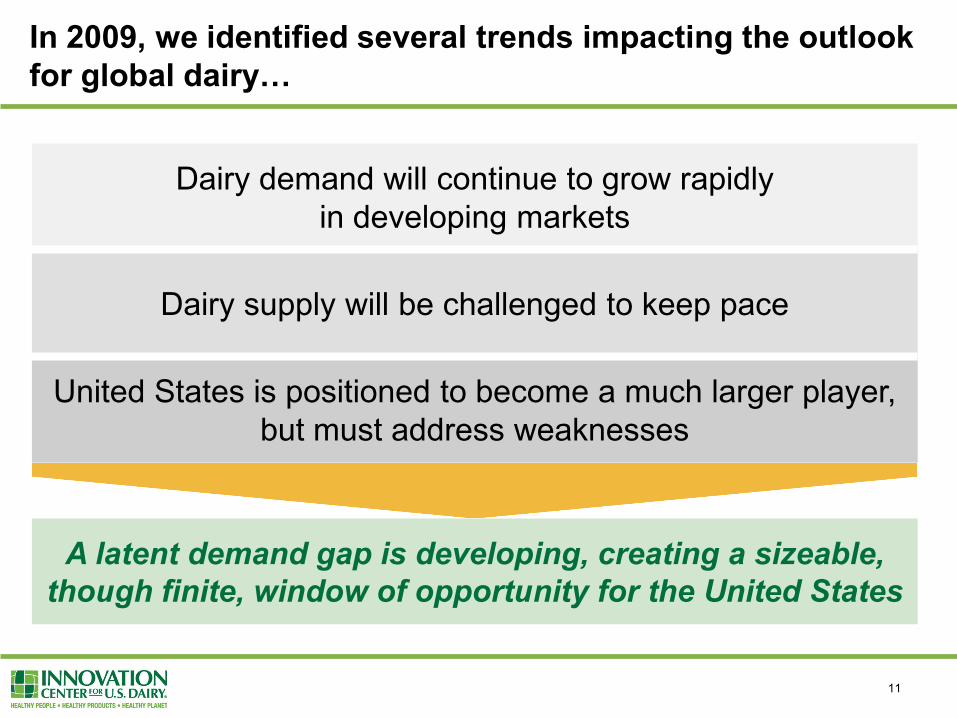
In 2009, we identified several trends impacting the outlook for global dairy…
Dairy demand will continue to grow rapidly in developing markets
Dairy supply will be challenged to keep pace
United States is positioned to become a much larger player, but must address weaknesses
A latent demand gap is developing, creating a sizeable, though finite, window of opportunity for the United States
11
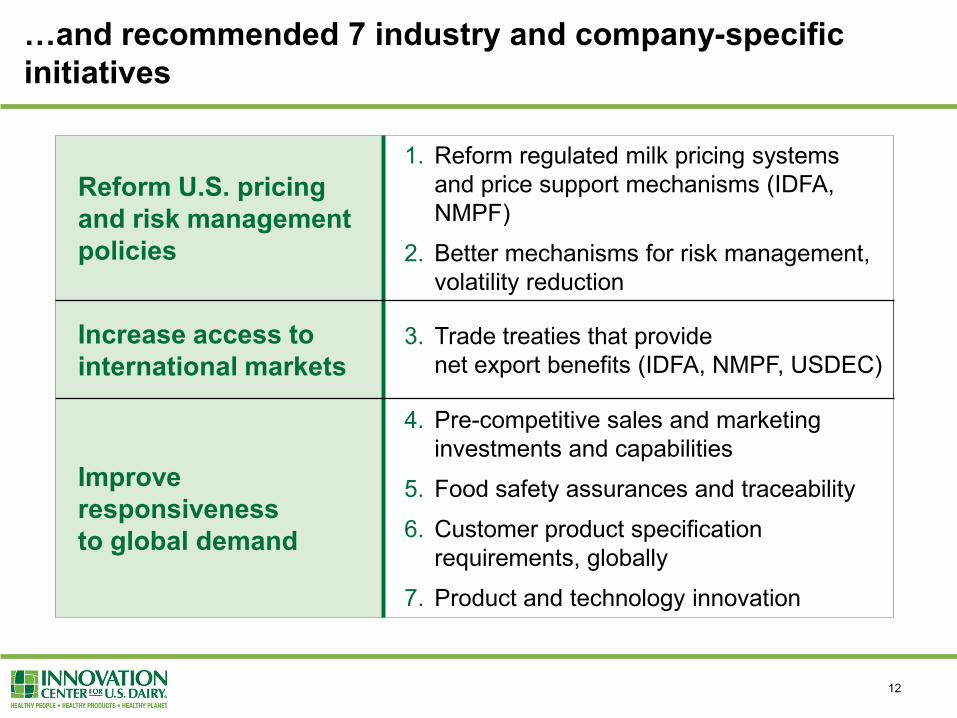
Reform U.S. pricing and risk management policies
1. Reform regulated milk pricing systems and price support mechanisms (IDFA, NMPF)
2. Better mechanisms for risk management, volatility reduction
Increase access to international markets
3. Trade treaties that provide net export benefits (IDFA, NMPF, USDEC)
Improve responsiveness to global demand
4. Pre-competitive sales and marketing investments and capabilities
5. Food safety assurances and traceability
6. Customer product specification requirements, globally
7. Product and technology innovation
…and recommended 7 industry and company-specific initiatives
12
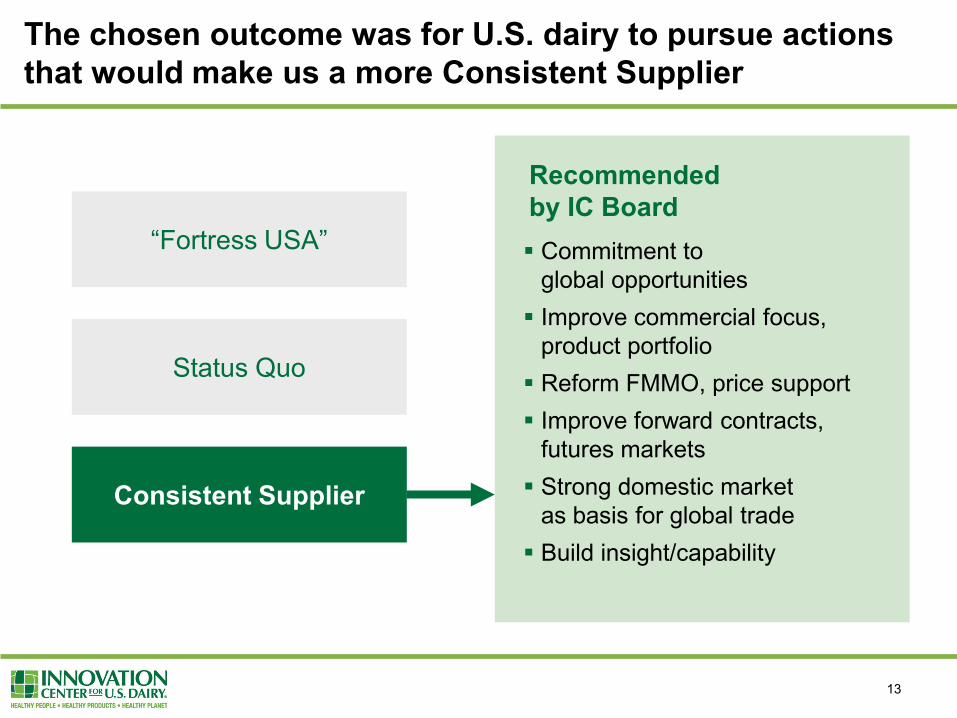
The chosen outcome was for U.S. dairy to pursue actions that would make us a more Consistent Supplier
“Fortress USA”
Status Quo
Commitment to global opportunities Improve commercial focus,
product portfolio Reform FMMO, price support Improve forward contracts,
futures markets Strong domestic market
as basis for global trade Build insight/capability
Consistent Supplier
Recommended by IC Board
13
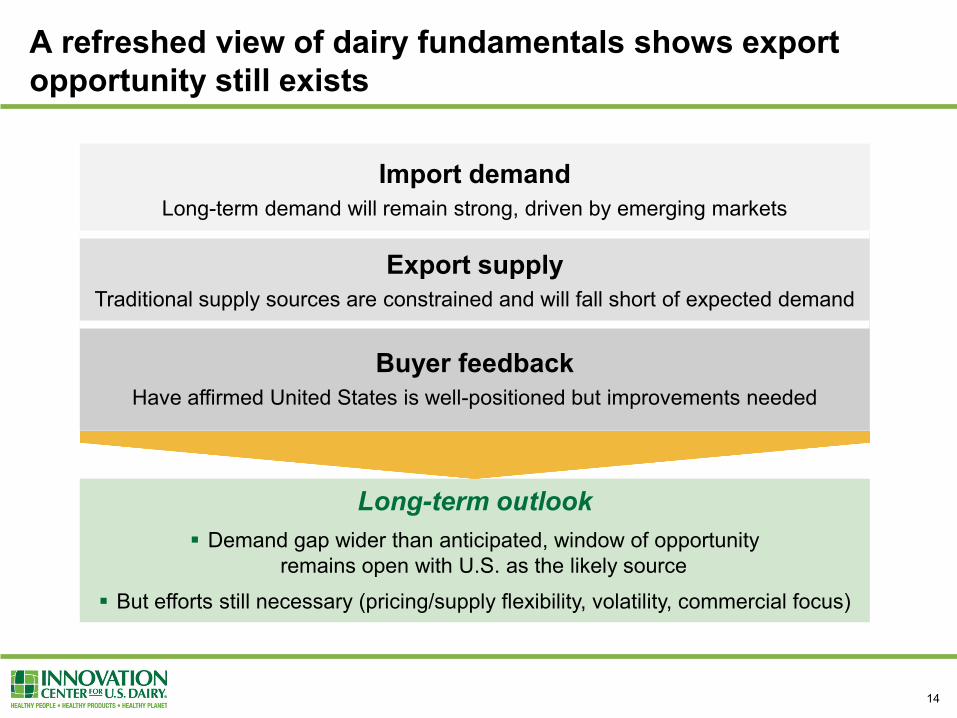
A refreshed view of dairy fundamentals shows export opportunity still exists
14
Import demand Long-term demand will remain strong, driven by emerging markets
Export supply Traditional supply sources are constrained and will fall short of expected demand
Buyer feedback Have affirmed United States is well-positioned but improvements needed
Long-term outlook Demand gap wider than anticipated, window of opportunity
remains open with U.S. as the likely source
But efforts still necessary (pricing/supply flexibility, volatility, commercial focus)

15
Forecasted growth remains strong in emerging markets
Source: Projected growth for India, Mena and SE Asia from FAPRI (2011); projected growth for China based on Bain analysis derived from OECD (2010) and GDP/consumption regression analysis
Dairy consumption is expected to grow quickly in key emerging markets…from which ~75% of new dairy consumption will come PROJECTED GROWTH IN WORLD NON-FLUID DAIRY CONSUMPTION (’2010-15)

China: Despite foreign investments, commercial dairy farms unlikely to overcome demand gap
At most, Fonterra farms will add a fraction of total production
Additionally, they are likely to price at a premium
FONTERRA EXPECTED PRICING SCHEME VS. AVERAGE MARKET PRICE ($/cwt)
FONTERRA SHARE OF CHINA DAIRY HERD / RAW MILK PRODUCTION
Source: “Fonterra benefits from Chinese dairy market”, stuff.co.nz (4/14/2011); “Fonterra to invest in two more farms”. Fonterra media release (2/2/2010); Bain analysis; Expert interviews
16
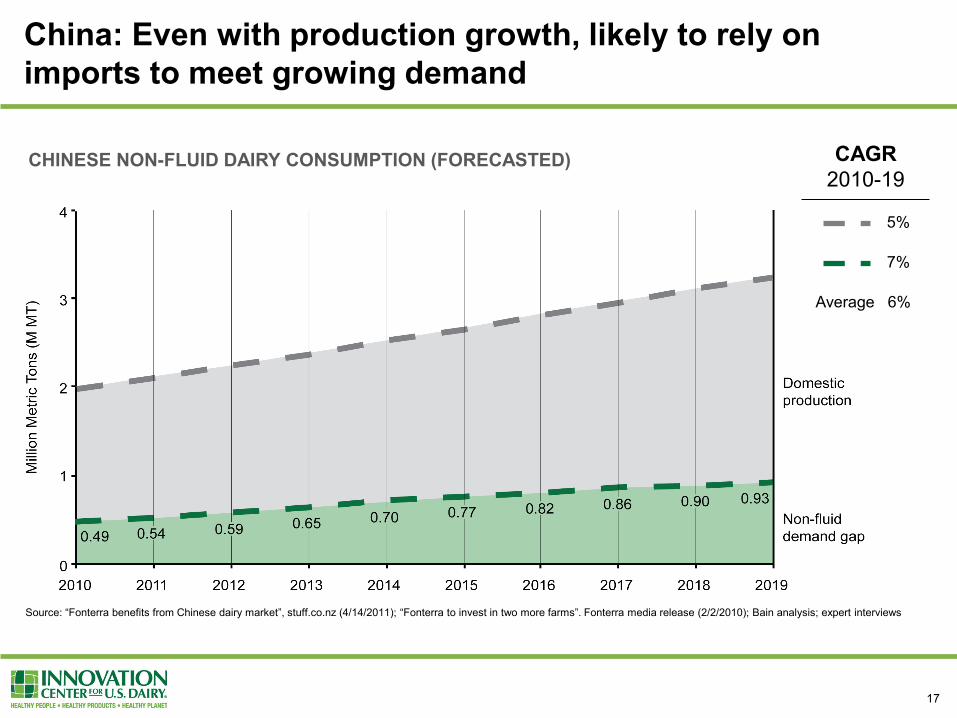
China: Even with production growth, likely to rely on imports to meet growing demand
17
Source: “Fonterra benefits from Chinese dairy market”, stuff.co.nz (4/14/2011); “Fonterra to invest in two more farms”. Fonterra media release (2/2/2010); Bain analysis; expert interviews
CHINESE NON-FLUID DAIRY CONSUMPTION CHINESE NON-FLUID DAIRY CONSUMPTION (FORECASTED)
5%
7%
Average 6%
CAGR 2010-19
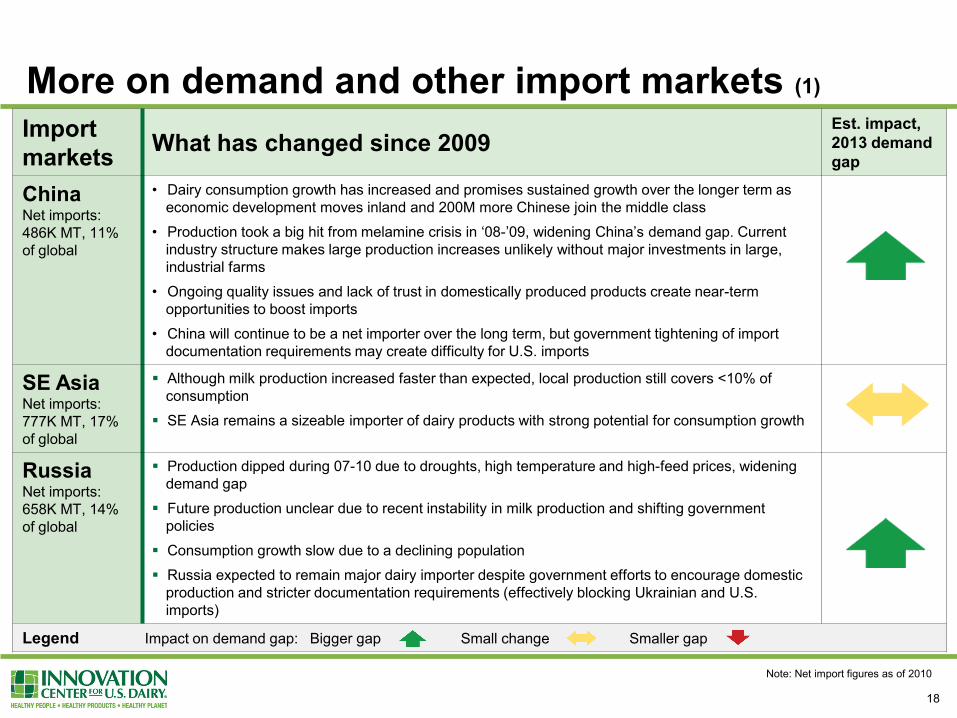
Import markets What has changed since 2009
Est. impact, 2013 demand gap
China Net imports: 486K MT, 11% of global
• Dairy consumption growth has increased and promises sustained growth over the longer term as economic development moves inland and 200M more Chinese join the middle class
• Production took a big hit from melamine crisis in ‘08-’09, widening China’s demand gap. Current industry structure makes large production increases unlikely without major investments in large, industrial farms
• Ongoing quality issues and lack of trust in domestically produced products create near-term opportunities to boost imports
• China will continue to be a net importer over the long term, but government tightening of import documentation requirements may create difficulty for U.S. imports
SE Asia Net imports: 777K MT, 17% of global
Although milk production increased faster than expected, local production still covers <10% of consumption
SE Asia remains a sizeable importer of dairy products with strong potential for consumption growth
Russia Net imports: 658K MT, 14% of global
Production dipped during 07-10 due to droughts, high temperature and high-feed prices, widening demand gap
Future production unclear due to recent instability in milk production and shifting government policies
Consumption growth slow due to a declining population
Russia expected to remain major dairy importer despite government efforts to encourage domestic production and stricter documentation requirements (effectively blocking Ukrainian and U.S. imports)
Legend Impact on demand gap: Bigger gap Small change Smaller gap
More on demand and other import markets (1)
18
Note: Net import figures as of 2010
19
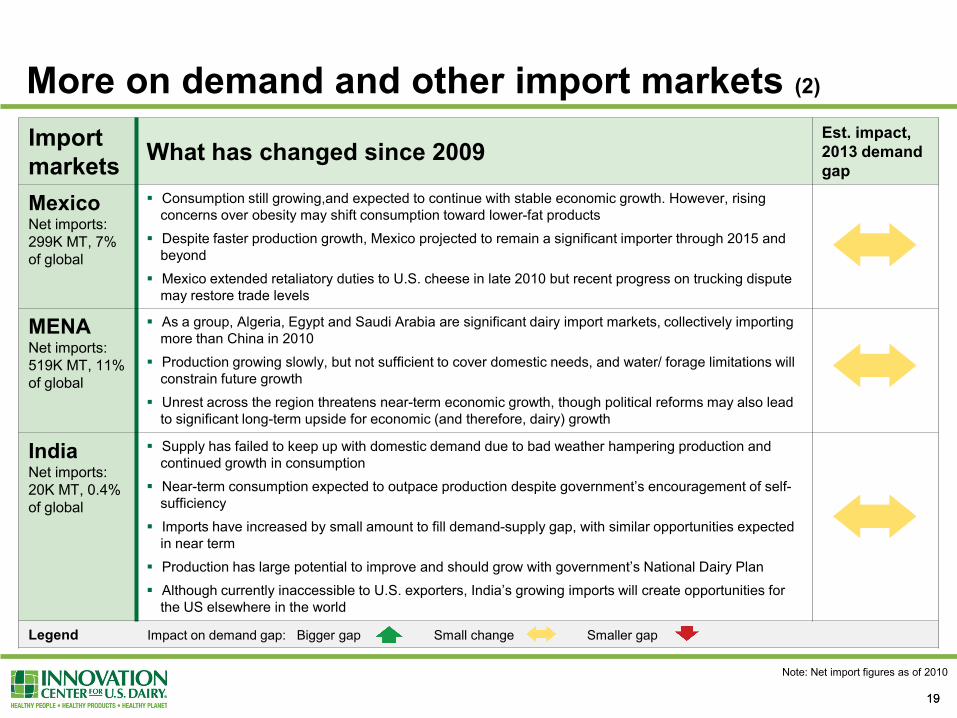
Import markets What has changed since 2009
Est. impact, 2013 demand gap
Mexico Net imports: 299K MT, 7% of global
Consumption still growing,and expected to continue with stable economic growth. However, rising concerns over obesity may shift consumption toward lower-fat products
Despite faster production growth, Mexico projected to remain a significant importer through 2015 and beyond
Mexico extended retaliatory duties to U.S. cheese in late 2010 but recent progress on trucking dispute may restore trade levels
MENA Net imports: 519K MT, 11% of global
As a group, Algeria, Egypt and Saudi Arabia are significant dairy import markets, collectively importing more than China in 2010
Production growing slowly, but not sufficient to cover domestic needs, and water/ forage limitations will constrain future growth
Unrest across the region threatens near-term economic growth, though political reforms may also lead to significant long-term upside for economic (and therefore, dairy) growth
India Net imports: 20K MT, 0.4% of global
Supply has failed to keep up with domestic demand due to bad weather hampering production and continued growth in consumption
Near-term consumption expected to outpace production despite government’s encouragement of self-sufficiency
Imports have increased by small amount to fill demand-supply gap, with similar opportunities expected in near term
Production has large potential to improve and should grow with government’s National Dairy Plan
Although currently inaccessible to U.S. exporters, India’s growing imports will create opportunities for the US elsewhere in the world
Legend Impact on demand gap: Bigger gap Small change Smaller gap
19
Note: Net import figures as of 2010
More on demand and other import markets (2)
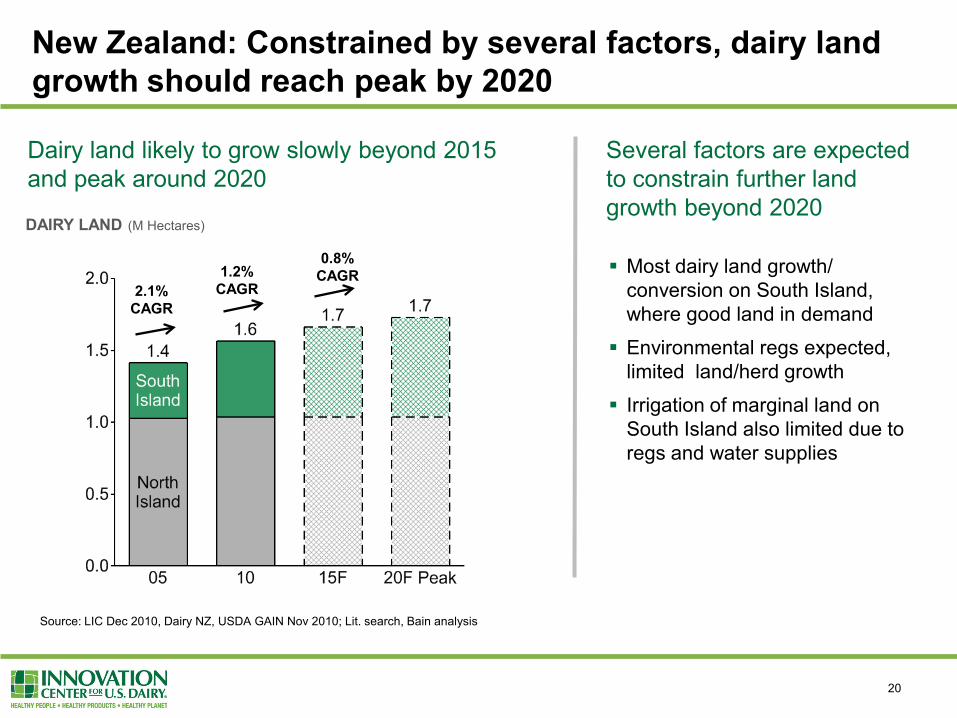
New Zealand: Constrained by several factors, dairy land growth should reach peak by 2020
Source: LIC Dec 2010, Dairy NZ, USDA GAIN Nov 2010; Lit. search, Bain analysis
0.8% CAGR 1.2%
CAGR 2.1% CAGR
Most dairy land growth/ conversion on South Island, where good land in demand
Environmental regs expected, limited land/herd growth
Irrigation of marginal land on South Island also limited due to regs and water supplies
Dairy land likely to grow slowly beyond 2015 and peak around 2020
Several factors are expected to constrain further land growth beyond 2020
20
it
it
it
DAIRY LAND (M Hectares)
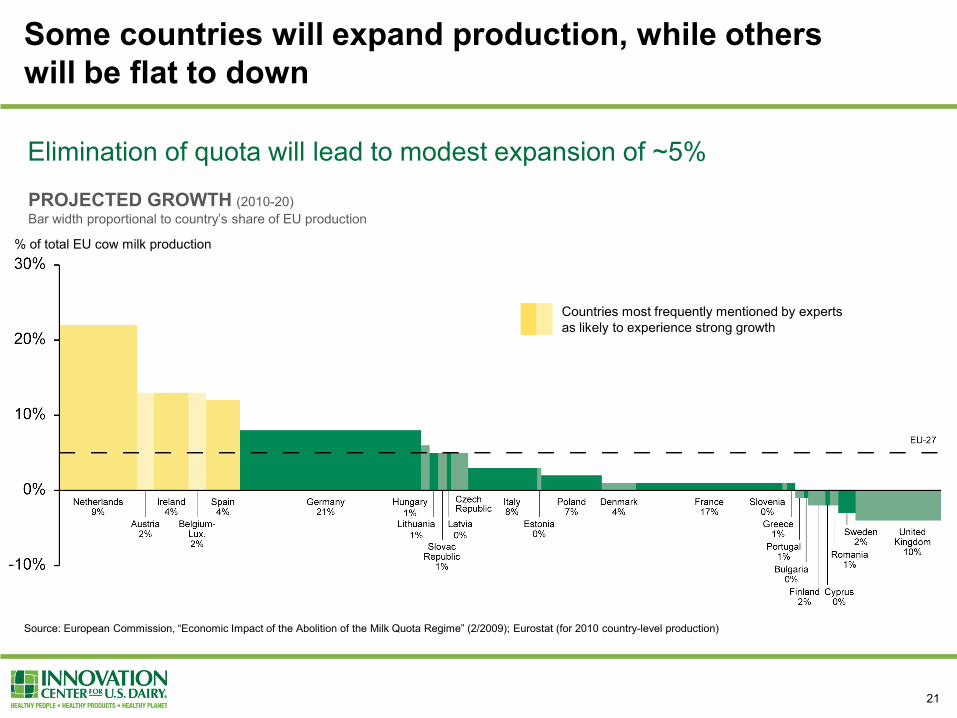
PROJECTED GROWTH (2010-20) Bar width proportional to country’s share of EU production
Some countries will expand production, while others will be flat to down
21
Source: European Commission, “Economic Impact of the Abolition of the Milk Quota Regime” (2/2009); Eurostat (for 2010 country-level production)
Countries most frequently mentioned by experts as likely to experience strong growth
Elimination of quota will lead to modest expansion of ~5%
% of total EU cow milk production
22
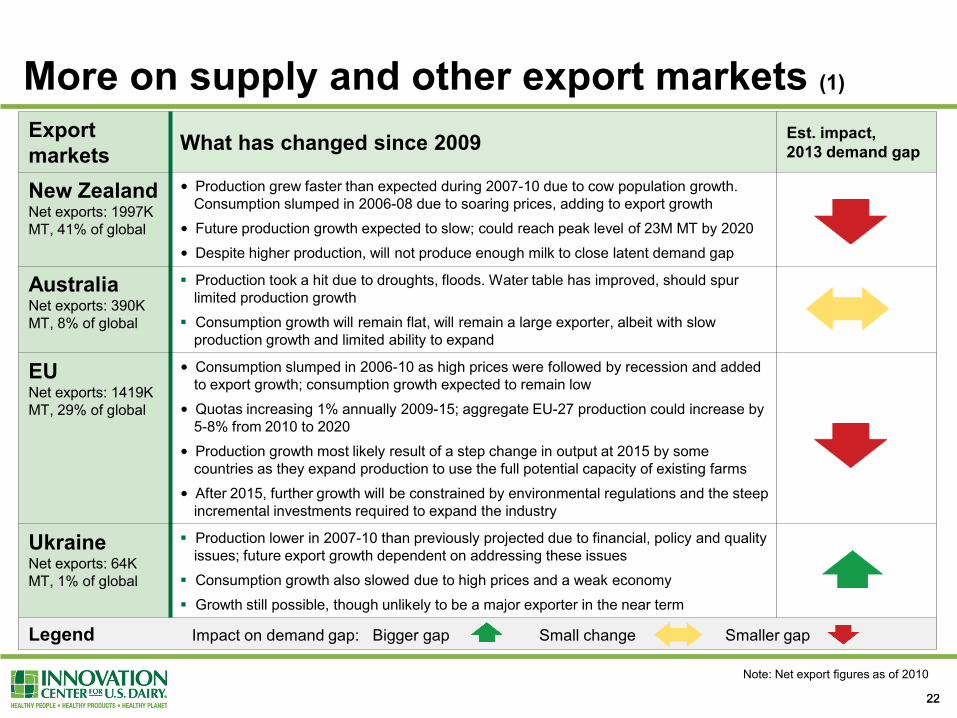
Export markets What has changed since 2009 Est. impact,
2013 demand gap
New Zealand Net exports: 1997K MT, 41% of global
• Production grew faster than expected during 2007-10 due to cow population growth. Consumption slumped in 2006-08 due to soaring prices, adding to export growth
• Future production growth expected to slow; could reach peak level of 23M MT by 2020
• Despite higher production, will not produce enough milk to close latent demand gap
Australia Net exports: 390K MT, 8% of global
Production took a hit due to droughts, floods. Water table has improved, should spur limited production growth
Consumption growth will remain flat, will remain a large exporter, albeit with slow production growth and limited ability to expand
EU Net exports: 1419K MT, 29% of global
• Consumption slumped in 2006-10 as high prices were followed by recession and added to export growth; consumption growth expected to remain low
• Quotas increasing 1% annually 2009-15; aggregate EU-27 production could increase by 5-8% from 2010 to 2020
• Production growth most likely result of a step change in output at 2015 by some countries as they expand production to use the full potential capacity of existing farms
• After 2015, further growth will be constrained by environmental regulations and the steep incremental investments required to expand the industry
Ukraine Net exports: 64K MT, 1% of global
Production lower in 2007-10 than previously projected due to financial, policy and quality issues; future export growth dependent on addressing these issues
Consumption growth also slowed due to high prices and a weak economy
Growth still possible, though unlikely to be a major exporter in the near term
Legend Impact on demand gap: Bigger gap Small change Smaller gap
More on supply and other export markets (1)
22
Note: Net export figures as of 2010
23 23
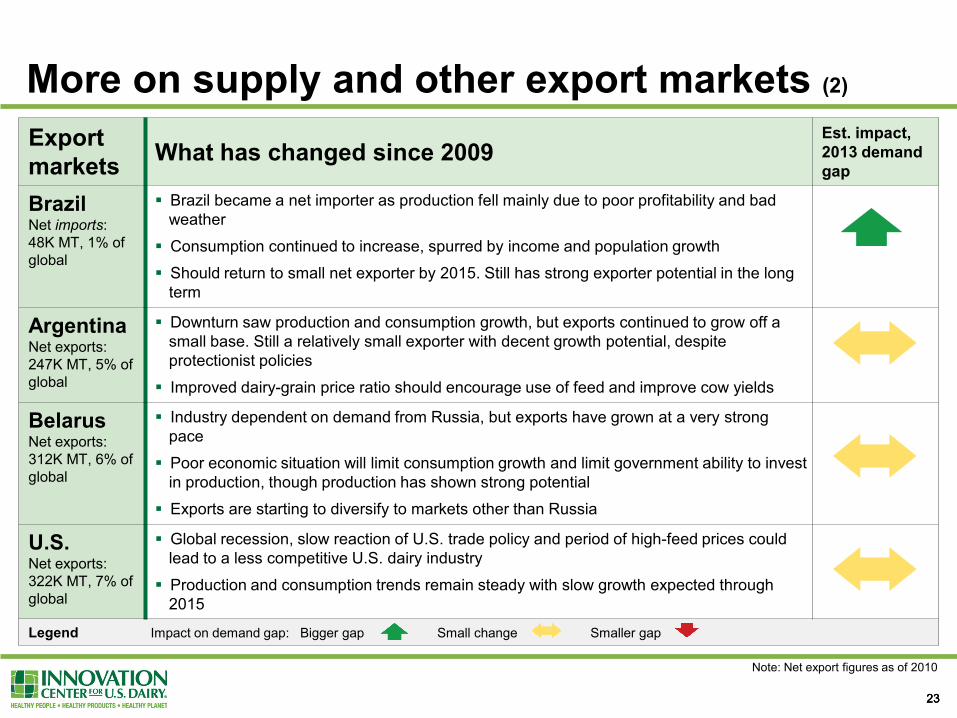
Export markets What has changed since 2009
Est. impact, 2013 demand gap
Brazil Net imports: 48K MT, 1% of global
Brazil became a net importer as production fell mainly due to poor profitability and bad weather
Consumption continued to increase, spurred by income and population growth
Should return to small net exporter by 2015. Still has strong exporter potential in the long term
Argentina Net exports: 247K MT, 5% of global
Downturn saw production and consumption growth, but exports continued to grow off a small base. Still a relatively small exporter with decent growth potential, despite protectionist policies
Improved dairy-grain price ratio should encourage use of feed and improve cow yields
Belarus Net exports: 312K MT, 6% of global
Industry dependent on demand from Russia, but exports have grown at a very strong pace
Poor economic situation will limit consumption growth and limit government ability to invest in production, though production has shown strong potential
Exports are starting to diversify to markets other than Russia
U.S. Net exports: 322K MT, 7% of global
Global recession, slow reaction of U.S. trade policy and period of high-feed prices could lead to a less competitive U.S. dairy industry
Production and consumption trends remain steady with slow growth expected through 2015
Legend Impact on demand gap: Bigger gap Small change Smaller gap
23
Note: Net export figures as of 2010
More on supply and other export markets (2)
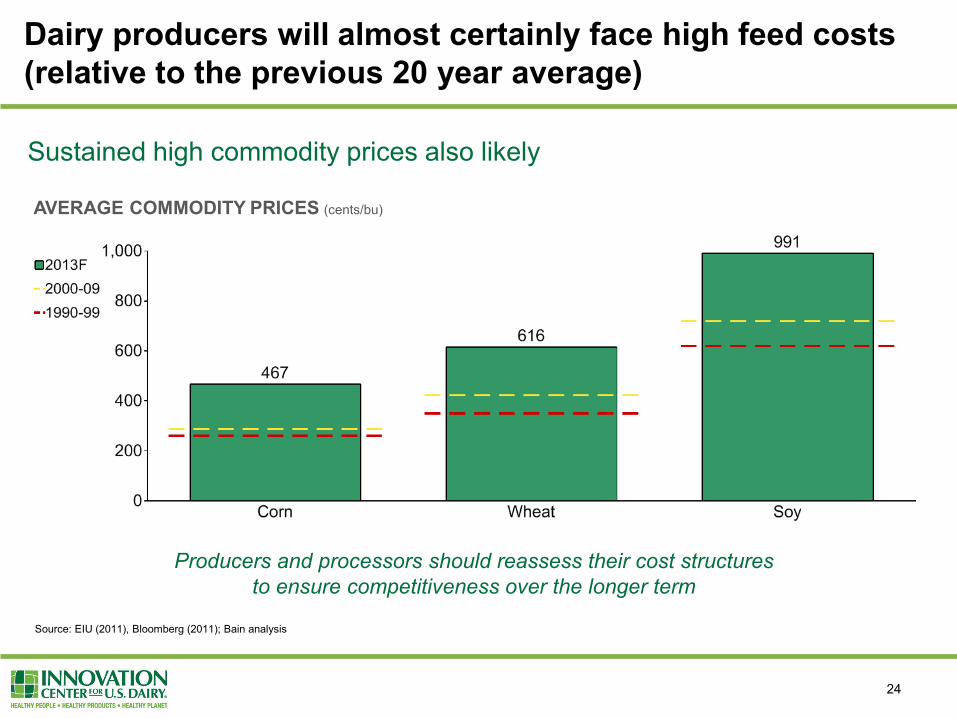
Dairy producers will almost certainly face high feed costs (relative to the previous 20 year average)
Producers and processors should reassess their cost structures to ensure competitiveness over the longer term
Source: EIU (2011), Bloomberg (2011); Bain analysis
Sustained high commodity prices also likely
AVERAGE COMMODITY PRICES (cents/bu)
24
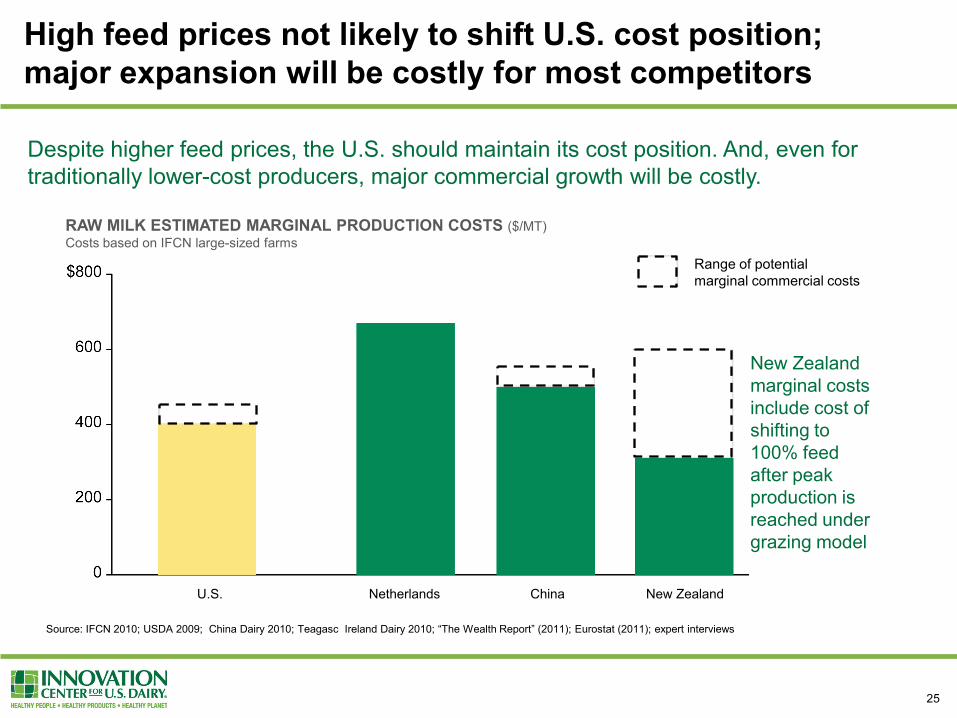
New Zealand marginal costs include cost of shifting to 100% feed after peak production is reached under grazing model
Range of potential marginal commercial costs
Netherlands China New Zealand U.S.
High feed prices not likely to shift U.S. cost position; major expansion will be costly for most competitors
25
Source: IFCN 2010; USDA 2009; China Dairy 2010; Teagasc Ireland Dairy 2010; “The Wealth Report” (2011); Eurostat (2011); expert interviews
Despite higher feed prices, the U.S. should maintain its cost position. And, even for traditionally lower-cost producers, major commercial growth will be costly.
RAW MILK ESTIMATED MARGINAL PRODUCTION COSTS ($/MT) Costs based on IFCN large-sized farms
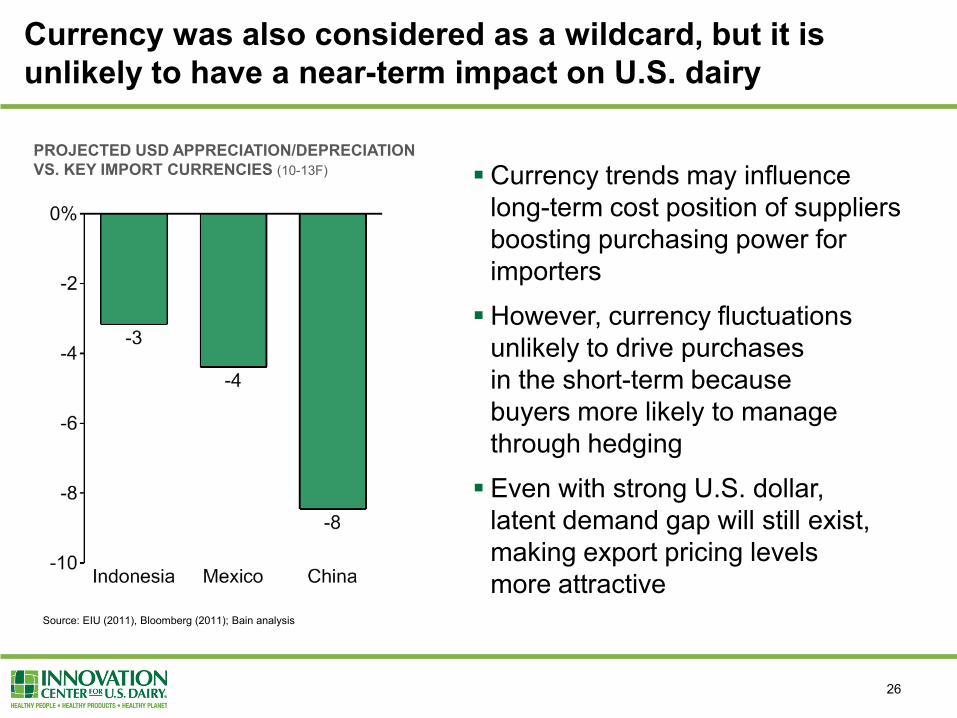
Currency was also considered as a wildcard, but it is unlikely to have a near-term impact on U.S. dairy
Source: EIU (2011), Bloomberg (2011); Bain analysis
PROJECTED USD APPRECIATION/DEPRECIATION VS. KEY IMPORT CURRENCIES (10-13F)
26
Currency trends may influence long-term cost position of suppliers boosting purchasing power for importers
However, currency fluctuations unlikely to drive purchases in the short-term because buyers more likely to manage through hedging
Even with strong U.S. dollar, latent demand gap will still exist, making export pricing levels more attractive

By text, type in using on-screen Q&A panel By phone, press *1 to notify an operator For technical difficulties, press *0 on telephone touchpad
Comments, questions from participants?
27
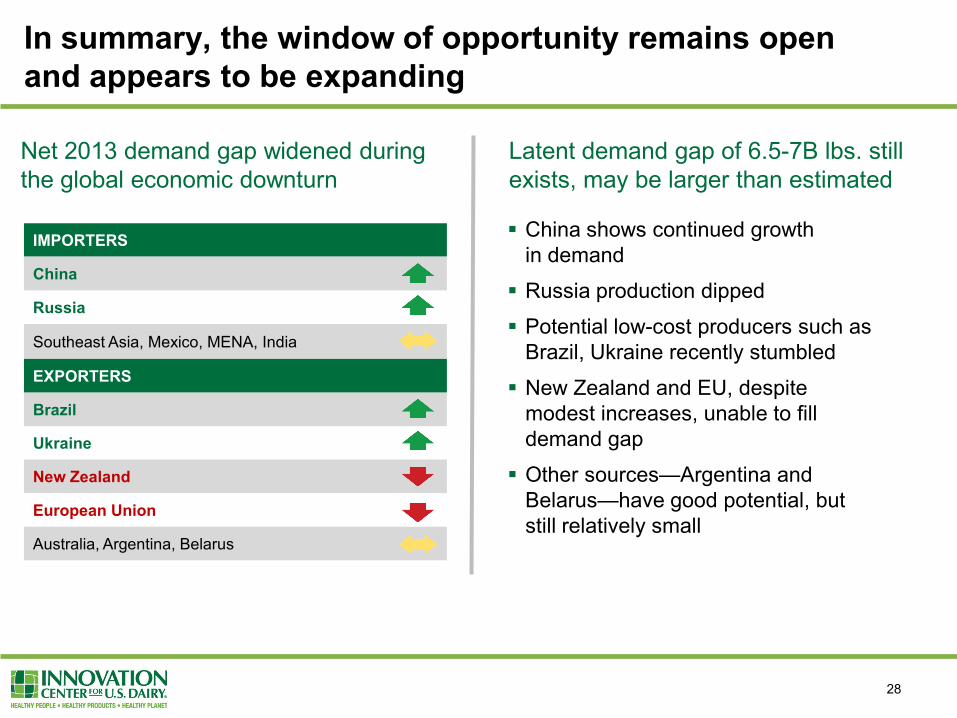
In summary, the window of opportunity remains open and appears to be expanding
IMPORTERS
China
Russia
Southeast Asia, Mexico, MENA, India
EXPORTERS
Brazil
Ukraine
New Zealand
European Union
Australia, Argentina, Belarus
China shows continued growth in demand
Russia production dipped
Potential low-cost producers such as Brazil, Ukraine recently stumbled
New Zealand and EU, despite modest increases, unable to fill demand gap
Other sources—Argentina and Belarus—have good potential, but still relatively small
Net 2013 demand gap widened during the global economic downturn
Latent demand gap of 6.5-7B lbs. still exists, may be larger than estimated
28
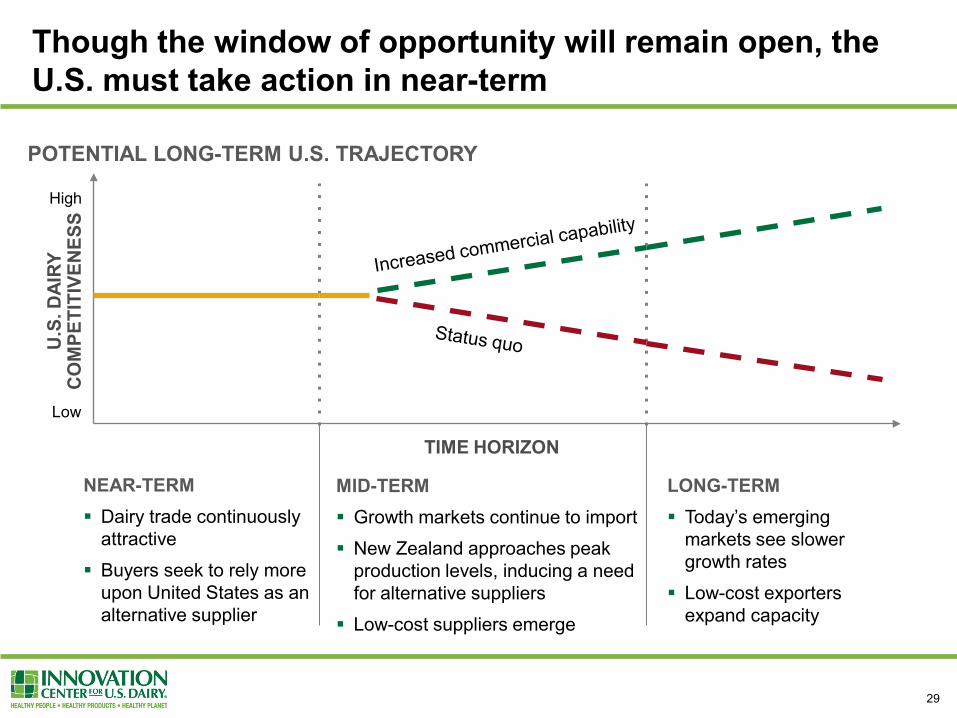
Though the window of opportunity will remain open, the U.S. must take action in near-term
29
TIME HORIZON
High
Low
U.S
. DAI
RY
CO
MPE
TITI
VEN
ESS
NEAR-TERM Dairy trade continuously
attractive
Buyers seek to rely more upon United States as an alternative supplier
MID-TERM Growth markets continue to import
New Zealand approaches peak production levels, inducing a need for alternative suppliers
Low-cost suppliers emerge
LONG-TERM Today’s emerging
markets see slower growth rates
Low-cost exporters expand capacity
POTENTIAL LONG-TERM U.S. TRAJECTORY
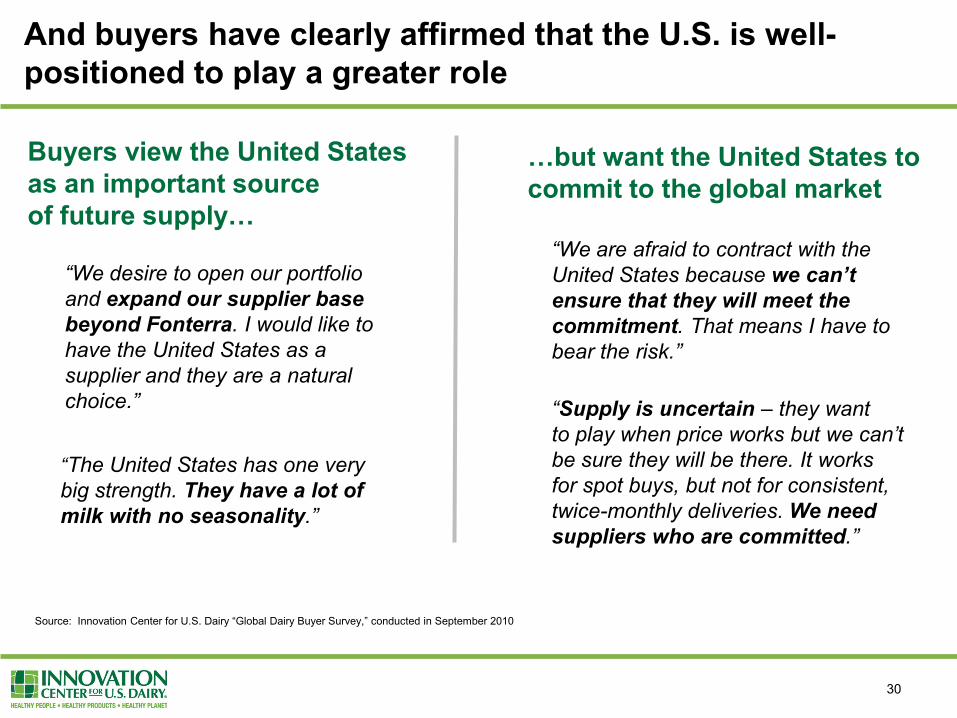
And buyers have clearly affirmed that the U.S. is well-positioned to play a greater role
“The United States has one very big strength. They have a lot of milk with no seasonality.”
“We desire to open our portfolio and expand our supplier base beyond Fonterra. I would like to have the United States as a supplier and they are a natural choice.”
Source: Innovation Center for U.S. Dairy “Global Dairy Buyer Survey,” conducted in September 2010
“Supply is uncertain – they want to play when price works but we can’t be sure they will be there. It works for spot buys, but not for consistent, twice-monthly deliveries. We need suppliers who are committed.”
“We are afraid to contract with the United States because we can’t ensure that they will meet the commitment. That means I have to bear the risk.”
Buyers view the United States as an important source of future supply…
…but want the United States to commit to the global market
30
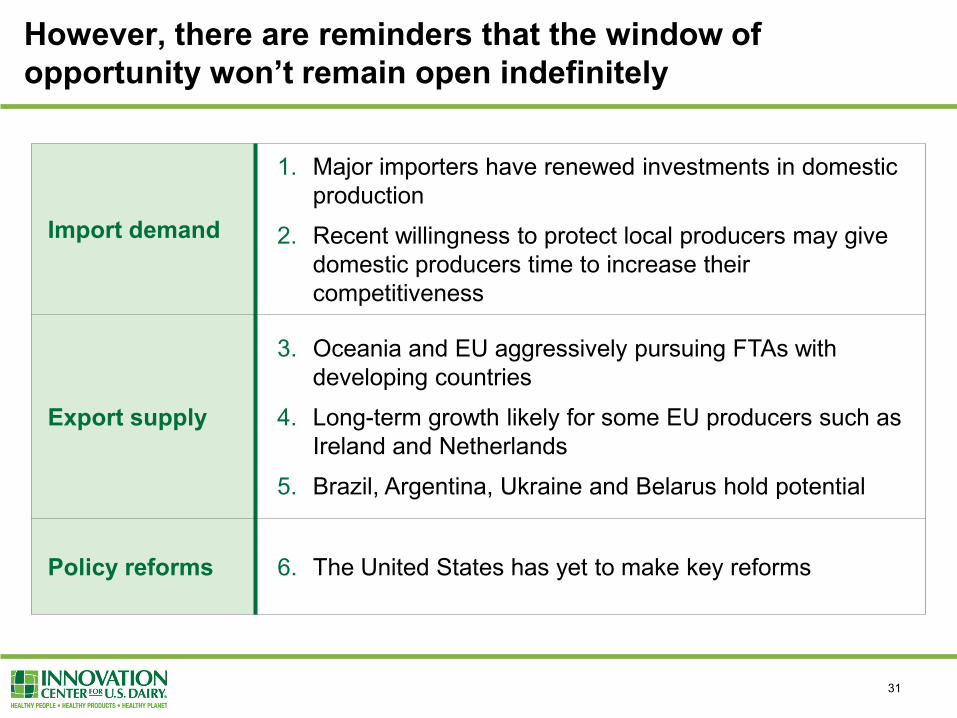
However, there are reminders that the window of opportunity won’t remain open indefinitely
Import demand
1. Major importers have renewed investments in domestic production
2. Recent willingness to protect local producers may give domestic producers time to increase their competitiveness
Export supply
3. Oceania and EU aggressively pursuing FTAs with developing countries
4. Long-term growth likely for some EU producers such as Ireland and Netherlands
5. Brazil, Argentina, Ukraine and Belarus hold potential
Policy reforms 6. The United States has yet to make key reforms
31
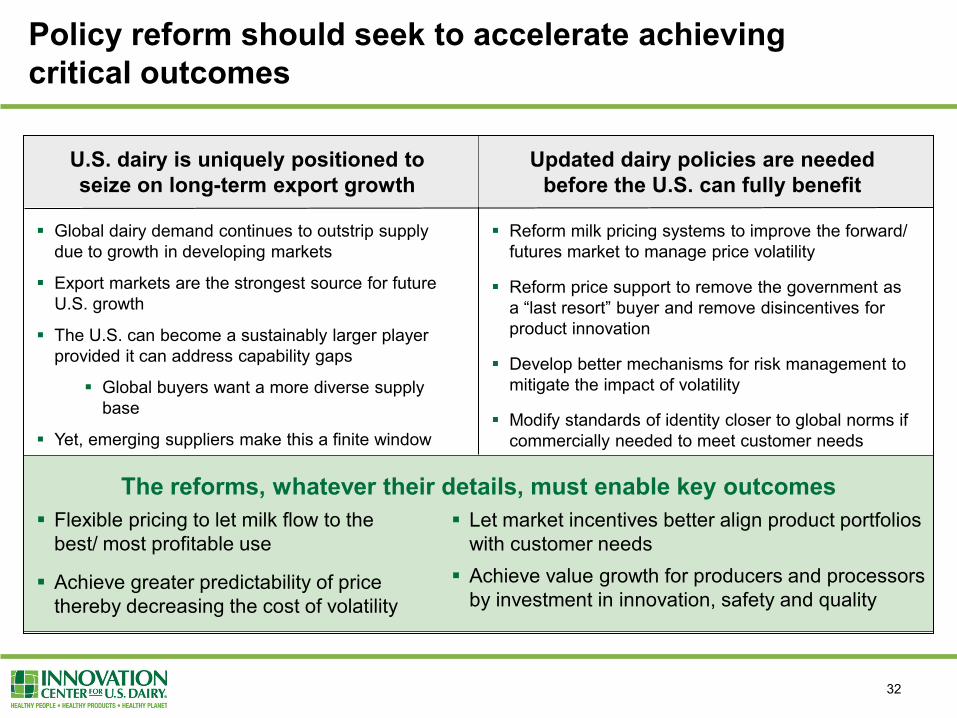
Policy reform should seek to accelerate achieving critical outcomes
U.S. dairy is uniquely positioned to seize on long-term export growth
Updated dairy policies are needed before the U.S. can fully benefit
Global dairy demand continues to outstrip supply due to growth in developing markets
Export markets are the strongest source for future U.S. growth
The U.S. can become a sustainably larger player provided it can address capability gaps
Global buyers want a more diverse supply base
Yet, emerging suppliers make this a finite window
Flexible pricing to let milk flow to the best/ most profitable use
Achieve greater predictability of price thereby decreasing the cost of volatility
Reform milk pricing systems to improve the forward/ futures market to manage price volatility
Reform price support to remove the government as a “last resort” buyer and remove disincentives for product innovation
Develop better mechanisms for risk management to mitigate the impact of volatility
Modify standards of identity closer to global norms if commercially needed to meet customer needs
The reforms, whatever their details, must enable key outcomes
Let market incentives better align product portfolios
with customer needs Achieve value growth for producers and processors
by investment in innovation, safety and quality
32
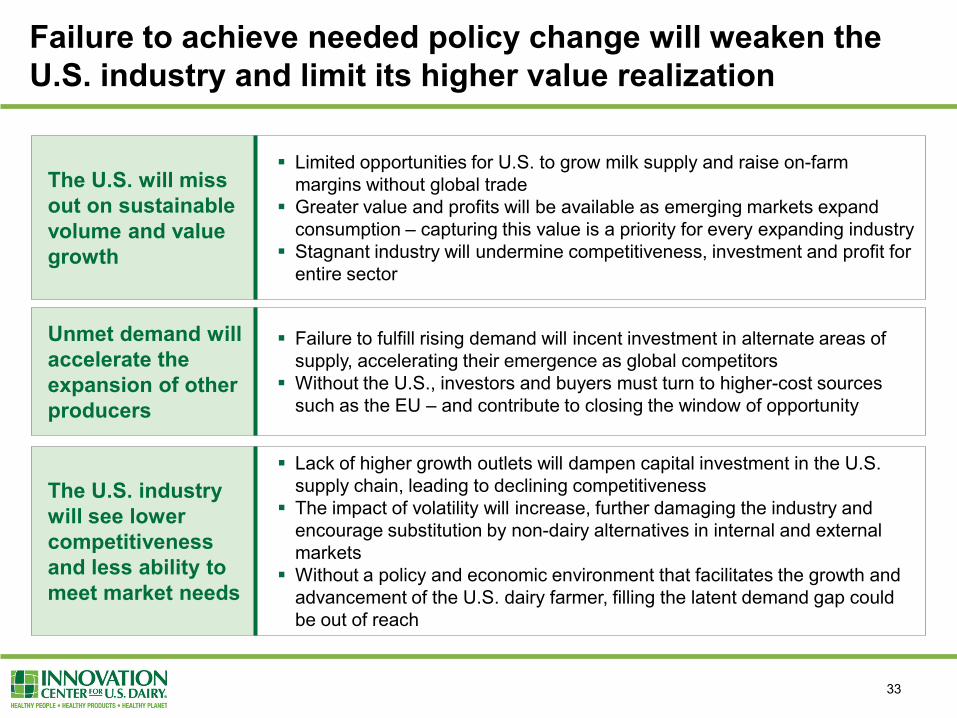
Failure to achieve needed policy change will weaken the U.S. industry and limit its higher value realization
The U.S. will miss out on sustainable volume and value growth
Limited opportunities for U.S. to grow milk supply and raise on-farm margins without global trade
Greater value and profits will be available as emerging markets expand consumption – capturing this value is a priority for every expanding industry
Stagnant industry will undermine competitiveness, investment and profit for entire sector
Unmet demand will accelerate the expansion of other producers
Failure to fulfill rising demand will incent investment in alternate areas of supply, accelerating their emergence as global competitors
Without the U.S., investors and buyers must turn to higher-cost sources such as the EU – and contribute to closing the window of opportunity
The U.S. industry will see lower competitiveness and less ability to meet market needs
Lack of higher growth outlets will dampen capital investment in the U.S. supply chain, leading to declining competitiveness
The impact of volatility will increase, further damaging the industry and encourage substitution by non-dairy alternatives in internal and external markets
Without a policy and economic environment that facilitates the growth and advancement of the U.S. dairy farmer, filling the latent demand gap could be out of reach
33
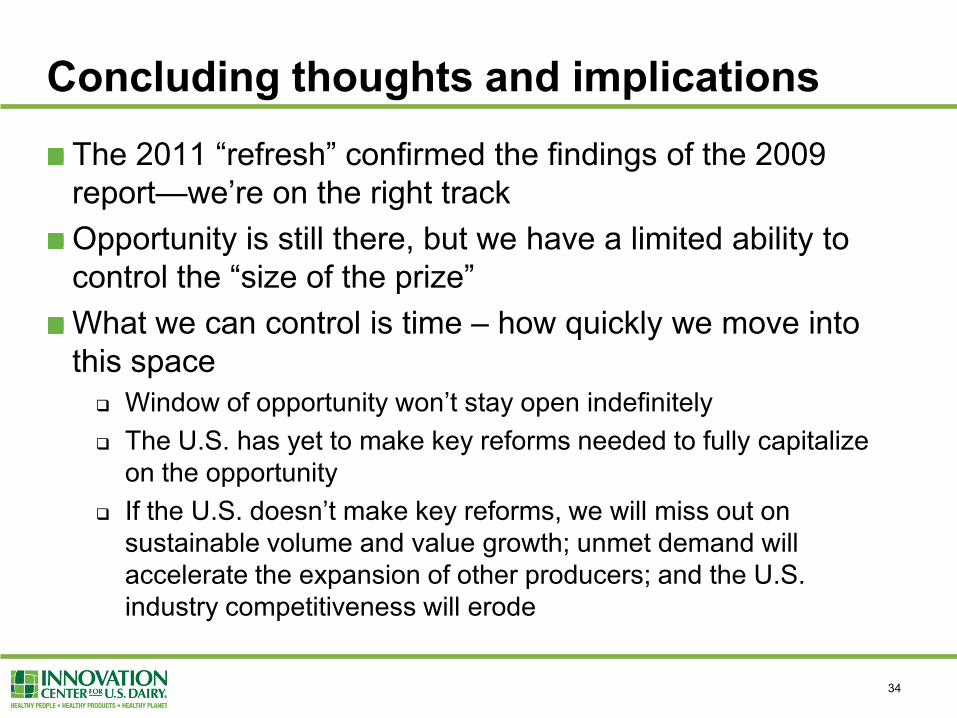
The 2011 “refresh” confirmed the findings of the 2009 report—we’re on the right track Opportunity is still there, but we have a limited ability to control the “size of the prize” What we can control is time – how quickly we move into this space Window of opportunity won’t stay open indefinitely The U.S. has yet to make key reforms needed to fully capitalize
on the opportunity If the U.S. doesn’t make key reforms, we will miss out on
sustainable volume and value growth; unmet demand will accelerate the expansion of other producers; and the U.S. industry competitiveness will erode
Concluding thoughts and implications
34
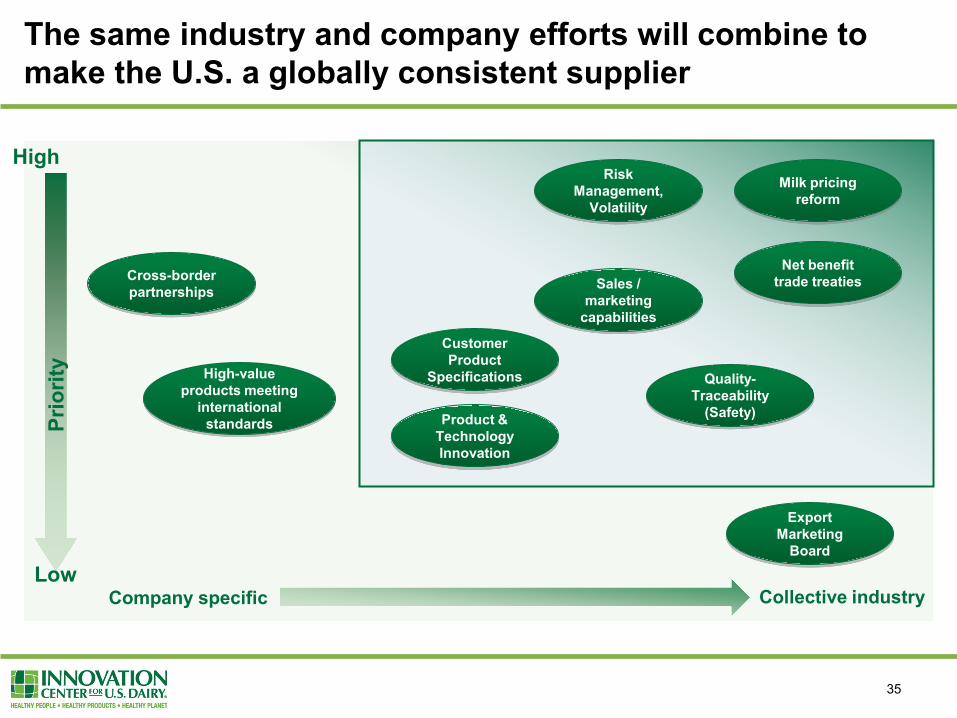
The same industry and company efforts will combine to make the U.S. a globally consistent supplier
Company specific Collective industry
Cross-border partnerships
Milk pricing reform
Risk Management,
Volatility
Quality-Traceability
(Safety)
Net benefit trade treaties
High
Low
Sales / marketing
capabilities
Customer Product
Specifications
Product & Technology Innovation
High-value products meeting
international standards
Export Marketing
Board
Prio
rity
35
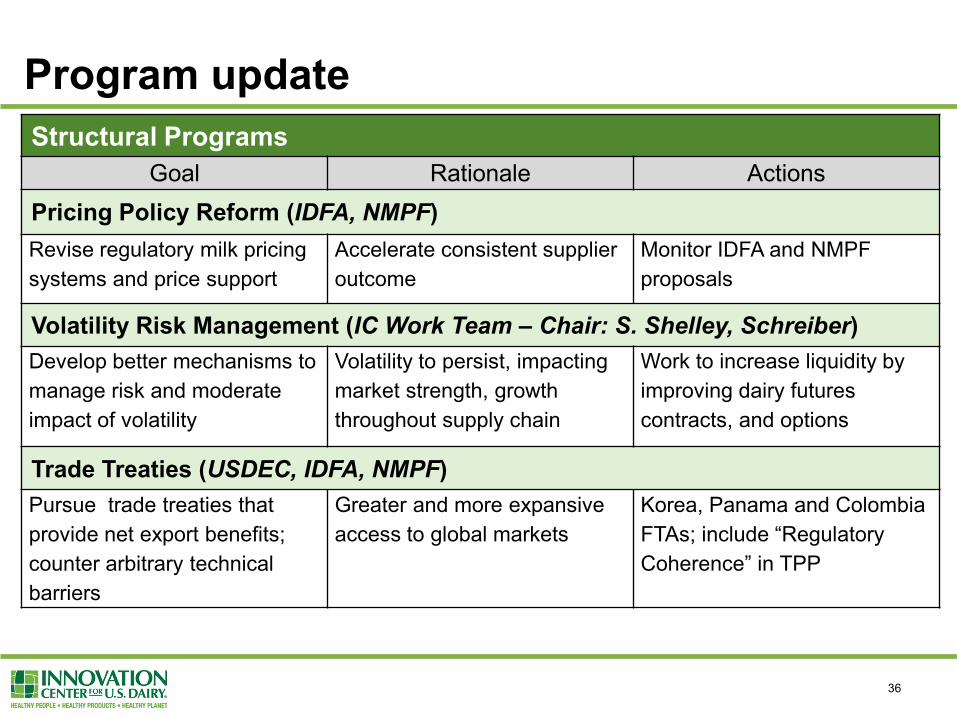
Structural Programs Goal Rationale Actions
Pricing Policy Reform (IDFA, NMPF) Revise regulatory milk pricing systems and price support
Accelerate consistent supplier outcome
Monitor IDFA and NMPF proposals
Volatility Risk Management (IC Work Team – Chair: S. Shelley, Schreiber) Develop better mechanisms to manage risk and moderate impact of volatility
Volatility to persist, impacting market strength, growth throughout supply chain
Work to increase liquidity by improving dairy futures contracts, and options
Trade Treaties (USDEC, IDFA, NMPF) Pursue trade treaties that provide net export benefits; counter arbitrary technical barriers
Greater and more expansive access to global markets
Korea, Panama and Colombia FTAs; include “Regulatory Coherence” in TPP
Program update
36
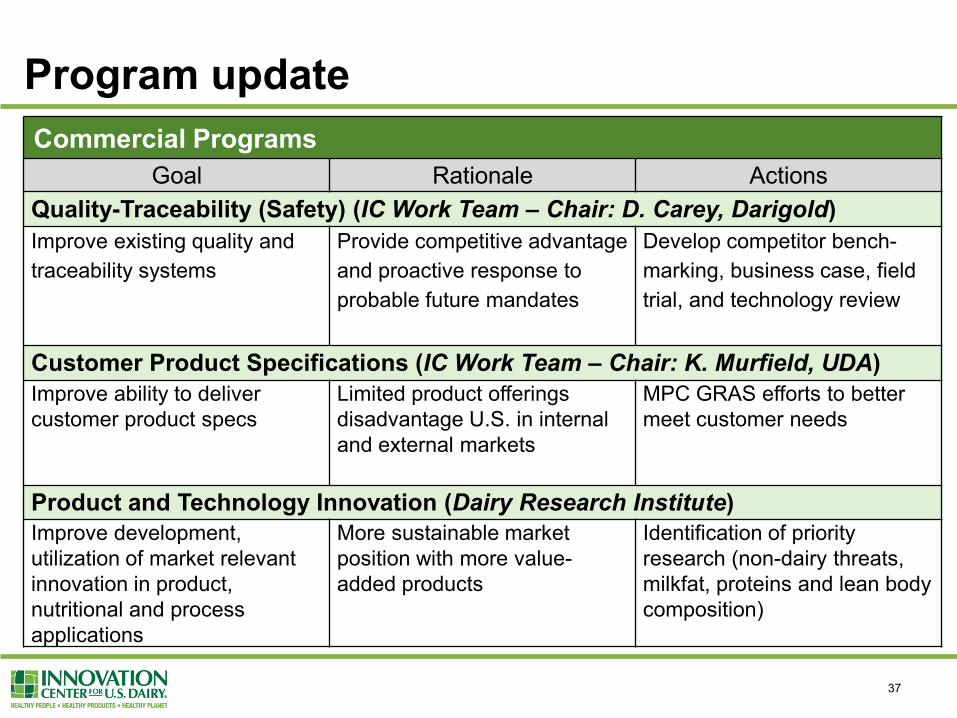
Commercial Programs Goal Rationale Actions
Quality-Traceability (Safety) (IC Work Team – Chair: D. Carey, Darigold) Improve existing quality and traceability systems
Provide competitive advantage and proactive response to probable future mandates
Develop competitor bench-marking, business case, field trial, and technology review
Customer Product Specifications (IC Work Team – Chair: K. Murfield, UDA) Improve ability to deliver customer product specs
Limited product offerings disadvantage U.S. in internal and external markets
MPC GRAS efforts to better meet customer needs
Product and Technology Innovation (Dairy Research Institute) Improve development, utilization of market relevant innovation in product, nutritional and process applications
More sustainable market position with more value-added products
Identification of priority research (non-dairy threats, milkfat, proteins and lean body composition)
Program update
37

Globalization assessment dashboard
38
Goal Stakeholder performance indicator
Current assessment (based on data through first quarter of 2011) Positive Neutral Negative
Increase global competitiveness
Is U.S. becoming more competitive globally?
U.S. building on gains made before 2009 downturn
Is U.S. filling the latent demand gap?
U.S. capturing a growing share of larger market
Is U.S. moving beyond surplus disposal and “supplier of last resort” status?
U.S. NDM/SMP export quantities recovering, but competitors are gaining greater value Also unclear if growth will be sustained as the rate of import demand growth appears to be slowing
Strengthen domestic market
Is U.S. becoming more competitive domestically?
U.S. milk solids continue to displace imports in the domestic market
Provide value to producers
Is the global market contributing to higher returns to U.S. milk producers?
Increasing export share leads to greater market convergence of domestic and international commodity prices; lower, actual class III and Class IV prices converge with higher export equivalents
Improve commercial focus
Is U.S. better fulfilling increasingly demanding needs of global customers?
Buyers say they want U.S. supply option in market, but customer service improvements needed

By text, type in using on-screen Q&A panel By phone, press *1 to notify an operator For technical difficulties, press *0 on telephone touchpad
Comments from participants?
39
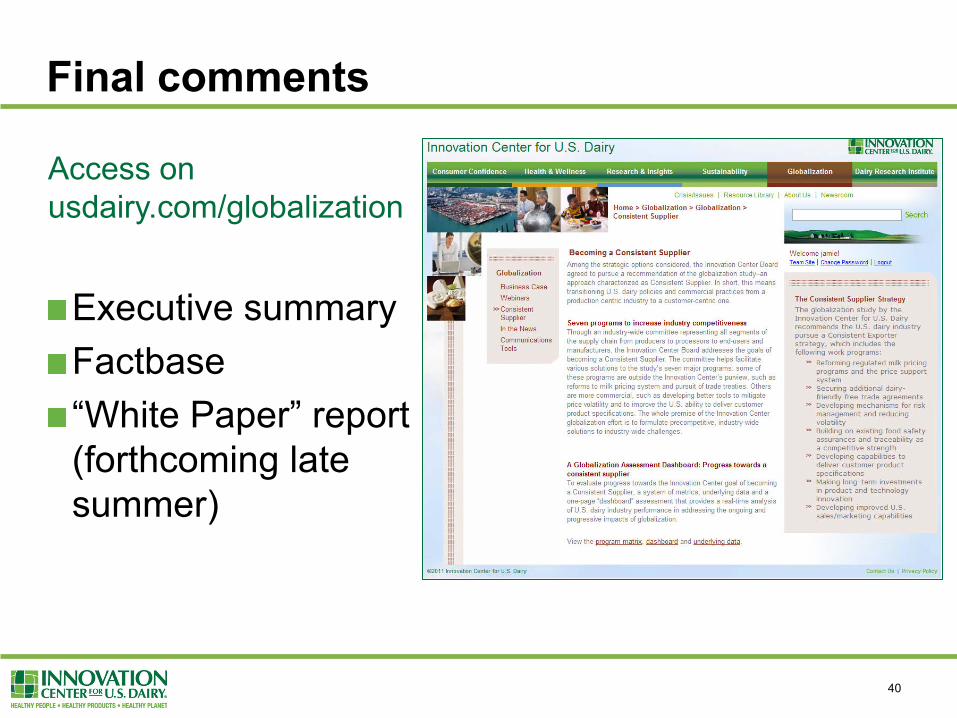
Access on usdairy.com/globalization
Executive summary Factbase “White Paper” report (forthcoming late summer)
Final comments
40
Dairy Globalization Refresh: 2011 Update Summary Findings Conducted by Bain & Company Commissioned by Dairy Management Inc. & U.S. Dairy Export Council
Thank you


