DAIRY PROFIT MONITOR AND ACTIVITY ANALYSIS PROJECTS
Betsey Howland
Cornell University PRO-DAIRY ProgramDepartment of Animal Science
College of Agriculture and Life Sciences
Jason Karszes
TOPICS COVERED TODAY
• Dairy Profit Monitor
• Cost of Manure Application
• Cost of Raising Dairy Replacements

DAIRY PROFIT MONITOR
DPM provides a snapshot of key operating measures a producer has control over from month to month
Shows how different areas of the business are impacting and influencing one another on 1 report
Provides a great resource for tracking up to date performance
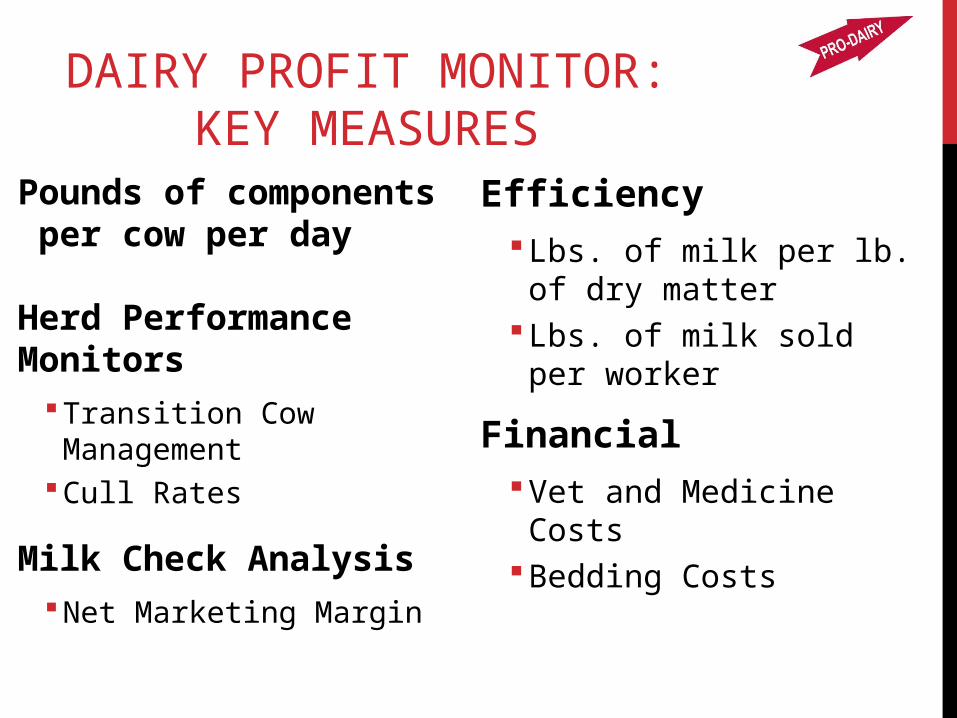
DAIRY PROFIT MONITOR: KEY MEASURES
Pounds of components per cow per day
Herd Performance Monitors
Transition Cow Management
Cull Rates
Milk Check AnalysisNet Marketing Margin
EfficiencyLbs. of milk per lb. of dry
matterLbs. of milk sold per worker
FinancialVet and Medicine CostsBedding Costs

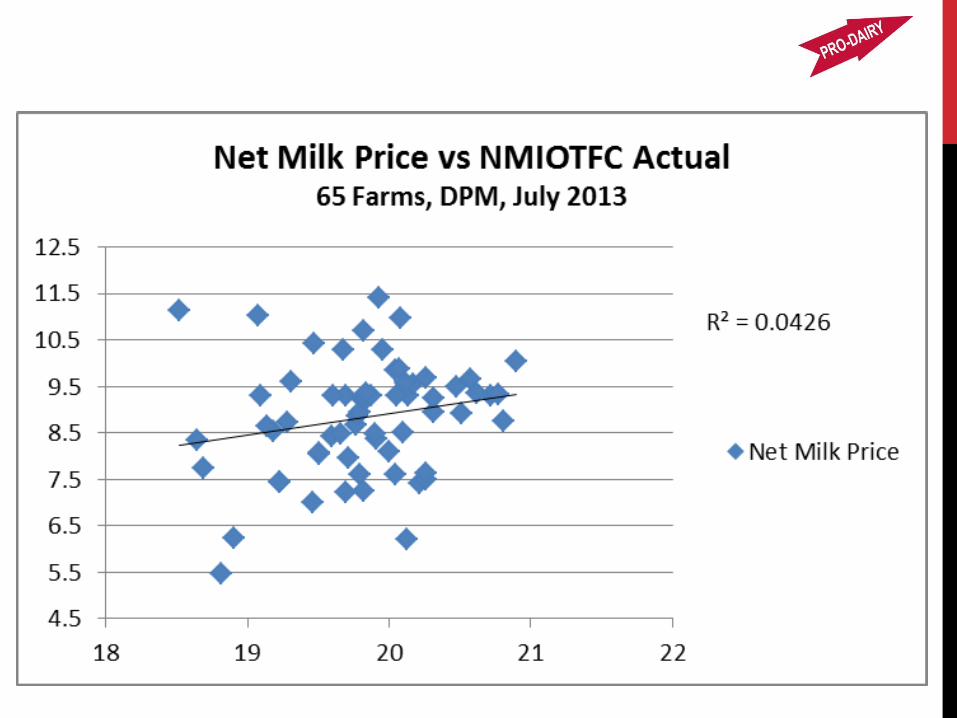
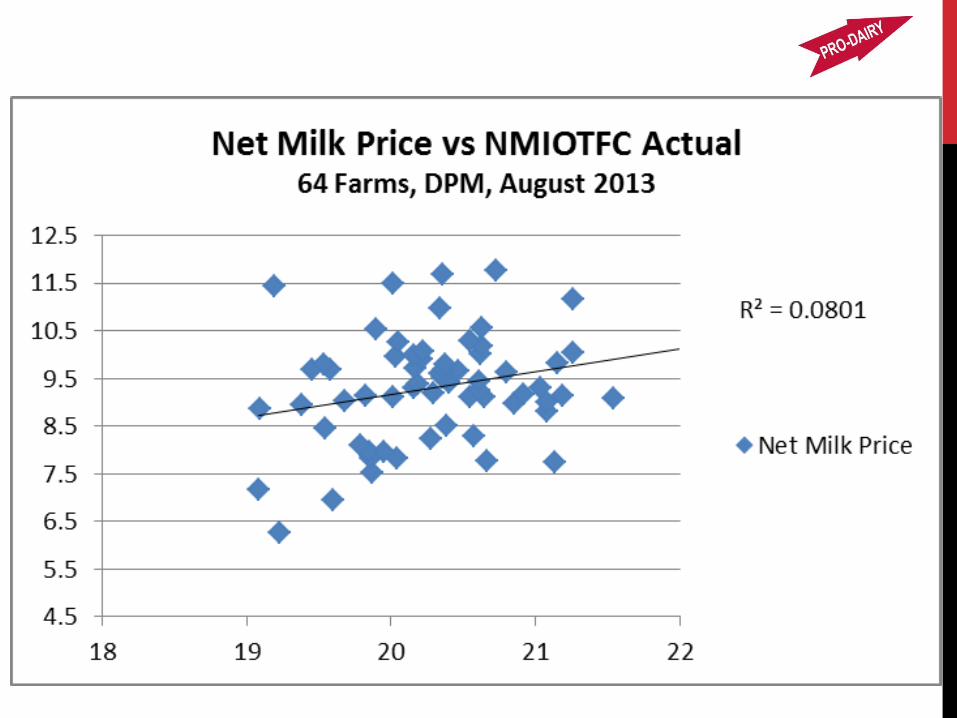
KEY MEASURES: NET MILK INCOME OVER FEED COST
Highest correlation with return on assetsLast 4 years, Dairy Farm Business Summary data
Actual Milk Price
Fixed Milk PriceAverage of prices, last 3 years, Cornell DFBSEliminates variation of milk priceAny changes will be from changes in feeding
program

TRENDS
• How have key production and financial measures changed over the last 12 months?
• Why have they changed?
• 46 farms have data entered for at least 11 of the last 12 months
• 42 of the farms all 12 months complete• 4 farms missing something for just 1 month.

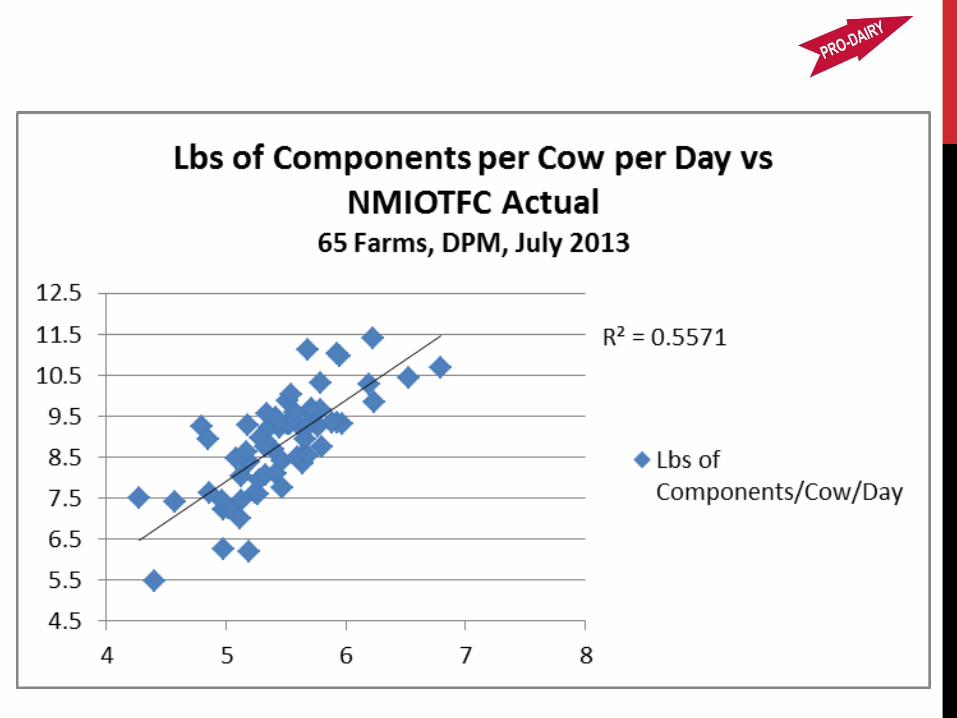
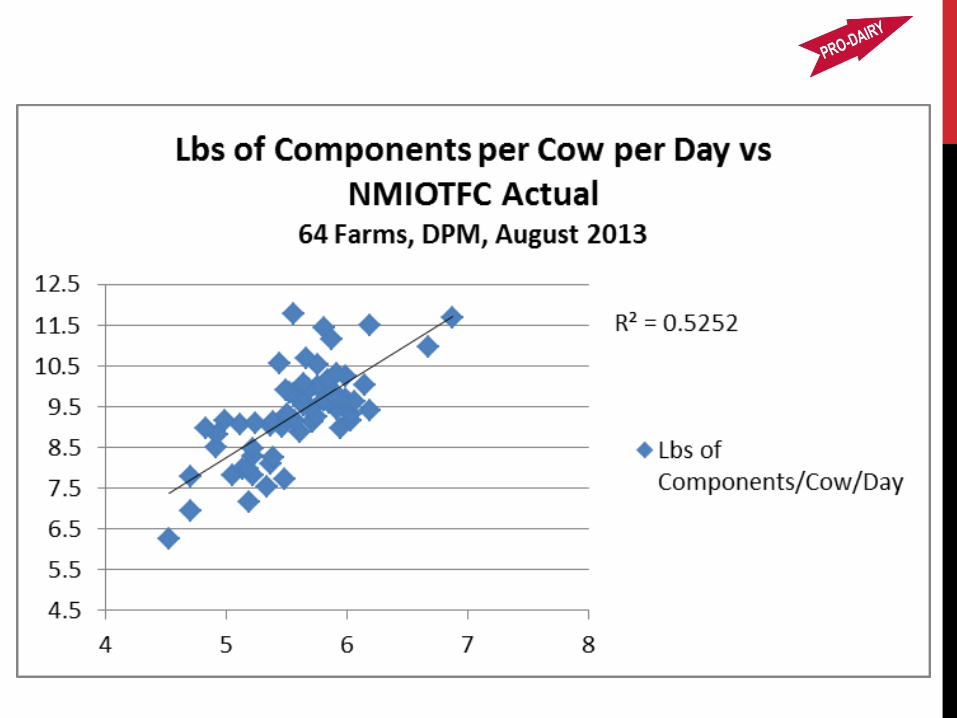
POUNDS OF COMPONENTS PER COW PER DAY
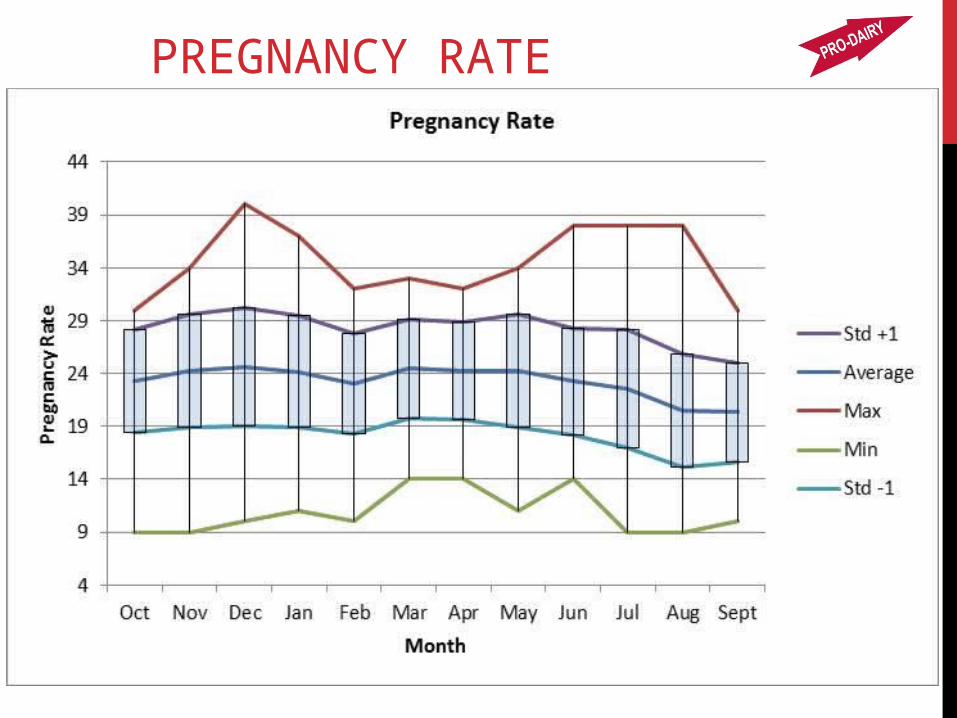
PREGNANCY RATE
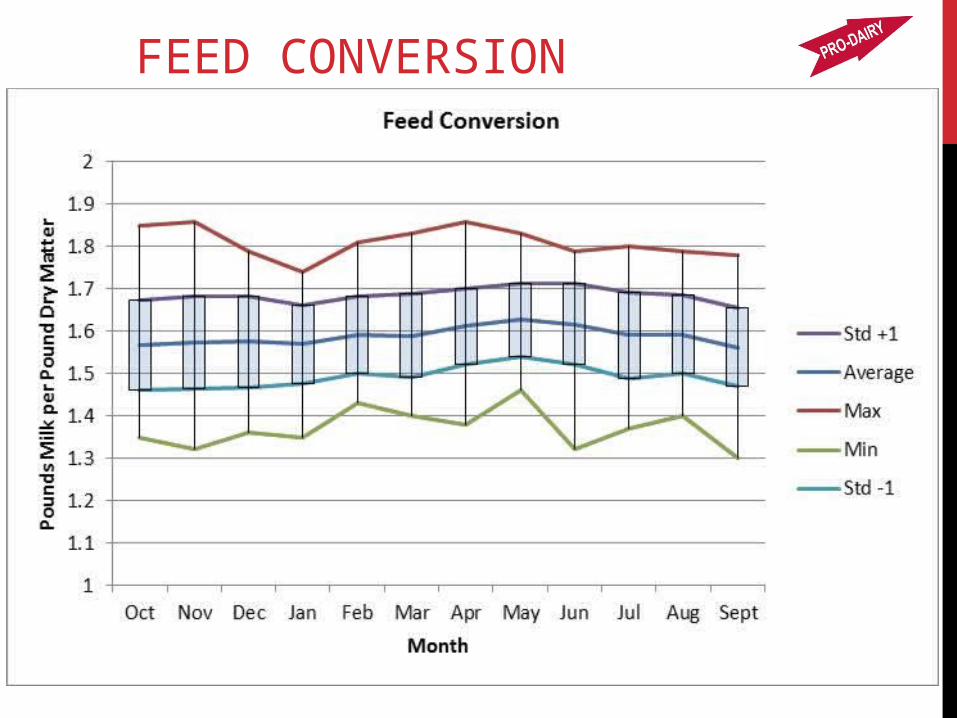
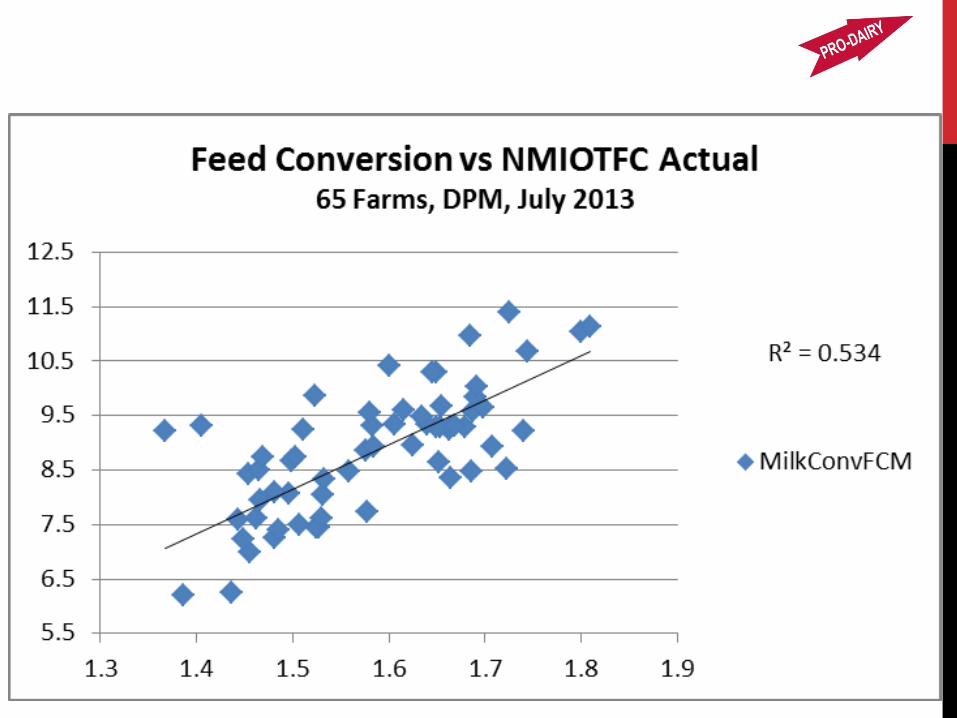
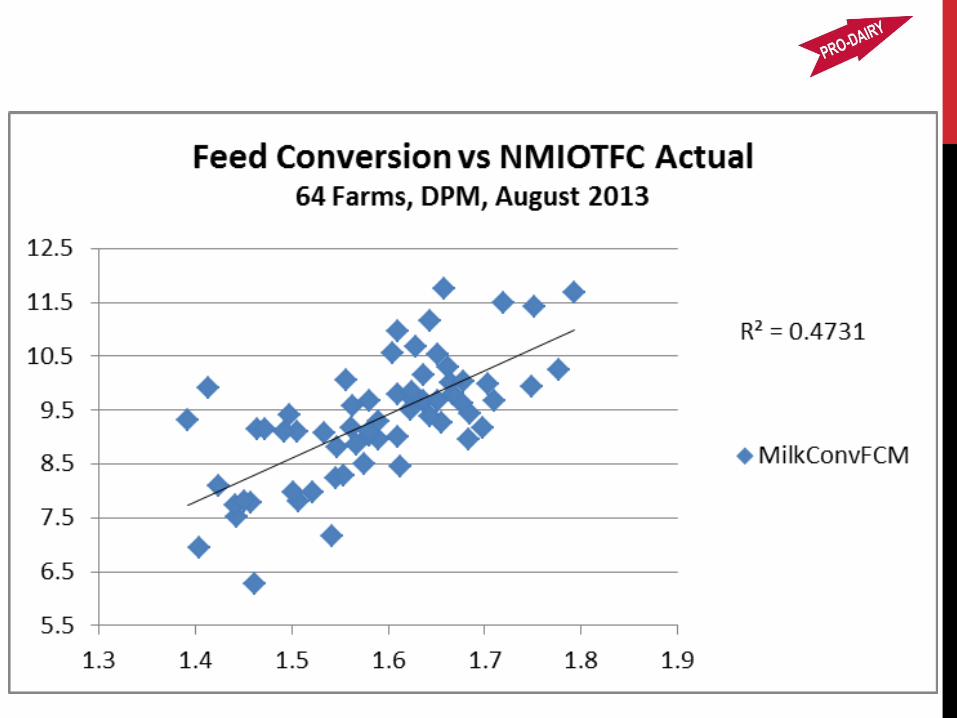
FEED CONVERSION
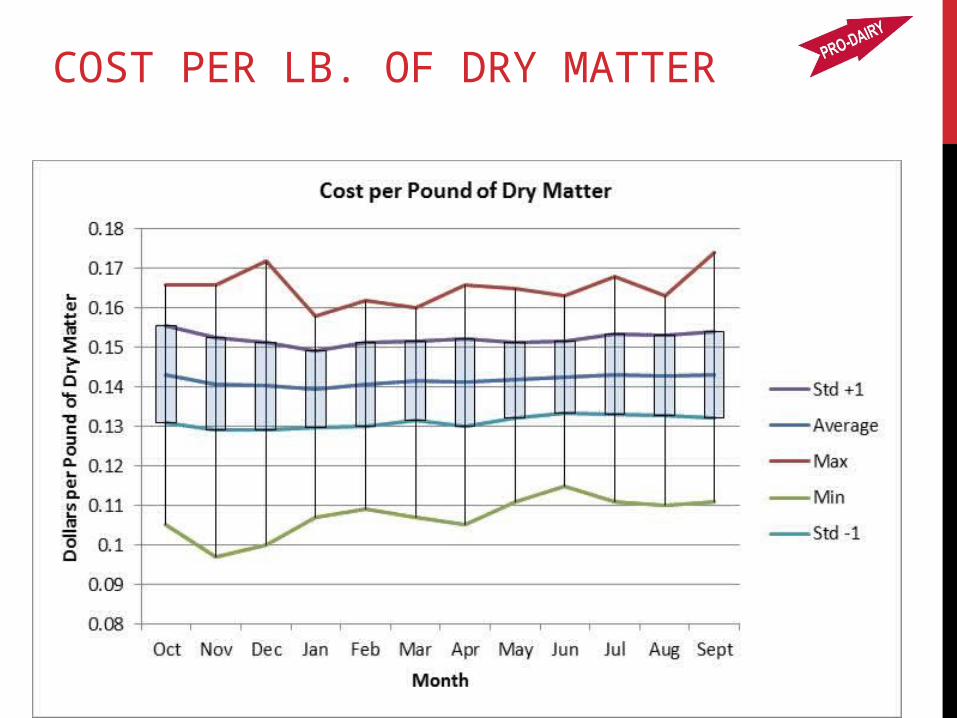
COST PER LB. OF DRY MATTER
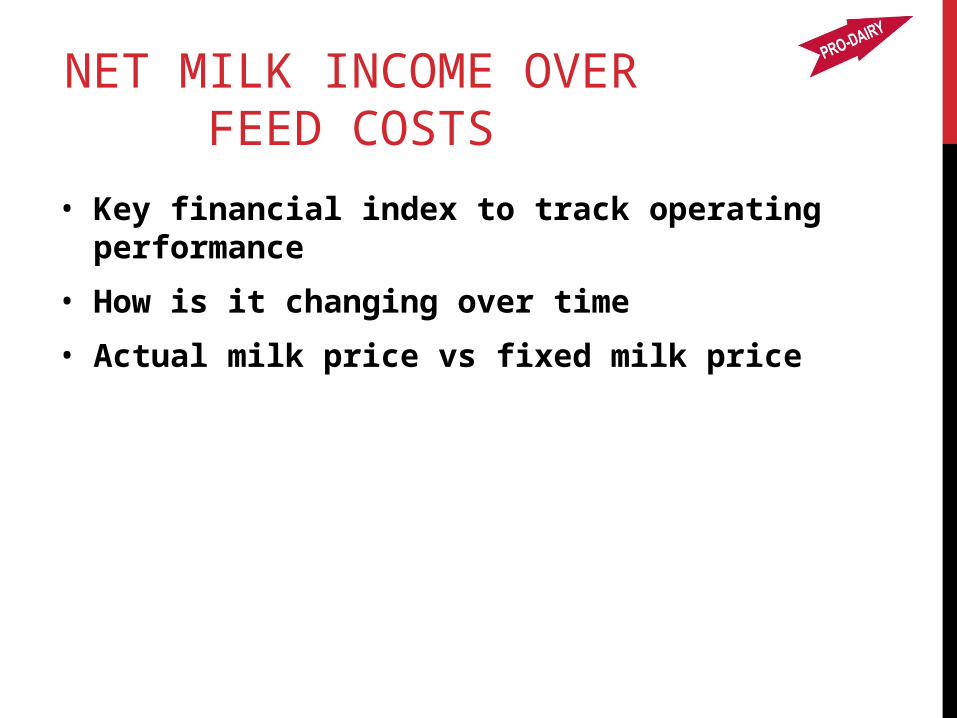
NET MILK INCOME OVER FEED COSTS
• Key financial index to track operating performance
• How is it changing over time
• Actual milk price vs fixed milk price
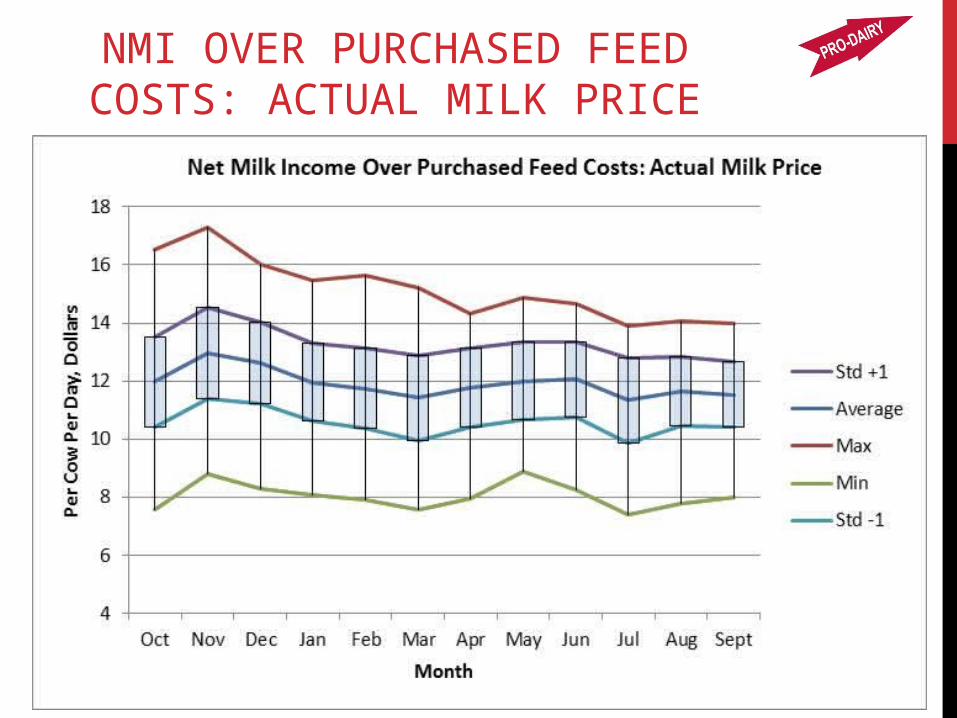
NMI OVER PURCHASED FEED COSTS: ACTUAL MILK PRICE

NMI OVER PURCHASED FEED COSTS: FIXED MILK PRICE FACTORS

NMI OVER TOTAL FEED COSTS: ACTUAL MILK PRICE

NMI OVER TOTAL FEED COSTS: FIXED MILK PRICE FACTORS
WHAT HAS THE GREATEST CORRELATION TO NET MILK INCOME OVER FEED COSTS?


QUESTIONS ON DAIRY PROFIT MONITOR?
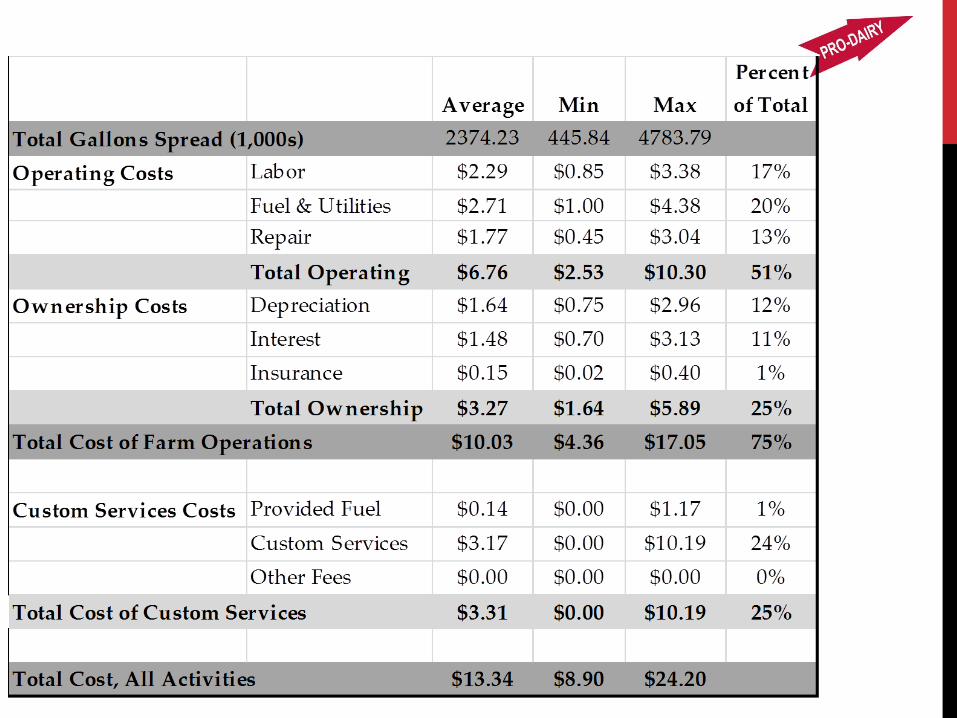
COST OF MANURE HAULING AND APPLICATION
PRELIMINARY RESULTS
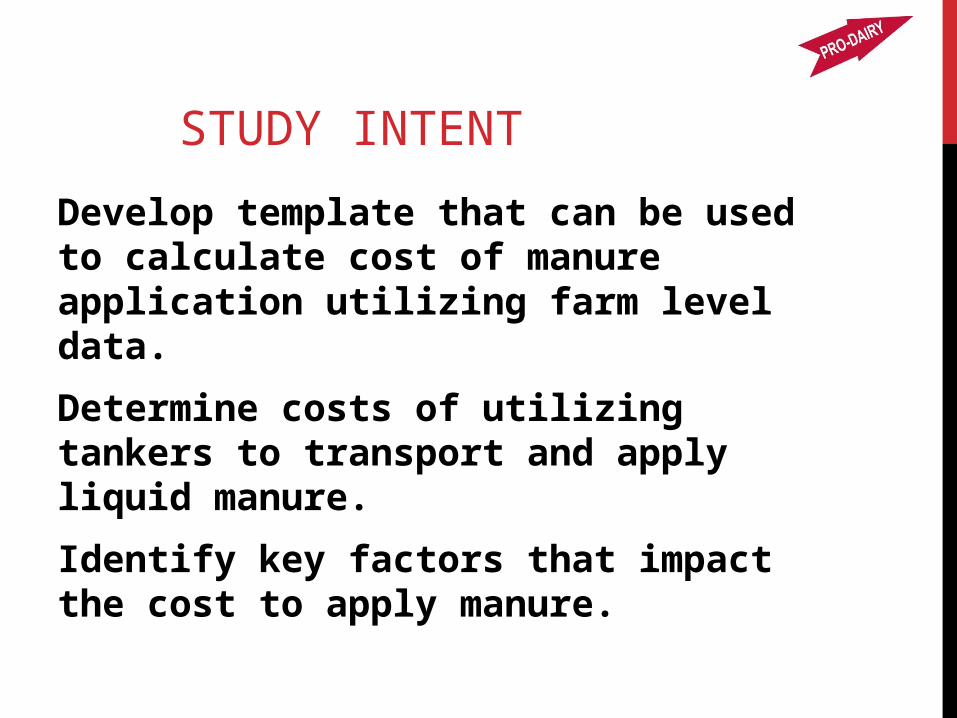
STUDY INTENT
Develop template that can be used to calculate cost of manure application utilizing farm level data.
Determine costs of utilizing tankers to transport and apply liquid manure.
Identify key factors that impact the cost to apply manure.
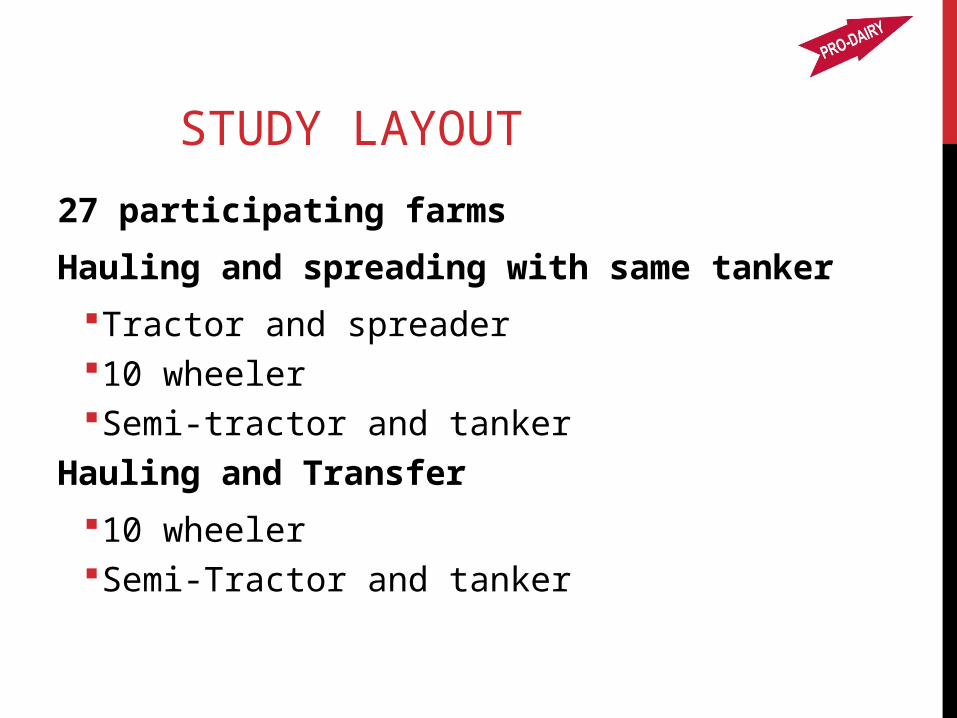
STUDY LAYOUT
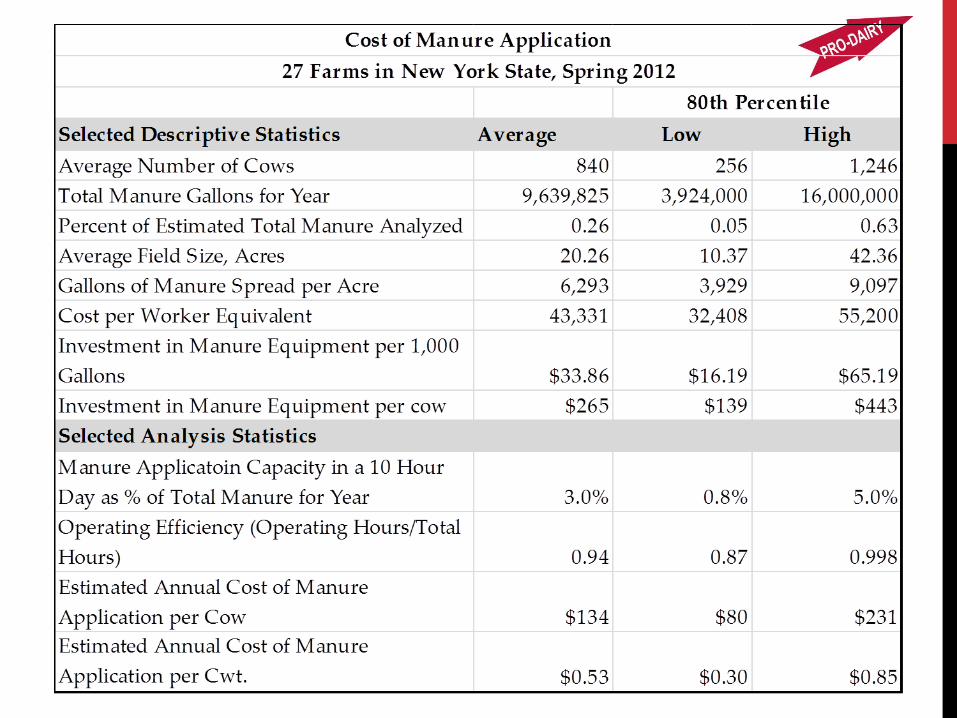
27 participating farms
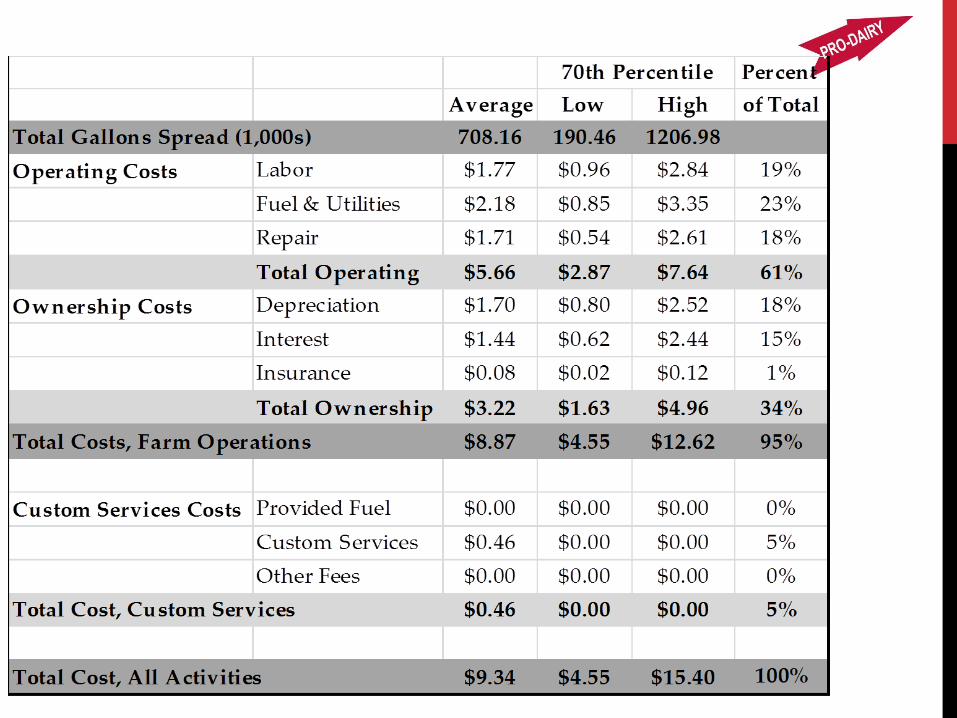
Hauling and spreading with same tanker
Tractor and spreader10 wheelerSemi-tractor and tanker
Hauling and Transfer
10 wheelerSemi-Tractor and tanker
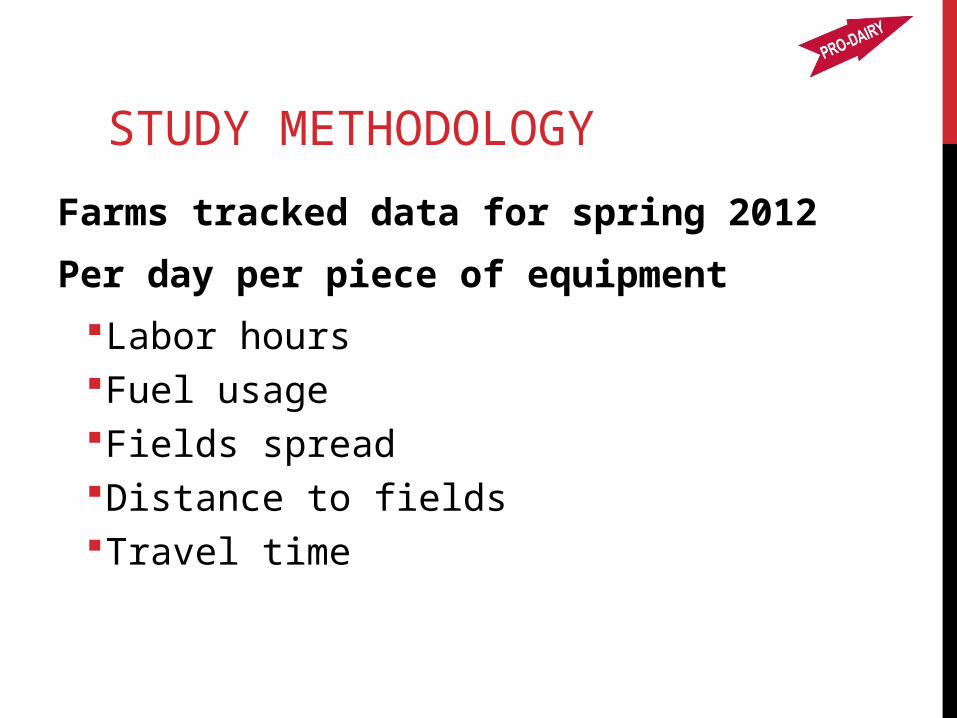
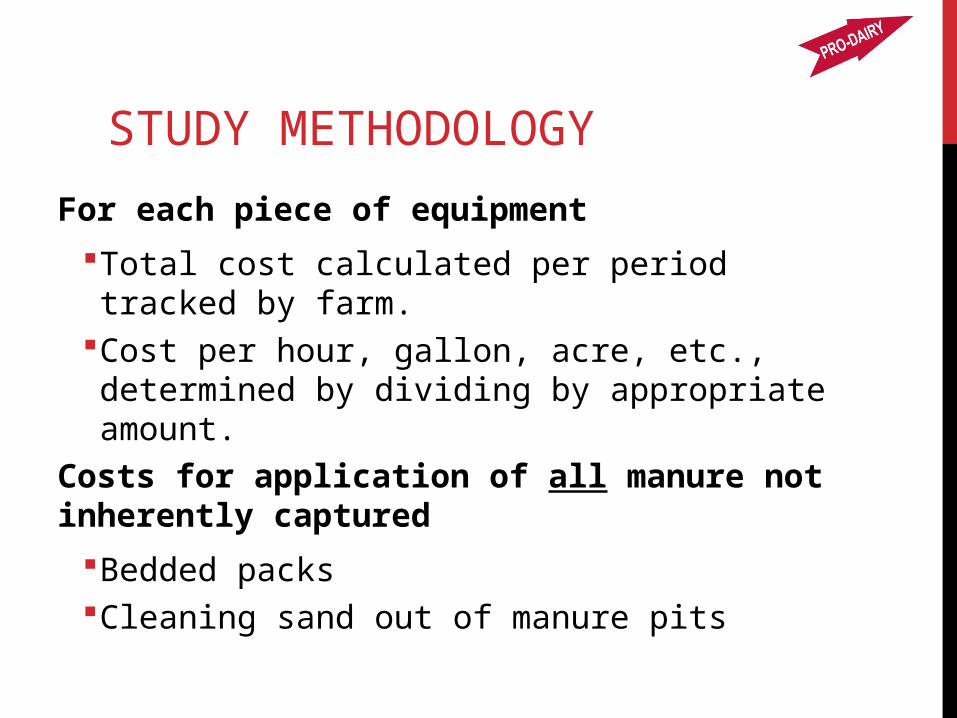
STUDY METHODOLOGY
Farms tracked data for spring 2012
Per day per piece of equipment
Labor hoursFuel usageFields spreadDistance to fieldsTravel time
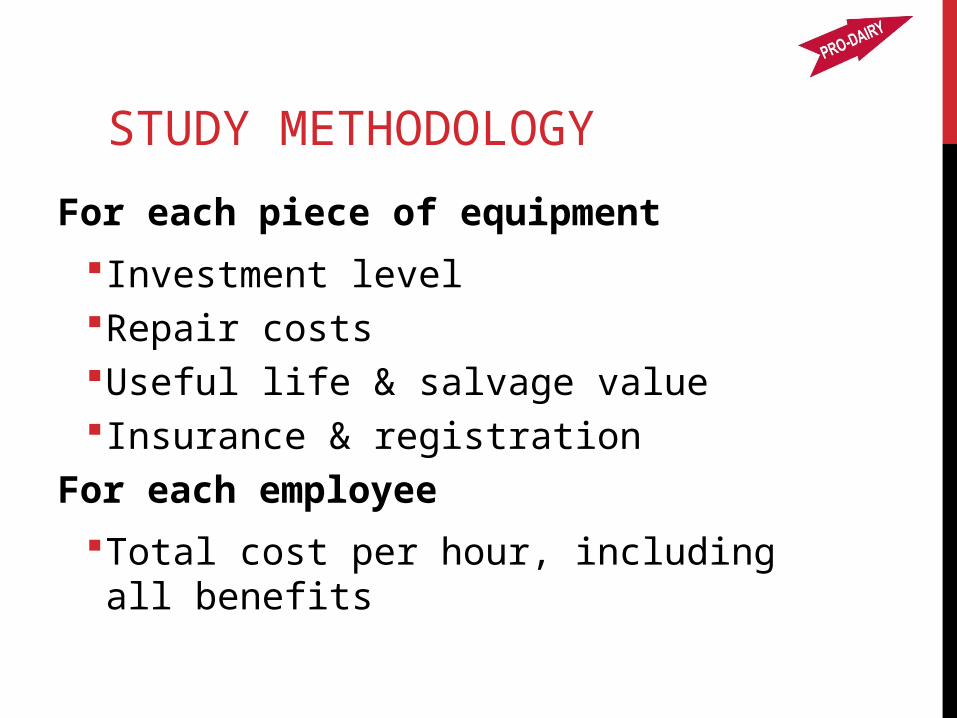
STUDY METHODOLOGY
For each piece of equipment
Investment levelRepair costsUseful life & salvage valueInsurance & registration
For each employee
Total cost per hour, including all benefits
STUDY METHODOLOGY
For each piece of equipment
Total cost calculated per period tracked by farm.
Cost per hour, gallon, acre, etc., determined by dividing by appropriate amount.
Costs for application of all manure not inherently captured
Bedded packsCleaning sand out of manure pits

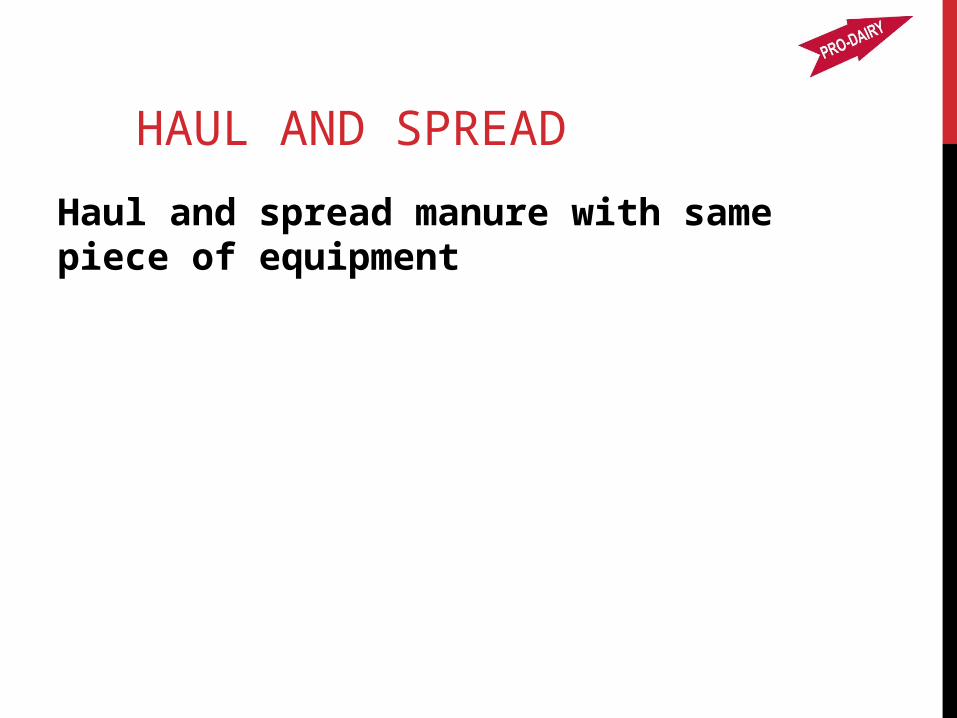
HAUL AND SPREAD
Haul and spread manure with same piece of equipment

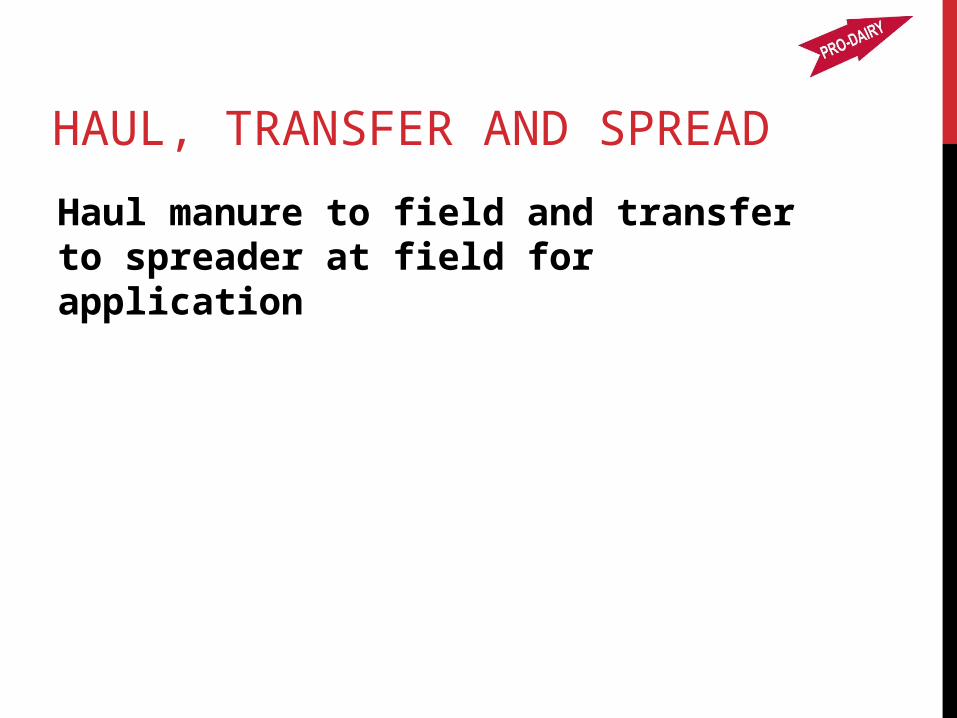
HAUL, TRANSFER AND SPREAD
Haul manure to field and transfer to spreader at field for application

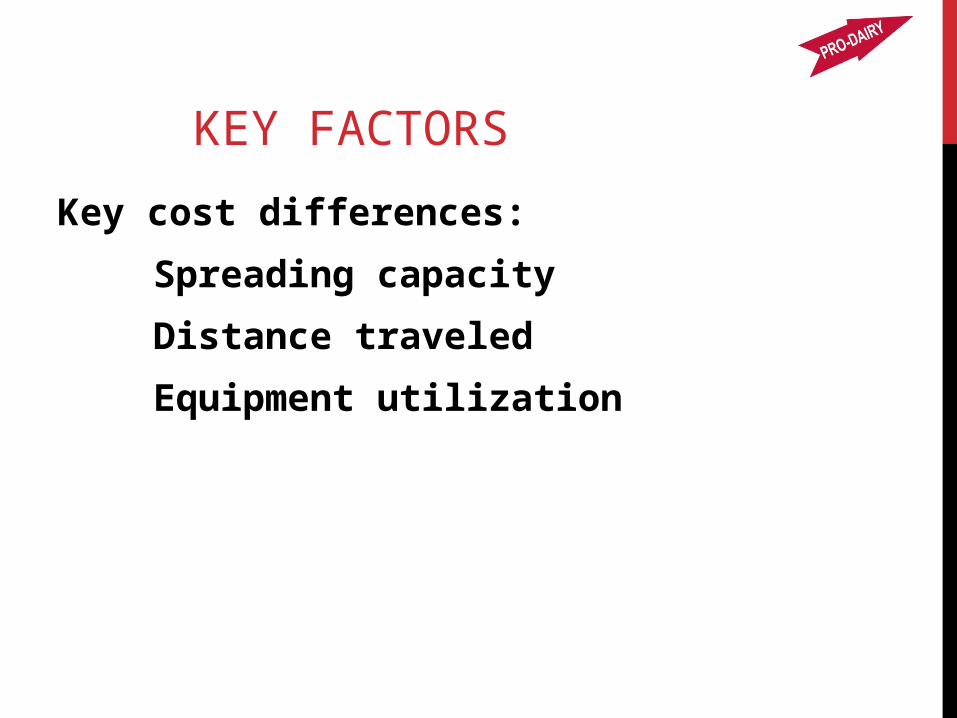
KEY FACTORS
Key cost differences:
Spreading capacity
Distance traveled
Equipment utilization
QUESTIONS ON COST OF MANURE
APPLICATION?

COST OF RAISING DAIRY REPLACEMENTS
PRELIMINARY RESULTS
GOAL OF THE REPLACEMENT PROGRAM
The primary goal of all heifer programs is to raise the highest quality heifer who will maximize profits once she enters the lactating herd. A quality heifer is one carrying no limitations into the dairy herd that would hinder her ability to produce under the farm’s management system. Profits are maximized by obtaining the highest quality heifer at the lowest possible cost.
WHAT IS THE COST OF RAISING REPLACEMENTS?
Hard to know what the “Average” is
Conduct study every 5 years to capture costs on farms
17 farms have completed study
A descriptive study
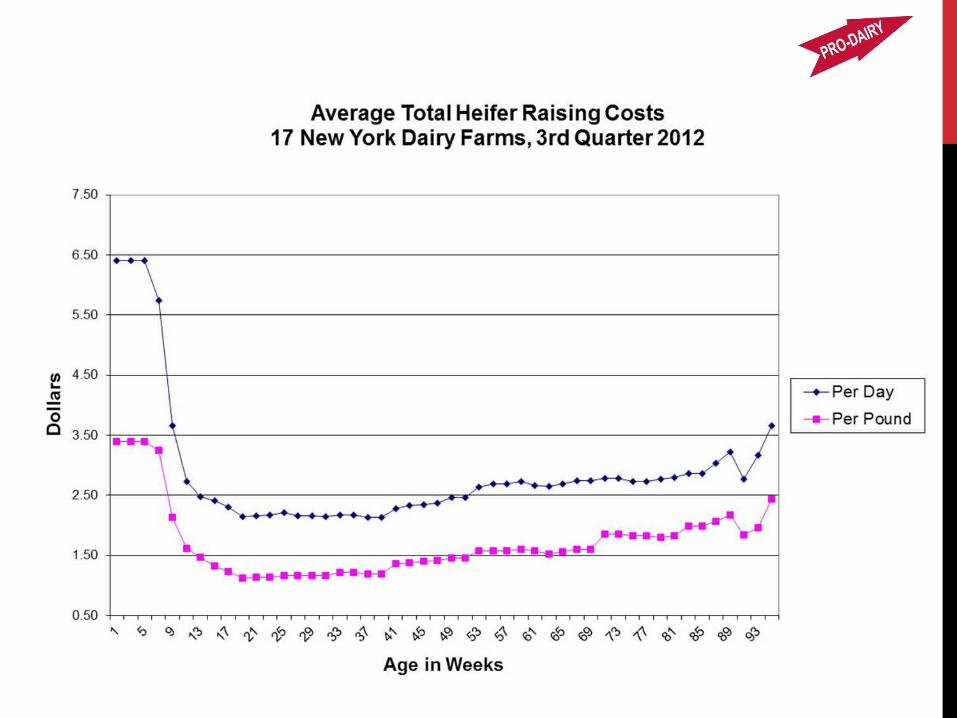
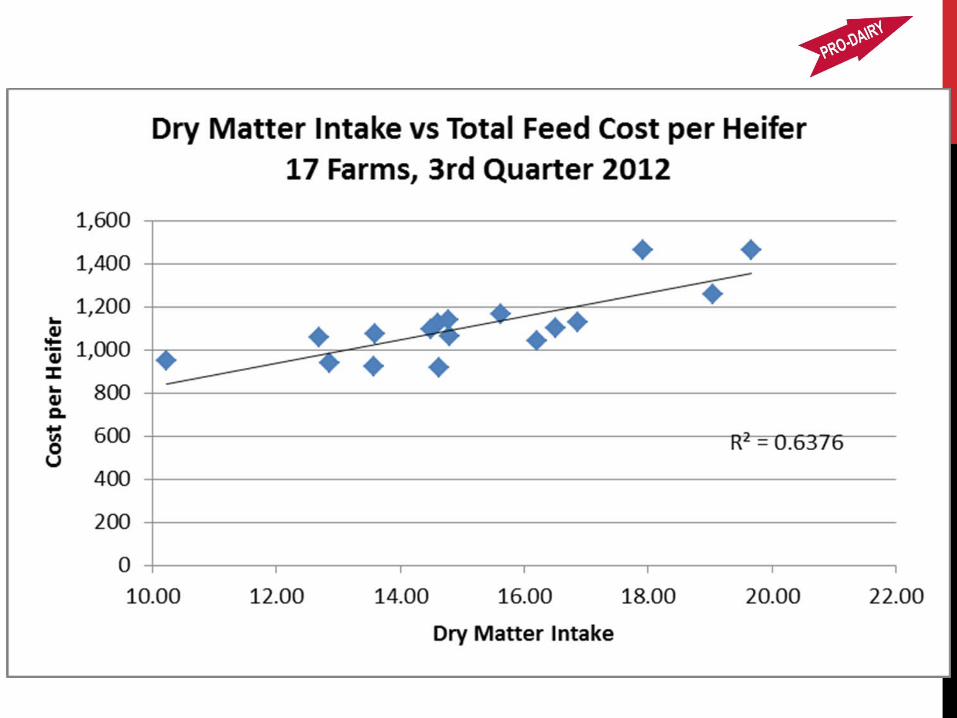
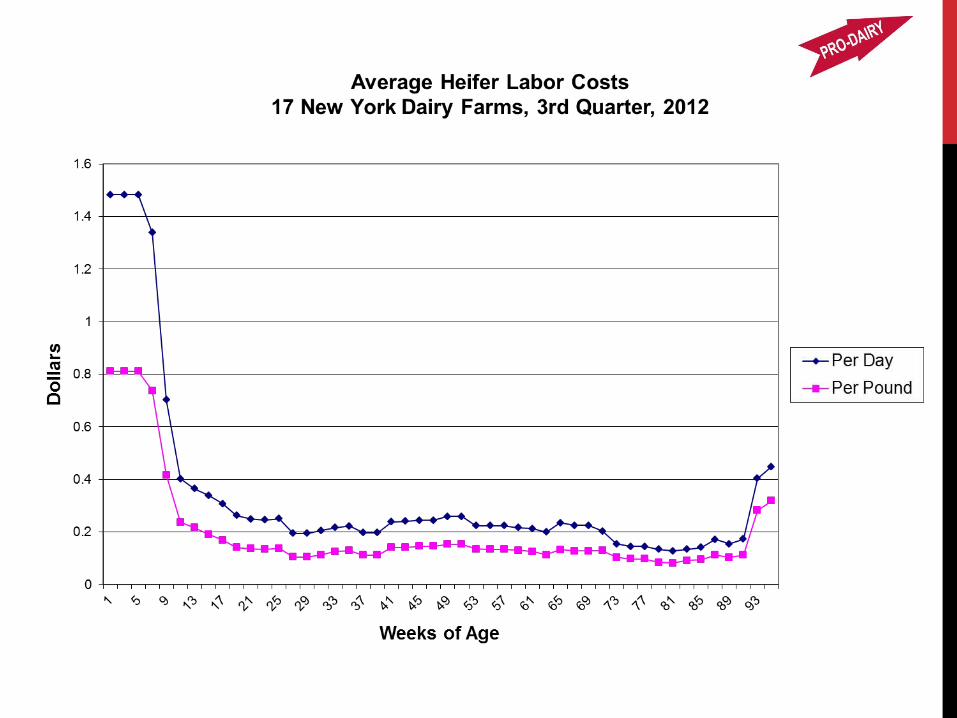
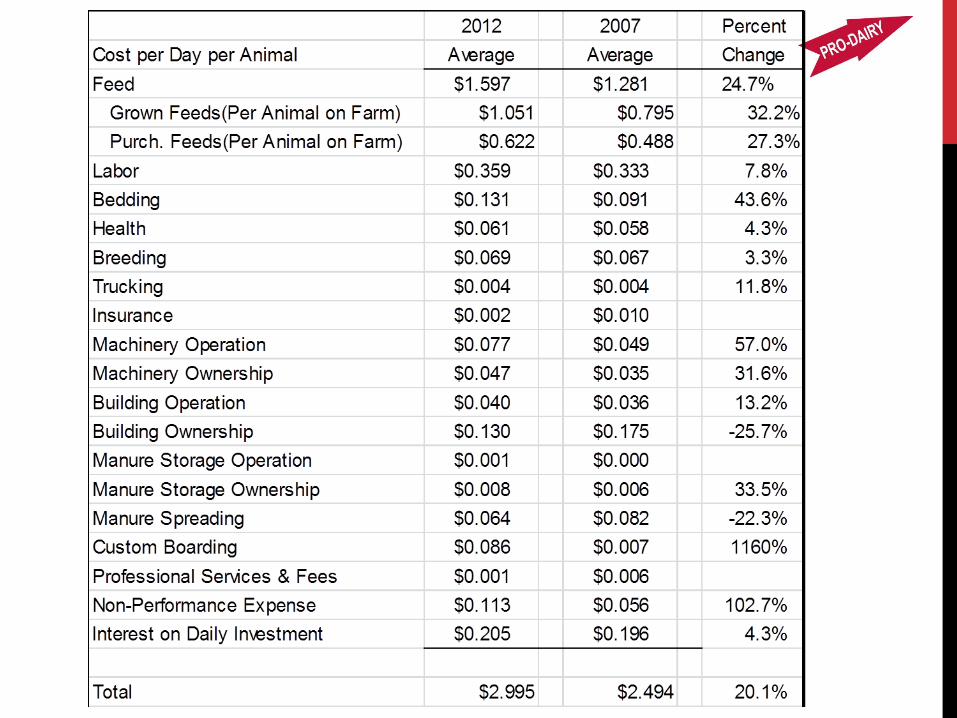
COSTS FROM BIRTH TO CALVING
The following tables represents what the costs were for these 17 farms.
If all input costs and usage levels stayed the same over two years, this is what the cost would be.
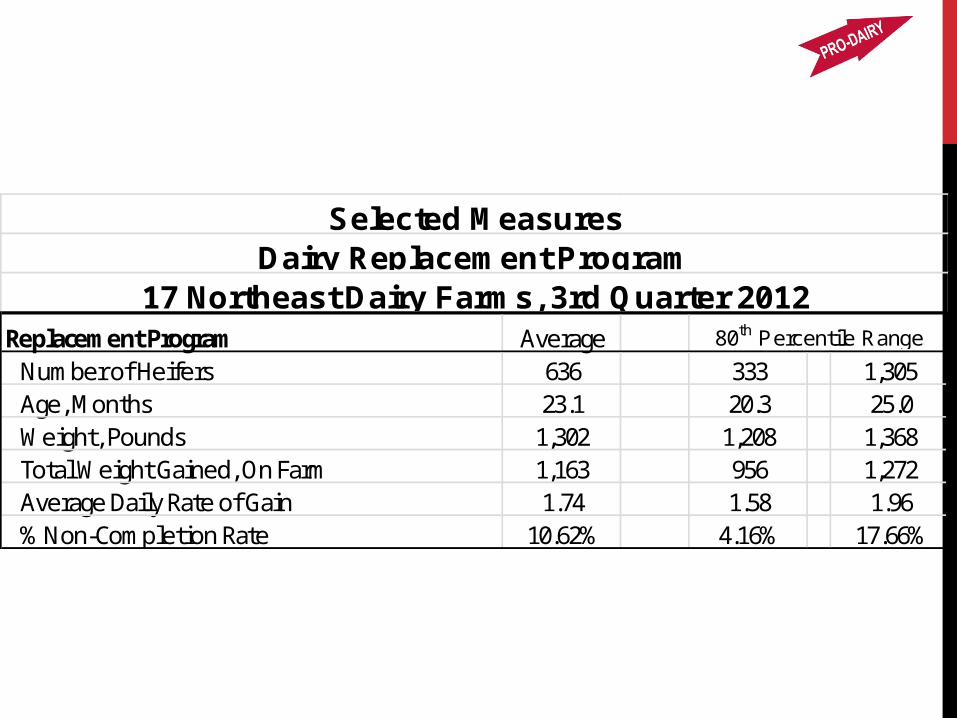
Replacement Program AverageNumber of Heifers 636 333 1,305Age, Months 23.1 20.3 25.0Weight, Pounds 1,302 1,208 1,368Total Weight Gained, On Farm 1,163 956 1,272Average Daily Rate of Gain 1.74 1.58 1.96% Non-Completion Rate 10.62% 4.16% 17.66%
Selected MeasuresDairy Replacement Program
17 Northeast Dairy Farms, 3rd Quarter 201280th Percentile Range
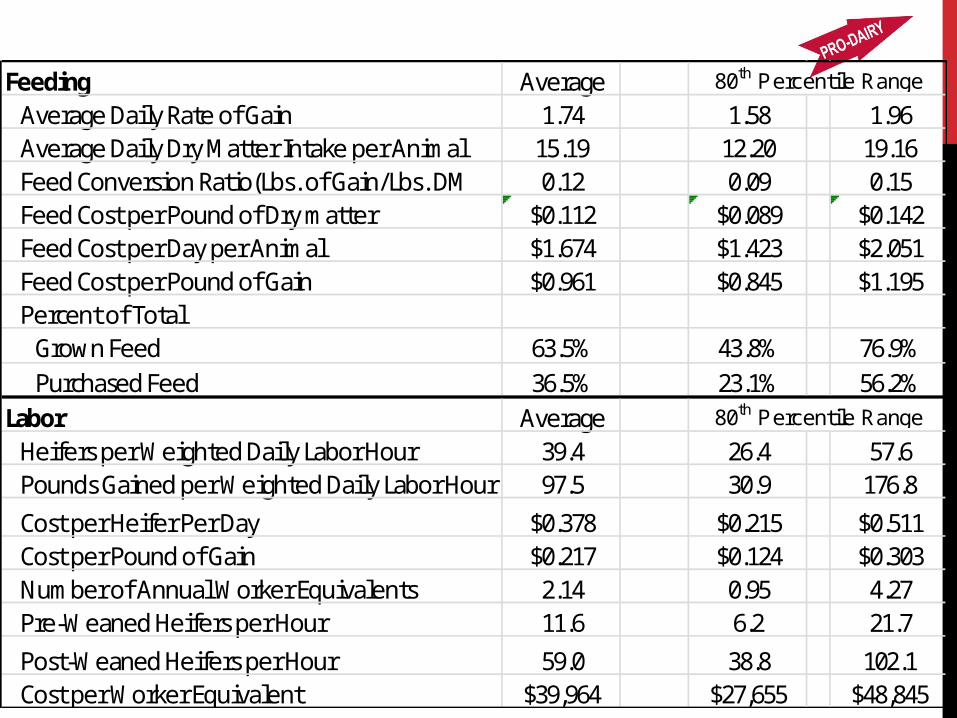
Feeding AverageAverage Daily Rate of Gain 1.74 1.58 1.96Average Daily Dry Matter Intake per Animal 15.19 12.20 19.16Feed Conversion Ratio(Lbs. of Gain/Lbs. DM 0.12 0.09 0.15Feed Cost per Pound of Dry matter $0.112 $0.089 $0.142Feed Cost per Day per Animal $1.674 $1.423 $2.051Feed Cost per Pound of Gain $0.961 $0.845 $1.195Percent of Total
Grown Feed 63.5% 43.8% 76.9%Purchased Feed 36.5% 23.1% 56.2%
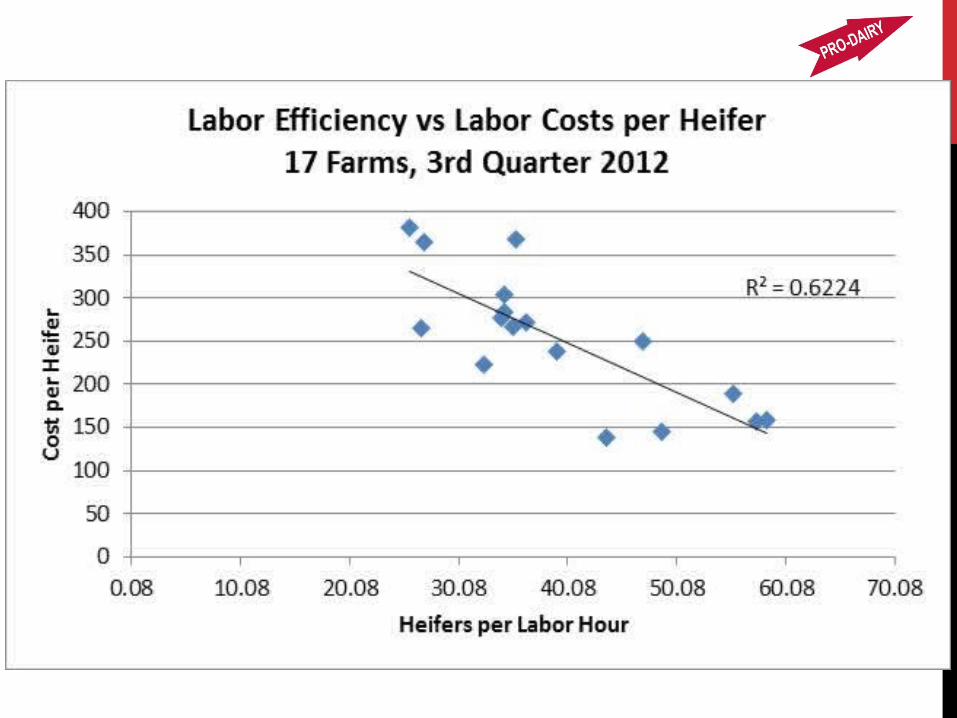
Labor AverageHeifers per Weighted Daily Labor Hour 39.4 26.4 57.6Pounds Gained per Weighted Daily Labor Hour 97.5 30.9 176.8
Cost per Heifer Per Day $0.378 $0.215 $0.511Cost per Pound of Gain $0.217 $0.124 $0.303Number of Annual Worker Equivalents 2.14 0.95 4.27Pre-Weaned Heifers per Hour 11.6 6.2 21.7
Post-Weaned Heifers per Hour 59.0 38.8 102.1Cost per Worker Equivalent $39,964 $27,655 $48,845
80th Percentile Range
80th Percentile Range
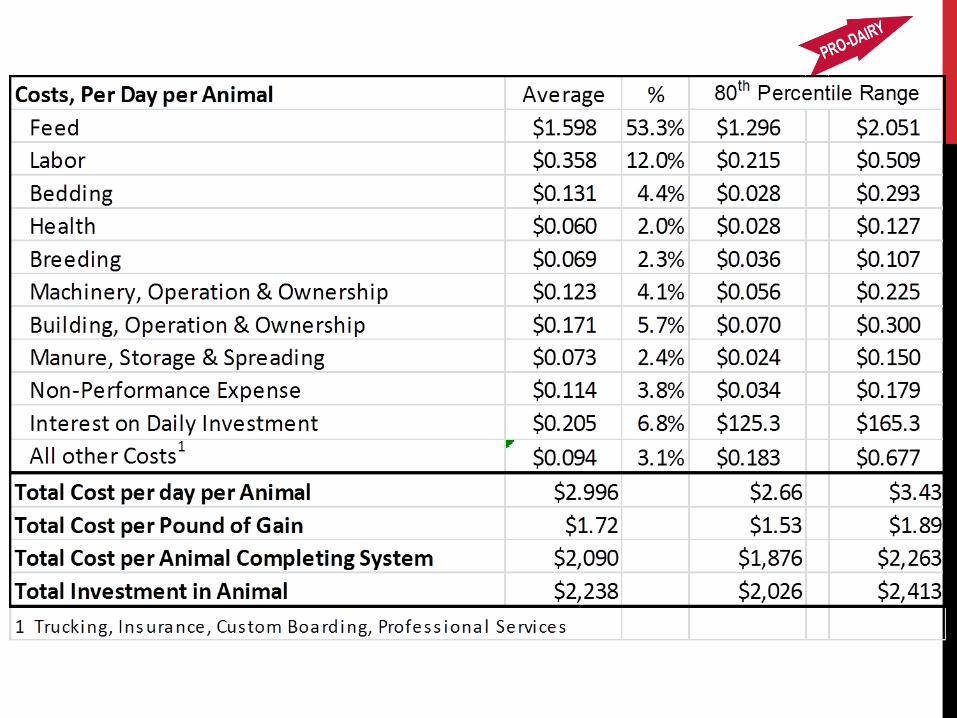


Breakdown of Costs of Raising Heifers by Stage of Growth 17 New York Dairy Farms, 3rd Quarter 2012, New York
Per Pound of Gain Stage of Growth Birth to 200 Lbs 201-700 lbs 701-850 lbs 851-Calving Feed $1.714 $0.678 $0.811 $1.122 Labor 0.805 .140 0.125 0.230 All Other Costs 0.610 .415 0.571 0.857 Total $3.128 $1.233 $1.507 $2.209 By Total Raising Cost Stage of Growth Birth to 200 Lbs 201-700 lbs 701-850 lbs 851-Calving Feed $188.5 $339.0 $121.7 $538.2 Labor 88.5 69.9 18.8 108.9 All Other Costs 67.1 207.4 85.6 405.7 Total $344.1 $616.3 $226.1 $1,053.1 % of Total Cost 15.4% 27.5% 10.1% 47.0% % of Total Growth 8% 38% 12% 35%

QUESTIONS ON REPLACEMENT COST
STUDY?