

11
Data Mining inData Mining inPharmacovigilencePharmacovigilence
Aimin Feng, David Madigan, and Ivan Zorych
http://stat.rutgers.edu/~madigan

22
OverviewOverview
Intro. to Post-marketing SurveillanceIntro. to Post-marketing Surveillance
SRS DatabasesSRS Databases
Existing Analysis MethodsExisting Analysis Methods
Our ApproachesOur Approaches Bayesian Logistic RegressionBayesian Logistic Regression
Propensity ScorePropensity Score
ConclusionsConclusions
33
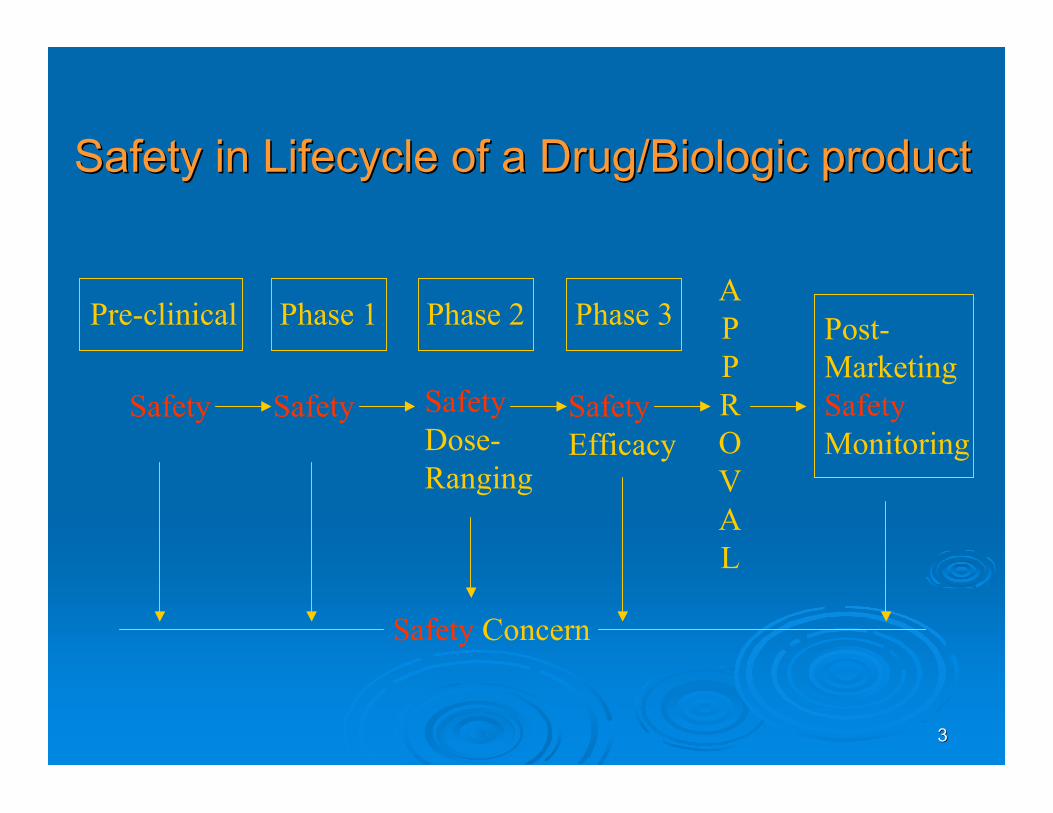
Safety in Lifecycle of a Drug/Biologic productSafety in Lifecycle of a Drug/Biologic product
Phase 1 Phase 2Pre-clinical Phase 3APPROVAL
Safety SafetyEfficacy
SafetyDose-Ranging
Safety
Safety Concern
Post-MarketingSafetyMonitoring

44
Why Post-marketing SurveillanceWhy Post-marketing Surveillance
Limitations on pre-licensure trialsLimitations on pre-licensure trials SizeSize DurationDuration Patient population: age, Patient population: age, comorbiditycomorbidity, severity, severity
FactFact Several hundred drugs have been removedSeveral hundred drugs have been removed
from market in the last 30 years due to safetyfrom market in the last 30 years due to safetyproblems which became known after approvalproblems which became known after approval
55
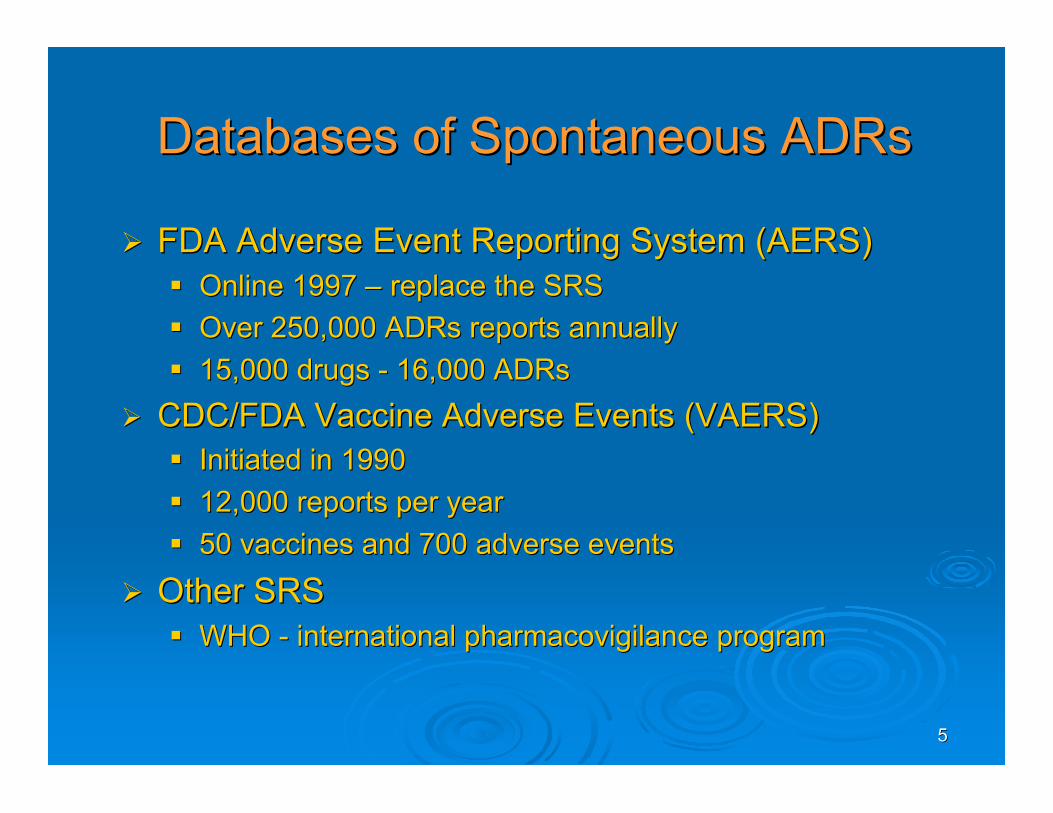
Databases of Spontaneous Databases of Spontaneous ADRsADRs
FDA Adverse Event Reporting System (AERS)FDA Adverse Event Reporting System (AERS) Online 1997 Online 1997 –– replace the SRS replace the SRS Over 250,000 Over 250,000 ADRsADRs reports annually reports annually 15,000 drugs - 16,000 15,000 drugs - 16,000 ADRsADRs
CDC/FDA Vaccine Adverse Events (VAERS)CDC/FDA Vaccine Adverse Events (VAERS) Initiated in 1990Initiated in 1990 12,000 reports per year12,000 reports per year 50 vaccines and 700 adverse events50 vaccines and 700 adverse events
Other SRSOther SRS WHO - international WHO - international pharmacovigilancepharmacovigilance program program
66
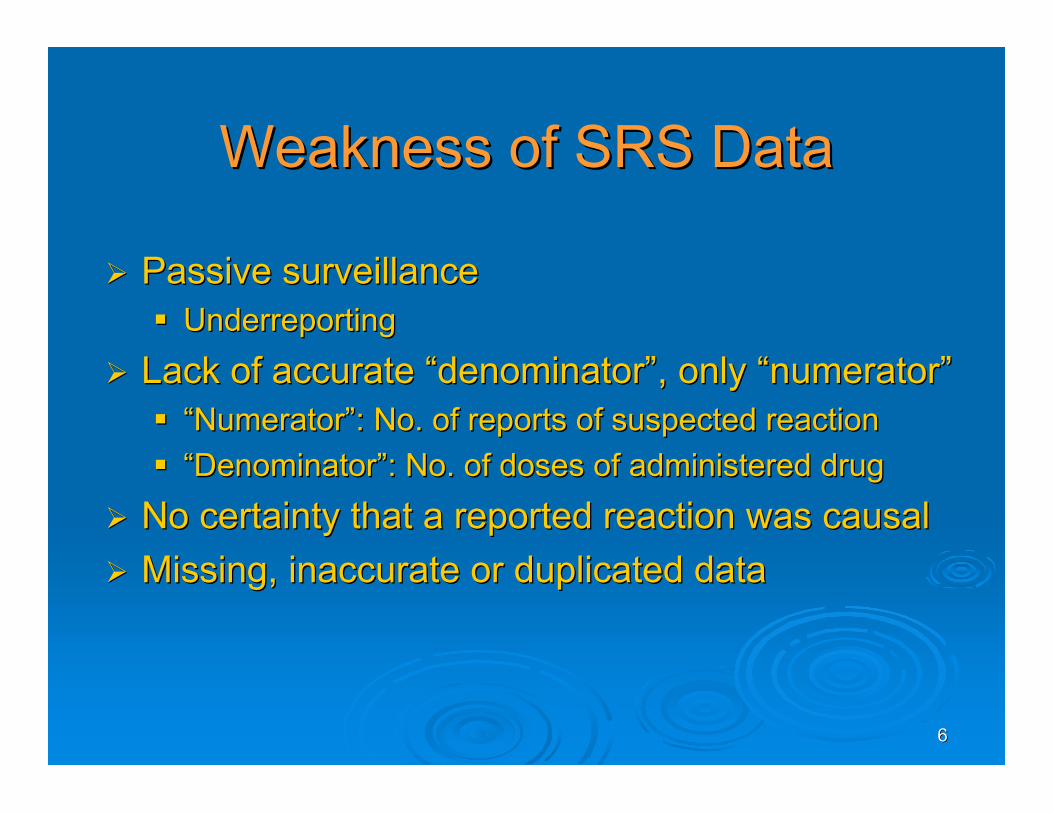
Weakness of SRS DataWeakness of SRS Data
Passive surveillancePassive surveillance UnderreportingUnderreporting
Lack of accurate Lack of accurate ““denominatordenominator””, only , only ““numeratornumerator”” ““NumeratorNumerator””: No. of reports of suspected reaction: No. of reports of suspected reaction ““DenominatorDenominator””: No. of doses of administered drug: No. of doses of administered drug
No certainty that a reported reaction was causalNo certainty that a reported reaction was causal Missing, inaccurate or duplicated dataMissing, inaccurate or duplicated data
77
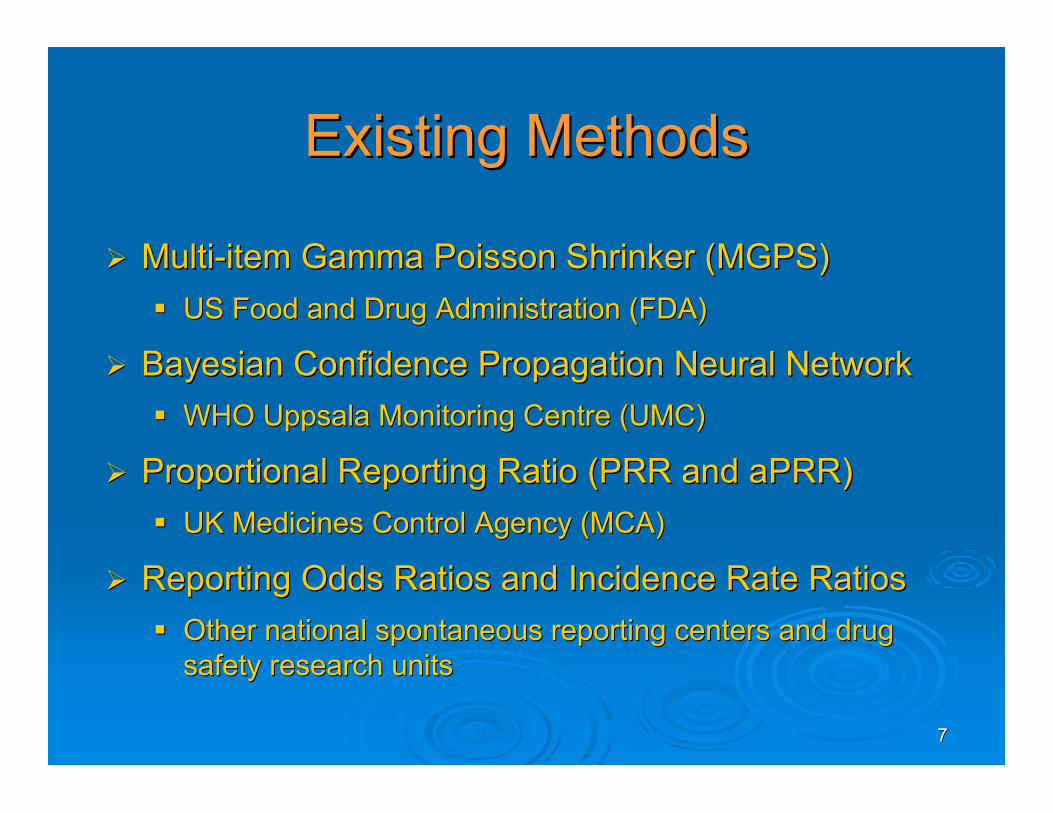
Existing MethodsExisting Methods
Multi-item Gamma Poisson Multi-item Gamma Poisson Shrinker Shrinker (MGPS)(MGPS) US Food and Drug Administration (FDA)US Food and Drug Administration (FDA)
Bayesian Confidence Propagation Neural NetworkBayesian Confidence Propagation Neural Network WHO Uppsala Monitoring Centre (UMC)WHO Uppsala Monitoring Centre (UMC)
Proportional Reporting Ratio (PRR and Proportional Reporting Ratio (PRR and aPRRaPRR)) UK Medicines Control Agency (MCA)UK Medicines Control Agency (MCA)
Reporting Odds Ratios and Incidence Rate RatiosReporting Odds Ratios and Incidence Rate Ratios Other national spontaneous reporting centers and drugOther national spontaneous reporting centers and drug
safety research unitssafety research units
88
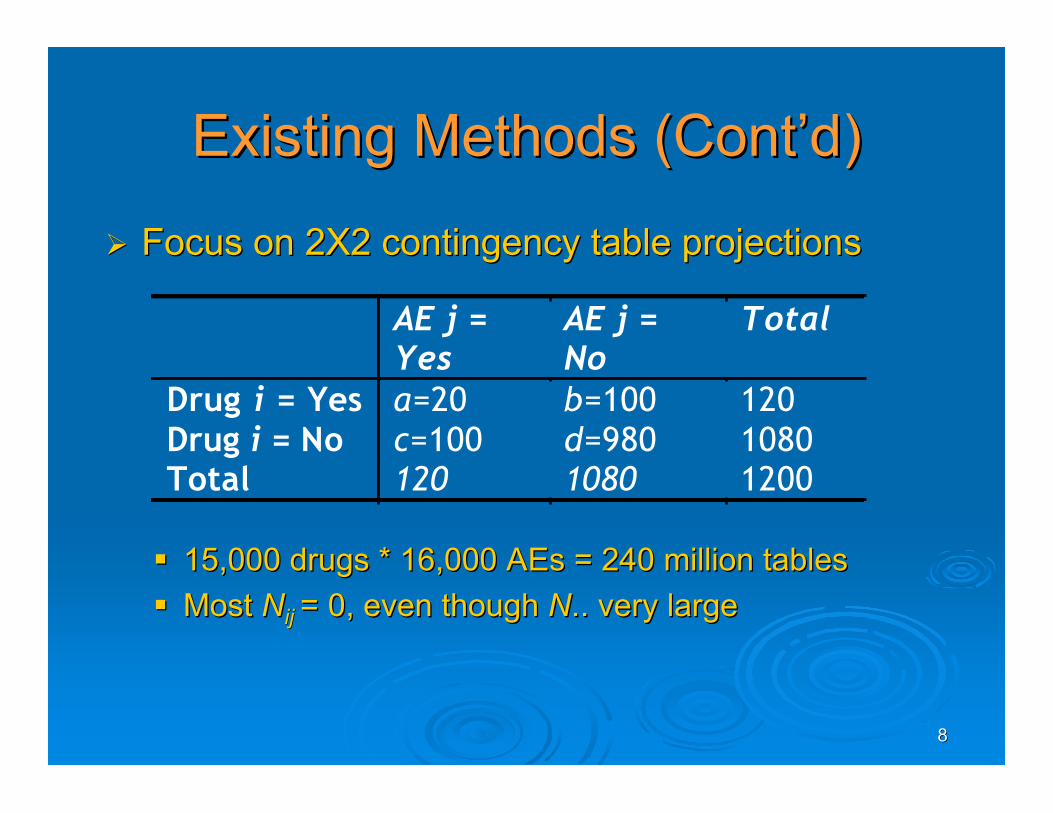
Existing Methods (ContExisting Methods (Cont’’d)d)
Focus on 2X2 contingency table projectionsFocus on 2X2 contingency table projections
15,000 drugs * 16,000 15,000 drugs * 16,000 AEs AEs = 240 million tables= 240 million tables Most Most NNij ij = = 0, even though 0, even though NN.. very large.. very large
AE j = Yes
AE j = No
Total
Drug i = Yes a=20 b=100 120
Drug i = No c=100 d=980 1080
Total 120 1080 1200
99
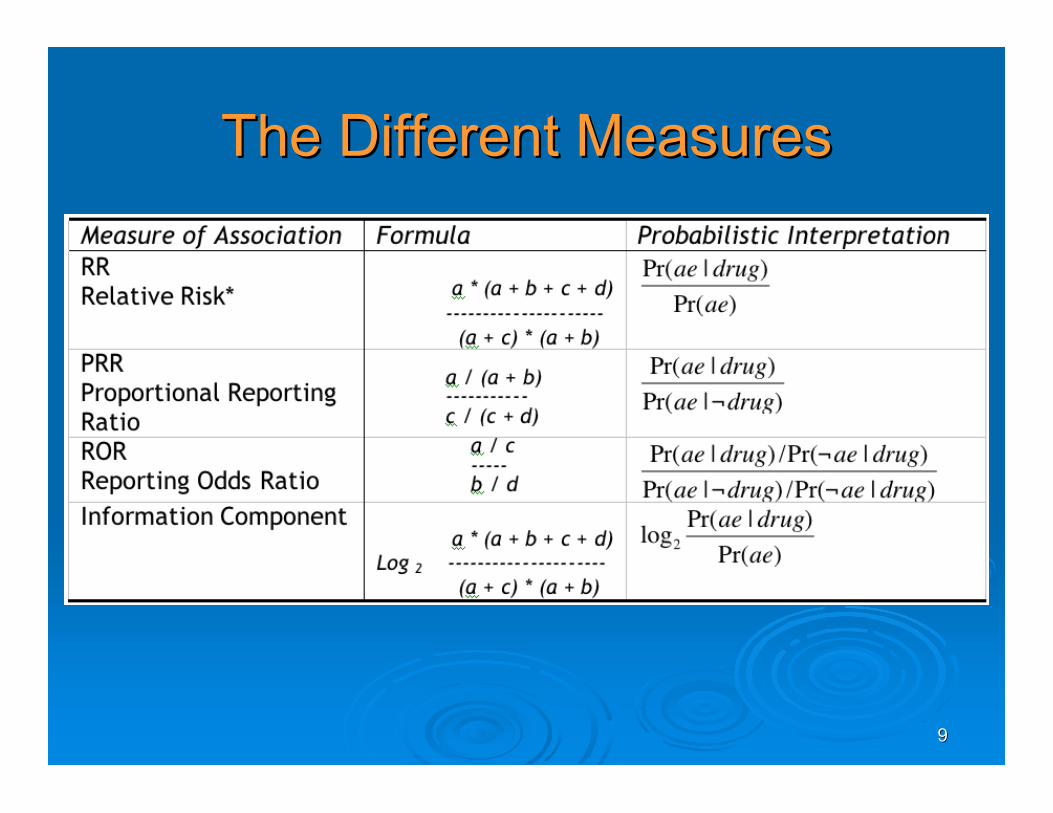
The Different MeasuresThe Different Measures
1010
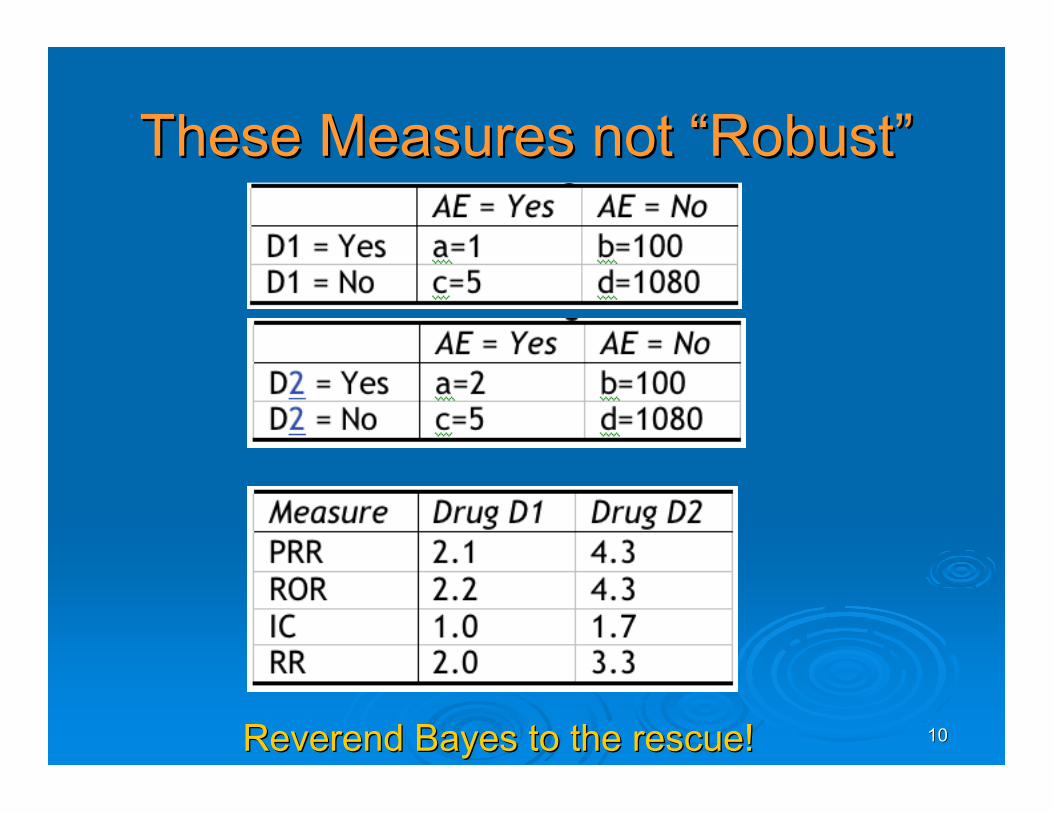
These Measures notThese Measures not ““RobustRobust””
Reverend Reverend Bayes Bayes to the rescue!to the rescue!

1111
Bayesian StatisticsBayesian Statistics
The Bayesian approach has deep historical roots but requiredthe algorithmic developments of the late 1980’s before it wasof any use
The old sterile Bayesian-Frequentist debates are a thing of thepast
Most data analysts take a pragmatic point of view and usewhatever is most useful

1212
Think about thisThink about this……
Denote by θ the probability that the next operation inHospital A results in a death
Use the data to estimate (i.e., guess the value of) θ

1313
Hospital Example (0/27)Hospital Example (0/27)
!
f (" | data) =f (data |") f (")
f (data)# f (data |") f (")
posterior distribution prior distributionlikelihood
!
27
0
"
# $
%
& ' (
0(1)()27
!
c" a(1#")b
!
"# a+0(1$#)b+27

1414
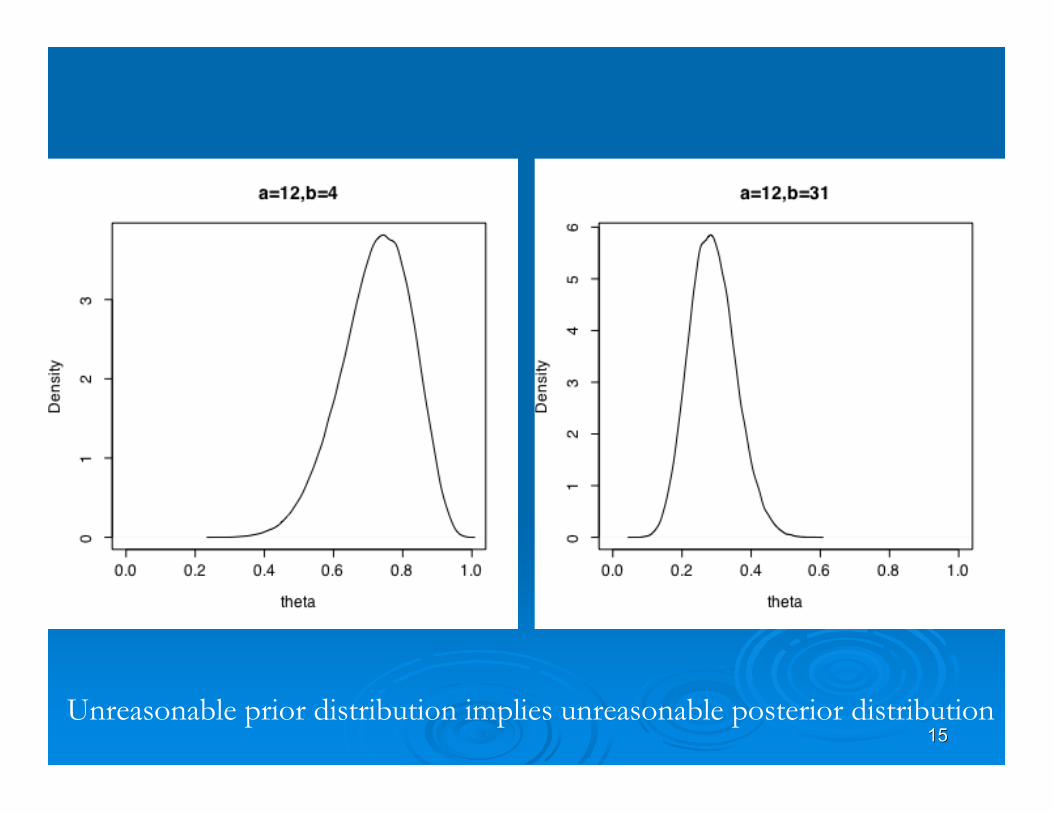
1515Unreasonable prior distribution implies unreasonable posterior distribution
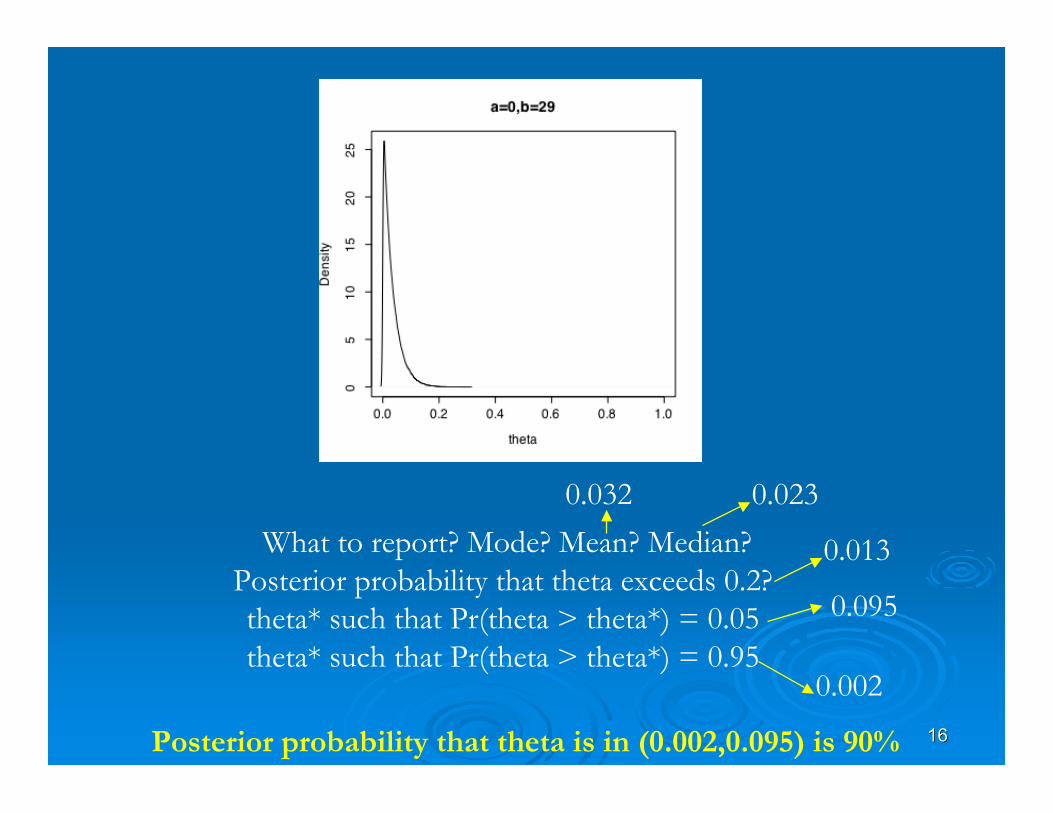
1616
What to report? Mode? Mean? Median?Posterior probability that theta exceeds 0.2?theta* such that Pr(theta > theta*) = 0.05theta* such that Pr(theta > theta*) = 0.95
0.032 0.023
0.013
0.095
0.002
Posterior probability that theta is in (0.002,0.095) is 90%
1717
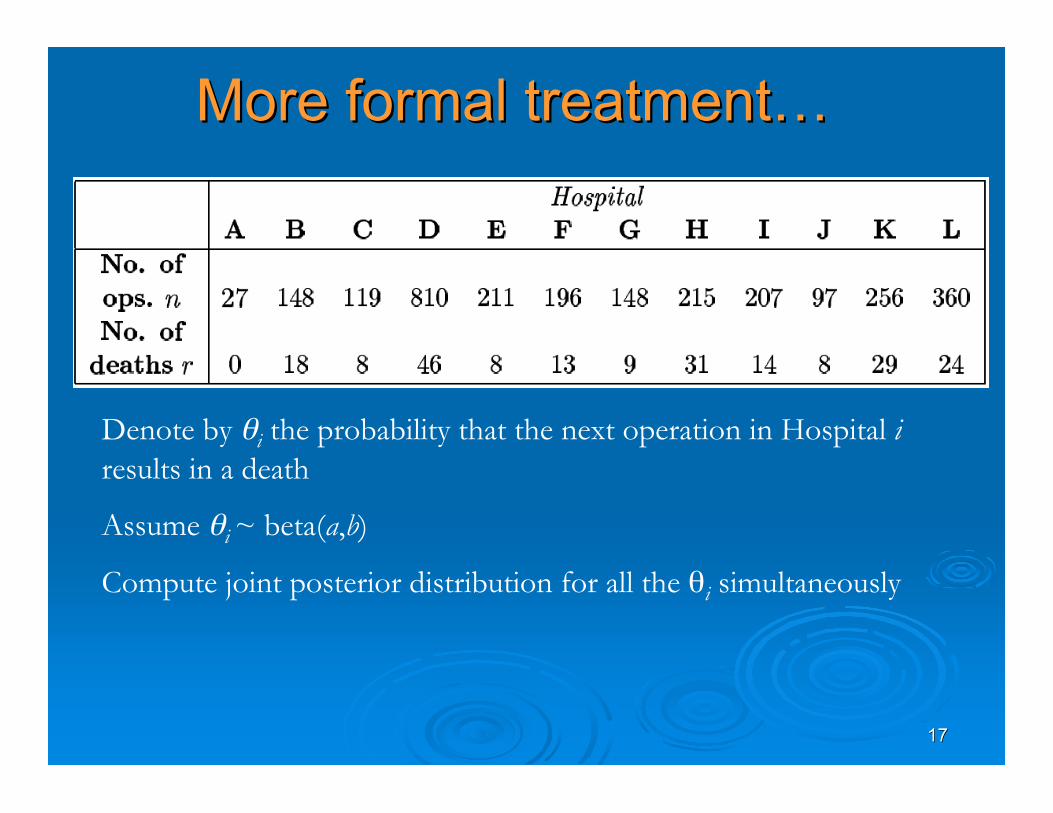
More formal treatmentMore formal treatment……
Denote by θi the probability that the next operation in Hospital iresults in a death
Assume θi ~ beta(a,b)
Compute joint posterior distribution for all the θi simultaneously
!
1818
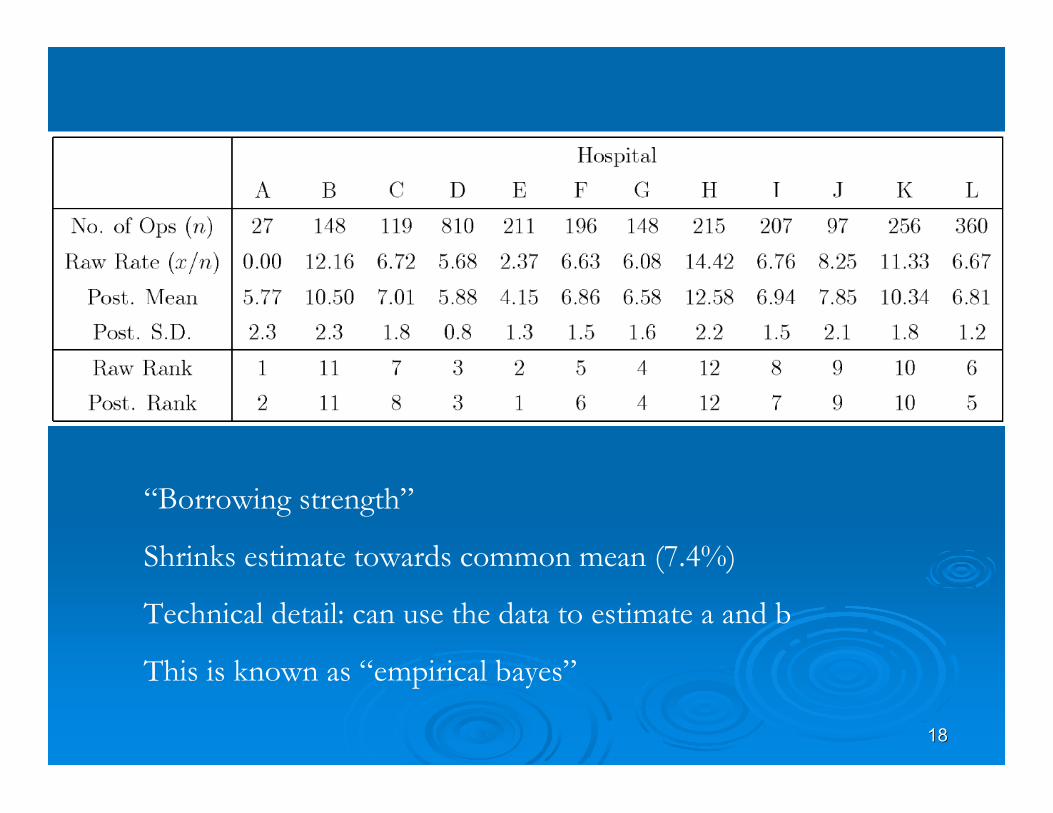
“Borrowing strength”
Shrinks estimate towards common mean (7.4%)
Technical detail: can use the data to estimate a and b
This is known as “empirical bayes”
1919
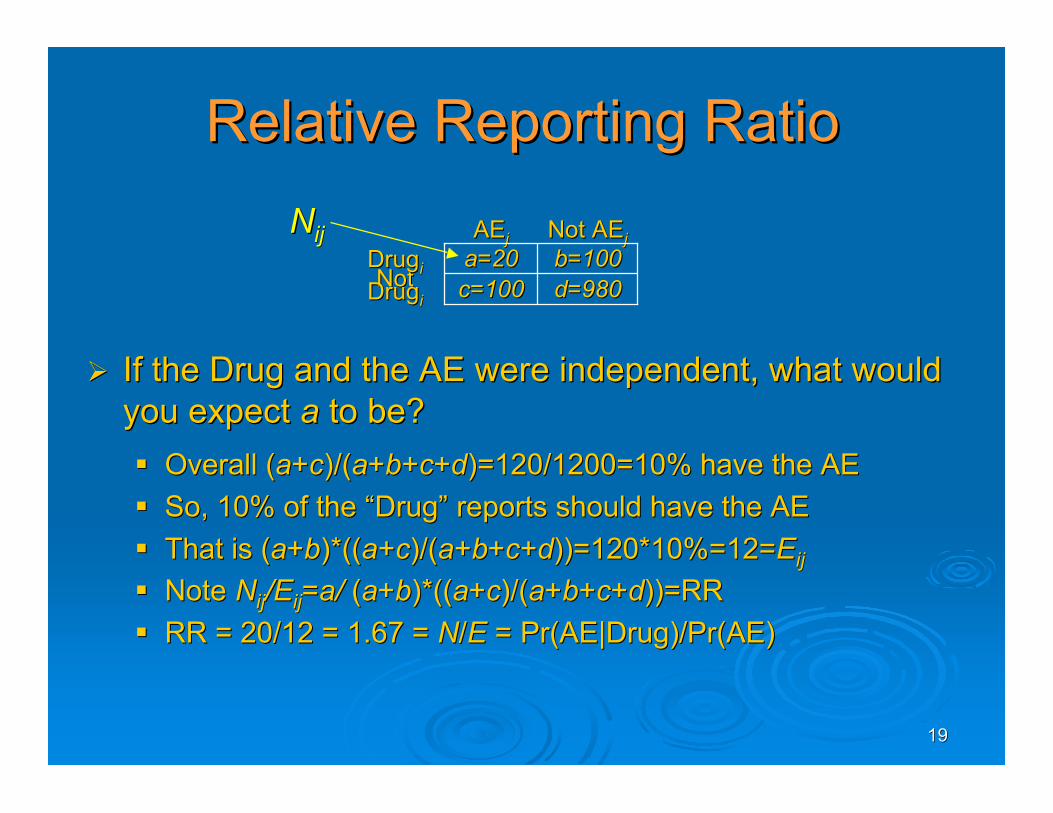
Relative Reporting RatioRelative Reporting Ratio
If the Drug and the AE were independent, what wouldIf the Drug and the AE were independent, what wouldyou expectyou expect aa to be? to be? Overall (Overall (aa++cc)/()/(aa++bb++cc++dd)=120/1200=10% have the AE)=120/1200=10% have the AE So, 10% of the So, 10% of the ““DrugDrug”” reports should have the AE reports should have the AE That is (That is (aa++bb)*(()*((aa++cc)/()/(aa++bb++cc++dd))=120*10%))=120*10%=12==12=EEijij
NoteNote NNijij/E/Eijij=a/ =a/ ((aa++bb)*(()*((aa++cc)/()/(aa++bb++cc++dd))=RR))=RR RR = 20/12 = 1.67 = RR = 20/12 = 1.67 = NN//E E = Pr(AE|Drug)/Pr(AE)= Pr(AE|Drug)/Pr(AE)
d=980d=980c=100c=100NotNotDrugDrugii
b=100b=100a=20a=20DrugDrugii
Not Not AEAEjjAEAEjjNNijij
2020
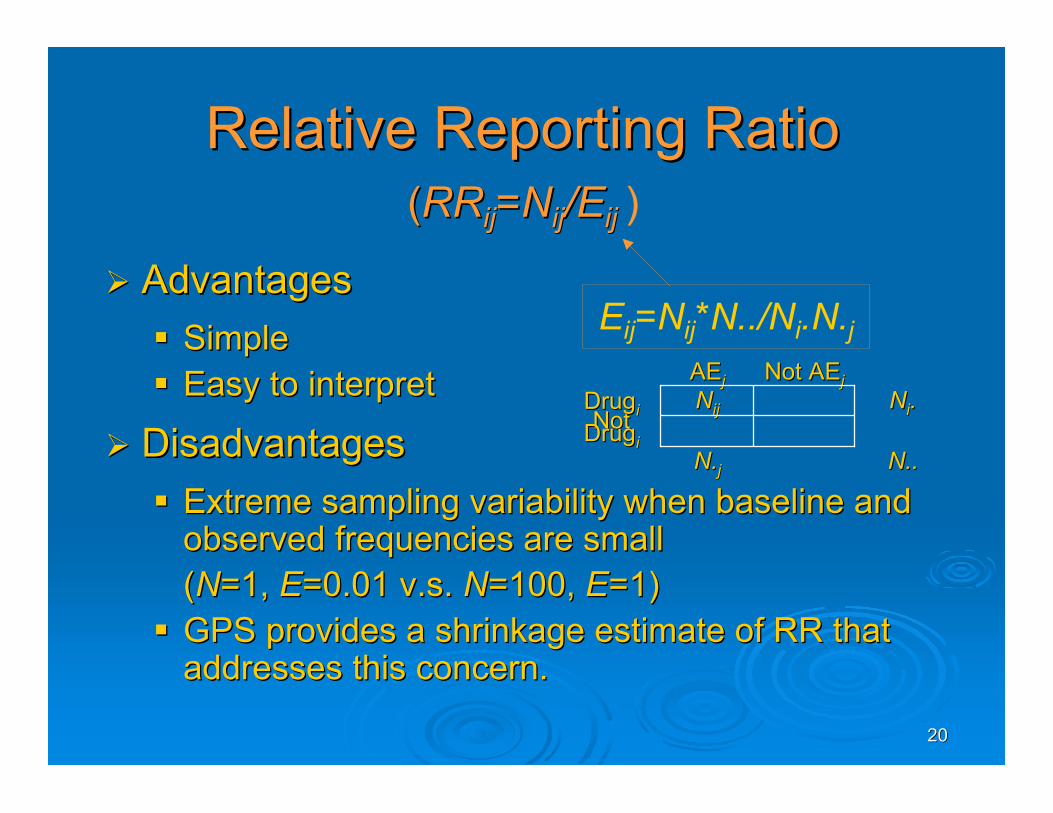
Relative Reporting RatioRelative Reporting Ratio((RRRRijij=N=Nijij/E/Eij ij )
AdvantagesAdvantages SimpleSimple Easy to interpretEasy to interpret
DisadvantagesDisadvantages Extreme sampling variability when baseline andExtreme sampling variability when baseline and
observed frequencies are smallobserved frequencies are small((NN=1, =1, EE=0.01 v.s. =0.01 v.s. NN=100, =100, EE=1)=1)
GPS provides a shrinkage estimate of RR thatGPS provides a shrinkage estimate of RR thataddresses this concern.addresses this concern.
Eij=Nij*N../Ni.N.j
N..N..N.N.jj
NotNotDrugDrugii
NNii..NNijijDrugDrugii
Not Not AEAEjjAEAEjj
2121
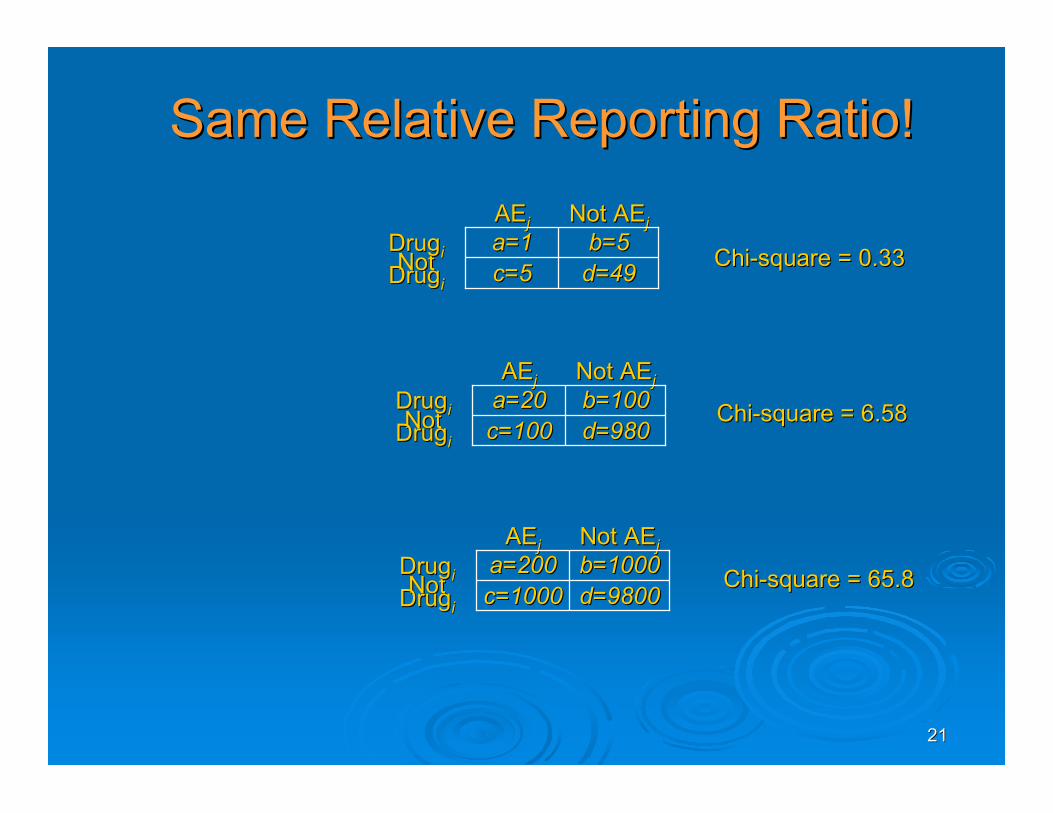
d=49d=49c=5c=5NotNotDrugDrugii
b=5b=5a=1a=1DrugDrugii
Not Not AEAEjjAEAEjj
d=980d=980c=100c=100NotNotDrugDrugii
b=100b=100a=20a=20DrugDrugii
Not Not AEAEjjAEAEjj
d=9800d=9800c=1000c=1000NotNotDrugDrugii
b=1000b=1000a=200a=200DrugDrugii
Not Not AEAEjjAEAEjj
Same Relative Reporting Ratio!Same Relative Reporting Ratio!
Chi-square = 0.33Chi-square = 0.33
Chi-square = 6.58Chi-square = 6.58
Chi-square = 65.8Chi-square = 65.8
2222
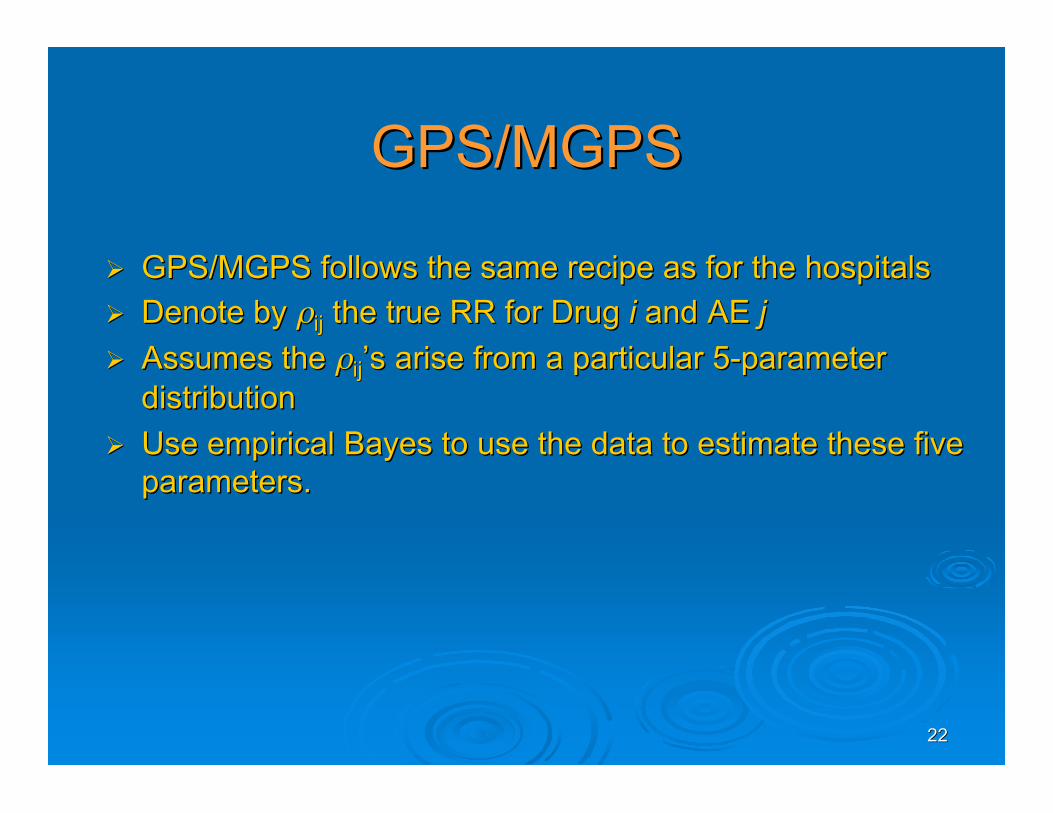
GPS/MGPSGPS/MGPS
GPS/MGPSGPS/MGPS follows the same recipe as for the hospitalsfollows the same recipe as for the hospitals Denote by Denote by ρρijij the true RR for Drug the true RR for Drug ii and and AE AE jj Assumes the Assumes the ρρijij’’ss arise from aarise from a particular 5-parameterparticular 5-parameter
distributiondistribution Use empiricalUse empirical Bayes Bayes toto use the data to estimate these fiveuse the data to estimate these five
parameters.parameters.
2323
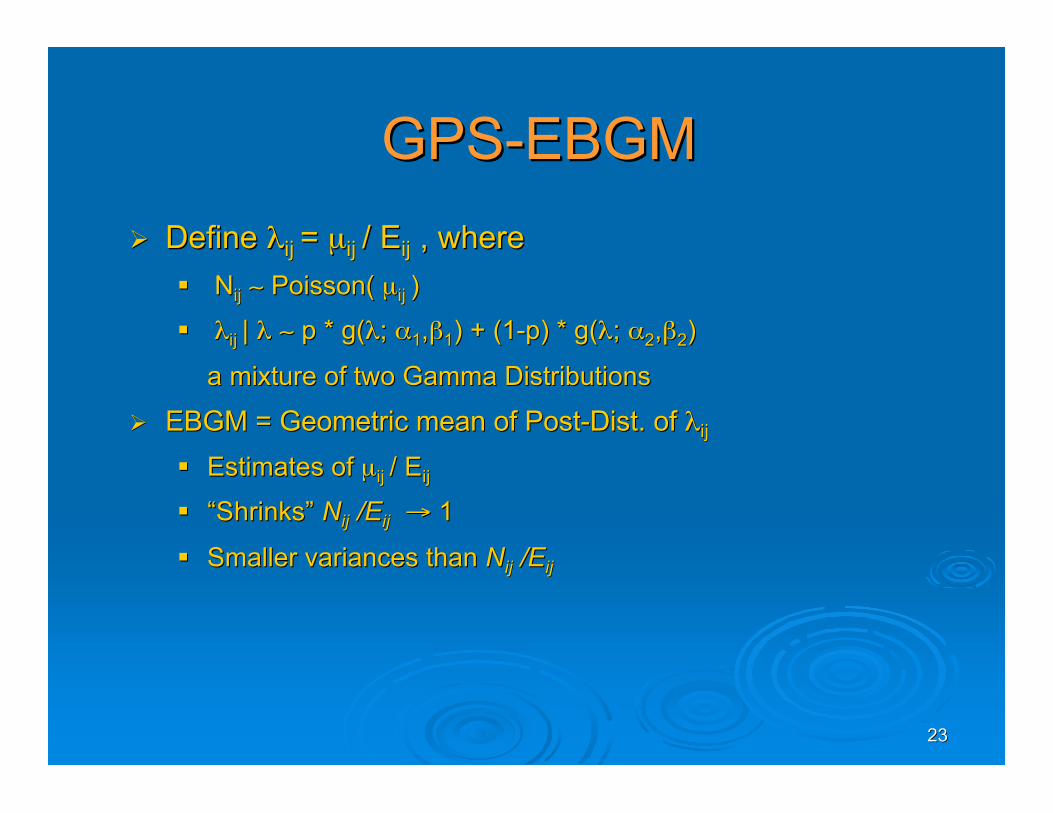
GPS-EBGMGPS-EBGM Define Define λλij ij = = µµij ij / / EEijij , where, where
NNijij ∼∼ Poisson( Poisson( µµij ij ))
λλij ij || λλ ∼∼ p * g( p * g(λλ; ; αα11,,ββ11) + (1-p) * g() + (1-p) * g(λλ; ; αα22,,ββ22))
a mixture of two Gamma Distributionsa mixture of two Gamma Distributions
EBGM = Geometric mean of Post-Dist. of EBGM = Geometric mean of Post-Dist. of λλijij
Estimates of Estimates of µµij ij / / EEijij
““ShrinksShrinks”” NNijij /E /Eijij →→ 1 1
Smaller variances than Smaller variances than NNijij /E /Eijij

2424
log RR
log E
BG
M
0 1 2 3 4 5 6
01
23
45
6
12351050-100
number of reports
GPS SHRINKAGE – AERS DATA
2525
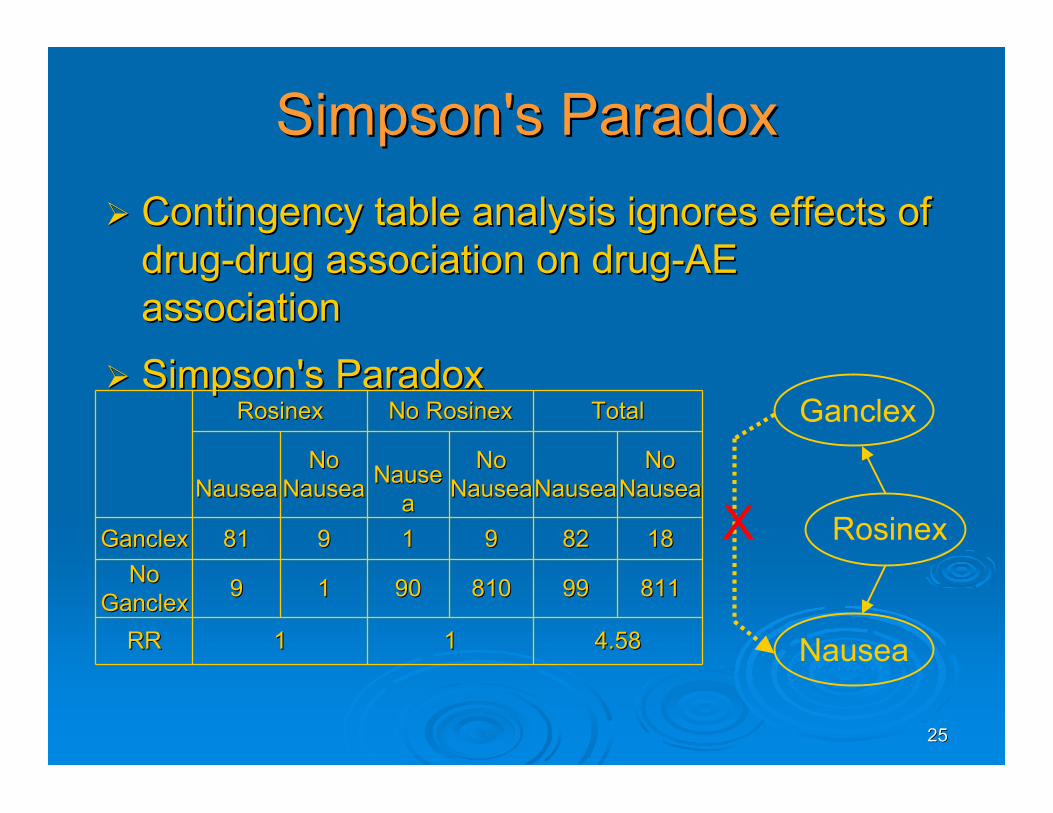
Simpson's ParadoxSimpson's Paradox Contingency table analysis ignores effects ofContingency table analysis ignores effects of
drug-drug association on drug-AEdrug-drug association on drug-AEassociationassociation
Simpson's ParadoxSimpson's Paradox
811811
1818
810810
99
11
99
NoNoNauseaNausea
NoNoNauseaNausea
NoNoNauseaNausea
TotalTotalNo No RosinexRosinexRosinexRosinex
4.584.581111RRRR
9999909099NoNoGanclexGanclex
8282118181GanclexGanclex
NauseaNauseaNauseNauseaaNauseaNausea
Rosinex
Nausea
Ganclex
X
2626
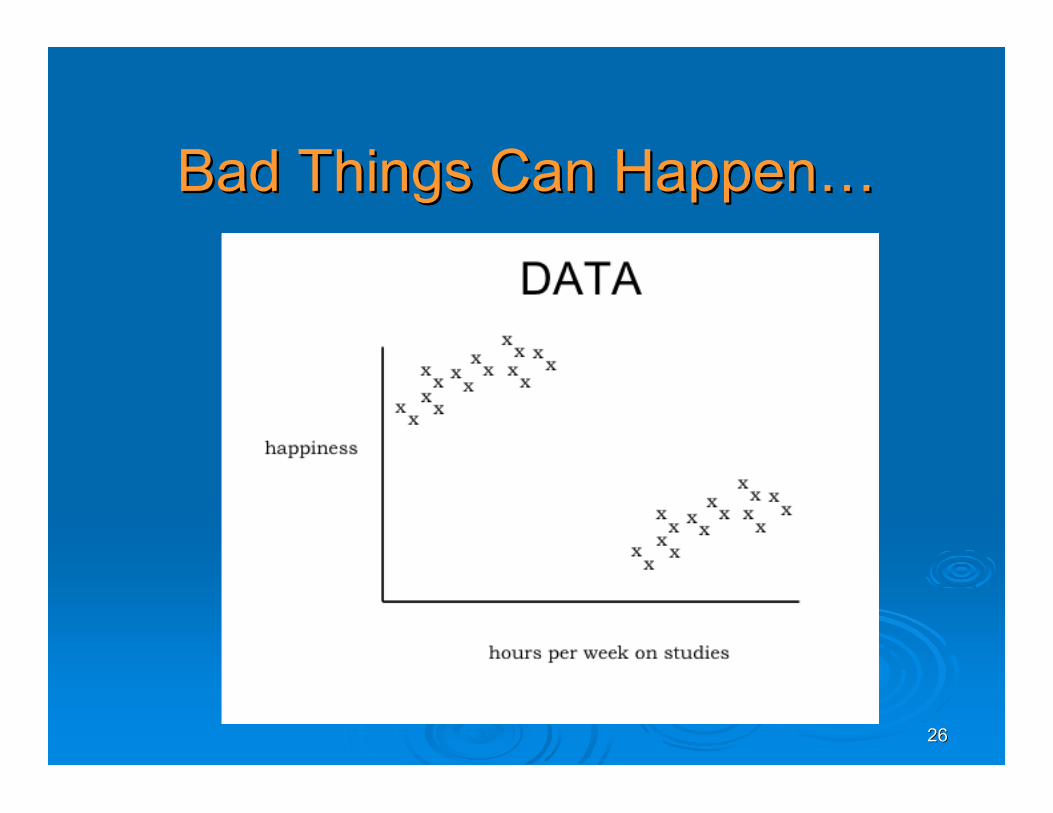
Bad Things Can HappenBad Things Can Happen……

2727
2828

2929
3030

3131
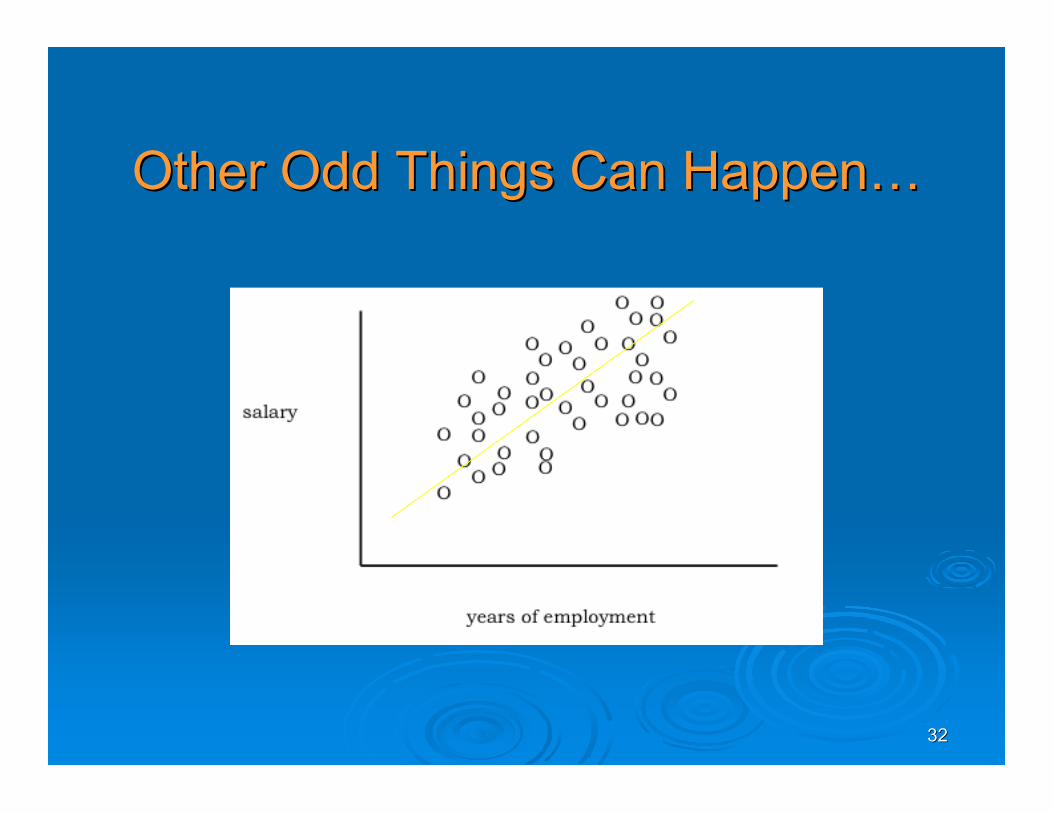
Other Odd Things Can HappenOther Odd Things Can Happen……
3232
Other Odd Things Can HappenOther Odd Things Can Happen……

3333
3434
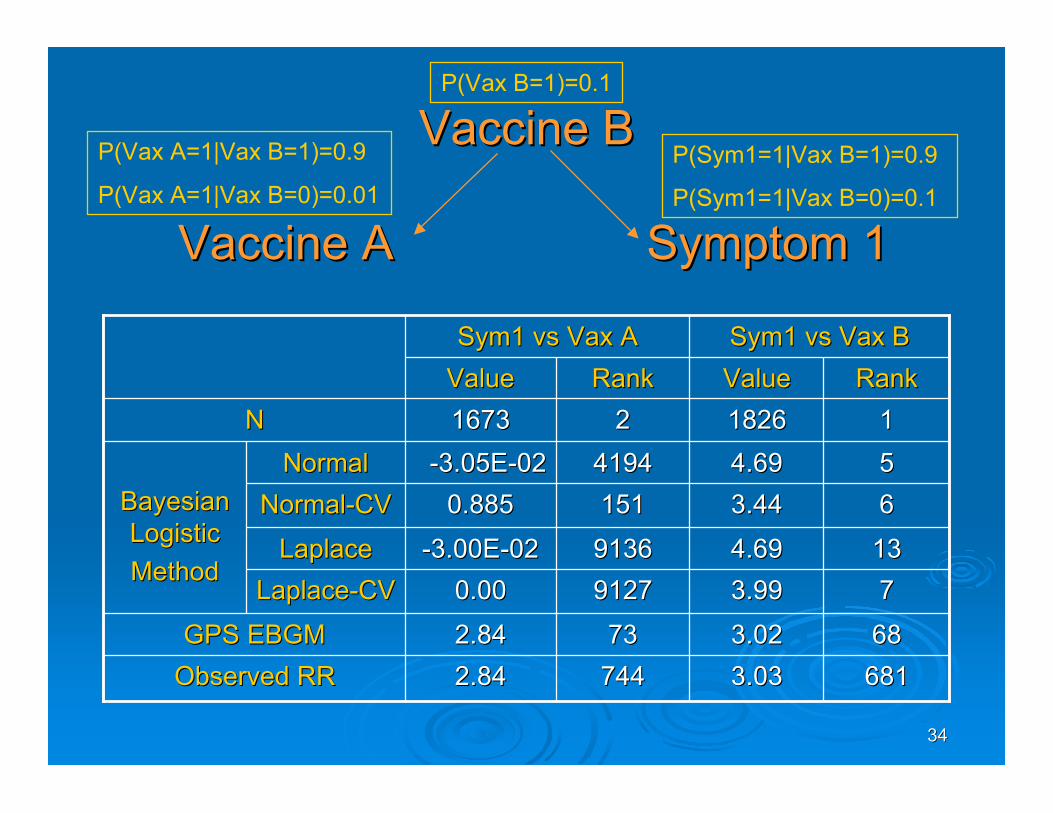
Vaccine BVaccine B
Vaccine A Symptom 1 Vaccine A Symptom 1
6816813.033.037447442.842.84Observed RRObserved RR68683.023.0273732.842.84GPS EBGMGPS EBGM773.993.99912791270.000.00Laplace-CVLaplace-CV13134.694.6991369136-3.00E-02-3.00E-02LaplaceLaplace663.443.441511510.8850.885Normal-CVNormal-CV554.694.6941944194-3.05E-02-3.05E-02NormalNormal
BayesianBayesianLogisticLogisticMethodMethod
11182618262216731673NNRankRankValueValueRankRankValueValue
Sym1 Sym1 vs Vax vs Vax BBSym1 Sym1 vsvs VaxVax A A
P(Vax B=1)=0.1
P(Vax A=1|Vax B=1)=0.9
P(Vax A=1|Vax B=0)=0.01
P(Sym1=1|Vax B=1)=0.9
P(Sym1=1|Vax B=0)=0.1
3535
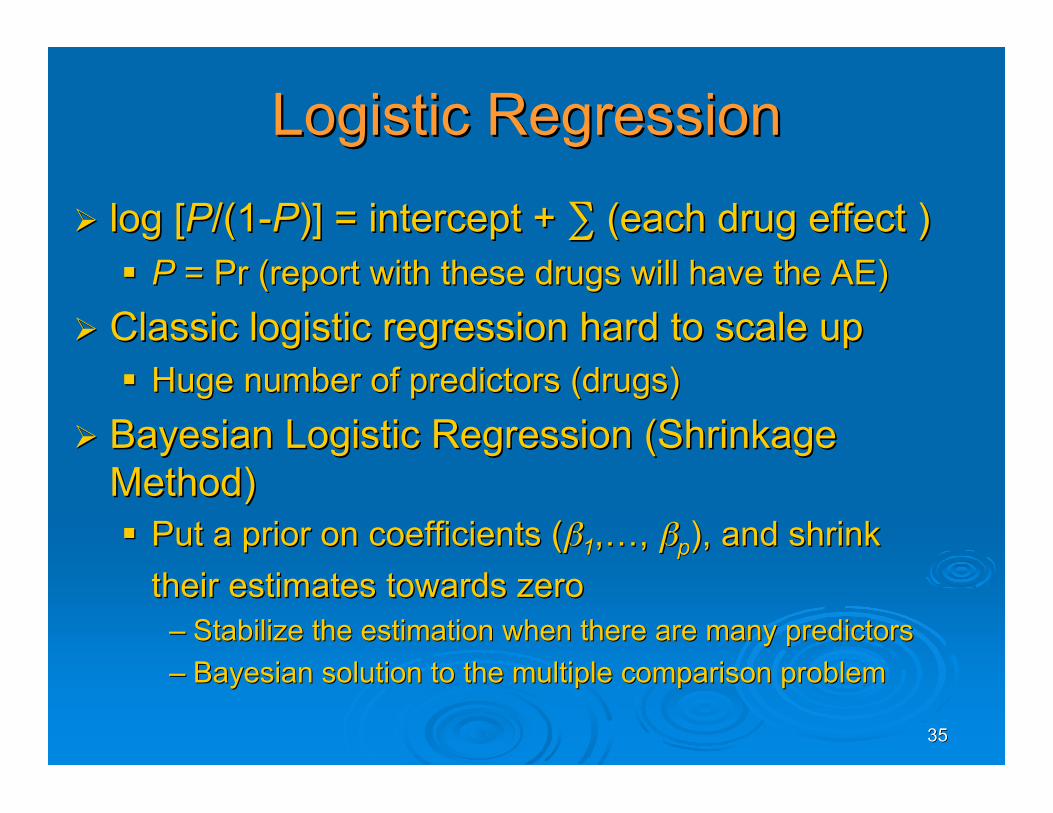
Logistic RegressionLogistic Regression
log [log [PP/(1-/(1-PP)] = intercept + )] = intercept + ∑∑ (each (each drug effect )drug effect ) P P = Pr (report with these drugs will have the AE)= Pr (report with these drugs will have the AE)
Classic logistic regression hard to scale upClassic logistic regression hard to scale up Huge number of predictors (drugs)Huge number of predictors (drugs)
Bayesian Logistic Regression (ShrinkageBayesian Logistic Regression (ShrinkageMethod)Method) Put a prior on coefficients (Put a prior on coefficients (ββ11,,……, , ββpp), and shrink), and shrink
their estimates towards zerotheir estimates towards zero–– Stabilize the estimation when there are many predictorsStabilize the estimation when there are many predictors–– Bayesian solution to the multiple comparison problemBayesian solution to the multiple comparison problem

3636
Bayesian Logistic RegressionBayesian Logistic Regression
Two shrinkage methodsTwo shrinkage methods Ridge regression - Gaussian priorRidge regression - Gaussian prior
ββjj ∼∼ N (0, N (0,λλ)) Lasso regression - Lasso regression - Laplace Laplace priorprior
ff((ββjj ) ) ∝∝ exp exp{{- - λλ | |ββjj||λλ}} Choosing Choosing hyperparameter hyperparameter λλ
Decide how much to shrinkDecide how much to shrink Cross-validation: choose prior to fit left-out dataCross-validation: choose prior to fit left-out data Aggregation method by Aggregation method by Bunea Bunea and Nobel (2005)and Nobel (2005)

3737
3838
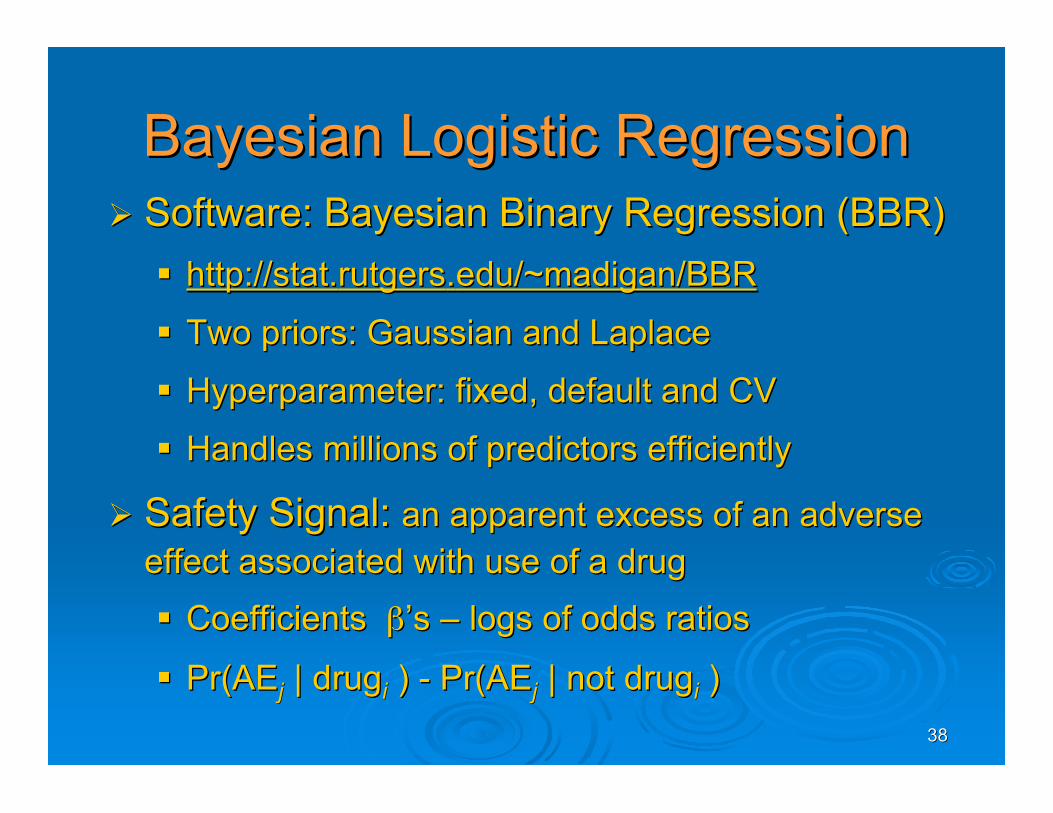
Bayesian Logistic RegressionBayesian Logistic Regression Software: Bayesian Binary Regression (BBR)Software: Bayesian Binary Regression (BBR)
http://stat.http://stat.rutgersrutgers..edu/~madigan/BBRedu/~madigan/BBR
Two priors: Gaussian and Two priors: Gaussian and LaplaceLaplace
HyperparameterHyperparameter: fixed, default and CV: fixed, default and CV
Handles millions of predictors efficientlyHandles millions of predictors efficiently
Safety Signal: Safety Signal: an apparent excess of an adversean apparent excess of an adverseeffect associated with use of a drugeffect associated with use of a drug
Coefficients Coefficients ββ’’s s –– logs of odds ratios logs of odds ratios
Pr(Pr(AEAEjj | | drugdrugii ) - Pr() - Pr(AEAEjj | not | not drugdrugii ))

3939
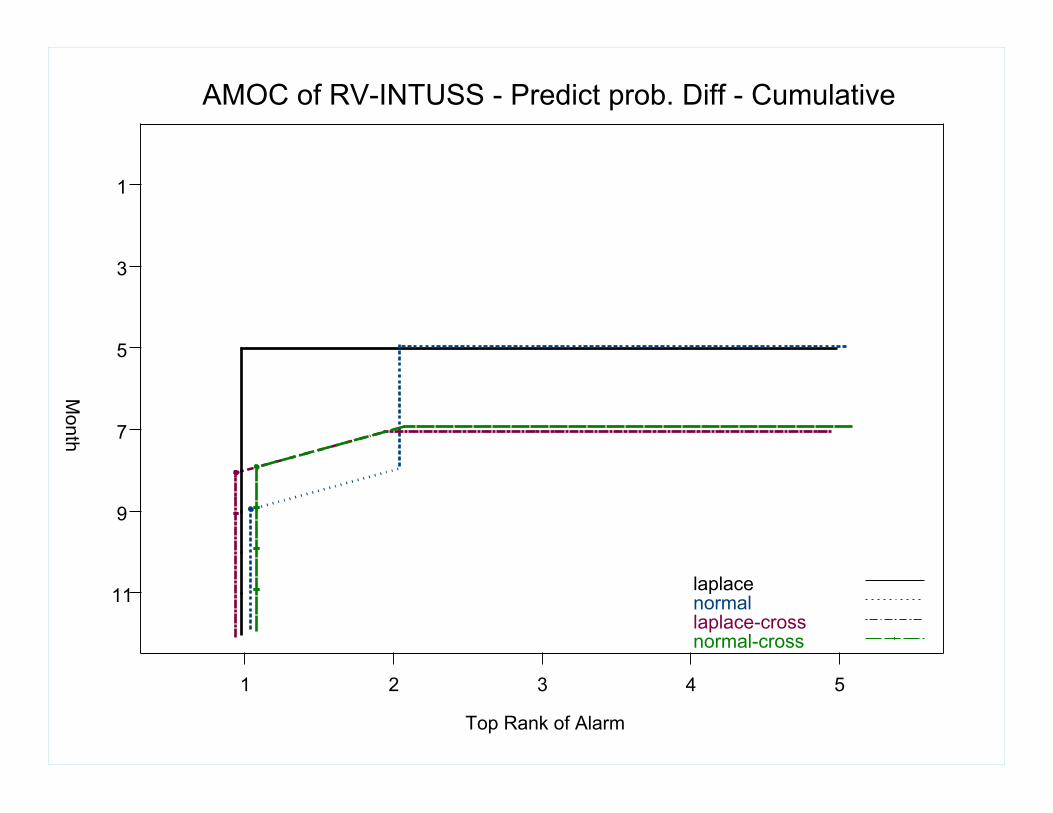
Evaluation StrategiesEvaluation Strategies
Top-Rank Plot for Safety SignalTop-Rank Plot for Safety Signal
To compare the timeliness of outbreak detectionTo compare the timeliness of outbreak detection
Similar to AMOC (Activity Monitor OperatingSimilar to AMOC (Activity Monitor OperatingCharacteristic) curve in fraud detectionCharacteristic) curve in fraud detection
Y Y –– window (month in 1999) window (month in 1999)
X X –– Top rank of association from window 1 to Top rank of association from window 1 tocorresponding windowcorresponding window
4040
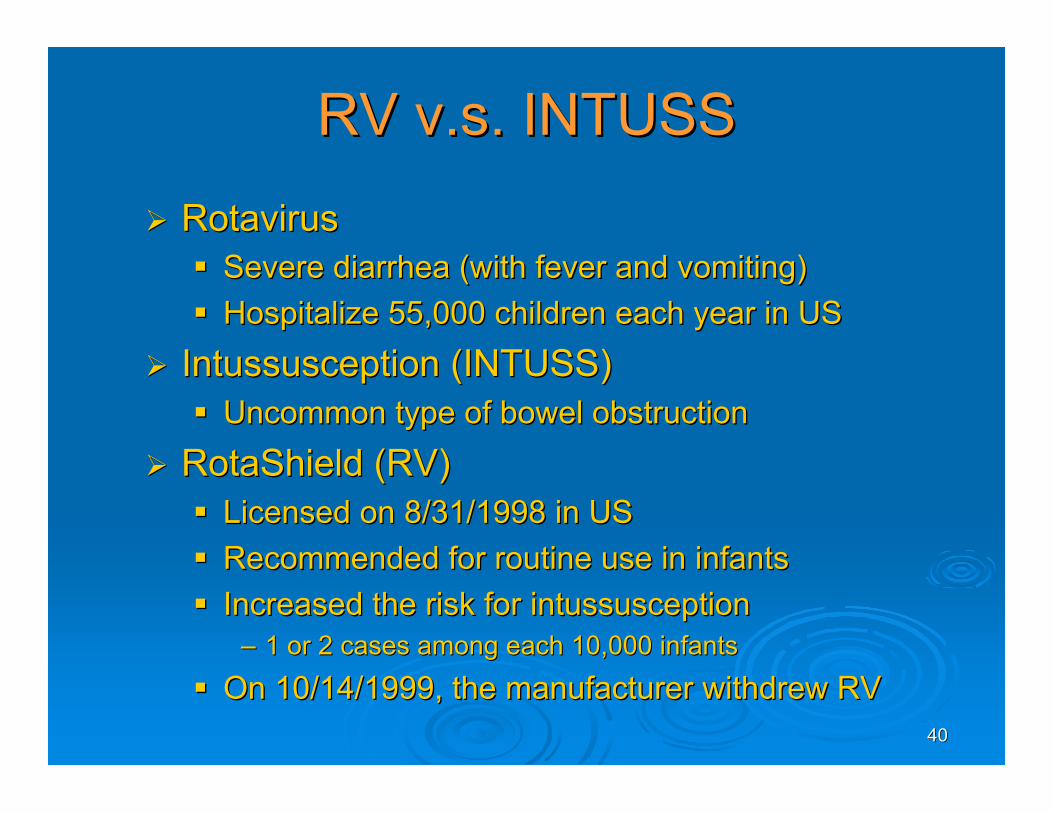
RV v.s. INTUSSRV v.s. INTUSS RotavirusRotavirus
Severe diarrhea (with fever and vomiting)Severe diarrhea (with fever and vomiting) Hospitalize 55,000 children each year in USHospitalize 55,000 children each year in US
Intussusception Intussusception (INTUSS)(INTUSS) Uncommon type of bowel obstructionUncommon type of bowel obstruction
RotaShield RotaShield (RV)(RV) Licensed on 8/31/1998 in USLicensed on 8/31/1998 in US Recommended for routine use in infantsRecommended for routine use in infants Increased the risk for Increased the risk for intussusceptionintussusception
–– 1 or 2 cases among each 10,000 infants1 or 2 cases among each 10,000 infants
On 10/14/1999, the manufacturer withdrew RVOn 10/14/1999, the manufacturer withdrew RV

4141Top Rank of Alarm
Month
1 2 3 4 5
11
9
7
5
3
1
laplacenormallaplace-crossnormal-crossGPSRRNoshrink
AMOC of RV-INTUSS - Coefficients - Cumulative
4242Top Rank of Alarm
Month
1 2 3 4 5
11
9
7
5
3
1
laplacenormallaplace-crossnormal-cross
AMOC of RV-INTUSS - Predict prob. Diff - Cumulative
4343
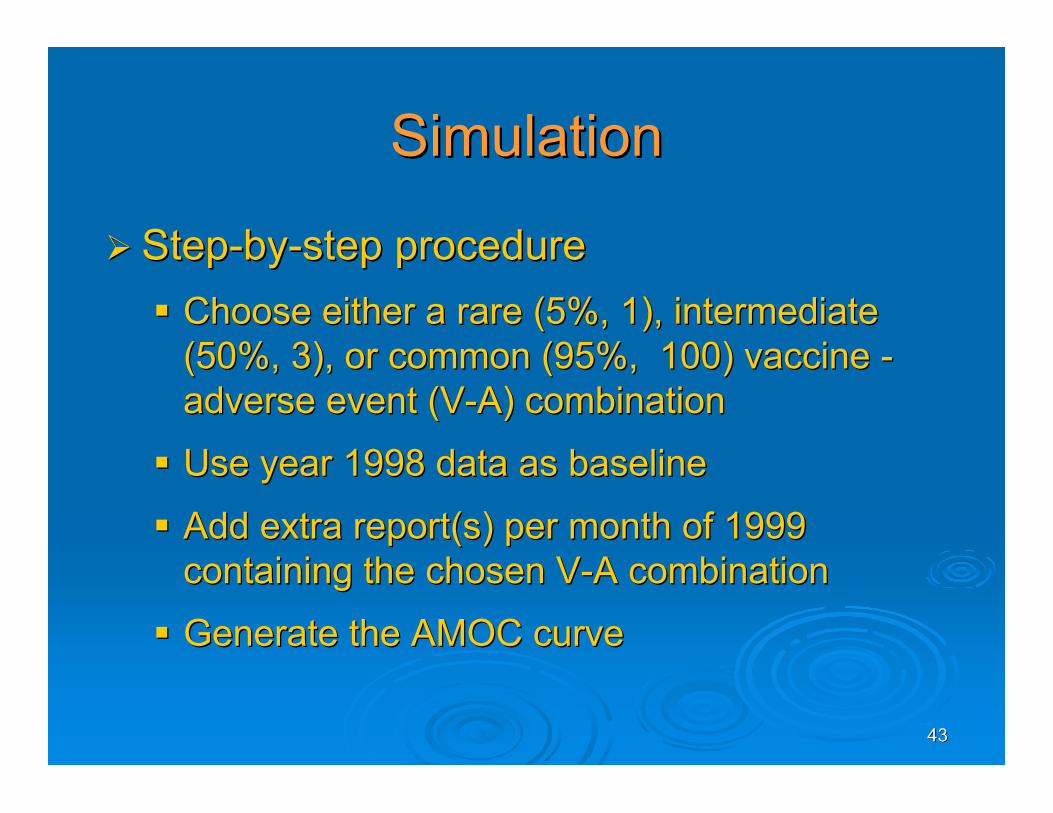
SimulationSimulation
Step-by-step procedureStep-by-step procedure Choose either a rare (5%, 1), intermediateChoose either a rare (5%, 1), intermediate
(50%, 3), or common (95%, 100) vaccine -(50%, 3), or common (95%, 100) vaccine -adverse event (V-A) combinationadverse event (V-A) combination
Use year 1998 data as baselineUse year 1998 data as baseline
Add extra report(s) per month of 1999Add extra report(s) per month of 1999containing the chosen V-A combinationcontaining the chosen V-A combination
Generate the AMOC curveGenerate the AMOC curve

4444Top Rank of Alarm
Month
1 2 3 4 5
11
9
7
5
3
1
laplacenormallaplace-crossnormal-crossGPSRR
AMOC of CHOL-HEPATITIS (5%) simu+1

4545Top Rank of Alarm
Month
0 10 20 30 40 50
11
9
7
5
3
1
laplacenormallaplace-crossnormal-crossGPSRR
AMOC of RV-LEUKOCYTOSIS (50%) simu+2
4646Top Rank of Alarm
Month
0 10 20 30 40 50
11
9
7
5
3
1
laplacenormallaplace-crossnormal-crossGPSRR
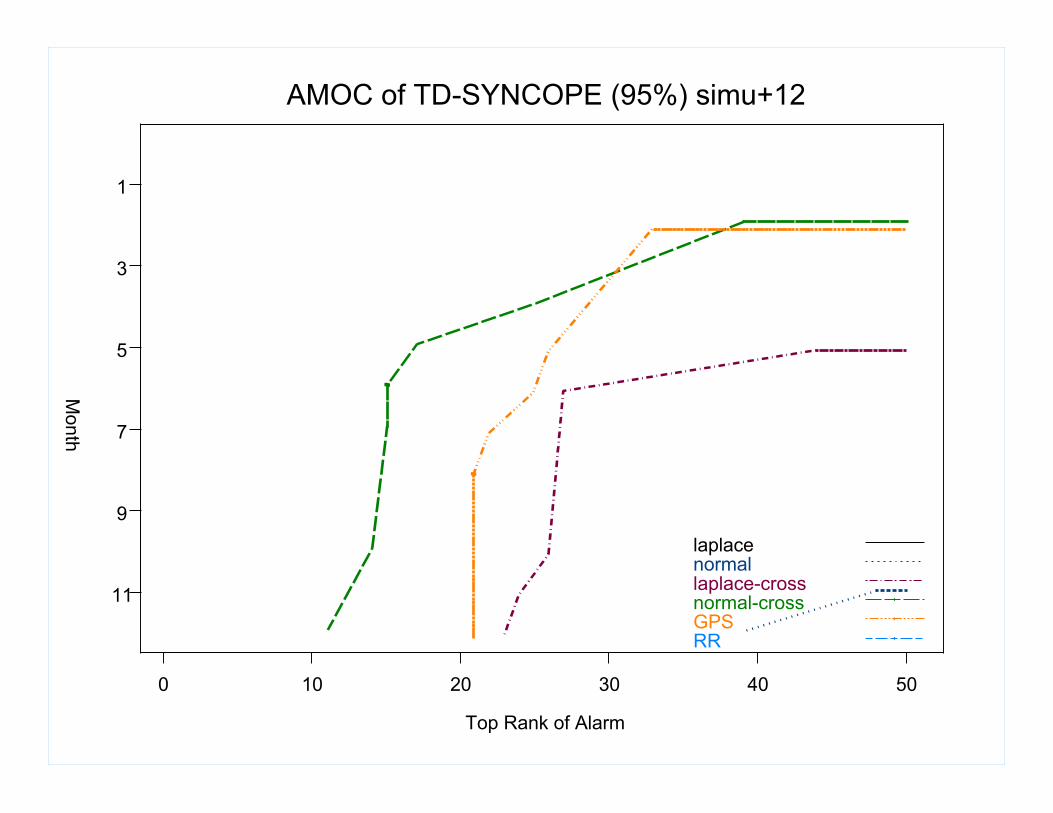
AMOC of TD-SYNCOPE (95%) simu+12

4747Top Rank of Alarm
Month
0 10 20 30 40 50
11
9
7
5
3
1
laplacenormallaplace-crossnormal-crossGPSRR
AMOC of FLU-RHINITIS (95%) simu+12
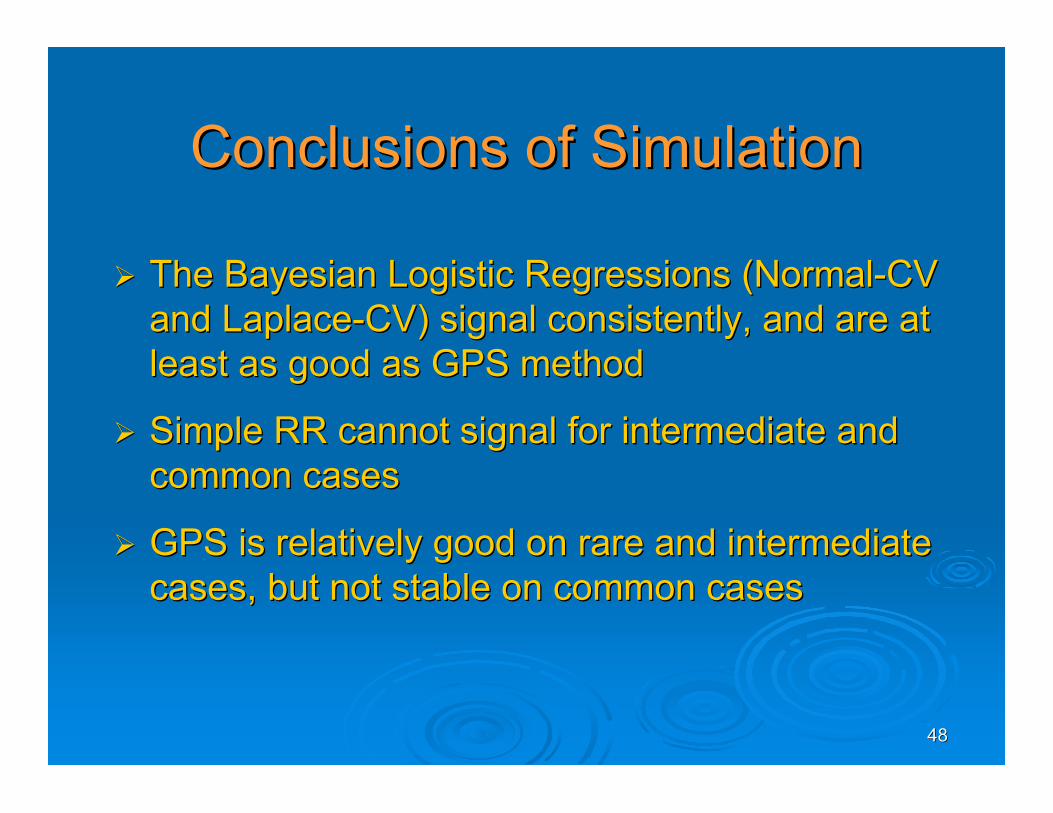
4848
Conclusions of SimulationConclusions of Simulation
The Bayesian Logistic Regressions (Normal-CVThe Bayesian Logistic Regressions (Normal-CVand and Laplace-CVLaplace-CV) signal consistently, and are at) signal consistently, and are atleast as good as GPS methodleast as good as GPS method
Simple RR cannot signal for intermediate andSimple RR cannot signal for intermediate andcommon casescommon cases
GPS is relatively good on rare and intermediateGPS is relatively good on rare and intermediatecases, but not stable on common casescases, but not stable on common cases

4949
Discussion of Logistic MethodDiscussion of Logistic Method Advantages over low-dimensional tablesAdvantages over low-dimensional tables
Correct confounding and mask effectCorrect confounding and mask effect Analyze multiple drugs/vaccines simultaneouslyAnalyze multiple drugs/vaccines simultaneously
LimitationsLimitations Build separate model for each AEBuild separate model for each AE
–– Ignore dependencies between Ignore dependencies between AEsAEs
Fail to adjust for unmeasured/unrecorded factorsFail to adjust for unmeasured/unrecorded factors–– health status, unreported drugs, etc.health status, unreported drugs, etc.
Model-based approachModel-based approach–– Require model assumptionsRequire model assumptions

5050
Causal Inference ViewCausal Inference View RubinRubin’’s causal models causal model
Potential outcomesPotential outcomesFactual outcomeFactual outcome
I took an aspirin and my headache wentI took an aspirin and my headache went awayawayCounterfactual outcomeCounterfactual outcome
If I hadnIf I hadn’’t taken an aspirin,t taken an aspirin, II’’d still have a headached still have a headache Define:Define:
ZZi i : treatment applied to unit i (0=control, 1=treat): treatment applied to unit i (0=control, 1=treat) YYi i (0) : response for unit (0) : response for unit ii if if ZZii = 0= 0 YYi i (1) : response for unit (1) : response for unit ii if if ZZi i = 1= 1 Unit level causal effect: Unit level causal effect: YYi i (1) - (1) - YYi i (0)(0) Fundamental problem: only see oneFundamental problem: only see one of these!of these!

5151
Bias Due To ConfoundingBias Due To Confounding
Individuals are observed already under theirIndividuals are observed already under theirrespective conditionsrespective conditions
The two groups may differ in ways otherThe two groups may differ in ways otherthan just the observed conditionthan just the observed condition
Average effects may be biased due toAverage effects may be biased due toconfounding between covariates and groupconfounding between covariates and groupconditioncondition
We can simulate randomization orWe can simulate randomization orcounterfactual world using information fromcounterfactual world using information fromobservational studyobservational study……sort ofsort of

5252
Propensity Score MethodPropensity Score Method DefinitionDefinition
e(e(xxii) = P() = P(ZZii=1 =1 | | XXii=x=xii))Conditional probability of assignment to testConditional probability of assignment to testtreatment treatment ZZii=1 =1 given observed covariatesgiven observed covariates
Assuming no unmeasured confounders,Assuming no unmeasured confounders,stratifying on e(stratifying on e(xxii) leads to causal) leads to causal inferencesinferencesjust as valid as in randomized trialsjust as valid as in randomized trials
Methods with propensity scores:Methods with propensity scores: Inverse weightingInverse weighting Regression adjustmentRegression adjustment MatchingMatching
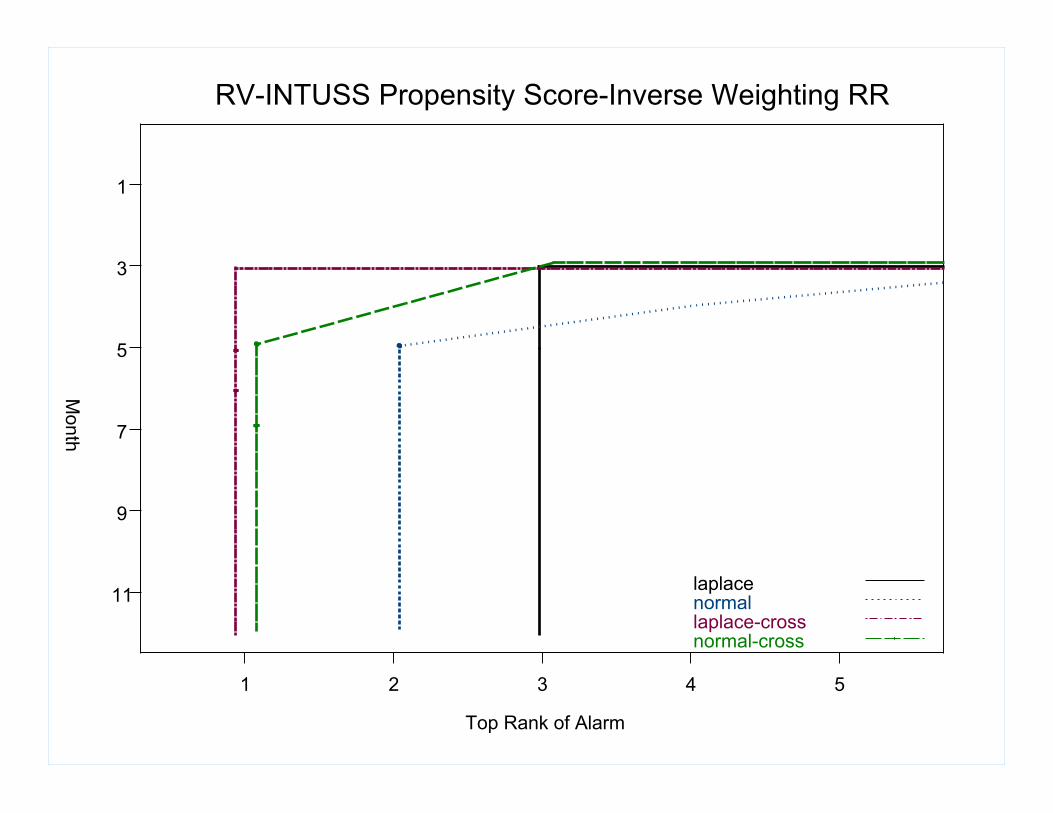
5353Top Rank of Alarm
Month
1 2 3 4 5
11
9
7
5
3
1
laplacenormallaplace-crossnormal-cross
RV-INTUSS Propensity Score-Inverse Weighting RR
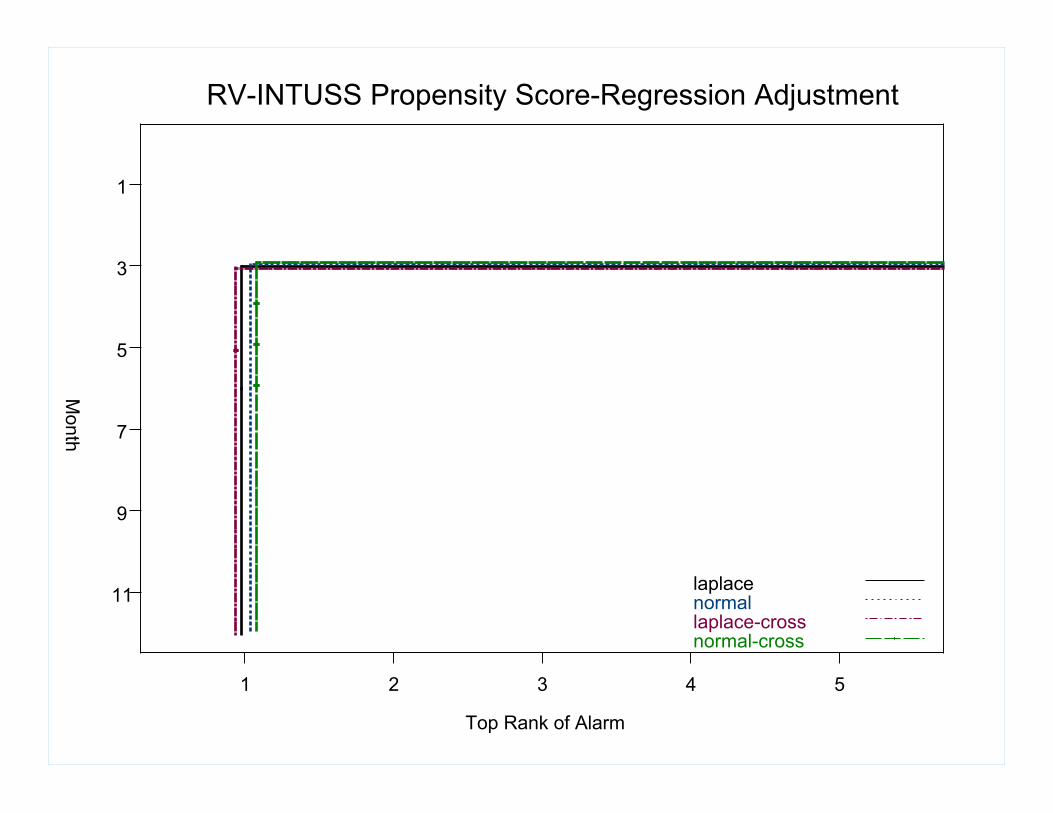
5454Top Rank of Alarm
Month
1 2 3 4 5
11
9
7
5
3
1
laplacenormallaplace-crossnormal-cross
RV-INTUSS Propensity Score-Regression Adjustment
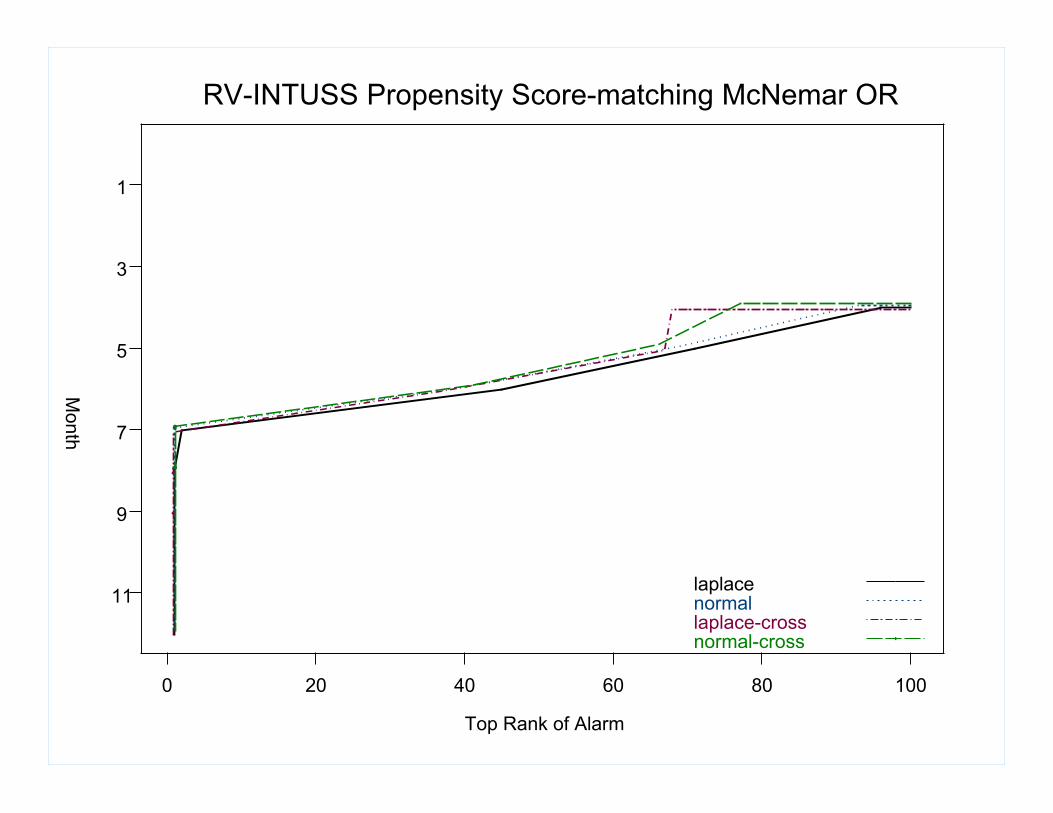
5555Top Rank of Alarm
Month
0 20 40 60 80 100
11
9
7
5
3
1
laplacenormallaplace-crossnormal-cross
RV-INTUSS Propensity Score-matching McNemar OR
5656
ConclusionConclusion ““First generationFirst generation”” Method Method
Contingency table methodsContingency table methods Deal with each drug and each adverse event in isolationDeal with each drug and each adverse event in isolation
““Second generationSecond generation”” Method Method Bayesian logistic regressionBayesian logistic regression Propensity scorePropensity score Deal with large numbers of drugs jointly and with multi-Deal with large numbers of drugs jointly and with multi-
drug interactionsdrug interactions Ultimate MethodUltimate Method
Not only interactions and relationships among drugs ,Not only interactions and relationships among drugs ,but also adverse eventsbut also adverse events
Question: which sets of drugs cause which sets ofQuestion: which sets of drugs cause which sets ofadverse events?adverse events?


