
www.albemarle.com
Deactivation of Hydrotreating Catalysts in Different Reaction Zones of a
VGO FCC-Pretreatment Reactor
S. Eijsbouts, S. Mayo, L. Burns and G. AndersonXV F d A d l I d t i d R fi ióXV Foro de Avances de la Industria de Refinación Mexico City, September 2009

Contentswww.albemarle.com
FCC PT iFCC-PT process overview
Reaction zone concept
Sampling and analysis goals
Catalyst deactivation by coking and metals depositionCatalyst deactivation by coking and metals deposition
2
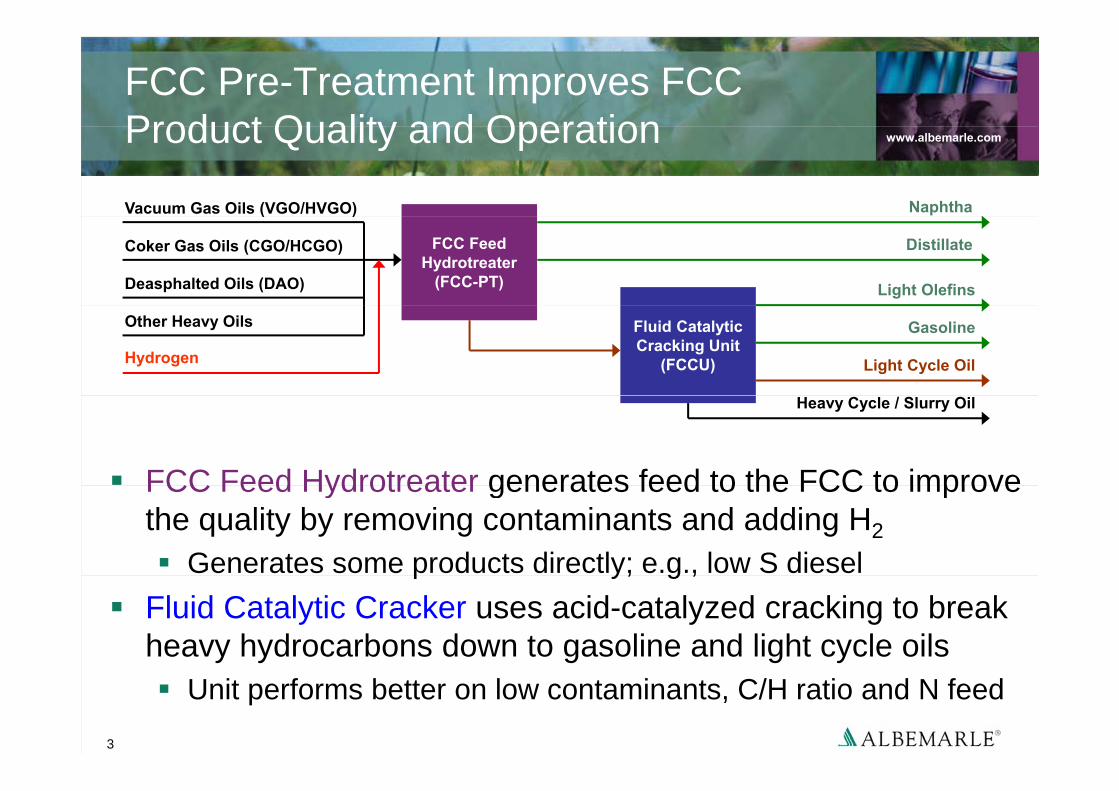
FCC Pre-Treatment Improves FCC Product Quality and Operation www.albemarle.comProduct Quality and Operation
Vacuum Gas Oils (VGO/HVGO) Naphtha
FCC FeedHydrotreater
(FCC-PT)
( )
Coker Gas Oils (CGO/HCGO)
Deasphalted Oils (DAO)
Distillate
Light Olefins
Other Heavy Oils
Hydrogen
Fluid CatalyticCracking Unit
(FCCU)
Gasoline
Light Cycle Oil
Heavy Cycle / Slurry Oil
FCC Feed Hydrotreater generates feed to the FCC to improveFCC Feed Hydrotreater generates feed to the FCC to improve the quality by removing contaminants and adding H2
Generates some products directly; e.g., low S dieselp y; g ,Fluid Catalytic Cracker uses acid-catalyzed cracking to break heavy hydrocarbons down to gasoline and light cycle oils
3
Unit performs better on low contaminants, C/H ratio and N feed
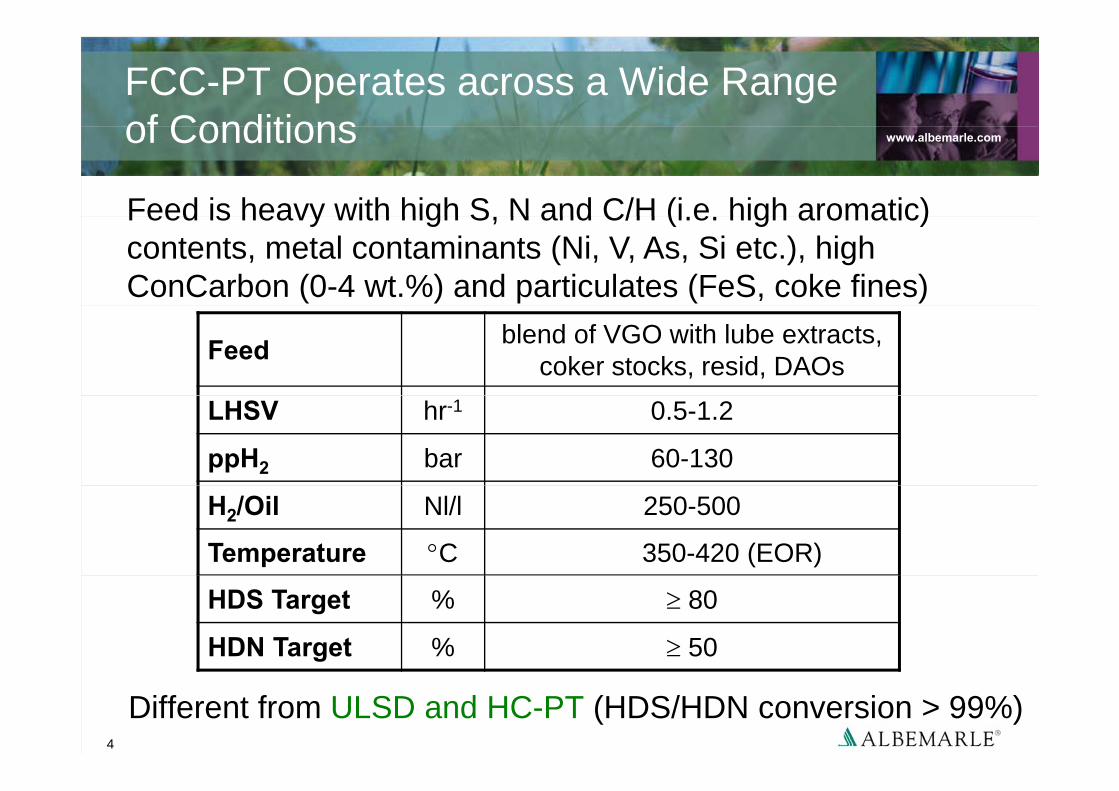
FCC-PT Operates across a Wide Range of Conditions www.albemarle.comof Conditions
Feed is heavy with high S N and C/H (i e high aromatic)Feed is heavy with high S, N and C/H (i.e. high aromatic) contents, metal contaminants (Ni, V, As, Si etc.), high ConCarbon (0-4 wt.%) and particulates (FeS, coke fines)
Feed blend of VGO with lube extracts, coker stocks, resid, DAOs
LHSV hr-1 0.5-1.2
ppH2 bar 60-130
H2/Oil Nl/l 250-500
Temperature °C 350-420 (EOR)
HDS Target % ≥ 80
HDN Target % ≥ 50
4
Different from ULSD and HC-PT (HDS/HDN conversion > 99%)
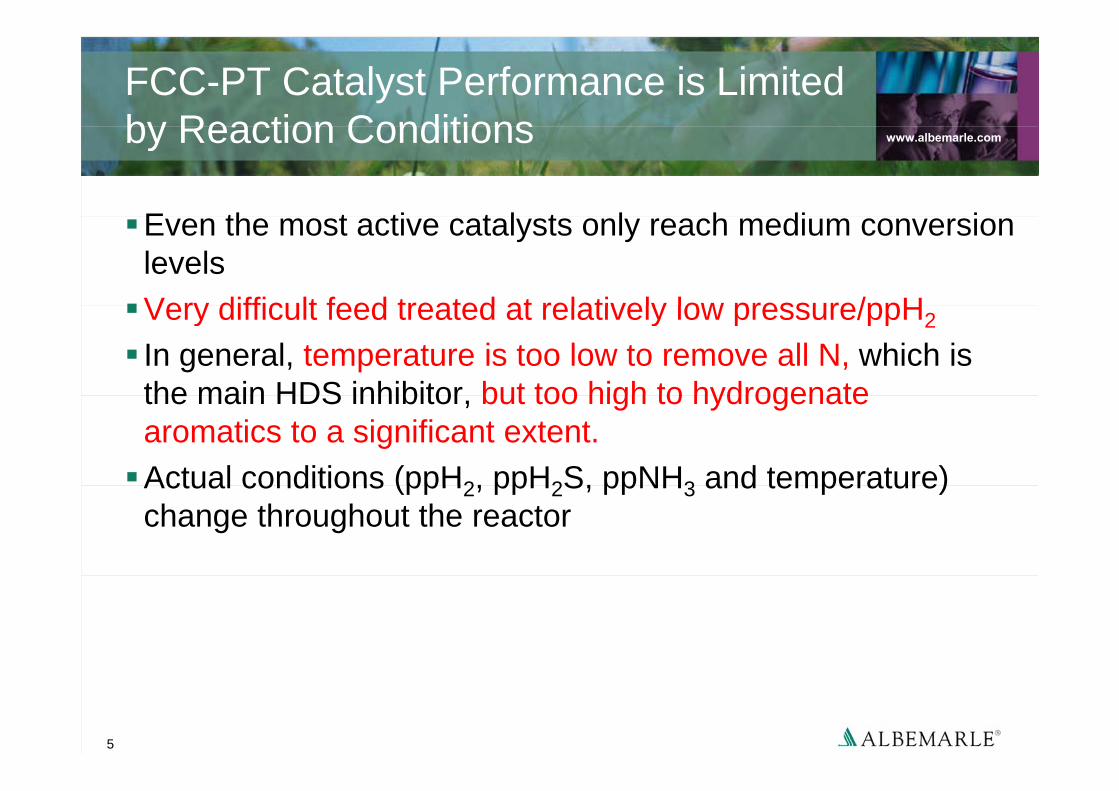
FCC-PT Catalyst Performance is Limited by Reaction Conditions www.albemarle.comby Reaction Conditions
E th t ti t l t l h di iEven the most active catalysts only reach medium conversion levelsVery difficult feed treated at relatively low pressure/ppHVery difficult feed treated at relatively low pressure/ppH2
In general, temperature is too low to remove all N, which is the main HDS inhibitor but too high to hydrogenatethe main HDS inhibitor, but too high to hydrogenate aromatics to a significant extent.Actual conditions (ppH2, ppH2S, ppNH3 and temperature)Actual conditions (ppH2, ppH2S, ppNH3 and temperature) change throughout the reactor
5
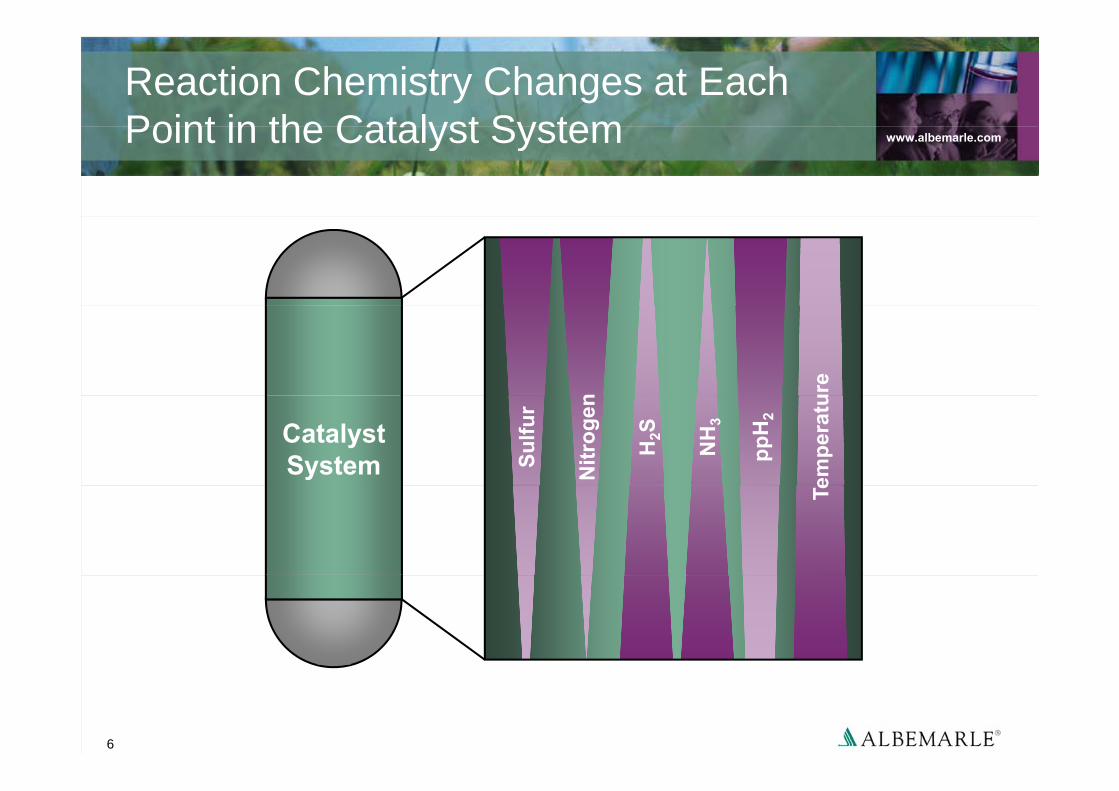
Reaction Chemistry Changes at Each Point in the Catalyst System www.albemarle.comPoint in the Catalyst System
n ure
CatalystSystem Su
lfur
Nitr
ogen
H2S
NH
3
ppH
2
empe
ratu
Te
6
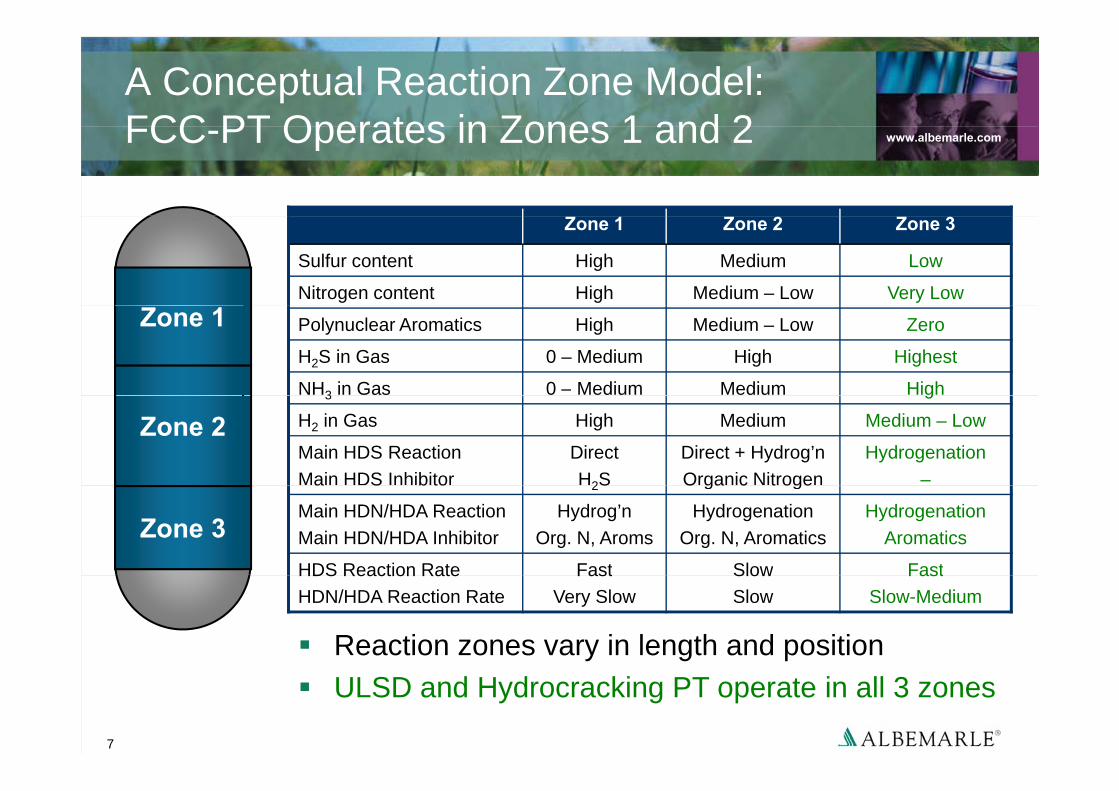
A Conceptual Reaction Zone Model: FCC PT Operates in Zones 1 and 2 www.albemarle.comFCC-PT Operates in Zones 1 and 2
Zone 1 Zone 2 Zone 3
Sulfur content High Medium Low
Nitrogen content High Medium – Low Very LowZone 1 Polynuclear Aromatics High Medium – Low Zero
H2S in Gas 0 – Medium High Highest
NH3 in Gas 0 – Medium Medium High
Zone 23 g
H2 in Gas High Medium Medium – Low
Main HDS ReactionMain HDS Inhibitor
DirectH2S
Direct + Hydrog’nOrganic Nitrogen
Hydrogenation–
Zone 3
a S b to 2S O ga c t oge
Main HDN/HDA ReactionMain HDN/HDA Inhibitor
Hydrog’nOrg. N, Aroms
HydrogenationOrg. N, Aromatics
HydrogenationAromatics
HDS Reaction Rate Fast Slow Fast
Reaction zones vary in length and position
HDS Reaction RateHDN/HDA Reaction Rate
FastVery Slow
SlowSlow
FastSlow-Medium
7
ULSD and Hydrocracking PT operate in all 3 zones

FCC-PT Catalystswww.albemarle.com
y
O ti i f b iFeed + H2Feed + H2
Optimize performance by sequencing catalysts with functionality selected to match conditions and desired reactions in particularconditions and desired reactions in particular zones of the reactorGuard
BedGuard Bed
Guard Bed: removes metal poisons (VGO demet), CCR and particulates; volume must be sufficient to protect the main bed catalystbe sufficient to protect the main bed catalyst
Main Bed: depends on unit’s operating Main
Active Catalyst
Main Active
Catalysts strategy / conditions, focuses on HDS, HDN and aromatics saturation to meet unit objectives / constraints
CatalystCatalysts
8
objectives / constraintsProducts + H2
Sampling of Commercial Reactorswww.albemarle.com
p g
Reactor fill between 15 800 mtReactor fill between 15-800 mtGuard bed and main bed may contain multiple catalystsSampling of specific parts of catalyst bed during unloading isSampling of specific parts of catalyst bed during unloading is difficult (gravity dumping)Optimum scenario: 1-5 samples of ca. 1 kg each taken per p p g pcatalyst layer ~ 0.005% material is sampledChemical and physical analysis:
10-15g sample used ~ 0.000002% SEM and TEM:
5 10 extrudates 50 100 mg used 0 00000001%5-10 extrudates ~ 50-100 mg used ~ 0.00000001%Representative sampling essential; confirm any unexpected results
9
results
Analysis Goalwww.albemarle.com
y
G d b d t l tGuard bed catalysts:Determine concentration and distribution of metal contaminantsDetermine coke contentDetermine coke content
Main bed catalysts:Check for presence of metal contaminantsCheck for presence of metal contaminantsDetermine coke contentAssess the state of the active phase: MoS dispersionAssess the state of the active phase: MoS2 dispersion
Challenging because there is so much going on
10
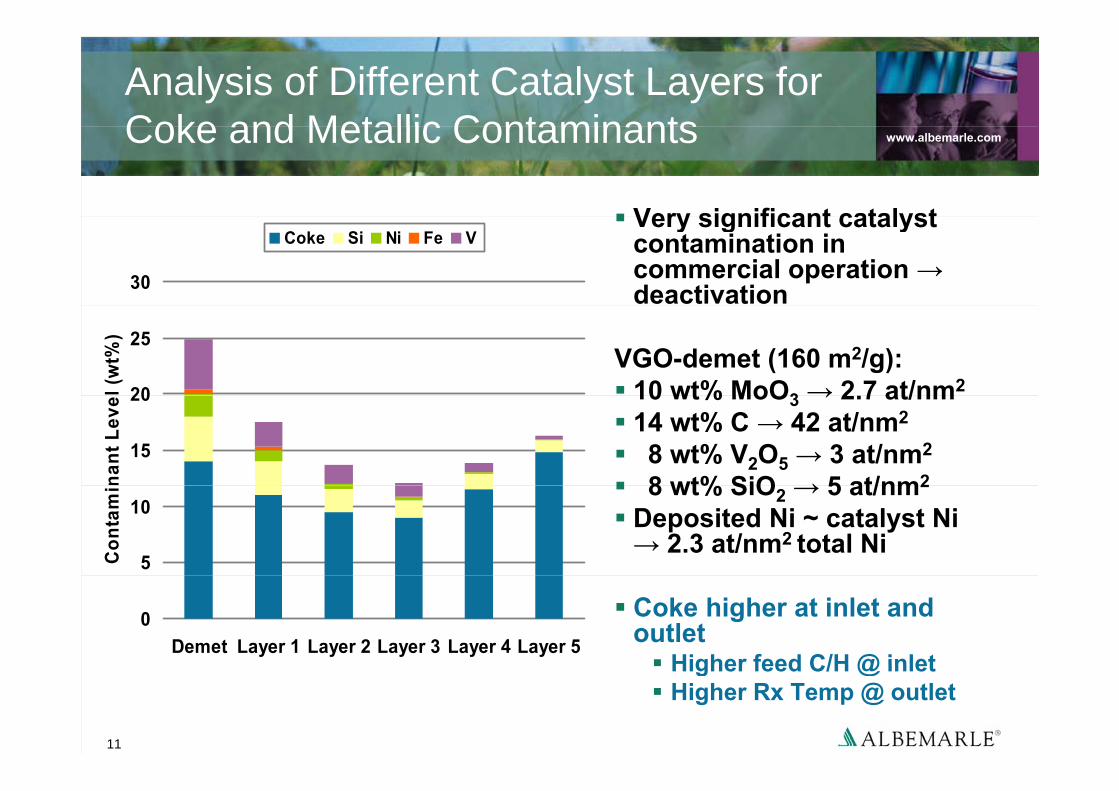
Analysis of Different Catalyst Layers for Coke and Metallic Contaminants www.albemarle.comCoke and Metallic Contaminants
Very significant catalystVery significant catalyst contamination in commercial operation →deactivation30
Coke Si Ni Fe V
VGO-demet (160 m2/g):10 wt% MoO3 → 2 7 at/nm220
25
l (w
t%)
10 wt% MoO3 → 2.7 at/nm14 wt% C → 42 at/nm2
8 wt% V2O5 → 3 at/nm2
8 wt% SiO → 5 at/nm215
20
nant
Lev
e
8 wt% SiO2 → 5 at/nm2
Deposited Ni ~ catalyst Ni → 2.3 at/nm2 total Ni
5
10
Con
tam
i
Coke higher at inlet and outlet
Higher feed C/H @ inlet
0Demet Layer 1 Layer 2 Layer 3 Layer 4 Layer 5
11
Higher feed C/H @ inletHigher Rx Temp @ outlet
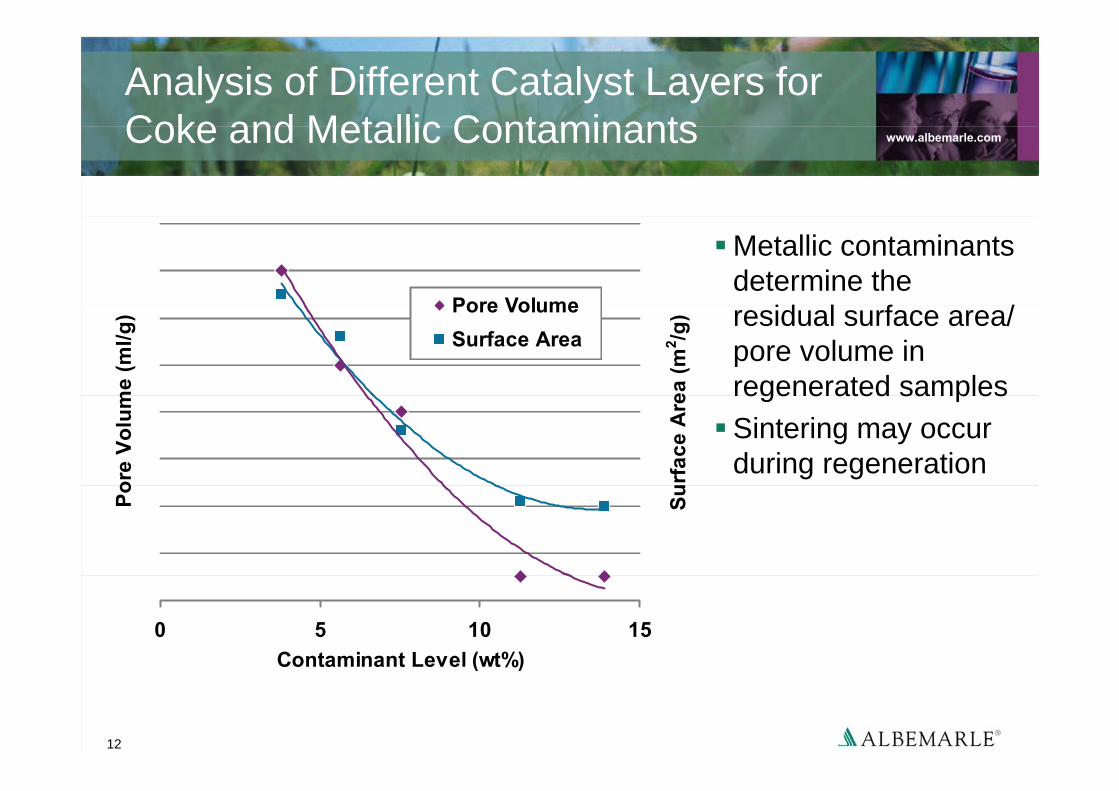
Analysis of Different Catalyst Layers for Coke and Metallic Contaminants www.albemarle.comCoke and Metallic Contaminants
Metallic contaminants determine the
id l f /Pore Volume residual surface area/ pore volume in regenerated samplesm
e (m
l/g)
ea (m
2 /g)Pore Volume
Surface Area
regenerated samples Sintering may occur during regeneration
ore
Volu
m
urfa
ce A
re
Po Su
0 5 10 15Contaminant Level (wt%)
12
Contaminant Level (wt%)

Apparent Changes in Pore Size Distribution from Deactivation and Regeneration www.albemarle.comfrom Deactivation and Regeneration
Oxidic
Spent Top
Oxidic
Spent TopOxidic
Pores “filled” with residual oil, coke and
t l d it i
/g/n
m) Spent Bottom
Top Regenerated
Bottom Regenerated
/g/n
m) Spent Bottom
/g/n
m) metal deposits in
spent catalystSintering and change
V/dD
(ml/
V/dD
(ml/
V/dD
(ml/ Sintering and change
of pore size may occur during
dVdVdV regeneration
13
Pore Diameter (nm)Pore Diameter (nm)Pore Diameter (nm)

Apparent Changes in Pore Size Distribution from Deactivation and Regeneration www.albemarle.comfrom Deactivation and Regeneration
Pores “filled” with residual oil, coke and
t l d it i
Oxidic
Spent
metal deposits in spent catalystSintering and changeg/
nm)
Spent ResulfidedRegenerated
Sintering and change of pore size may occur on regeneration/d
D (m
l/g
H2S/H2 “resulfiding” removes residual oil and soft coke
dV/
and soft coke
14
Pore Diameter (nm)
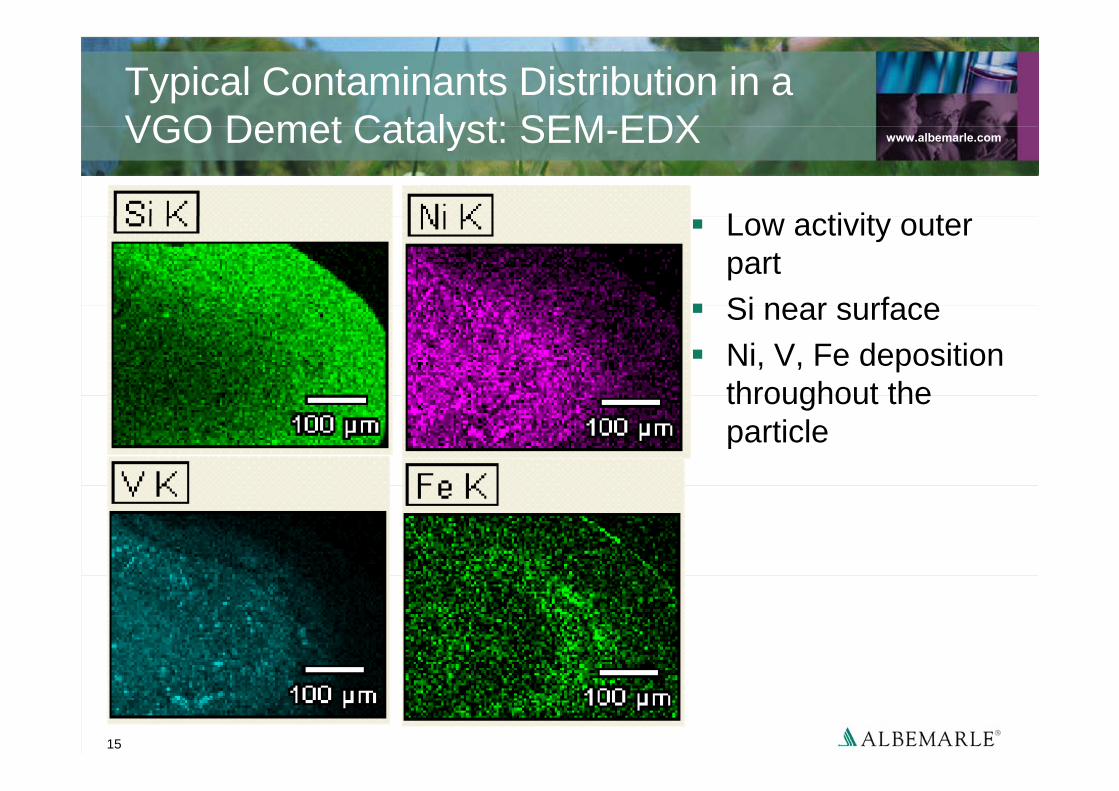
Typical Contaminants Distribution in a VGO Demet Catalyst: SEM EDX www.albemarle.comVGO Demet Catalyst: SEM-EDX
L ti it tLow activity outer partSi near surfaceSi near surfaceNi, V, Fe deposition throughout thethroughout the particle
15
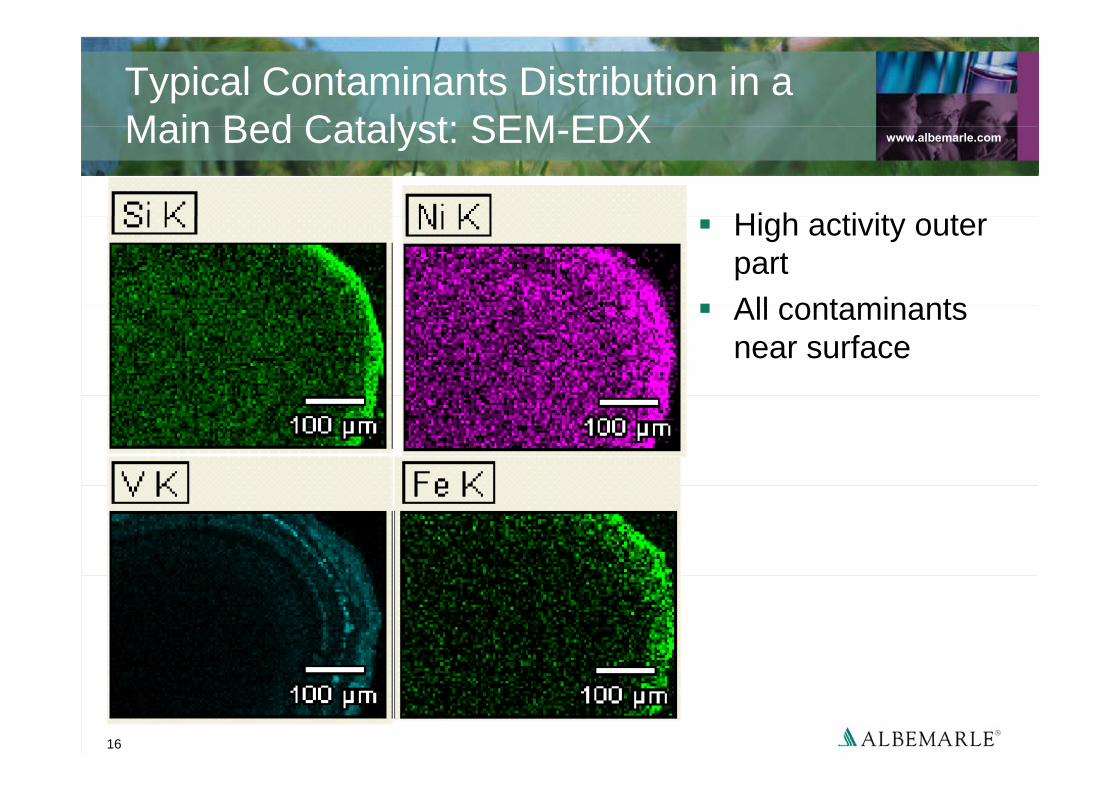
Typical Contaminants Distribution in a Main Bed Catalyst: SEM EDX www.albemarle.comMain Bed Catalyst: SEM-EDX
Hi h ti it tHigh activity outer partAll contaminantsAll contaminants near surface
16
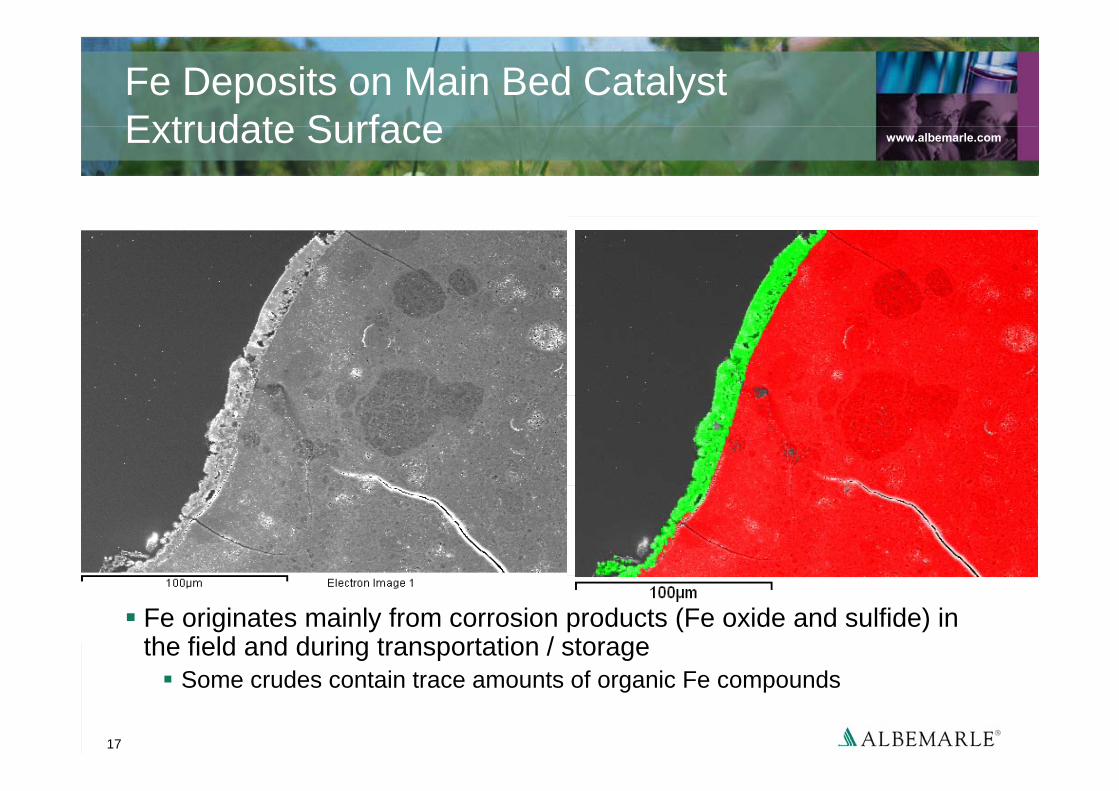
Fe Deposits on Main Bed Catalyst Extrudate Surface www.albemarle.comExtrudate Surface
Fe originates mainly from corrosion products (Fe oxide and sulfide) in the field and during transportation / storage
17
Some crudes contain trace amounts of organic Fe compounds
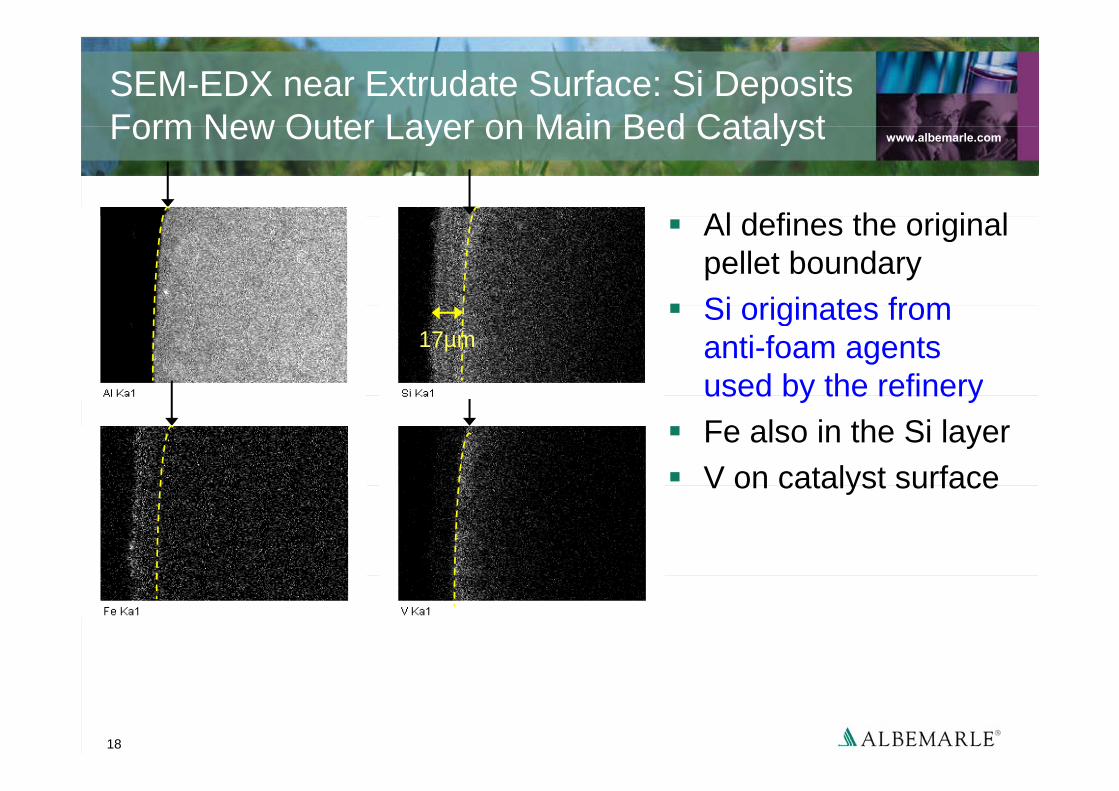
SEM-EDX near Extrudate Surface: Si Deposits Form New Outer Layer on Main Bed Catalyst www.albemarle.comForm New Outer Layer on Main Bed Catalyst
Al d fi th i i lAl defines the original pellet boundarySi originates from
17µmSi originates from anti-foam agents used by the refineryused by the refineryFe also in the Si layerV on catalyst surfaceV on catalyst surface
18

STEM-EDX Using Extrudate Sections: Main Bed Catalyst Contaminated with As www.albemarle.comMain Bed Catalyst Contaminated with As
Method enables analysis of et od e ab es a a ys s ospecific locations in the catalyst, as well as specific crystals (EDX, morphology)
19
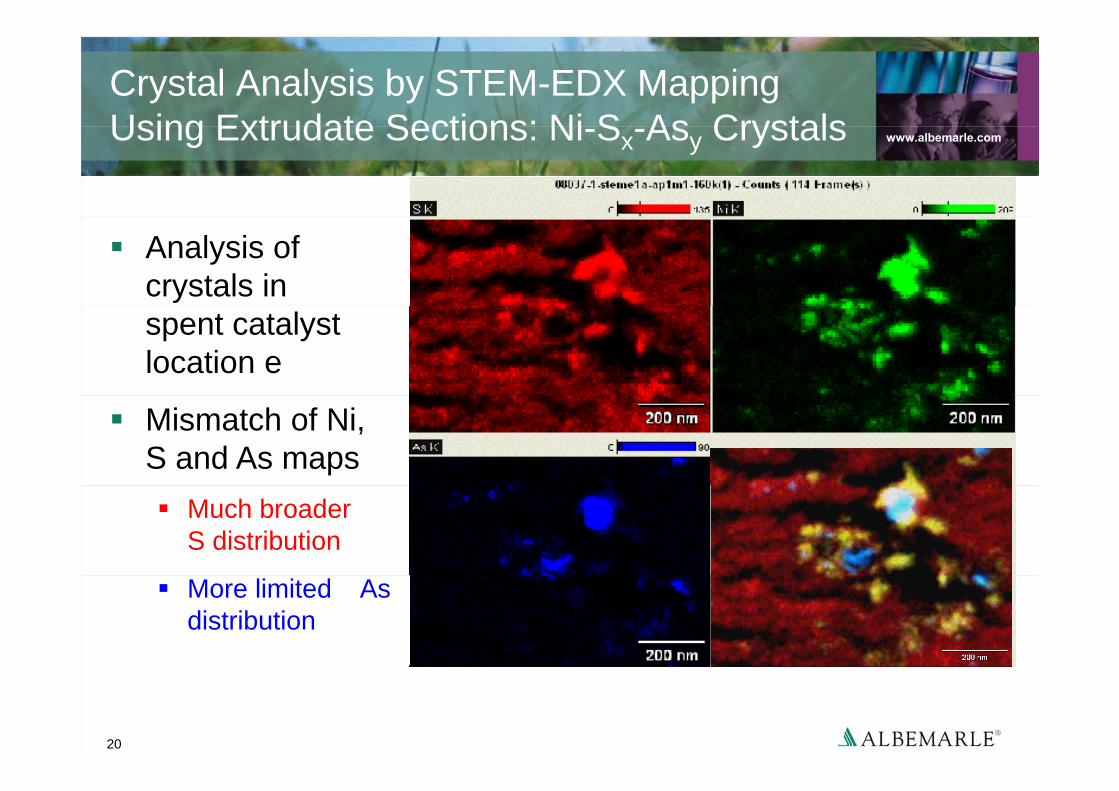
Crystal Analysis by STEM-EDX Mapping Using Extrudate Sections: Ni S As Crystals www.albemarle.comUsing Extrudate Sections: Ni-Sx-Asy Crystals
Analysis of crystals in spent catalyst location e
Mismatch of Ni, S and As maps
Much broader S distribution
More limited As distribution
20
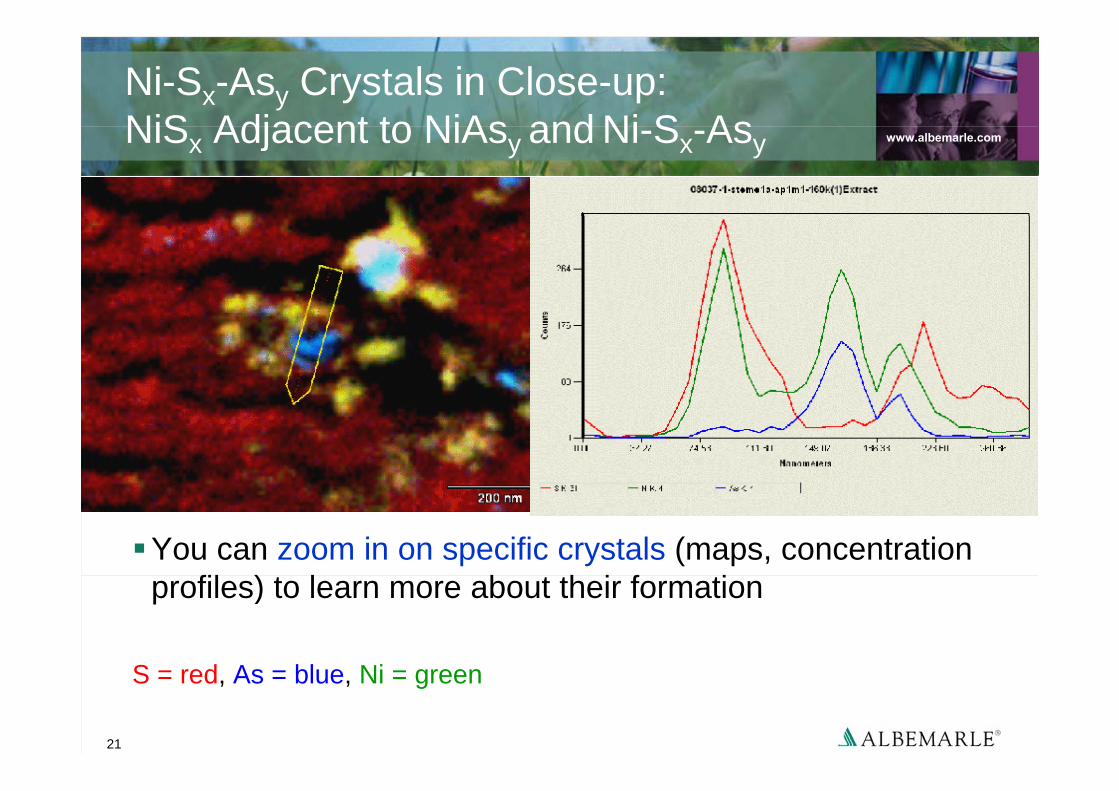
Ni-Sx-Asy Crystals in Close-up: NiS Adjacent to NiAs and Ni S As www.albemarle.comNiSx Adjacent to NiAsy and Ni-Sx-Asy
You can zoom in on specific crystals (maps, concentration fil ) l b h i f iprofiles) to learn more about their formation
S d A bl Ni
21
S = red, As = blue, Ni = green

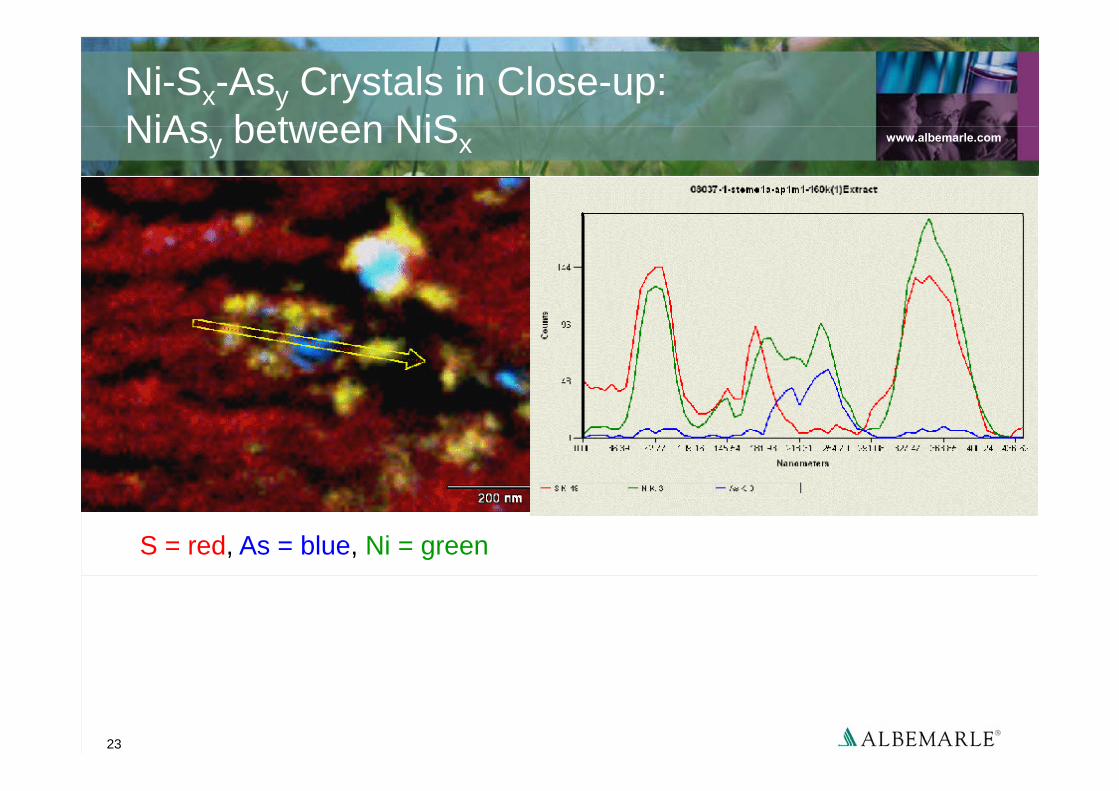
Ni-Sx-Asy Crystals in Close-up: NiAs between NiS www.albemarle.comNiAsy between NiSx
S = red, As = blue, Ni = green
22
Ni-Sx-Asy Crystals in Close-up: NiAs between NiS www.albemarle.comNiAsy between NiSx
S = red, As = blue, Ni = green
23

Ni-Sx-Asy Crystals in Close up: Ni S As between NiS www.albemarle.comNi-Sx-Asy between NiSx
S = red, As = blue, Ni = green
24

Ni-Sx-Asy Crystals in Close-up: Ni S As Adjacent to NiS www.albemarle.comNi-Sx-Asy Adjacent to NiSx
Overall ResultsOb i l t NiA d NiS t l ithObserve mainly separate NiAsy and NiSx crystals with variable composition of NiSxOnly a few mixed Ni-Sx-Asy crystals
25
O y a e ed Sx sy c ysta s
S = red, As = blue, Ni = green
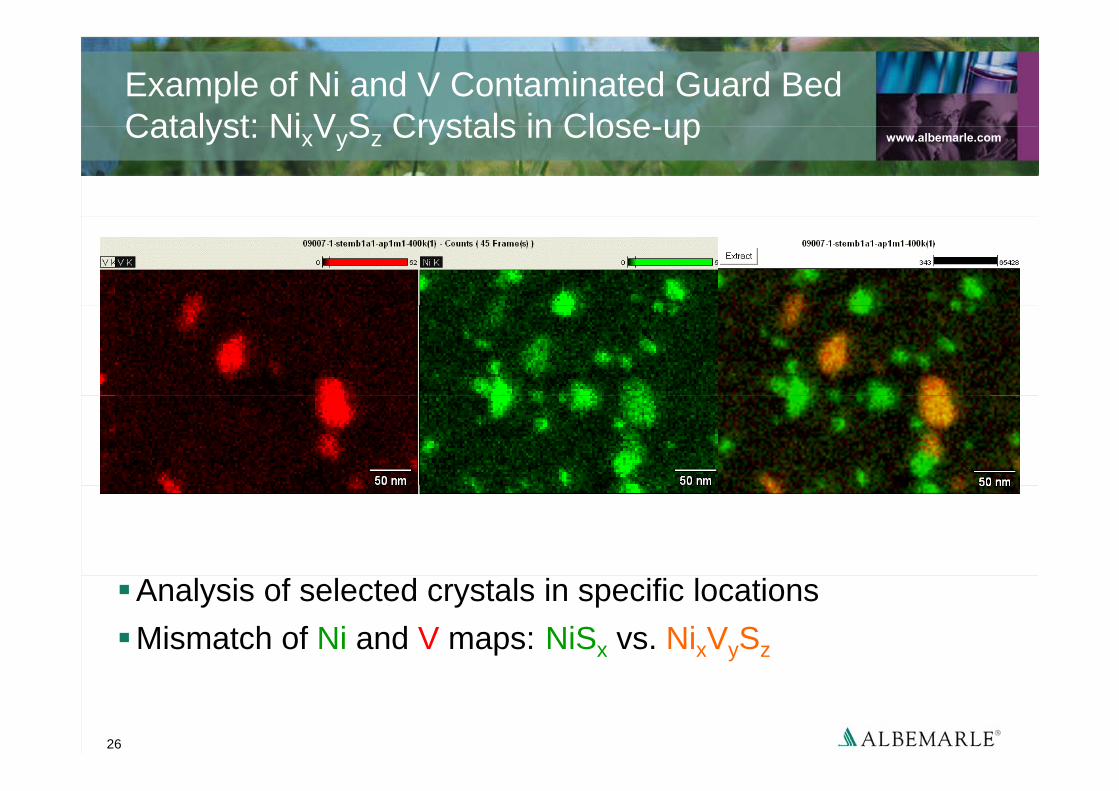
Example of Ni and V Contaminated Guard Bed Catalyst: Ni V S Crystals in Close up www.albemarle.comCatalyst: NixVySz Crystals in Close-up
Analysis of selected crystals in specific locationsMismatch of Ni and V maps: NiSx vs. NixVySz
26
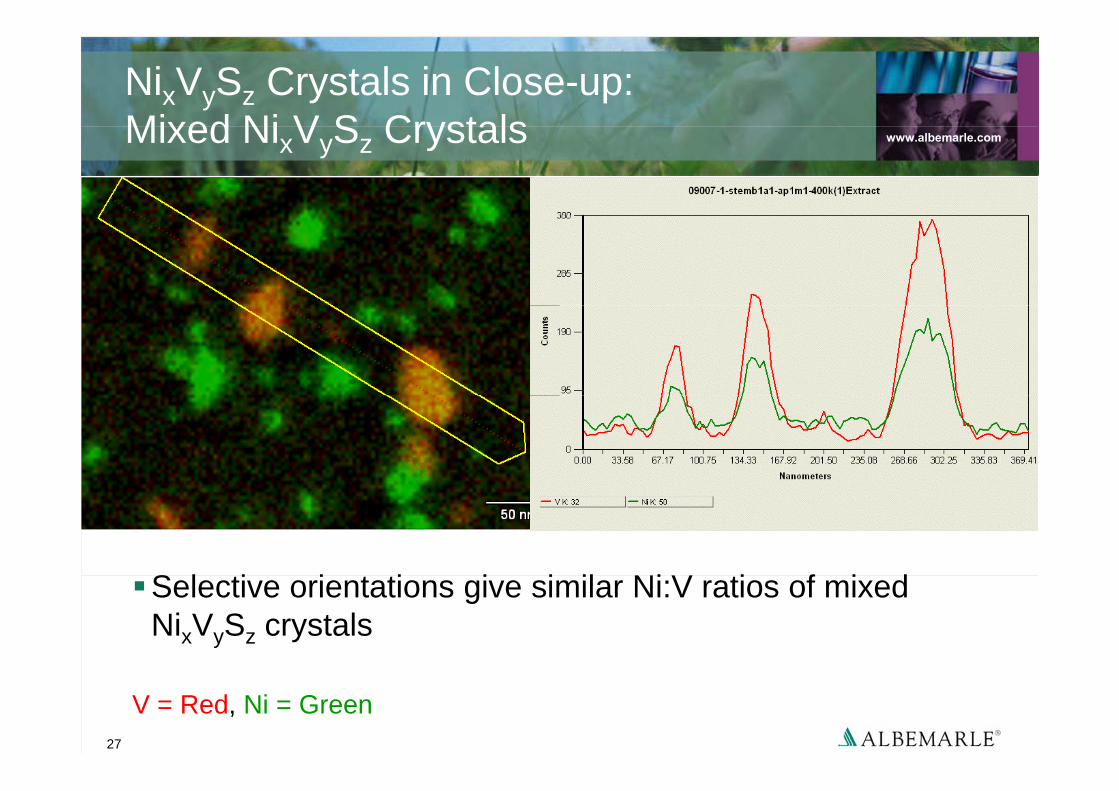
NixVySz Crystals in Close-up: Mixed Ni V S Crystals www.albemarle.comMixed NixVySz Crystals
S l ti i t ti i i il Ni V ti f i dSelective orientations give similar Ni:V ratios of mixed NixVySz crystals
27
V = Red, Ni = Green

NixVySz Crystals in Close-up: Pure NiS next to Mixed Ni V S Crystals www.albemarle.comPure NiSx next to Mixed NixVySz Crystals
Oth l ti i t ti i i bl Ni V ti fOther selective orientations give variable Ni:V ratios of mixed NixVySz crystals
28
V = Red, Ni = Green

NixVySz Crystals in Close-up: Pure NiS next to Ni V S www.albemarle.comPure NiSx next to NixVySz
Mostly observe NiS and some Ni V S crystalsMostly observe NiSx and some NixVySz crystalsNo pure VSx found: NiSx needed to remove V from oil
29
V = Red, Ni = Green
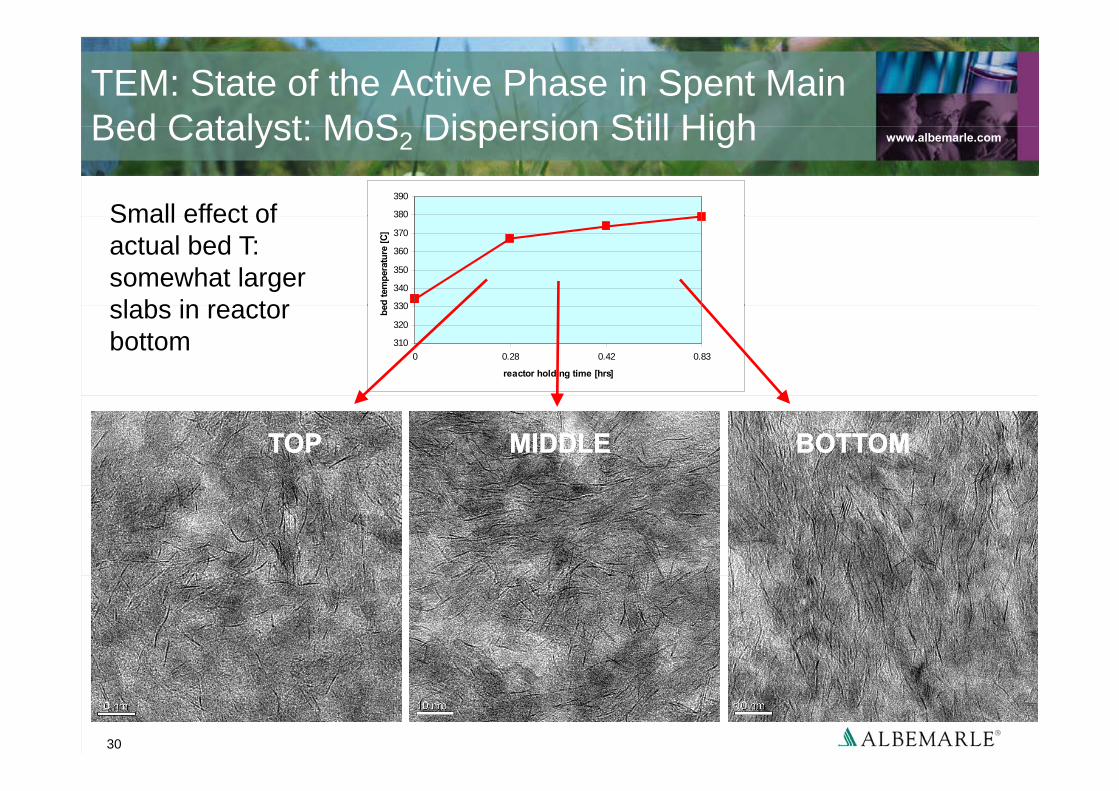
TEM: State of the Active Phase in Spent Main Bed Catalyst: MoS Dispersion Still High www.albemarle.com
380
390
Bed Catalyst: MoS2 Dispersion Still High
Small effect of
330
340
350
360
370
380
ed te
mpe
ratu
re [C
]
Small effect of actual bed T: somewhat larger slabs in reactor
310
320
330
0 0.28 0.42 0.83
reactor holding time [hrs]beslabs in reactor
bottom
TOPTOP BOTTOMBOTTOMMIDDLEMIDDLE
30

Summary: FCC-PT Catalyst Deactivationwww.albemarle.com
y y
f CCDeactivation of FCC-PT catalysts is mainly due to coke and metal deposits rather than active phase sintering:
High coke formation in reactor top and bottomHigh coke formation in reactor top and bottomLarge variety of metal deposits in guard bed and also main bed catalyst if not sufficiently protectedSeparate NiAsy and NiSx crystals as well as mixed Ni-Sx-Asy and NixVySz crystalsNo pure VS found: NiS required to remove VNo pure VSx found: NiSx required to remove VVariable concentration ratios, no core-shell crystals; crystal formation at random/anything goesSmall differences in MoS2 dispersion reactor top versus bottom, outer versus inner part of extrudates little active phase sintering
31
p g
Conclusionswww.albemarle.com
FCC-PT catalysts perform in a difficult reaction environmentAnalysis of representative spent catalyst samples is essential to understand catalyst performance and deactivationProtection of main bed catalyst by effective use of VGO demet catalyst(s) is essentialOptimize reactor loading scheme (guard bed + sequencing of
l i b d t l t ) i t f ti it / l ti itseveral main bed catalysts) in terms of activity/selectivity as well as coke resistance and H2 consumptionGood understanding of reactor zone chemistry can enhanceGood understanding of reactor zone chemistry can enhance overall system performance
Enables most effective application of existing catalysts
32
Enables most effective application of existing catalystsDrives development of improved catalysts


