

DECOMMISSIONING OF
SOUTH BAY MINE
USING
ECOLOGICAL ENGINEERING
By M. Kalin
April 1993

EXECUTIVE SUMMARY
Decommissioning acid generating mining waste generally requires perpetual lime treatment. South Bay Mine, a copper/zinc operation active between 1971 and 1981, generated 0.75 million tonnes of tailings with a pyrite content of 41 YO and a pyrrhotite content of 4 %. It is located 85 km northeast of Ear Falls in northwestern Ontario. Acid generation, based on the sulphur content, is expected to continue for a minimum of 1,110 years and a maximum of 35,742 years.
Oxidation rates in the tailings range from 76,000 mol Fe a-’ to 32,452,000 mol Fe a-I. Perpetual lime treatment, although environmentally and economically unattractive, has remained the conventional approach. The option of using Ecological Engineering for the decommissioning of the site was assessed through a feasibility study in 1986.
Ecological Engineering uses ecological principles to reconstruct ecosystems within the waste management area. These ecosystems, through their natural water cleansing capacity, transfer the annual contaminant loadings from water to sediments.
Hydrogeological studies identified the main ground water flow paths from the tailings to Confederation Lake, and from the minelmill site to Boomerang Lake. Ground water plumes and seepage paths were intercepted with diversion ditches, constructed on both the mine site and from the tailings, and directed to Boomerang Lake. Boomerang Lake was relegated to become the main polishing pond or treatment area for water from the mine site and the southern and western ground water plumes from the tailings. Decant Pond, on the tailings, also became a biological polishing pond.
Natural contaminant removal processes used in Ecological Engineering includes biological polishing for zinc and iron. Attached periphyton on brush and other substrates adsorb, co-precipitate, and sequester metals. ARUM (Acid Reduction Using Microbiology) is used for removal of sulphate and acidity. Microbial communities in chemically reducing sediments facilitate this process.
ARUM was initiated in Decant Pond in 1992, as both a physical and reducing (redox) barrier on the western beach, the entry point for acidic run-off and contaminated ground water. This process has been quantified for scale-up, through continued joint R&D, supported by CANMET, MEND and other mining companies.
Biological polishing was scaled up gradually, by annually increasing the surface area for periphyton growth. In Boomerang Lake this was done through additions of brush cuttings, whereas in Decant Pond, inert demolishing material was used to provide surface area for algal growth. In Mill Pond, the basin which contributes the largest contaminant loadings to Boomerang Lake, organic material was introduced, thereby assisting metal adsorption, ARUM and Biological polishing and overall reducing loadings to Boomerang Lake.
Boojum Research Limited i
South Bay 1992 Report for: BP Resources

From the Biological polishing studies, the contaminant removal rates and estimates of the required surface area for periphyton growth were determined. If a substrate mass with a surface area three times that of the lake bottom was added, biological polishing alone could remove 40 % of the annual loading of zinc, and 100 % of the iron. In Mill Pond, 100 % + of the annual loadings of zinc and iron could be retained, thereby reducing the overall contaminant load to Boomerang Lake. Ecological Engineering measures were implemented gradually and all measures taken at the site have resulted in a average zinc concentration of 7.6 mg L-' in 1992. Using monitoring data for Boomerang Lake, extrapolations indicate that, had no Ecological Engineering measures been implemented, zinc concentrations in the lake would likely have risen well above current levels.
Performance characteristics of the Biological polishing system are derived from the growth data, obtained in the field and the laboratory. The ranges in expected performance are large, mainly due to the limitations of methodologies for determining growth rates. In field experiments, growth can only be calculated using linear interpolation between two biomass measurements, which does not represent natural growth patterns. Furthermore, biomass which had accumulated on branches up until the time of sampling does not include that biomass which had sloughed off over the period since the last sampling time. While laboratory experiments examining periphyton growth demonstrated logarithmic growth, it was also apparent from these experiments that the waste water chemistry changes in the experimental vessel. Therefore, there are limitations during projection of laboratory-derived growth rates to arrive at estimates of Biological polishing performance in the field.
Decant Pond water quality is variable due to seasonal changes in run-off flow volumes. During periods of exceptionally high precipitation in spring and fall, elevated zinc concentrations are present. The monitoring data suggest that periphyton growing in Decant Pond effectively remove the zinc loading during the summer growing season.
Long-term trends in water quality measured in Boomerang Lake suggest that acidity and sulphate have steadily increased. Sedimentation studies indicate that iron, precipitated as solids and settled to the sediment surface, is periodically re-suspended in the lake.
In 1992, work addressing the residual contaminant loading in Boomerang Lake, Mill Pond, and Decant Pond was initiated. Processes, including ARUM and Biological polishing, are capable of removing the annual loadings, but cannot remove the entire contaminant loading which has accumulated during the estimated residence time of 3 years in Boomerang Lake.
Phosphate rock consumes acidity and precipitates metals. Any remaining (excess) dissolved phosphate, a major plant nutrient, is consumed by the periphyton population. Experimental trials using different grades of this material were first performed in the
Boojum Research Limited ii
South Bay 1992 Report for: BP Resources

laboratory, followed by field trials. When phosphate sand (750 kg) was applied to Mill Pond, significant amounts iron and aluminum were precipitated.
Phosphate powder (9 tonnes) was applied to areas around the northwest end of Boomerang Lake. While iron and aluminum concentrations in the surface waters were unaffected, concentrations of these elements decreased in bottom water overlying the sediments. The concentrations of metal precipitates increased in these sediments. Based on the increases in metals in the sediments following phosphate rock application, it was estimated that 6 % of the zinc, 74 % of the iron, and 10 % of the aluminum in the lake water were relegated to the sediment.
In 1992, five tonnes of coarse phosphate rock was applied to an area of the tailings where AMD was ponding due to the high water levels. In water leaving the area treated with phosphate rock, iron concentrations decreased from 53.5 to 12.9 mg L-' and aluminum decreased from 34.3 to 5.2 mg L-', immediately following phosphate rock application.
Full implementation of Ecological Engineering measures has not yet been completed at the site. However, the extensive site-specific data set, and the progress made in technology development, facilitated an overall mass balance of annual contaminant loadings to Boomerang Lake and contaminant removal processes (Biological polishing and ARUM).
The annual loadings of zinc, iron, sulphur, and hydrogen ions to Boomerang Lake are 3.9, 2.7, 16, and 0.1 tonnes, respectively. The estimated annual zinc and iron removal capacity, when full implementation of the Biological polishing ecosystem in Boomerang Lake is complete, is 5 tonnes and 2.7 tonnes, respectively. The estimated annual removal capacity of ARUM (in Boomerang Lake sediments), based on sulphate reduction rates and alkalinity generation measured in other field systems, is 15.7 t of sulphur and 0.09 t of hydrogen ions.
Ecological Engineering measures for the South Bay site have targeted contaminant generation by the tailings deposit, surface water loadings to Decant Pond, and surface water loadings by the mill site. The potential of the underground workings to produce seepages draining to Confederation Lake during years with high run-off was not addressed until 1992. A large diversion ditch was completed in January 1993. Its performance and the effects on Boomerang Lake will be monitored in 1993. Work addressing ARUM activity in Boomerang Lake sediments and on the tailings beach of Decant Pond will continue. The accumulated contaminant load in Boomerang Lake, Mill Pond and Decant Pond will be addressed using phosphate rock.
Boojum Research Limited iii
South Bay 1992 Report for: BP Resources

TABLE OF CONTENTS
1 . INTRODUCTION . . . . . . . . . . . . . . . . . . . . . . . . . . . . . . . . . . . . . . . . . . . . . 1
2 . MONITORING . . . . . . . . . . . . . . . . . . . . . . . . . . . . . . . . . . . . . . . . . . . . . . . 6 2.1 Introduction . . . . . . . . . . . . . . . . . . . . . . . . . . . . . . . . . . . . . . . . . . . . 6 2.2 Sampling Stations . . . . . . . . . . . . . . . . . . . . . . . . . . . . . . . . . . . . . . . 6
3.1 IntroductionlHistory . . . . . . . . . . . . . . . . . . . . . . . . . . . . . . . . . . . . . 14 3 . BOOMERANG LAKE - THE CONTAMINANT SINK . . . . . . . . . . . . . . . . . . . 14
3.2 Sampling stations . . . . . . . . . . . . . . . . . . . . . . . . . . . . . . . . . . . . . 15 3.3 Long Term Water Quality Trends . . . . . . . . . . . . . . . . . . . . . . . . . . . 17 3.4 Contaminant Loading to Boomerang Lake . . . . . . . . . . . . . . . . . . . . 20 3.5 Biological Polishing Capacity . . . . . . . . . . . . . . . . . . . . . . . . . . . . . . 24 3.6 PrecipitationlSedimentation in Boomerang Lake . . . . . . . . . . . . . . . . 27 3.7 Periphyton-Precipitate Complexes . . . . . . . . . . . . . . . . . . . . . . . . . . 29
3.7.1 Peritraps . . . . . . . . . . . . . . . . . . . . . . . . . . . . . . . . . . . . . . 33 3.7.2 Laboratory Growth Experiments . . . . . . . . . . . . . . . . . . . . 34
3.8 Total System Capacity Estimates . . . . . . . . . . . . . . . . . . . . . . . . . 37
4 . MILL POND . . . . . . . . . . . . . . . . . . . . . . . . . . . . . . . . . . . . . . . . . . . . . . . . 38
4.2 Long-Term Monitoring Trends . . . . . . . . . . . . . . . . . . . . . . . . . . . . . 41 4.3 Periphyton Growth Rates . . . . . . . . . . . . . . . . . . . . . . . . . . . . . . . . 43 4.4 Biological Polishing Capacity . . . . . . . . . . . . . . . . . . . . . . . . . . . . . . 44
5 . DECANT POND . . . . . . . . . . . . . . . . . . . . . . . . . . . . . . . . . . . . . . . . . . . . 47 5.1 IntroductionlHistory . . . . . . . . . . . . . . . . . . . . . . . . . . . . . . . . . . . . . 47 5.2 Water Quality Trends . . . . . . . . . . . . . . . . . . . . . . . . . . . . . . . . . . . 50 5.3 Biological Polishing Capacity . . . . . . . . . . . . . . . . . . . . . . . . . . . . . . 53
6 . ESTABLISHMENT OF THE NEW ECOSYSTEM . . . . . . . . . . . . . . . . . . . . . 56 6.1 Introduction . . . . . . . . . . . . . . . . . . . . . . . . . . . . . . . . . . . . . . . . . . 56 6.2 Phosphate Rock . . . . . . . . . . . . . . . . . . . . . . . . . . . . . . . . . . . . . . . 57
6.2.1 Millpond . . . . . . . . . . . . . . . . . . . . . . . . . . . . . . . . . . . . . . 57 6.2.2 TailingdDecant Pond . . . . . . . . . . . . . . . . . . . . . . . . . . . . . 60 6.2.3 Boomerang Lake . . . . . . . . . . . . . . . . . . . . . . . . . . . . . . . . 62
6.3 ARUM in Decant Pond Tailings Beach Sediments . . . . . . . . . . . . . . 71 6.3.1 Methods and Materials . . . . . . . . . . . . . . . . . . . . . . . . . . . 71
7 . MINE SITE . . . . . . . . . . . . . . . . . . . . . . . . . . . . . . . . . . . . . . . . . . . . . . . 74 7.1 Overview . . . . . . . . . . . . . . . . . . . . . . . . . . . . . . . . . . . . . . . . . . . 74 7.2 Confederation Lake Survey . . . . . . . . . . . . . . . . . . . . . . . . . . . . . . 85 7.3 Water Level Elevations . . . . . . . . . . . . . . . . . . . . . . . . . . . . . . . . . 85 7.4 Variations in Chemical Composition with Time . . . . . . . . . . . . . . . . 86
4.1 IntroductionlHistory . . . . . . . . . . . . . . . . . . . . . . . . . . . . . . . . . . . . . 38
Boojum Research Limited iv
South Bay 1992 Report for: BP Resources

7.5 Geochemical Calculations . . . . . . . . . . . . . . . . . . . . . . . . . . . . . . . 8. DISCUSSION and CONCLUSIONS . . . . . . . . . . . . . . . . . . . . . . . . . . . . .
9. RECOMMENDATIONS . . . . . . . . . . . . . . . . . . . . . . . . . . . . . . . . . . . . . .
10. APPENDICES
87
93
95
Boojum Research Limited V
South Bay 1992 Report for: BP Resources

LIST OF FIGURES
Figure 1: Confederation Lake: Phytoplankton diversity at C8 . . . . . . . . . . . . . . 13
Figure 2a: Boomerang Lake: Long-term zinc. before and after E.E. . . . . . . . . . 19
Figure 2b: Boomerang Lake: Long-term [H'] and [S] concentrations . . . . . . . . . 23
Figure 3: Boomerang Lake periphyton: Growth rates on peritraps . . . . . . . . . . 24
Figure 4: Boomerang Lake: Sedimentationlprecipitation rates . . . . . . . . . . . . . 28
Figure 5: Boomerang Lake periphyton: Mass vs . submergence time . . . . . . . . 31
Figure 6: Boomerang Lake periphyton: Iron concentrations vs . time . . . . . . . . 32
Figure 7: Boomerang Lake periphyton: Zinc concentrations vs . time . . . . . . . . 32
Figure 8: Laboratory periphyton growth rates vs . irradiance . . . . . . . . . . . . . . . 35
Figure 9: Mill Pond periphyton growth rates . . . . . . . . . . . . . . . . . . . . . . . . . . 43
Figure 10: Decant Pond (DR0)- Seasonal zinc concentrations. 1986-1992 . . . . 51
Figure 11: Decant Pond [H']. DPB - DRO, 1986 - 1992 . . . . . . . . . . . . . . . . . . 52
Figure 12: Decant Pond. Comparison of [Zn] and Acidity. 1982 - 1992 . . . . . . . 52
Figure 13: Decant Pond periphyton growth rates . . . . . . . . . . . . . . . . . . . . . . . 54
Figure 14a: Water quality in Mill Pond (MPC) before and after phosphate rock . . 59
Figure 14b: Water quality in Mill Pond (MPC7) before and after phosphate rock . 59
Figure 15: Titration curves of Tailings Run-off Water (TRO). August 14. 1992 . . 61
Figure 16: Boomerang Lake water. before and after phosphate rock . . . . . . . . . 65
Figure 17: Boomerang Lake sediment. before and after phosphate rock . . . . . . 65
Figure 18: Boomerang Lake. sediment pore water acidity titrations . . . . . . . . . . 68
Figure 19: Boomerang Lake. wood waste experiment . . . . . . . . . . . . . . . . . . . . 72
Boojum Research Limited vi
South Bay 1992 Report for: BP Resources

Figure 20: Decant and Mill Ponds. wood waste experiment . . . . . . . . . . . . . . . 72
Figure 21: Mine site piezometer water elevations . . . . . . . . . . . . . . . . . . . . . . . 83
LIST OF TABLES
Table 1: Chemistry of sampling location C1. Confederation Lake . . . . . . . . . . . . 9
Table 2: Chemistry of sampling location C8. Confederation Lake . . . . . . . . . . . 10
Table 3: Chemistry of sampling location C11. Confederation Lake . . . . . . . . . . 11
Table 4: Chemistry of piezometer M56 . . . . . . . . . . . . . . . . . . . . . . . . . . . . . . 11
Table 5: M.O.E. data on Confederation Lake . . . . . . . . . . . . . . . . . . . . . . . . . 13
Table 6: Water quality in Boomerang Lake . . . . . . . . . . . . . . . . . . . . . . . . . . . 17
Table 7: M.O.E. data on Boomerang Lake . . . . . . . . . . . . . . . . . . . . . . . . . . . 18
Table 8a: Boomerang Lake contaminant concentrations without E.E. . . . . . . . . 21
Table 8b: Boomerang Lake contaminant loadings without E.E. . . . . . . . . . . . . 21
Table 8c: Boomerang Lake contaminant concentrations and Drainage Basins . . 21
Table 8d: Boomerang Lake contaminant loadings . . . . . . . . . . . . . . . . . . . . . . 21
Table 9a: Biological polishing extrapolations . . . . . . . . . . . . . . . . . . . . . . . . . . 26
Table 9b: Periphyton Production. laboratory extrapolations . . . . . . . . . . . . . . . . 26
Table 1Oa: Periphyton laboratory growth rate summary . . . . . . . . . . . . . . . . . . . 36
Table 1 Ob: Biological removal systems, Boomerang Lake . . . . . . . . . . . . . . . . . 37
Table 11: Water quality in Mill Pond . . . . . . . . . . . . . . . . . . . . . . . . . . . . . . . . 42
Table 12: M.O.E. data on Mill Pond . . . . . . . . . . . . . . . . . . . . . . . . . . . . . . . . 42
Boojum Research Limited vii
South Bay 1992 Repon for: BP Resources

Table 13: Water quality in Decant Pond. 1886-1992 . . . . . . . . . . . . . . . . . . . . 51
Table 14: Water analyses in tailings area. pre- and post- phosphate . . . . . . . . . 60
Table 15: Phosphate rock analyses . . . . . . . . . . . . . . . . . . . . . . . . . . . . . . . . 62
Table 16a: Boomerang Lake. water overlying sediments (Aug-Oct 1992) . . . . . . 67
Table 16b: Boomerang Lake. water overlying sediments (January 1992) . . . . . . 67
Table 17: Backfill Raise historical water chemistry data. 1987-1991 . . . . . . . . . 76
Table 18: Monitoring data for piezometers MI8 and M38. 1986-1992 . . . . . . . . 77
Table 19: Mine site seepages. water chemistry in 1992 . . . . . . . . . . . . . . . . . . 79
Table 20: Backfill Raise seepages. water chemistry in 1992 . . . . . . . . . . . . . . . 79
Table 21: Sediment seepages in Confederation Lake. 1992 . . . . . . . . . . . . . . . 82
LIST OF MAPS
Map 1:
Map 2:
Map 3:
Map 4:
Map 5:
Map 6:
Map 7:
Map 8:
Map 9:
Location of South Bay Mine . . . . . . . . . . . . . . . . . . . . . . . . . . . . . . . . . 2
Mine site overview . . . . . . . . . . . . . . . . . . . . . . . . . . . . . . . . . . . . . . . . 8
Boomerang Lake sampling locations and experiments . . . . . . . . . . . . . 16
Mill Pond sampling locations and experiments . . . . . . . . . . . . . . . . . . . 39
Decant Pond sampling locations and experiments . . . . . . . . . . . . . . . . 49
Mine site sampling locations . . . . . . . . . . . . . . . . . . . . . . . . . . . . . . . . 75
Confederation Lake. C13 conductivity survey locations . . . . . . . . . . . . . 80
Confederation Lake. C13 bottom conductivities at locations . . . . . . . . . 81
New Backfill Raise diversion ditch . . . . . . . . . . . . . . . . . . . . . . . . . . . . 84
Boojum Research Limited viii
South Bay 1992 Report for: BP Resources

1. INTRODUCTION
The South Bay mine site is located 85 km northeast of Ear Falls in northwestern
Ontario (Map 1). A copper I zinc concentrator operated at the site from 1971 to 1981.
When the mine was shut down, a water management plan was developed by J.E.
Hanna Associates Inc. in February 1986, for Selco Division of BP Resources.
Perpetual lime treatment of Boomerang Lake, which displayed low pH values, and
increasing zinc concentrations appeared as the only solution to decommissioning.
Perpetual lime treatment is environmentally and economically unattractive. Alternative
options for the decommissioning of the site were sought by BP Resources. Boojum
Research Limited was retained in 1986 to do a feasibility study on the application of
Ecological Engineering. Ecological Engineering uses ecological principles to
reconstruct ecosystems. In 1986, the methods required to apply the technology were
in their infancy, but nevertheless, far enough along that the South Bay site was
considered a suitable prospect for a demonstration of Ecological Engineering as a
decommissioning technology.
The Ministry of Environment, Northwestern Region in Kenora, was informed of the
proposed approach and approval, in principal, was obtained in September 1986 for the
project. A monitoring schedule was developed by the Ministry on March 22nd, 1990.
After six years of R&D on the site, sixteen conference reports, journal articles,
government reports and book chapters have been published on the project (Appendix
A). This report summarizes the salient aspects of the Ecological Engineering measures
implemented at South Bay.
Boojum Research Limited 1
South Bay 1992 Report for: BP Resources

I I I I Northwestern Ontario I O N T A R I O
SOUTHBAY PROJECT
I LOCATION MAP
1 I I I Date: Map: 1 January, ISn3
Q U E B E C
Lake superlor
U. S. A.

Successful reconstruction of an ecosystem has to be based on a balance between
contaminant release and contaminant removal rates. Contaminant release rates are
dependent on the hydrological conditions in the tailings and on the mine site. Water
is the transport medium of the acid-generated products. To determine the contaminant
release rates, the hydrology of the site and the oxidation rate in the waste material
have to be determined.
Hydrogeological studies identified the main ground water flow paths from the tailings
and the minelmill site to Boomerang and Confederation Lakes, respectively. Analyses
of water collected from piezometers at different time intervals was used to determine
the oxidation rate prevailing in the tailings.
Ground water plumes and seepage paths were intercepted from both the mine site and
from the tailings, and directed to Boomerang Lake. Boomerang Lake was relegated to
the role of a main polishing pond or treatment area. The constructed ground water
interceptor ditches themselves served as polishing areas for treatment of contaminated
water flowing towards Boomerang Lake. To curtail contaminant loading surges to
Boomerang Lake during spring and fall, impoundments were built to pond water
draining from tailings spill areas towards Boomerang Lake.
The first step in developing the Ecological Engineering system was the rerouting of
surface water flows and interception of ground water plumes within the waste
management area away from Confederation Lake, and directing contaminants carried
in run-off towards Boomerang Lake. The second step was to quantify the contaminant
release rates, so that annual contaminant loadings could be estimated. The third step
consisted of the remediation work, which aimed to create conditions which would
remove contaminants from the water by depositing them in the sediment. Reducing
conditions have to prevail in these sediments to ensure that contaminants, including
metals, are permanently detained.
Boojum Research Limited 3
South Bay 1992 Report for: BP Resources

Contaminant removal takes place through biological polishing, where attached
periphyton adsorb, co-precipitate and collect contaminants. Biological polishing was
quantified throughout the project for the Decant Pond located on the tailings, Mill Pond
on the mine site and for Boomerang Lake. From the biological polishing studies, the
contaminant removal rates, and the required surface area for periphyton growth were
determined and formulated into a model to predict the expected performance of the
contaminant removal process.
The most challenging component of Ecological Engineering is the development of
methods which counteract acidity. A natural process which consumes acid generated
by mine wastes is microbially-mediated acidity reduction and alkalinity generation in
sediments. The appropriate conditions necessary for the microbial ecosystem to
generate alkalinity in sediments were developed at other mine sites over the course of
the project. The methodology is referred to as ARUM (Acid Reduction Using
Microbiology). Through the addition of organic matter and nutrients to the sediments,
alkalinity generation can be enhanced. In 1992, ARUM was implemented at the acid-
generating tailings beach of Decant Pond, after carrying out several laboratory
experiments to determine the suitability of various organic substrates.
The new ecosystems which are developing due to the Ecological Engineering measures
are not anticipated to remove significantly more than the annual contaminant loadings
carried in the run-off and seepage areas. A treatment method for the removal of the
contaminant load which has accumulated over the previous three years, the retention
time of Boomerang Lake, has to be found. Phosphate rock, a natural product mined
by Texasgulf and used for the fertilization of acidic soils, appears suitable for this
purpose. A one-time application of phosphate rock will neutralize the accumulated
acidity and remove metals and provide more suitable conditions for algal growth. With
provision of adequate substrate surface area, sufficient removal rates of contaminants
by Biological polishing can be anticipated.
Boojum Research Limited 4
South Bay 1992 Report for: BP Resources

In 1992, tests with different grain sizes of natural phosphate rock were carried out in
Boomerang Lake, Mill Pond, and on the tailings. The results of the scale up on ARUM
and the phosphate rock are preliminary and reported under ongoing research activities
in Section 6.
Boojum Research Limited 5
South Bay 1992 Report for: BP Resources

2. MONITORING
2.1 Introduction
An agreement was reached between the Ministry of Environment and BP Resources
to surrender the mining leases to the Crown and define a restricted use for the waste
management area of 75 ha. This area is defined in the letter of March 20*, 1992 from
the Ministry to BP Canada Ltd. The objective is to retain contaminants within the waste
management area.
2.2 Samdina Stations
The monitoring stations are given in Map 2. The data for C1 (Boomerang Lake oufflow
in Lost Bay), C8 (boat landing bay of Confederation Lake close to the Mill site), and
C11 (drainage from the tailings basin to Confederation Lake) are summarized in Tables
1 to 3, from the beginning of monitoring in 1986 to 1992.
The sampling location, C1, was moved to the mouth of Boomerang Lake in 1991.
Previously, it was about two to three meters away from the lake oufflow in Lost Bay.
The pH, zinc and sulphate, along with the acidity, were consistently higher than the
regular sampling station, C1, and reflected the conditions in Boomerang Lake. In 1992
the official station was sampled again, and contaminant concentrations in water were
found to be at or below normal levels (Table 1).
The year 1992 represented a period of very high precipitation, with a corresponding
high surface run-off. The subsequent higher zinc loadings were noted as slightly higher
zinc concentrations at sampling stations C8 and C11 (Tables 2 and 3).
Boojum Research Limited 6
South Bay 1992 Report for: BP Resources

If elevated contaminant concentrations were detected in Piezometer M56 (Map 2), this
would indicate that a ground water plume is moving from the tailings towards
Confederation Lake. This piezometer has been regularly monitored (Table 4).
Boojum Research Limited 7
South Bay 1992 Report for: BP Resources

I
Water sampllng locatlon
Decant Pond
200 400 H I I I I I
Metres
Confederation
MINE SITE OVERVIEM


In October 1992, piezometer M56 showed 1.1 mg L-’ zinc, the highest value reported
for this station over the monitoring period. Zinc concentrations otherwise ranged from
0.01 mg Lml to 0.5 mg L-’. Because of the unusually high water levels, shore samples
were also collected in 1992. The low zinc concentrations (0.103 mg L-’ of zinc)
suggesting little impact to date.
The monitoring data collected by MOE for the project are summarized in Table 5. It
can be noted that MOE data for zinc, sulphate and acidity are generally lower than
corresponding data reported by Boojum. MOE pH data are generally slightly higher
than corresponding Boojum data. This is likely due to differences in laboratories and
the time span which elapses between chemical analysis and sampling. As all the
Boojum samples are filtered through 0.45 p m filters and acidified within 24 h, it is not surprising that the Boojum contaminant concentration data are higher, as less time is
allowed for chemical precipitation. Boojum’s QA/QC procedures are given in the
Appendix D.
In 1992, exceptionally high precipitation caused above normal run-off. The resulting
high water table produced seepages which surfaced on the mine/mill site in 1992.
Therefore, above normal levels of zinc were noted in Confederation Lake at station C8
near the beach of the minelmill site (Map 2; Tables 2 and 5).
Phytoplankton diversity in surface water samples has been monitored once to several
times per year at the C8 station. Although the zinc concentrations have increased
noticeably at station C8, the species diversity of phytoplankton, monitored voluntarily
at that station, has not changed since 1986 (Figure 1).
To gain a more complete understanding of the mine site conditions, a geophysical
survey and extensive water sampling campaign were initiated during 1992. These
investigations lead to the decision to construct a deeper diversion ditch extending
further into the mine site, in order to drain a larger volume of water from the mine site
Boojum Research Limited 12
South Bay 1992 Report for: BP Resources


3. BOOMERANG LAKE - THE CONTAMINANT SINK
3.1 IntroductionlHistorv
Boomerang Lake is 1.2 km long, and 400 m wide along its widest transect. This
shallow lake has a maximum depth of about 5.2 meters near station B4 (Map 3), with
a mean depth of 4.0 m. The lake has a volume of just over 1 million m3 and a surface
area of 24 ha. Because the lake is shallow, the water is well mixed throughout the ice-
free season. The annual base flow from the drainage basin to Boomerang Lake is
estimated at approximately 344,000 m3 a-', which results in a retention time of
approximately 3 years.
The pH in Boomerang Lake had been dropping gradually for over 10 years, from a pH
of about 6.3 in 1979, to a pH of 4 in 1986. Attached periphyton, which contain high iron
and high zinc concentrations, were found growing on branches suspended in the lake.
It was proposed that, through increasing the surface area for periphyton growth,
biological polishing could remove enough zinc to maintain the zinc concentration at
current levels and, as the population's standing biomass increased with time, reduce
the zinc concentrations in the lake.
Research over the last several years has been carried out to quantify periphyton growth
and metal removal in Boomerang Lake. Along with the quantification of the biological
polishing process itself, measures were taken to reduce the contaminant loading from
all sources to Boomerang Lake, through implementation of the same process at the mill
site and in the ground water diversion ditch. The phytoplankton community was
monitored and found to have a very similar composition to that of acid lakes on the
shield, where the acidification is due to acid rain (Kalin et al. 1989b).
The sediments in Boomerang Lake are the ultimate recipients of the algal biomass and
co-precipitates formed in the zinc-contaminated lake. Since these sediments have high
Boojum Research Limited 14
South Bay 1992 Report for: BP Resources

zinc concentrations, it is essential to keep them under reducing conditions. To provide
such conditions, a sediment cover comprised of an acid-tolerant moss was envisaged.
Moss populating an acidic pond in the Backfill Raise area was transplanted to
Boomerang Lake. While the moss grew well in the first two years, monitoring of moss
growth was complicated following placement of brush in the same areas. This brush
was added in order to provide surface area for periphyton. In retrospect, this was an
error since, first, it was no longer possible to monitor the moss growth, as it was
impossible to manoeuvre in the brush-covered areas with a boat; and second, the
overlying brush and periphyton blocked light reaching the underlying moss. The current
status of the moss population is unknown. Meanwhile, work on sediments in
Boomerang Lake had been suspended until 1992.
3.2 Samplinq Stations
Water quality monitoring has been ongoing in Boomerang Lake since 1971. Most of
the water sampling has been done at station B9 which is at the boat landing (Map 3).
Additional locations were sampled more frequently; B1 and B2 are at shallow (<0.5 m)
locations at the outflow end of the lake. B11 is located in the bay into which Mill Pond
run-off water enters. Station 87, 88, B9 and B10 are located at the shore where tailing
spills entered the lake. B12 was set up as a "control" shore station, where clean or
uncontaminated run-off enters the lake. The stations 83, B4, B5 and B6 are located
in the centre of the lake.
Overall, water quality data for the lake shows only minor variation according to
location. Uniform conductivity and pH profiles, and the lack of a thermocline over the
water column, indicate that the lake is thoroughly vertically mixed during the ice free
season. Boomerang Lake data from all sampling stations, including Boojum, BP and
MOE data, were pooled to determine long term trends in water quality.
Boojum Research Limited 15
South Bay 1992 Report for: BP Resources

Boomerang
150 kg. code 30 phosphate rock
Boojum Research Ltd.
SOUTHBAY PROJECT Northwestern Ontario
BOOMERANG LAKE Water sampling location SAMPLING LOCATION MAP - Conductivity survey station
SHOWING - Code 30 phosphate rock distribution Metres -- Log Boom
'HOSHATE ROCK DISTRIBUTION
)ate: Map: 3 January, 1992


capture these solids as well as new solids entering or forming in the lake due to run-off.
In fact, the highest sedimentation rates were found in B4 and B6 sediment traps in the
north and west end of the lake, the same areas receiving the brunt of the prevailing
northwest winds. Such wind-driven re-suspension of sediments is common in shallow
lakes, where as much as 16 g m” d-’ of solids (compared to 0.77 g m-’ d-’ in the
current scenario) can be traced to re-suspension (Ten Hulscher et al. 1992).
The same calculation can be applied to zinc. In this case, the zinc content of the
trapped solids (5887 pg gdw-‘) was multiplied by the estimated cumulative mass of
trapped solids over 1 year, then by the lake area. From this calculation, an estimated
395 kg of Zn are settling to Boomerang lake sediments per year. If this quantity of zinc
is added to the estimated 1.6 t of zinc captured by periphyton, then 50 % of the annual
zinc loading is being removed by biological polishing and suspended solid settling.
This estimate of zinc removal by biological polishing is based on several parameters,
where large variation in the estimated available surface area, and inherent variability
in the methodology used to determine growth rates of the attached periphyton exist.
Given that these two parameters are key factors in the evaluation of the overall
capacity of the system, they are discussed in more detail in the next sections.
3.7 Periphvton-Precipitate Complexes
Periphyton have been shown to accumulate zinc and other metals through adsorption
and precipitate sieving. Subsequently, in Boomerang Lake, precipitates are typically
imbedded in the periphyton biomass attached to substrates. This mixture could be
termed the periphyton-precipitate complex (PPC). In order to assign periphyton
populations the role of removing large quantities of dissolved and precipitated
contaminants, the growth of these populations and scale-up potential must be
assessed.
Boojum Research Limited 29
South Bay 1992 Report for: BP Resources

Between 1987 and 1991, brush and trees from the area around the South Bay mine
site, primarily black spruce, were added to provide surfaces for periphyton growth to
areas of Boomerang Lake where the substrate could be contained by log booms.
Brush and spruce trees were placed in Boomerang Lake in 1987, 1988, and 1990. In
1987, 260 trees were distributed over four areas. The two areas which received the
greatest amount of substrate were near the oufflow (B2), and the area where Mill Pond
outflow enters the lake ( B l l ; see Map 3). In 1988, more substrate was added to B2
area; each tree was tagged, in order that the newer trees could be differentiated from
trees added in the previous year. In 1991, 30 truck loads of brush and trees were
placed in the vicinity of station B8. With substrates placed in Boomerang Lake in three
separate years, it was possible to set up a sampling program to test the effect of
submergence time on the establishment and development of periphyton within the
periphyton-precipitate complex (PPC).
Figure 5 shows the mass of PPC found on spruce branches submerged for different
lengths of time. The mass of PPC per gram of spruce branch was at a maximum after
1 year of submergence. Since then, with the exception of 1989, the average mass of
PPC per gram of spruce branch has remained fairly constant, at just above 0.4 gdw
PPC per gram of spruce branch.
Boojurn Research Limited 30
South Bay 1992 Report for: BP Resources

Fig. 5: Boomerang Lake Periphyton Mass vs. Submergence Time
1.21
I 0 1 2 3 4 5
Years of Submergence
While the mass of PPC on branches has remained relatively constant over the last 5
years, the percentage of iron in the PPC has not. Iron concentrations in the PPC from
Boomerang Lake have been increasing since measurements began in 1986 (Figure 6).
At the same time, zinc concentrations in the PPC have been decreasing (Figure 7).
Thus, while PPC mass has remained constant, the LO1 has decreased each year,
suggesting that the precipitate portion of the PPC is increasing.
Since the pH of Boomerang Lake is around 3.5, zinc removal from water cannot be
through direct precipitation, but must be occurring by co-precipitation or adsorption.
Two observations suggest that zinc uptake by the PPC is directly dependent upon
adsorption by living periphyton biomass component, and not via co-precipitation of zinc
upon formation of iron precipitates captured by the periphyton-precipitate complex.
First, given that precipitate portion of the PPC is increasing, the periphyton portion must
be decreasing; the gradual decrease in zinc removal by the PPC is, therefore, likely
due to the diminishing fraction of periphyton in the PPC. Second, if the primary form
of zinc removal was co-precipitation with iron, then zinc and iron concentrations in the
PPC should be correlated, which is not the case.
Boojum Research Limited 31
South Bay 1992 Report for: BP Resources


From quantification of the PPC biomass on substrates over several years, it is evident
that the PPC biomass per unit of substrate has remained relatively constant. However,
quantification of standing biomass, alone, provides no information concerning the
production rate of new biomass, nor the rate at which biomass is lost from the substrate
by sloughing. This information is required for estimating the long term performance of
biological polishing using periphyton populations.
Large patches of PPC biomass accumulated on branches likely slough many times
each year, due to wave action during storms and to abrasion by ice during spring
break-up. Remaining periphyton is the older layers which were tightly bound to the
substrate surface beneath the sloughed patch. The long term trend of increasing iron
content and decreasing zinc content may reflect this sloughing process. In light of
these observations, a field method for quantifying biomass growth and biomass loss by
sloughing was developed.
Experimental devices, containing panels of substrate held in place with netting, were
positioned horizontally below the water surface of Boomerang Lake. Plastic bags were
positioned below the panels in order to trap any biomass sloughed from the substrate.
The set-ups were periodically recovered. The biomass was quantified which collected
on the substrate, on the netting and in the bag. Therefore, using these set-ups called
Peritraps, substrate surface areas were provided so that growth and sloughing rates
could be estimated.
3.7.1 Peritraps
Peritraps were placed in Boomerang Lake at B2 and B11 (Map 3). The PPC biomass
was periodically sampled weeks to months following set-up. From these data, PPC
growth rates were as high as 3.6 gdw m-’ (subst) d-’, measured over July 1991. As
expected, growth rates were lowest in winter; as little as 0.4 gdw m-’ (subst) d-’ grew
Boojum Research Limited 33
South Bay 1992 Report for: BP Resources

over the winter of 1991/1992 (Figure 3). The overall average PPC growth rate over the
two year study period was 1.43 gdw m-‘ (subst) d-i.
Because the peritraps were sampled weeks to months following set-up, variation in
growth rates over the incubation period is unknown. Therefore, when estimating growth
rates, the simplest relationship, linear, between biomass and time has to be assumed,
according to the relationship, GR = (W2-wl)lAt. However, in all likelihood, growth of PPC biomass in the peritraps over the weeks of incubation started with an initial
colonization phase characterized by slow growth, followed by exponential growth, then
moderate growth, depending on the extent to which substrate surface area was cleared
by sloughing. In order to examine these phases in more detail, growth rates were
measured in the laboratory, where exponential growth could be evaluated.
3.7.2 Laboratow Growth Experiments.
Growth rates of Ulothrix, a filamentous green alga collected from Decant Pond, were
measured in laboratory cultures supplied with Boomerang Lake water. Cultures were
incubated at 25°C under daylight fluorescent bulbs providing a 12:12 h 1ight:dark cycle.
In some treatments, Boomerang Lake water was amended with nitrate and phosphate.
Relative growth rates, in % per day, were calculated from the algal biomass fresh
weight gainlloss measurements made two weeks after set-up. The relative growth
rates, presented in Figure 8, were highest in those treatments that both received
additional nutrients (nitrate and phosphate) and the highest irradiance (400 p E m-* s-’,
equivalent to 1/4 full sunlight). The highest growth rate, calculated as a logarithmic
growth rate (RGR= 100*ln(W2 WI-’) At”), was 0.4 % per day. This means that the
periphyton added 0.4 % to the biomass each day. Because clumped periphyton
biomass in the laboratory set-ups was grown under low light intensities and was
supplied with a finite amount of nutrients, these growth rates are poor compared to field
Boojurn Research Limited 34
South Bay 1992 Report for: BP Resources

growth rates. In the field, periphyton population structure, light and nutrient conditions
are more favourable for growth.
Fig. 8: Decant Pond Ulothrix Growth Rates
PO4 t NO3
0.4 ,,-t
-'-I I . 0 i0 160 150 260 280 300 380 460 1
lrradiance (uE/sq. m/s) i0
In another series of experiments, one-tenth of the biomass used in the experiment
above (approximately 0.1 gfw) was fragmented in a Waring Blender, and pipetted into
500 mL jars. After about 1 week, algal biomass was quantified by filtering material
through a filter paper, drying and weighing.
Relative growth rates are shown in Table IOa, according to the culture solution used
and amendments added. Although similar growth conditions were provided as before,
with the lower initial biomass, much higher growth rates by periphyton were achieved.
Boojum Research Limited 35
South Bay 1992 Report for: BP Resources


In field experiments, sulphate removal rates from water overlying ARUM sediments
ranged from 0.22 to 0.63 g S m-’ d-’. Hydrogen ion decreases ranged from 2.5 to 2.7
mmol m-’ d”. Using these rates, assuming an active ARUM sediment in Boomerang
Lake, the following removal rates were calculated based on a short, 150 day, growing
season. As seen in Table lob, removal of the annual sulphate and hydrogen ion
should be near complete when ARUM sediments are in place. Sediment-based
microbial activity is not limited to a summer growing season, as temperature
fluctuations in the sediments are greatly attenuated, compared to the overlying water.
Again, conservative estimates were used to estimate these capacities upon scale-up.
In conclusion, the estimates presented above were based on certain assumptions and
field measurements of removal rates. These field measurements reflect wide
variations inherent in dealing with natural ecosystems. However, using conservative
values from the available data, the proposed Ecological Engineering approach will
produce a balanced ecosystem capable of matching the annual contaminant loadings.
4. MILL POND
4.1 IntroductionlHistorv
Contaminant mobilization from the mill site is complex and difficult to quantify. Sources
consist of unknown amounts of mine development rock and an unknown quantity of
spilled and wind-distributed copper and zinc concentrate.
Analysis of data from a number of piezometers on the mill site indicates that ground
water was moving both in the direction of Boomerang Lake and Confederation Lake.
The ground water could potentially be driven by the water head in Mill Pond, and hence
efforts were made to reduce contaminants in Mill Pond (Map 4).
Boojum Research Limited 38
South Bay 1992 Report for: BP Resources

W W
LEGEND
NPK (la-6-12] fertlllzer distrlbutlon
Miff Pond
0 25 50 P
Metres
MILL POND SAMPLING LOCATION MAP
SHOWING PHOSPHATE ROCK and NPK DISTRIBUTION
4 Date: Map: January, lss9

The concentrations of metals in Mill Pond in 1986 were extremely high, and only a very
sparse algal populations could be seen along the west side of the pond. Nutrients and
organic matter were added to plots on this beach on an experimental basis. Periphyton
in Mill Pond noticeably responded to added amendments. A further experiment was
carried out at the oufflow of Mill Pond to determine the adsorption capacity of sawdust
for metals. These experiments were also promising, with high concentrations of metals
found in sawdust and reductions of metals in the water.
Cattail transplant experiment results were not nearly as promising. Cattails were
transplanted by several means, including hand-transplanting to sediments, transplant
to floating mats and mechanical transplant of entire blocks of cattail rhizome and
sediment. Although plants survived the first months following transplant, none survived
beyond the first or the second year after transplant.
It was concluded that more adsorptive organic matter had to be placed into Mill Pond.
Several truck loads of sawdust were distributed into Mill Pond, followed by several truck
loads of hay in 1989. These measures proved successful, indicated by an extensive
algal population present by the summer of 1990.
Along with the addition of organics to Mill Pond, three retention ponds were constructed
in the run-off area of Mill Pond (see Map 6, page 75). In these ponds, extensive
vegetation and periphyton growth provides biological polishing, thus reducing the
loading of metals and acidity to Boomerang Lake.
Boojum Research Limited 40
South Bay 1992 Report for: BP Resources

4.2 Lonq-Term Monitorina Trends
Mill Pond water has been intermittently sampled since 1977. During operations, large
fluctuations in contaminant concentration data were noted, likely due to occasional
liming, and irregular sampling. During demolition of the mine site, further changes in
contaminant loadings were induced. By 1990, flows and contaminant loadings to the
pond could be considered stable; monitoring data are summarized starting in this year,
and up to 1992. The average pH at the outflow of Mill Pond was about 3.5 (Table 11).
Zinc concentrations in Mill Pond reached as high as 1000 mg L-' in 1979, but have
since stabilized in the last three years, and range from 200 to 300 mg L-'. Sulphate
concentrations in Mill Pond reached as high as 2700 mg L-' in 1982, but have since
declined, remaining within the range of 714 to 1815 mg L-' over the last three years.
Acidity was only occasionally measured in Mill Pond until recently. Over the last three
years, acidity has ranged from around 130 to a high of 820 mg L" CaCO, equiv.
According to MOE data (Table 12), the acidities in 1991 and 1992 were the lowest
recorded.
Iron concentrations varied widely in Mill Pond, ranging from 4 mg L-' to 51 mg L-' in the
last three years. Since 1986, the time at which liming stopped, copper concentrations
have decreased dramatically. For example, in 1986, copper concentrations as high as
95 mg L-' were recorded. By 1992, the highest recorded concentration was 25 mg L-'.
This is a reduction of nearly 75 %.
Boojum Research Limited 41
South Bay 1992 Report for: BP Resources

'able 11: I Date
Ass.# Location
Code
PH Cond c u Fe
SO4 Zn
Date Ass.#
Location
Code
PH Cond c u Fe
SO4
16-05-91 2669 Mill
Pond OutFlow
FA 3.8
1390 7.2
14.1 71 4 107
18-07-92 3848 Mill
Pond Outflow
FA 3.65 1650
14 18.6 1170 233
ill Pond 23-06-90
1782 Mill
Pond
FA 2.4
38 15
1566 320
26-07-91 3014 Mill
Pond Weir-Bott
FA 3.12 1300
21 32
1593
25-06-91 2869 Mill
Pond Near Qua'
FA 3.6 820 7.67
10 81 0 139
14-08-92 4032 Mill
Pond Outflow
FA 3.69 1800 14.3 36.8 1341 191 Zn
* -
Table 12: P Location
Mill Pond Mill Pond Mill Pond Mill Pond Mill Pond Mill Pond Mill Pond Mill Pond Mill Pond
Mill Pond
282 determine
)E Dats SCode
MPO MPO MPO MPO MPO MPO MPO MPO MPO
MPRO MPRO MPO
ater San 16-06-90
1805 Mill
Pond Outflow
FA 2.7
34 4.4
1515 298
13-07-92 3841 Mill
Pond Outflow
FA 3.25 21 00 25.2 18.9 1497 329
iy Boojun
n Mill Pond Date
25-013-82 10-Apr-83 12-Jun-84 17-Sep-84 28-Aug-85 22-OCt-85 16-OCt-89 12-OCt-90 16-May-91 16-May-91 16-May-91 26-Aug-92
les 11 -1 0-90
2282 Mill
Pond by Dam
FA 3.66 2400
19 48
1386 175
13-07-92 3842 Mill
Pond Oufflow
FA 3.17 2100 23.1 10.2 1470 308
Zn mg/L
71 0 280 580 330 600 51 0 400 300 97 22 62
200
2456 2990 2953
3.0 2750 3.2 2655 3.4 803 4.9 3.8 479 3.3 1377
26-07-91 3013 Mill
Pond Weir-Top
FA 3.08 1400
25 51
1815 320
16-1 0-92 4240 Mill
Pond Outflow
FA 3.34 2320 26.1 15.5
* 1440 278
Acidity mg/L
1398 842
1388 81 5
1462 1306
185 41
128 368
Boojum Research Limited 42
South Bay 1992 Report for: BP Resources

4.3 Periphvton Growth Rates
Periphyton population expansion in Mill Pond commenced in 1990. Since then, the
greatest population densities have been found in the narrow region just prior to the
outflow of the pond, and below the pond in the area of Mill Pond Run-Off (Map 4).
Ulofhrix is the dominant periphyton species in narrow region and in the run-off
area.These populations are coated with metal precipitates.
Growth of Mill Pond periphyton was measured in 1991 (Kalin and Wheeler 1992) and
again in 1992. Three methods were used to quantify the growth. Large differences are
noted between limnocorrals (enclosures), quadrats and periplates (horizontal artificial
substrate). The highest growth rates were measured in the quadrats (Figure 9), where
up to 32 gdw m- d were estimated. As in Boomerang Lake, the biomass consisted
not only of algal biomass, but a large amount of precipitates as well, despite utilization
of the same washing procedure. Overall, the combined data from all method used to
measure growth suggest that primary production in Mill Pond is high.
2 -1
Fig. 9: Mill Pond Periphyton Growth Rates
Growth Period
Boojum Research Limited 43
South Bay 1992 Report for: BP Resources

The specific conditions for biological polishing in Mill Pond are quite different than in
Boomerang Lake, where iron precipitate formation and sieving by PPC is the dominant
process. In Mill Pond, periphyton are covered to a much less degree by iron
precipitates, resulting in a different zinc polishing capacity.
The periphyton growing in the run-off area below Mill Pond are bright green, and
contain 200 times less iron, but 100 times more zinc and twice as much copper, as
periphyton growing directly in Mill Pond. Given that zinc concentrations in these
populations are as high as 2 % of dry weight, Mill Pond area periphyton populations are
contributing to biological polishing to a much larger degree than the Boomerang Lake
population.
4.4 Biological Polishing Capacitv
The growth rates determined from field experiments in Mill Pond were used to
extrapolate the quantity of zinc which could be removed by biological polishing
processes in Mill Pond. Growth rates are based on the surface area of the substrate,
in this case, periplates and pond bottom. The same rationale was used for Mill Pond
as was used for Boomerang Lake. The field growth rates are presented together with
Boomerang Lake data in Table 9a. The minimum growth rates in this table were
calculated using the average of the time-weighted growth rates plotted in Figure 9. The
substrate surface area used was either one, or three, times the surface area of the
pond.
Zinc concentrations in Mill Pond periphyton have been periodically determined since
1990. The periphyton sample with the highest zinc concentration was used as the
maximum in Table 9a, and the average zinc concentration in periphyton collected in
1992 used as the minimum value. These represent the concentrations of zinc which
can be sequestered in each gram of periphyton. By multiplying this concentration by
Boojum Research Limited 44
South Bay 1992 Report for: BP Resources

the primary productivity, a zinc removal rate is calculated. This is expressed in grams
of zinc removed per day in the pond. By further multiplying this rate by the length of
the growing season over which the periphyton would be expected to grow each year
(150 days), the total concentration of zinc removed per year by periphyton can be
estimated.
The zinc loading to Mill Pond from the mine site can be roughly estimated by
calculating the base flow of just that portion of the drainage basin which flows into Mill
Pond. This area was computed to be 5.2 ha. Using average annual precipitation data
for the area, a base flow of 13,200 m3 a-’ is calculated for Mill Pond alone.
By multiplying this flow by the average concentration of zinc in Mill Pond in 1992, a zinc
loading can be estimated. These calculations suggest that Mill Pond should have a
zinc loading of around 3.5 tonnes per year. Comparing the annual zinc loads to that
removed by periphyton, it can be seen that periphyton with a maximum growth rate,
and growth surface area ratio of 3, would be able to remove 16 % of the zinc loading
directly in Mill Pond. On the other hand, using minimum growth rates and a surface
area ratio of 1, only 0.9 % of the zinc load would be removed.
In Figure 8, the data presented demonstrate that growth rates determined in the
laboratory were stimulated with increasing light intensity and with the addition of
fertilizer. Precipitates which accumulate on the surface of periphyton must block some
light. Therefore, the growth rates of periphyton which do not harbour as much
precipitate can be expected to be higher than PPC containing a large fraction of
precipitate. For example, using the growth rates by precipitate-free algae in the
laboratory of 7.3 % d-’, and zinc concentrations of 20,000 pg gdw-‘, used in the
calculations in Table 9b, it is possible that 135 % of the annual Mill Pond zinc loading
would be removed.
Boojum Research Limited 45
South Bay 1992 Report for: BP Resources

To anticipate that biological polishing will be very effective in Mill Pond is not an
unrealistic projection, as experiments with phosphate rock indicate that it will increase
the pH and reduce the acidity, which in turn will result in a more active ARUM sediment
in Mill Pond. A complete periphyton cover over the sediments in Mill pond will also
reduce the quantity of suspended solids.
In summary, the biological polishing capacity estimated from the data collected to date
is likely very conservative. The reductions in contaminant loadings from Mill Pond to
Boomerang Lake will be significant in terms of the overall performance of the system.
Boojum Research Limited 46
South Bay 1992 Report for: BP Resources

5. DECANT POND
5.1 IntroductionIHistorv
In the first year of the project, an evaluation of the existing reclaimed tailings area was
made, with respect to the longevity of the introduced vegetation cover. It was
concluded that sufficient native species had started to colonize those areas where
reclamation measures were successful. Areas covered by exposed gravel were
sparsely populated by moss. From examination of pits dug into the tailings in 1990,
oxidation is primarily occurring in the vadose zone below the gravel I vegetation cover
(Kalin et al. 1991). The tailings cover was considered stable in the long term and no
further measures were needed.
This was not the case for Decant Pond, where lime sludges in the pond bottom,
containing high concentrations of zinc, needed to be stabilized. Acidic run-off evident
along the tailings beach, if unabated, will likely cause Decant Pond to acidify in the long
term, and subsequent re-solubilization of zinc would occur. Although extensive cattail
populations were present along the perimeter dam forming a section of the Decant
Pond shore, the tailings beach was void of cattails. This beach consists of natural
muskeg, which re-emerged above the pond surface following the breach ofthe overflow
dike when milling ceased in 1981. Decant Pond received periodic lime additions, which
were suspended when the Ecological Engineering project started.
In 1986, the pH of Decant Pond was 6.5 to 7.5, and populated by extensive periphyton
mats. During studies of these populations, it was found that the biomass contained
high concentrations of zinc. Periphyton mats grew on any available surface in the
pond. Experiments were initiated to quantify the growth of periphyton. It was
concluded that mine site demolishing material, which did not contain metals, i.e. wood,
plaster, and insulation, provided excellent growth surfaces for the periphyton. Those
Boojum Research Limited 47
South Bay 1992 Report for: BP Resources

materials available from the demolition of the mill, mine and concentrator were used to
scale up the periphyton growth in Decant Pond.
In addition, floating cattail mats were developed, which would provide further organic
matter to sediments covering the hydroxide sludges. A total of 20 rafts of cattails were
installed, providing the beginning of cattail islands. The water level in Decant Pond was
raised slightly in 1990, to order to increase the cover of the cattail stands along the
beaches. Although the overall cattail population has survived to date, Decant Pond
became a habitat for muskrats, who consumed the floating cattails.
Several studies addressed the acid generation in the tailings. It was found that iron
precipitation takes place as the water level fluctuates in the tailings mass. Most of the
tailings deposit is subject to water fluctuations and generates acid. Measures were
taken to install a barrier of reducing conditions (ARUM) along the acid generating
tailings beach in 1992 (Map 5). The organic material used was decaying wood slabs,
a byproduct of logging. This material had been tested in the laboratory for its suitability
to stimulate microbial activity. Initially, these wood wastes will add organic acidity to
Decant Pond, which may decrease the pH in the short term.
In 1992, water levels were very high and AMD remained ponded on the tailings during
the entire summer. A coarse phosphate rock material was applied to the tailings to
neutralize and remove iron in the ponded AMD before it flowed towards the ARUM
reducing barrier (Map 5). The results of these measures can only be assessed over
the next several years.
Boojum Research Limited South Bay 1992 Report for: BP Resources

r 3 z 0 a
P (D
Road
Booium Research Ltd.
SOUTHBAY PROJECT
TAILINGS Northwestern Ontario
WASHED PHOSPHATE ROCB AND DECAYING WOOD SLAB
D I S T R I B U T I0 N
5 Date: Map: January, 1892

5.2 Water Qualitv Trends
Decant Pond is about 340 m long and 186 m wide. It has a mean depth of 0.8 m. The
pond covers an area of 4.4 ha, and has a volume of 37,700 cubic meters. Due to
ground water flow and precipitation, the pond has an overflow of approximately 2.2 L
s-I. Map 5 shows locations of sampling stations, including DRO (Decant Run-Off), DPC
(Decant Pond Centre) and DPB (Decant Pond Beach).
Although the pH of Decant Pond has been very variable, it was overall slightly lower
in 1992 than previous years, probably due to higher inflow of acid from the ponds on
the tailings and organic acid released by the wood wastes. The average, minimum and
maximum values of zinc, pH, acidity, and sulphate concentrations are reported in Table
13 for the years of 1986 to 1992. The data were examined to determine whether there
were any noticeable seasonal or long-term trends. Seasonal changes in the zinc
concentrations are evident since 1988 (Figure 10) at DRO, the outflow; elevated zinc
concentrations (> 10 mg L-’) are restricted to spring and fall run-off.
Run-off from the tailings (TRO, Map 5) has contributed acidity to Decant Pond in 1991
and 1992. By plotting the difference in hydrogen ion concentration between samples
collected on the same day at the tailings end of the pond near the source of surface
AMD (DPB), and the outflow (DRO), it can be seen that DBP pHs were not significantly
different from DRO, except in the last two years (Figure 11). This is additional
evidence that acid pulses from the tailings, caused by high precipitation, contributed to
the large ranges in sulphate, acidity, and zinc observed in Decant Pond.
Acidity in Decant Pond is directly related to the zinc concentration, as the pH is in that
range where zinc starts to precipitate as its hydroxide. The correlation between these
two parameters is excellent and indicates that, as zinc is removed by the periphyton
during the summer months, acidity will also be controlled (Figure 12).
Boojum Research Limited 50
South Bay 1992 Report for: BP Resources

Table 13: Decant Pond Concentrations, 1986 - 1992
Fig. 10: Decant Pond, 1986 - 1992 Seasonal Zinc Concentrations - DRO
15
0 10
Day of Year
Boojum Research Limited 51
South Bay 1992 Report for: BP Resources

Fig. 11 : Decant Pond [H+], DPB - DRO
- + E,
0.0002 l r l r l -
0- I
0.00015
0.0001
5E-05
-5E-054 I 01-Jan-86 01Jan-67 OlJan-88 31-Dee88 01-Jan-90 OIJan-91 01Jan-92 31-Uec-92 01-Jan-94
Sampling Date
Fig. 12: Decant Pond Acidity and [Znl Comparison, 1982-1992
Date
&- Zinc + Acidity
Boojum Research Limited 52
South Bay 1992 Report for: BP Resources

5.3 Bioloqical Polishinq Capacitv
There are two distinct periphyton communities in Decant Pond. A Ulofbrix community
has recently started to dominate the periphyton flora on the western shore. Toward the
middle of the pond, where pHs are more circum-neutral, a cyanobacterial (blue-green)
community, dominated by Oscillaforia, forms dense mats. The periphyton mats contain
only about 25-30 % organic matter, while the remainder is composed of precipitates.
Several methods were employed to measure periphyton mat productivity in Decant
Pond. Peritraps were installed in the deepest area of the pond in 1991 and 1992. A
second method involved removal of a known area of periphyton from submerged
horizontal surfaces of wooden rafts. Finally, periphyton was harvested from
polypropylene or cotton rope and quantified.
The results of all growth estimates are shown in Figure 13. Using Scrapings (Scrape-
H) and peritrap nets (PT-) data, similar high growth estimates were calculated,
compared to growth estimates using data from rope method. As expected, results
indicate that the best growth rates (2.3 gdw periphyton m-* (substrate) d-I) were
produced by periphyton growing in the presence of slow-release fertilizer in
midsummer. Not only were growth rates high, but phosphorus levels in fertilized
periphyton were also significantly higher than non-fertilized periphyton (data not shown).
The same approach was used as that described for Boomerang Lake and Mill Pond to
extrapolate the quantity of zinc removed by a full-scale biological polishing process in
Decant Pond. Growth rates presented are based on the surface area of the substrate,
in this case, peritraps, ropes, and wood. Maximum growth rates shown in Table 9, are
those calculated using July 1991 peritrap data. The minimum growth rates shown are
calculated as the time-weighted average growth rate for all data presented.
Boojum Research Limited 53
South Bay 1992 Report for: BP Resources

Fig. 13: Decant Pond Periphyton Growth Rates
-'" I I
I.
86-88 Jun91 Ju191 AS91 91 -92 Growth Period
Zinc concentrations in periphyton from Decant Pond have been determined periodically
since 1987. The periphyton sample with the highest zinc, and the average zinc
concentration in periphyton collected in 1992, are shown as minlmax values.
Using the maximum growth rates, and assuming substrate surface areas equivalent or
three times greater than Decant Pond's surface area, the estimated contaminant
removal rates by periphyton in Decant Pond are extremely (and unrealistically) high
(Table 9a). These calculations suggest that periphyton would be able to remove 209
times the projected zinc loading. Even when the minimum growth estimates and a
substrate surface area equal to the area of Decant Pond are used, 95 %, or near
complete, to 285 % removal of the annual zinc concentrations are estimated.
While it is, of course not possible that periphyton remove more zinc each year than the
annual loading, these calculations demonstrate that if the periphyton population
expanded over area equivalent to Decant Ponds area, and maintained at least the
minimum growth rates estimated, then most of the annual zinc loading would be
Boojum Research Limited 54
South Bay 1992 Report for: BP Resources

removed. Of course, as zinc concentrations in Decant Pond diminish, zinc accumulated
in the periphyton biomass cannot be expected to remain at currently high
concentrations, but to diminish as the supply available in Decant Pond water
diminishes. Meanwhile, for the periphyton population to maintain the minimum growth
rate as it expands to cover a surface area equivalent to Decant Pond will require an
adequate supply of nitrogen and particularly phosphorus. Promotion of periphyton
growth following the application of natural phosphate rock on the tailings beach should
be observed in the 1993 growing season.
Boojum Research Limited 55
South Bay 1992 Report for: BP Resources

6. ESTABLISHMENT OF THE NEW ECOSYSTEM
6.1 Introduction
In the previous sections, estimates of the annual contaminant loadings and the capacity
of the biological polishing system were made. The self-sustaining, long-term solution
to the decommissioning of the site, which is to be achieved with Ecological Engineering,
has at its core the objective to achieve contaminant removal rates equal to or
exceeding contaminant release rates. From the results obtained so far, the annual
loadings of zinc and iron can be counteracted by biological polishing once the new
ecosystem is fully established. Since a large fraction of run-off entering Boomerang
Lake contains elevated concentrations of sulphate and hydrogen ions, microbially-active
ARUM sediments are required to generate alkalinity and consume sulphate.
In Boomerang Lake, contaminants have been accumulating for a number years.
Boomerang Lake currently harbours metals and acidity which has accumulated in the
last three years; this load has to be removed, so that annual loadings need only be
dealt with by biological polishing and ARUM, the latter through alkalinity generation.
A one-application measure must be identified which can remove this backlog of
contaminants, but which is also compatible with and, ideally, beneficial to, both
biological polishing and ARUM processes.
Application of lime would not meet these requirements, since lime would have to be
applied for an entire year, generating sludges which would cover the sediments. This
would reduce the rate of exchange of ions between the water and sediment, thereby
inhibiting ARUM sediment processes. In addition, lime would scavenge much of the
phosphate in Boomerang Lake water, while providing no other nutrients. Clearly, an
alternative one-time treatment is required, providing, ideally, plant nutrients to the water
and sediments to initiate nutrient cycling.
Boojum Research Limited 56
South Bay 1992 Report for: BP Resources

In 1992, work was initiated with phosphate rock, which contains phosphatic carbonate,
examining whether this material can neutralize acidic water and provide nutrients on
a slow-release basis. In addition, organic carbon, necessary for ARUM development,
was tested in the lab, then added on a large scale to Decant Pond beach in 1992. The
results of these two topics are presented in Sections 6.2 and 6.3, respectively.
6.2 PhosDhate Rock
Phosphate rock is mined by Texasgulf and sold in several different grain sizes, for
application as a fertilizer for acidic soils. Phosphate rock was tested in Boomerang
Lake, Mill Pond and on tailings areas in July 1992. After application of the rock, water
and sediments were sampled for chemical analysis. In general, the field tests were
promising and will facilitate estimates for the anticipated one-time application. The
results are discussed for each of the water bodies.
6.2.1 Mill Pond
Phosphate sand (Code 30; 30% phosphate, mesh 65 to 200) was applied in Mill Pond.
Based on bench-scale laboratory tests, this mesh size would react relatively slowly and
contain sufficient phosphate to effectively reduce acidity and supply phosphate through
to the spring of 1993. Distribution locations are shown in Map 4. Approximately 300
kg were placed at locations MPC 7 and MPC 8, and another 300 kg were distributed
along the eastern shore of Mill Pond. In addition, about 150 kg were put into the inflow
areas of the pond, and 55 kg of slow-release 19-6-12 fertilizer (NPK; Osmocote) were
distributed along the eastern shore in the area around the phosphate rock. Twenty kg
was also broadcast into the outfall area of the pond, where an extensive periphyton
population had already established. In the spring of 1993, the fertilizer and phosphate
sand will be collected, and analyzed for remaining phosphate content.
Boojum Research Limited 57
South Bay 1992 Report for: BP Resources

Water samples were taken from stations MPC, MPC 7, MPC 8 and at the oufflow
(MPO) before and after the application of sand. Acidity, dissolved phosphate, pH,
conductivity, Em (Redox), and temperature were measured daily for 3 days after the
addition of rock. The results of water and sediment samples analyzed by ICP are
reported in Appendix E.
In Figure 14a, the concentrations of Al, Cu, Fe,and acidity plotted for the MPC samples
collected before (July 13) and after (July 16) the application of phosphate rock Code
30. The two elements which showed the largest decrease were, as expected, iron and
aluminium. The differences in water chemistry, after one day, were not as pronounced
as those measured three days after the application. The results are, overall, very
encouraging.
The results for station MPC 7 are plotted in Figure 14b. This sampling location is
located in a depression where Mill Pond is deepest, and where less mixing and a
greater effect by phosphate rock could be expected. Results show a pronounced
difference in water quality, before and after the phosphate application.
Eoojum Research Limited 58
South Bay 1992 Report for: EP Resources

Fig. 14a: Mill Pond - Centre Before and After Phosphate Rock
I -a- Acidity + Aluminum + Iron -s- Copper I
Fig. 14b: Mill Pond - Station 7 Before and After Phosphate Rock
.
1 zoo
1000
800
600
400
200
0 Before 13/7/92 After 16/7/92
Boojum Research Limited 59
South Bay 1992 Report for: BP Resources

6.2.2 TailinuslDecant Pond
Five tons of phosphate rock (waste gravel; 21 % phosphate, -6 to 14 mesh) was
distributed in small AMD ponds which had accumulated on the tailings, due to the high
water levels (Map 5). Because phosphate rock was distributed with a back-hoe, a
somewhat irregular distribution pattern resulted. Water samples were taken from the
tailings run-off area several hours after the initial placement, and each day following for
3 days. Water was also sampled 1 month and 3 months later.
Water chemistry of samples collected above and below the area where phosphate rock
was distributed are presented in Table 14. Large fractions of the iron and aluminium
were still being removed after three months. The course material reacted very quickly
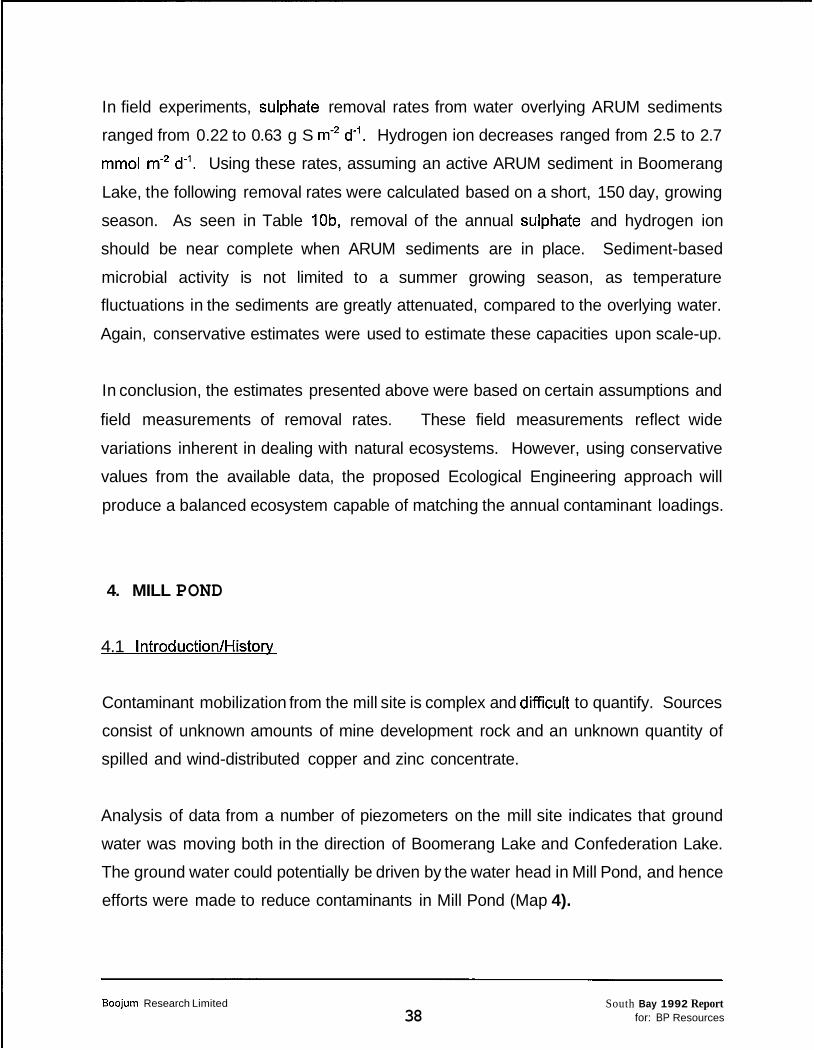
to the high acidity water (Figure 15). The initial reactions are likely attributable to
carbonate in the material.
The most important characteristic of phosphate rock in the current application is the
duration of activity, rather than the specific rate at which it reacts. In fact, after 3
months, the material was still reacting. If limestone were used, it would have fouled
within one week of placement.
Table 14: Water Analysis in Tailings Area, (mg/L) I Runoff I File I Date I Acidity I Al I Fe I I Before PR I 3861 I 16-Jul-92 I 580 I 34.3 I 53.5 I
After PR 3865 18-Jul-92 410 5.19 12.9 Pre PR 4033 13-Aug-92 2620 96.5 552.0 Post PR 4034 13-Aug-92 798 57.5 1.3 Pre PR 4237 17-Oct-92 2588 45.7 648.0
11 Post PR I 4238 I 17-Oct-92 I 717 I 29.8 I 25.9 I
Boojum Research Limited 60
South Bay 1992 Report for: BP Resources
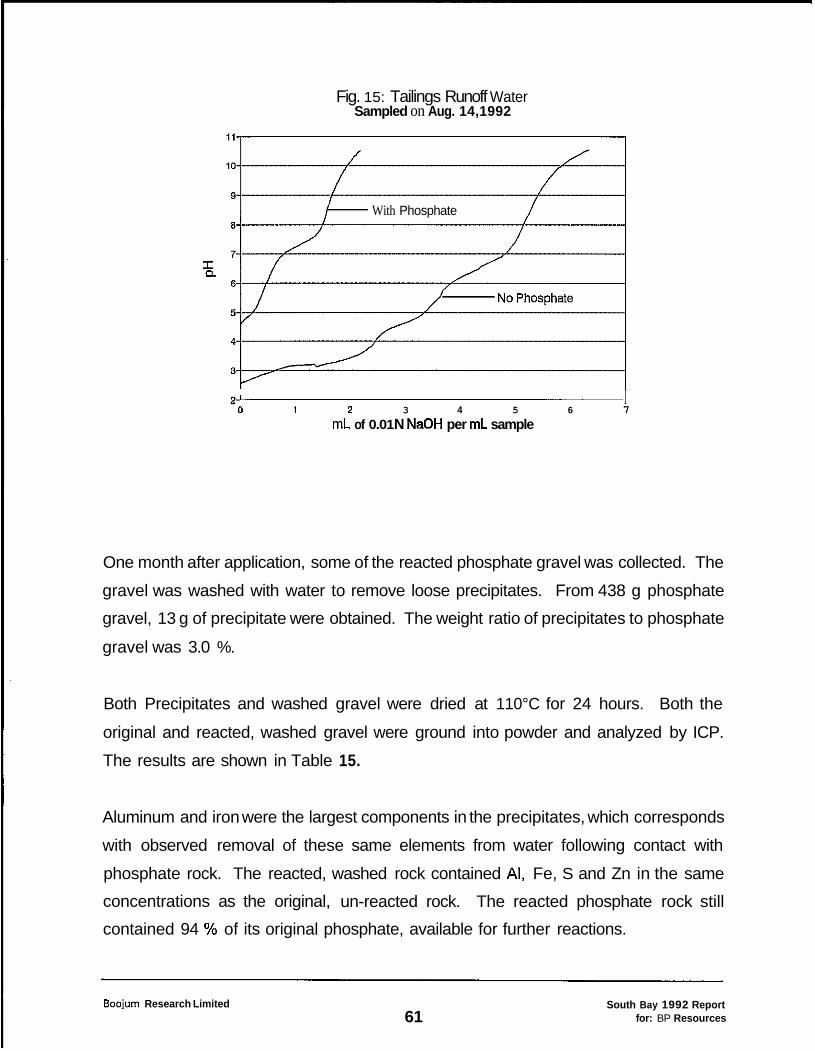
Fig. 15: Tailings Runoff Water Sampled on Aug. 14,1992
With Phosphate
I 0 1 2 3 4 5 6 7
mL of 0.01 N NaOH per mL sample
One month after application, some of the reacted phosphate gravel was collected. The
gravel was washed with water to remove loose precipitates. From 438 g phosphate
gravel, 13 g of precipitate were obtained. The weight ratio of precipitates to phosphate
gravel was 3.0 %.
Both Precipitates and washed gravel were dried at 110°C for 24 hours. Both the
original and reacted, washed gravel were ground into powder and analyzed by ICP.
The results are shown in Table 15.
Aluminum and iron were the largest components in the precipitates, which corresponds
with observed removal of these same elements from water following contact with
phosphate rock. The reacted, washed rock contained Al, Fe, S and Zn in the same
concentrations as the original, un-reacted rock. The reacted phosphate rock still
contained 94 % of its original phosphate, available for further reactions.
Boojum Research Limited 61
South Bay 1992 Report for: BP Resources

Original rock Washed rock Precipitate
6.2.3 Boomeranq Lake
File Al Ca c u Fe P S Zn 4083 5500 311000 99 6660 89200 12200 1320 4074 6040 310000 92 7390 84200 12700 1110 4073 70700 32200 1460 193000 23300 30600 6290
Nine tons of phosphate rock (code 31; 31 % phosphate, 200 to -200 mesh) were
distributed over specific areas in Boomerang Lake (Map 3). A total of 5.5 tons were
spread in the vicinity of B9 to B10, 3 tons were distributed between B2 and B11, and
0.5 t were distributed in the vicinity of B7 (see Map 3).
The B9 - B10 area was chosen for phosphate rock distribution based on a conductivity
survey, including bottom sediments, along the suspected tailings seepage area. The
transect data are presented in Appendix E. Generally, the conductivity on the bottom
ranged from 400 to 600 pmhos cm-’. Elevated conductivities ranging from 1020 to
1600 pmhos cm-’ were found in stations 8, 10, 12, 13, 14, 19, 5, 6, and 7. Therefore,
the transect areas with the high conductivities were targeted for the phosphate
application (see Map 3).
Boojum Research Limited 62
South Bay 1992 Report for: BP Resources

Water samples were taken from B2, B7, B9, and B11 before phosphate addition, and
at 82, B7 and B9 after distribution. Water samples were also taken 1 and 3 months
after phosphate application. Sediment samples were collected from B2, B7 and B9,
before and after application.
In Boomerang Lake, the major elements contributing to acidity are aluminum and iron.
When Fe and Al salts dissolve in water, they hydrolyse and release hydrogen ions:
+ H,O = AI(0H)” + H’
AI(OH)+’ + H,O = AI(0H); + H’
AI(OH),’ + H,O = AI(OH), + H’
Fe’, + H,O = Fe(0H)” + H’
Fe(0H)” + H,O = Fe(OH),’ + H’
Fe(OH),’ + H,O = Fe(OH), + H’
Theoretically, phosphate, added to Boomerang Lake water, should have precipitated
with Alt3 and Fe’, and associated with hydrogen ions.
poi3 + AI+~ = AIPO,
poi3 + H+ = HPO~’
P o i 3 + Fe‘3 = FePO,
HPO;’ + H’ = H,POi
H,PO; + H’ = H3P0,
When phosphate rock was applied in Boomerang Lake, large, quantities of precipitates
were visible in the water. Water appeared “milky“ and remained so for several days.
Just beyond the outflow of Boomerang Lake, station C1, the phosphate concentrations
were monitored, since the intent was to relegate phosphate as a precipitate to the
sediments, and not allow it to leave the Lake. Concentrations at the oufflow remained
Boojum Research Limited 63
South Bay 1992 Report for: BP Resources

below the detection limit of < 1 mg L-’ for three days after the application. Therefore,
it is reasonable to assume that all the phosphate remained in the lake.
In Figure 16, the pH, acidity, and concentrations of Al, Fe, Mn and Zn in water collected
before and after phosphate treatment are plotted. While no differences can be noted
in surface water samples, large differences in aluminum, iron, sulphur and zinc were
apparent in bottom water samples. Since the phosphate rock particles sank to the
bottom, little time was available for reactions in the water column. Long term reactivity
of phosphate rock can be expected to operate at the sediment surface. Since metal
analyses are based on filtered, acidified samples, precipitated metals were not
measured. The precipitate content of the sediments, however, should increase over
the same time period. Metal concentrations in sediments (as solid samples) collected
after phosphate treatment were considerably higher than in sediments collected before
phosphate rock application (Figure 17).
Boojum Research Limited 64
South Bay 1992 Report for: BP Resources

Fig. 16: Boomerang Lake Water Before and After Phosphate Treatment
50 1500
45 I BOTrOM WATER I
T 1350 ' ' " ' I
0 1
Before - 13-14/7/92, After - 18/7/92
Fig. 17: Boomerang Lake Sediment Before and After Phosphate Treatment
450
400
350
300
250 9 0 3
h
200 a 150
100
50
0
Before ~ 14/7/92,After - 18f7 & 14/8/92 -value to be confirmed
Boojum Research Limited 65
South Bay 1992 RepoR for: BP Resources

Although metals were precipitated by the phosphate treatment, the question remains
concerning how much of the lake’s metal loading was in fact removed. The sediment
concentrations of precipitated aluminium, zinc and iron after the phosphate rock
treatment (pg gdw-’) were converted to mass of metal per unit of lake bottom, using a
sediment water content of 80%. This was multiplied by the lake area over which the
phosphate was broadcast. The gives an estimate of the amounts of metals removed
with the phosphate rock application. The total volume of water into which phosphate
powder was distributed was 42,000 m3, resulting in an application rate of approximately
214 mg PO, rock L-’.
The 9 t of phosphate rock application resulted in the removal of 330 kg of zinc, 1.35
tonnes of iron, and 276 kg of aluminum from the water. These amounts are equivalent
to lake concentration decreases of 6 % for dissolved zinc, 74 % for iron, and 10 %
decrease for aluminum, within two days following application.
The level of microbial activity in Boomerang Lake sediments is the final component
which has to be addressed. Some preliminary results from laboratory work with
sediments are presented in Table 16a and 16b. The sediments were collected with an
Eckman grab sampler. Since this technique inherently disturbs the sediment
stratification and mixes sediment with some overlying water, the sediments were
allowed to settle in jars in the laboratory. The pH and Em (Redox) were measured, and
zinc and phosphate concentrations determined in the sediments and overlying water
(Table 16a, 16b). After several months storage in the lab, pore water pHs at B2, B9
and B11 were low, suggesting sediments had oxidized. The acidity was likely related
to the high concentrations of Al and Fe in the sediment.
Boojum Research Limited 66
South Bay 1992 Report for: BP Resources


Sediment pore water acidity titrations, for the sediments sampled before and after the
phosphate application, are shown in Figure 18. From the curves, it can be determined
that acidity of sediment pore water noticeably decreased in those sediments which were
collected after phosphate treatment. In October, the sediments were remeasured.
The pH of the samples collected in July had increased, while all the later samples (B2,
B11 and B4) showed lower pHs, and higher zinc and iron concentrations.
Fig.18: Boomerang L Sediment Pore Water Sampled July 14 -July 18, 1992
/
I,
Sedimenk with # are collected after treatment 3
0 0.5 1 1.5 2 2.5 3 mL of 0.01 N NaOH per mL sample
When all the sediment-related waters were compared with respect to pH, Em and [Fe],
at different times and stations, it was noted that water with low pH was always related
with higher Em and higher iron concentrations. This illustrates, again, that pH
changes are mainly controlled by the iron oxidation and hydrolysation in these sediment
waters. Redox conditions in the small volume of sediments in jars were not low enough
to retain the metals in the sediments.
There is some indication that the pH decreases in sediments which contained lower
amounts of iron (400-800 pg gdw-’) were not as great as in sediments with more iron
(> 4000 pg gdw-’). However, one exception is sediment collected at B8 (July 14, 1992),
Boojum Research Limited 68
South Bay 1992 Report for: BP Resources

which contained a high concentration of iron (Fe=4370 pg gdw-'), but a low organic
content (LOl=8.33%). After several months in the lab, this sediment's Em was still low
(-132 mV), and the pH neutral.
Two other samples, B9 (July 14, 1992) and B9 (July 18, 1992), also contained high
concentrations of iron (Fe=4940 and 9010 pg gdw-'). Their LOIS were also very low,
6.45 % and 10.35 %, respectively. After several months, Ems were still low (-21 and - 217 mv), but pHs had dropped to 3.99 and 3.43, respectively. Sediments with
phosphate, B9 (July 18, 1992), were distinctly different from sediments without
phosphate, B9 (July 14, 1993).
These very preliminary observations do suggest that the laboratory techniques used
were not effective in terms of gaining a full understanding the dynamics of sediment
redox conditions in Boomerang Lake. An Eh survey of the organic sediments should
be carried out to determine the in sifu redox dynamics. The sedimenffwater interface
redox dynamics are complex, but an understanding of them is necessary to quantify
metal and acid fluxes between the sediment and overlying water.
The effects of applying phosphate rock upon water quality have to be considered
separately from effects on sediment chemistry. Because phosphate is readily adsorbed
onto iron precipitates, iron is the principal variable determining the phosphorus flux at
the sediment-water interface. The low phosphate concentrations measured in the
sediment pore waters is evidence of this process of phosphate adsorption by iron in the
sediment water.
Metal release from the sediments is related to the redox state of the sediments, the
organic matter content, and phosphorus and oxygen concentrations in sediments. In
sediments, metals are chelated with organic matter, or precipitated with phosphates.
Boojum Research Limited 69
South Bay 1992 Report for: BP Resources

Under aerobic conditions, rapid degradation of organic matter, and subsequent release
of metals from organics occurs. However, these released metals, especially iron, can
in turn precipitate with phosphate and remain fixed in the sediments.
Under anaerobic conditions, ferric iron is reduced to ferrous iron, and the more soluble
ferrous phosphate may flux from the sediment into the overlying water. However, with
slow degradation of organic matter under these anaerobic conditions, a higher
concentration of metals can remain chelated. Overall, if anaerobic, reducing sediments
have a high organic content, and are overlaid by an oxidized sediment layer containing
adequate phosphate, metal release from sediments may be minimized. These are the
required sediment conditions in Boomerang Lake, Mill Pond, and Decant Pond.
In Boomerang Lake, the organic content (based on % LOI) ranged from 2.1 to 32.8 %.
In Confederation Lake the LOIS are similar, ranging from 1.1 to 63 % organic matter,
with a mean of 23 %. Additions of organic matter might be required in some areas of
the Boomerang Lake. Organic amendments have been made to Mill Pond and Decant
Pond beach. Thus, to initiate ARUM activity, several experiments were carried out prior
to placement of wood waste onto the Decant Pond beach.
Enhancement of ARUM, a natural microbiological process, has been tested by Boojum
Research for the amelioration of AMD. The process consists of stimulating the
development of an anaerobic microbial community in reducing sediments which,
through bacterial metabolic activity, reduces sulphate to sulphide, precipitates metals,
and raises pH. Feeding these bacteria the proper mix of organic carbon and other
nutrients enhances their activity, so that larger volumes of AMD can be treated.
Boojum Research Limited 70
South Bay 1992 Report for: BP Resources

6.3 ARUM in Decant Pond Tailinqs Beach Sediments
Sporadic run-off from the tailings into Decant Pond contains high concentrations of zinc
and iron. Because this run-off contributes a appreciable amount of acidity and metals
to the Decant Pond, pro-active ameliorative measures needed to be taken.
In 1988, hay bales were spread along the beach area in order to stimulate the ARUM
bacterial community (Acid Reduction Using Microbiology). At that time, however, little
was known of the specific nutritional requirements of the ARUM bacterial community,
and an insufficient quantity of material was distributed. With the benefit of 5 years
additional experience and experimentation, the ameliorative measures were taken to
initiate ARUM on the Decant Pond Beach described in the following section.
6.3.1 Methods and Materials.
A laboratory experiment was conducted examining amendments which stimulate ARUM
microbial activity in four litre jars of Decant Pond water, as well as Boomerang Lake
and Mill Pond water. Treatments included alfalfa, decomposing 30 year old forestry
wood slab waste from the South Bay area, and Osmocote fertilizer.
The experiment showed that bacterial sulphate reducing activity was present in all the
jars amended with wood waste, and zinc and sulphate concentrations decreased
(Figures 19, 20). The addition of slow-release fertilizer did not show any enhancement
of the ARUM process. From this experiment, it appeared that the wood wastes may
be a suitable material to initiate ARUM activity along the Decant Pond beach.
Boojum Research Limited 71
South Bay 1992 Report for: BP Resources

Fig.19: Boomerang Lake Wood Experiment from Nov.23,1991 to April 23,1992
350,
Fig. 20: Decant & Mill Pond -Wood Expt from Nov.23,1991 to April 23,1992
7
6
5
Ip 4 - 2 .
3 - E I5
2
1
0
5 6 0 7 8 9 10 0
Boojum Research Limited 72
South Bay 1992 Report for: BP Resources

After permits were received to use this material, 30 dump truck loads of wood waste
were piled in and around the beach area of Decant Pond in early July, 1992. Water
samples were taken in pools among the slabs of wood waste. Additional sampling was
performed one and three months after set-up.
There were no significant elemental changes in water samples from the beach before
and after wood placement. However, water pH increased in all the samples after wood
waste placement, except those collected from within the wood pile. This phenomenon
was still evident after 1 and 3 months. These results are only preliminary, and further
sampling for determination of surface and pore water chemistry in the wood waste field
must performed in 1993.
Boojum Research Limited 73
South Bay 1992 Report for: BP Resources

7. MINE SITE
7.1 Overview
Piezometers were installed during the hydrological investigations of the entire mine site
(Map 6). Possible ground water flows towards both Boomerang Lake and
Confederation Lake (MI8 and M38) were addressed. Ground water flow velocities
towards Confederation lake ranged from 2.5 m a-’ to 4.6 m a-’ for the Backfill raise area
(M18) pathway, and for the Mill site pathway, velocities ranged from 6.5 to 9.0 m a-’
(M38).
Contaminated water was predicted to arrive at Confederation Lake in 21 to 40 years.
As Mill Pond was suspected of being the driving force for the water flowing through
M38, work was initiated to divert fresh water away from Mill Pond, reducing the head
driving water through the contaminated Backfill Raise drainage basin.
These remedial measures were taken without knowledge of degree of flooding in the
underground mine workings. If water levels in the working further increased, these new
levels could potentially result in significant alterations to the mine site hydrological
conditions. Hence, the typically transient seepages from the Portal Raise and the
Backfill Raise area were monitored annually. In the fall field trip in 1991, increased
flows were noted from both the transient seepages. Water samples were collected at
that time for chemical analysis.
The historical data are presented up to 1991 in Table 17. Although the sampling
locations and sampling intervals were inconsistent, the diversion ditch constructed in
1989 generally appeared to diverting a significant zinc loading to Boomerang Lake, and
away from Confederation Lake. For example, 101 mg zinc L” were present in water
leaving the mine site at station BRIA in July, 1991.
Boojum Research Limited 74
South Bay 1992 Report for: BP Resources

Boojum Research Limited South Bay 1992 Report 75 for: BP Resources
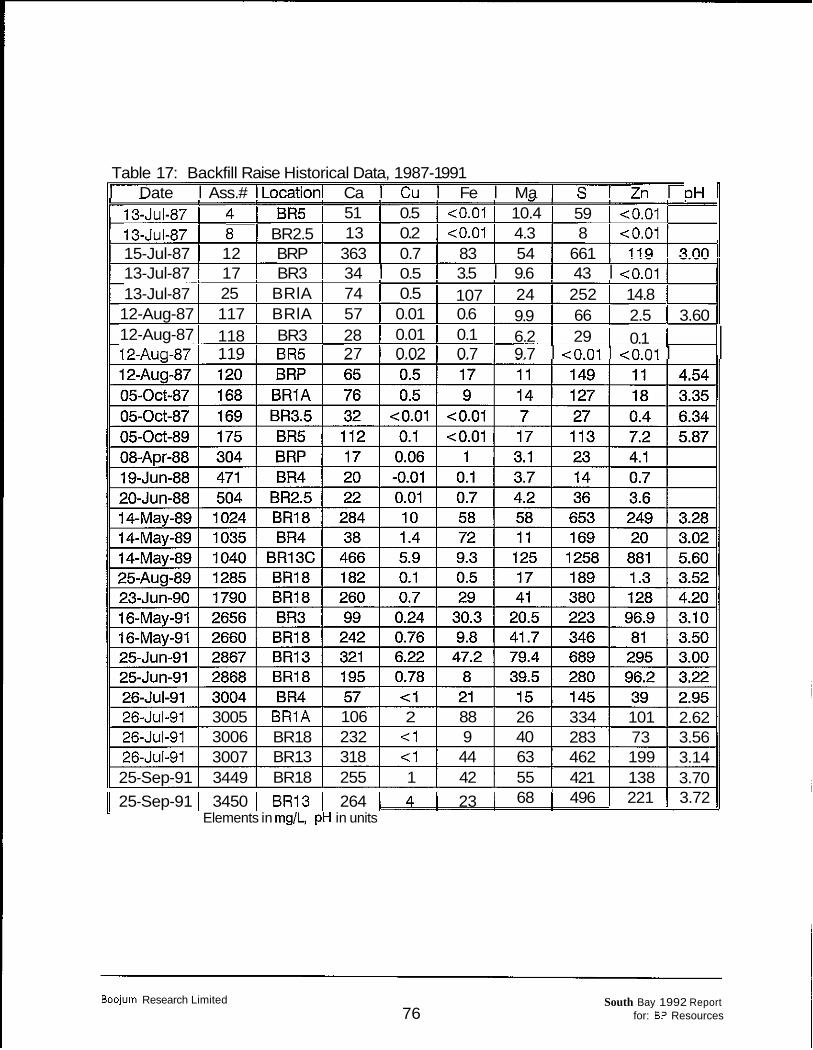
Table 17: Backfill Raise Historical Data, 1987-1 991 I Date I Ass.# ILocationl Ca I cu I Fe I Ma I S I Zn I nH 11 1 - - I , ~
13-Jul-87 I 4 1 BR5 I 51 I 0.5 I c0.01 I 10.4 I 59 I <0.01 I 13-Jul-87 I 8 1 BR2.5 I 13 I 0.2 I <0.01 I 4.3 I 8 I <0.01 I I 15-Jul-87 I 12 I BRP I 363 I 0.7 I 83 I 54 I 661 I 13-Jul-87 I 17 I BR3 I 34 I 0.5 I 3.5 I 9.6 I 43 I <0.01 13-Jul-87 I 25 I BRlA I 74 I 0.5 I 107 I 24 I 252 I 14.8 I 12-Aug-87 I 117 I BRlA I 57 I 0.01 I 0.6 I 9.9 I 66 I 2.5 I 3.60 12-Aug-87 I 118 I BR3 I 28 1 0.01 I 0.1 I 6.2 I 29 I 0.1 I 12-Aua-87 I 119 I BR5 I 27 I 0.02 I 0.7 I 9.7 I <0.01 I <0.01 I I
26-Jul-91 3005 BR1A 106 2 88 26 334 101 2.62 26-Jul-91 3006 BR18 232 C1 9 40 283 73 3.56 26-JuI-91 3007 BR13 318 <1 44 63 462 199 3.14 25-Sep-91 3449 BR18 255 1 42 55 421 138 3.70
68 496 I 221 I 3.72 11 11 25-Sep-91 I 3450 1 BR13 I 264 I 4 1 23 1 I Elements in mg/L, pH in units
Boojum Research Limited 76
South Bay 1992 Report for: BP Resources

However, the zinc levels in the transient seeps (e.g. BR13), closer to Confederation
Lake, were also higher at this time than previously measured.
The chemistry of water sampled from piezometers MI8 and M38 were monitored more
regularly than the transient seepages. In Table 18, it can be seen that the chemistry
of the ground water at these locations in 1991 had not deviated from previous years.
Piezometer M I8 was installed at a depth of 8.2 m, and piezometer M38 at 6.58 m.
This suggested that the water sampled from piezometers may not reflect the overall
ground water characteristics of the mine site. It was decided that remedial actions for
the mine site needed to be addressed immediately.
Table 18: Monitoring Data for Piezometers M18 and M38, 1986-1 992 (mg/L)
* - determined by Boojum pre after bail bail
* - determined by Boojum pre after bail bail
Boojum Research Limited 77
South Bay 1992 Report for: BP Resources


It was assumed that pyrite, chalcopyrite, and sphalerite were the minerals most likely
to be dissolved by waters in the mine/mill area. The interpretation of the output is as
follows: a positive SI value for a particular water, with respect to a particular mineral,
means (1) that the water is supersaturated with respect to that mineral; (2) that the
water is not likely to dissolve more of that mineral (if available); and (3) that the mineral
may be precipitated from the water. If supersaturation is shown, with respect to more
than one mineral containing the same elements, then the mineral showing the highest
SI value is most likely to precipitate.
It should also be pointed out that, due to the lack of data on the concentrations of
carbon species, chloride, nitrate and phosphate, all carbonate, chloride, nitrate and
phosphate minerals had to be omitted from consideration.
The main observations from the WATEQ4F results are:
1.
2.
3.
4.
5.
6.
All samples containing Ba showed supersaturation with re pect to b ril !.
All samples containing Cu showed supersaturation with respect to cuprous
ferrite.
All samples containing Fe showed supersaturation with respect to goethite and
hematite.
All samples containing Al showed supersaturation with respect to annite; some
also showed supersaturation with respect to boehmite and gibbsite; the samples
from BRC, PRS, and the gravel-pit pond also showed supersaturation with
respect to one or more clay minerals.
All samples except that from the gravel-pit pond ([Si]=O.34 mgll) showed
supersaturation with respect to quartz.
All samples except those from Warehouse Seep, Mill Pond, and BR13, showed
supersaturation with respect to ZnSiO,. The July and August samples from
Warehouse Seep, Mill Pond, and BR13 were under-saturated with respect to this
mineral.
Boojum Research Limited 88
South Bay 1992 Report for: BP Resources

The use of laboratory measurements of Eh may, of course, have distorted the extent
of goethitelhematite supersaturation, whereas the use of laboratory measurements of
pH may have distorted the extent of supersaturation with respect to pH-sensitive
minerals, including goethite, hematite, boehmite, and gibbsite.
Dissolution. Precipitation, Mixinq, and Dilution (usinq NETPATH): A second
geochemical model NETPATH was used to determine the composition of seepages.
In contrast to the first model, which predicts the likely metals which are removed due
to geochemical precipitation, it determines the proportions in which clean and
contaminated water are mixed.
For some of the sample sources, precipitation (rain or snowmelt), or uncontaminated
ground water, was assumed to be the original input ("Initial Source"), and NETPATH
was used to determine how much of which minerals had to be dissolved (or
precipitated) to derive the final water ("Final Source"), as sampled. For some of the
other sources, a mixture of contaminated and uncontaminated waters ("Initial Source
1" and "Initial Source 2") was assumed as input, and NETPATH was used to determine
the probable mixing ratio, as well as possible mineral dissolution and precipitation.
Finally, for some of the sample sources two samples taken before and after dilution by
rain or snowmelt ("Initial Source" and "Final Source") were used in NETPATH to
determine the dilution ratio.
The water level relationships suggested that piezometers M57, M38, and the destroyed
piezometer close to the shaft (MII), Warehouse Seep and Mill Pond as well as
probably Backfill Raise Pond and M I 8 received their heavy-metal contamination from
near-surface sulphide sources on the minelmill site; that Backfill Raise Cap and Portal
Raise Cap both contain mine water; and that BR13, C13-30, and Portal Raise Seep
discharge water with progressively smaller fractions of heavy-metal contaminated water.
Boojum Research Limited 89
South Bay 1992 Report for: BP Resources

The NETPATH model output indicated that the Warehouse Seep water could be
derived from either precipitation or uncontaminated ground water through dissolution
of oxygen, sphalerite, pyrite, minor chalcopyrite, and some feldspar, and precipitation
of goethite (or hematite), silica, and gibbsite.
Backfill Raise Cap water sampled July 14, 1992, can be derived from either
precipitation or uncontaminated ground water through dissolution of somewhat smaller
amounts of oxygen, sphalerite, pyrite, a trace of chalcopyrite, and some feldspar, and
precipitation of goethite, silica, and gibbsite.
The Portal Raise Cap water of 14 August (1992) can be derived from a mixture of
some 4 % Warehouse Seep water and 96 % uncontaminated ground water or from a
mixture of about 5 % Backfill Raise Cap water with 95 % uncontaminated ground water,
accompanied by dissolution of minor amounts of oxygen and feldspar, and precipitation
of minor amounts of zinkite, goethite, and copper sulphate (or, more likely, carbonate).
The decreases in Ca/S and Ca/Zn ratios, and increases in sulphur and heavy-metal
concentrations between 14 July and 14 August (1992) indicated that the percentage of
contaminated water in Portal Raise Cap water was increasing.
The Portal Raise Seep water sampled 13 July, 1992, can be derived from a mixture of
some 14 % Warehouse Seep water and 86 % uncontaminated ground water,
accompanied by dissolution of minor amounts of oxygen, feldspar, and chalcopyrite,
and precipitation of zinkite, and a minor amount of goethite. Between July 13 and
August 14, 1992, the Portal Raise Seep water was likely diluted by a factor of about
1.5, accompanied by dissolution of trace amounts of oxygen and pyrite, and
precipitation of some zinkite and trace amounts of copper sulphate and MnOOH. The
decrease in the percentage of Warehouse Seep water between July 13 and August 14,
1992, is indicated by decreases in metal concentrations and a change in the Ca/S ratio.
The peak in sulphur and metal concentrations on July 16, 1992, may well reflect the
discharge of a slug of contaminated water, pushed by infiltrating rain water.
Boojum Research Limited 90
South Bay 1992 Report for: BP Resources
Mill Pond water can be derived from precipitation through dissolution of oxygen,
sphalerite, pyrite, and some chalcopyrite and feldspar, and precipitation of goethite, and
some silica. Between July 13 and 18, 1992, Mill Pond water was likely diluted by a
factor of about 1.3, accompanied by dissolution of a trace amount of oxygen, and
precipitation of some zinkite and trace amounts of copper sulphate and MnOOH.
Similarly, it is likely that the sample of August 14, 1992 was a mixture of about 90 %
of Mill Pond water of July 13, 1992 and 10 % precipitation, accompanied by dissolution
of a trace amount of silica, and precipitation of zinkite, some gibbsite, and a trace
amount of copper sulphate or possibly carbonate.
BRI 3 water can be derived from a mixture of some 43 % Backfill Raise Cap water and
57 % uncontaminated ground water, accompanied by dissolution of minor amounts of
oxygen, pyrite, and feldspar, and precipitation of zinkite, and minor amounts of MnOOH
and cuprous-ferrite. Between July 13 and 16, 1992, Portal Raise Seep water was likely
diluted by a factor of about 2.2, accompanied by dissolution of trace amounts of oxygen
and sphalerite, and precipitation of trace amounts of goethite and MnOOH.
The C13-30 water can be derived from a mixture of some 41 % Backfill Raise Cap
water and 59 % uncontaminated ground water, accompanied by dissolution of minor
amounts of oxygen and pyrite, and precipitation of zinkite, and minor amounts of
MnOOH, cuprous-ferrite, and silica. Between July 15 and August 14, 1992, the Portal
Raise Seep water recovered from a likely dilution by a factor of about 2.0, which had
been accompanied by dissolution of trace amounts of oxygen, sphalerite, and MnOOH,
and precipitation of a trace amount of goethite.
The results of the geochemical modelling support the earlier conclusions, that the
higher water levels in 1992 flushed out contamination, which would normally have
remained in the mine site overburden, or have been released slowly through the
sediments in Confederation lake along the shore.
Boojum Research Limited 91
South Bay 1992 Report for: BP Resources
The diversion ditch which has been completed in January 1993 should curtail the
seepages to Confederation Lake.
Perforation of the Backfill Raise at the level of the new drainage ditch will limit the
maximum possible water level in the mine, and this will, in turn, reduce the potential for
discharge of highly contaminated water from the mine, through the Portal area, to
Confederation Lake.
Boojum Research Limited 92
South Bay 1992 Report for: BP Resources

8. DISCUSSION AND CONCLUSIONS
At the onset of the project in 1986, there was a considerable amount of uncertainty
associated with the Ecological Engineering approach. Although conceptually a self-
sustaining low maintenance, decommissioning approach appeared feasible for the
South Bay site, many components of the technology were undeveloped.
The key process which has been implemented at the mine site, Boomerang Lake, and
Decant Pond is biological polishing. It can be concluded that annual contaminant
loadings can be addressed by periphyton growth and ARUM.
Estimates of the effectiveness of the polishing system vary widely, depending on the
type of growth rates used (exponential or linear) and on the uptake/ adsorption/
precipitation rates. A combination of field and laboratory experiments were used to
derive the relevant parameters to quantify the metal removal process which is mediated
by periphyton. Both experimental approaches highlight several factors which contribute
to the performance. For example, light and fertilizer additions increased growth in the
laboratory, but the light intensity in the laboratory can not be directly related to the
actual light intensity the field populations are experiencing. The growth rates increased
both in the laboratory and in the field through additions of fertilizer. However, no
significant amounts of fertilizer have been added to any of the water bodies to date.
It has to be concluded that the system performance will likely increase at the time that
all scale-up measures are taken. The current estimates of the removal capacity are
based on data collected from periphyton populations under severely stressing
environmental conditions.
A technical challenge, in the development of Ecological Engineering as a
decommissioning strategy, was to find an ecosystem-compatible approach to remove
the accumulated contaminants within the waste management area. Natural phosphate
Boojum Research Limited 93
South Bay 1992 Repon for: BP Resources

rock was found to fill such a requirement. Phosphate has many ecosystem-friendly
advantages. It can raise pH, precipitate metals, provide fertilizer for periphyton, and
enhance sediment processes which will assist contaminant retention by sediments.
In conclusion, the original concept of Ecological Engineering, that a new ecosystem can
be developed within the waste management area, has been substantiated. This
ecosystem has the capacity to address annual contaminant loadings. In 1993, a scale
up of the system will be possible. This time frame is within the projected
decommissioning requirements.
Boojum Research Limited 94
South Bay 1992 Report for: BP Resources

9. RECOMMENDATIONS
There are three aspects of the waste management area which need to be addressed.
Boomeranq Lake
In Boomerang Lake, the residual acidity which has been accumulating since 1981 must
be dealt with. It is proposed that this accumulation be removed with phosphate rock.
The experimental application of phosphate rock to a fraction of the lake was successful.
The interaction between sediments and phosphate was found to be important.
In order to achieve this objective, the following tasks have to be completed:
1.
2.
Address the Redox conditions in Boomerang Lake sediments.
Resample the sediments from the locations where phosphate rock was
applied.
Carry out in situ (field) additions of phosphate rock to different sediment
types, varying by organic content.
Determine the microbial activity in the sediments.
Develop a phosphate rock application method.
3.
4.
5.
MinelMill Site
The tasks for the new Backfill Raise diversion ditch are as follows:
1.
2.
During spring run-off, the contaminant loadings should be evaluated.
Flows should be quantified during the summer months, as the magnitude
of these flows will determine the effect on Boomerang Lake.
The diversion ditch should be stabilized. Stabilization requirements of the
ditch banks needs to be determined after the hydrological conditions of
3.
Eoojum Research Limited 95
South Bay 1992 Report for: EP Resources

the diversion ditch are assessed. It is likely that a combination of semi-
aquatic and terrestrial vegetation should be promoted. Establishment of
semi-aquatic vegetation would promote biological polishing.
The effect of phosphate rock, which was applied to Mill Pond, has to be
evaluated.
4.
Decant Pond
The tasks which should be completed at Decant Pond include the following:
1. The development of ARUM along the tailings beach should be confirmed
through water and sediment sampling.
The performance of the coarse phosphate rock, placed on the perched
water table on the tailings should be quantified.
2.
Boojum Research Limited 96
South Bay 1992 Report for: BP Resources

10. APPENDICES
APPENDIX A
APPENDIX B
APPENDIX C
APPENDIX D
APPENDIX E
LIST OF REFERENCES, PAPERS AND REPORTS
ELECTROMAGNETIC SURVEYS AT SOUTH BAY, GEOMAR 1992
SEEPAGES OF THE SOUTH BAY MlNElMlLL SITE., by R.O. VAN
EVERDINGEN, NOVEMBER 1992.
BOOJUM QNQC INFORMATION
WATER AND SEDIMENT ICP DATA
Boojum Research Limited South Bay 1992 Report for: BP Resources

APPENDIX A LIST OF REFERENCES, PAPERS AND REPORTS
1992. Ten Hulscher T.E.M., G.A.J. Mol, F. Luers. Release of metals from polluted sediments in a shallow lake: quantifying resuspension. Hydrobiologia 235-236: 97-1 05.
1992. Kalin, M. R.O. van Everdingen, R.G.L. McCready. "Ecological Engineering interpretation of hydrogeochemical observations in a sulphide tailings Deposit." CIM Bulletin 85: 64-67.
1992. Kalin, M., W.N. Wheeler. "Periphyton Growth and Zinc Sequestration". Proceedings 1992 BlOMlNET Annual Meeting, Edmonton, Alta, August 1992 (in press).
1992. Kalin, M., W.N. Wheeler. "A study of algae-precipitate interactions." Final Report to CANMET, DSS File #034SQ.23440-1-9011, 58 p.
1991. Kalin, M., "Ecological engineering applied to base metal mining wastes for decommissioning." Proceedings 1990 BlOMlNET Annual Meeting, 1991 (in press). 1991. Kalin, M., W.N. Wheeler, R.O. van Everdingen. " Periphyton communities as biological polishing agents in mine waste waters and the precipitation process in tailings." Final Report to CANMET, DSS File 028SQ.23440-0-9182, 54 p. + appdx.
1990. Kalin, M., "Ecological engineering applied to base metal mining wastes." Proceedings of the Canadian Land Reclamation Association (CLRA), 15th Annual Meeting, Acidity and Alkalinity in Terrestrial and Aquatic Reclamation, 1990, pp. 105- 112.
1990. Kalin, M., "Ecological engineering applied to base metal mining wastes." In, Acid Mine Drainacle - Desianincl for Closure (J.W. Gadsby, J.A. Malick, and S.L. Daly, editors), p.407-414. Papers presented at the 1990 GACIMAC Joint Annual Meeting, Vancouver.
1989. Kalin, M., "Ecological engineering and biological polishing: Methods to economize waste management in hard rock mining," in Ecoloclical Enaineerina: An introduction to Ecotechnoloclv, W.J. Mitsch and S.E. Jorgensen (Eds.), John Wiley & Sons, Inc., Toronto, pp. 443-461.
1989. Kalin, M., "Ecological engineering applied to base metal and uranium mining wastes."Proceedings of the 1989 Biohydrometallurgy Conference, Jackson Hole, Wyoming, August 13-18, 1989, pp. 363-368.
1989. Kalin, M., R.O. van Everdingen and G. Mallory, "Ecological engineering measures developed for acid-generating waste - The close-out of a decant pond." Proceedings of the International Symposium on Tailings and Effluent Management, Halifax, Nova Scotia, August 20-24, 1989, pp. 195-204.
Boojum Research Limited South Bay 1992 Report for: BP Resources

1989. Kalin, M., M. Olaveson and B. Mclntyre, "Phytoplankton and Periphyton Communities in a Shield Lake Receiving Acid Mine Drainage in NW Ontario." Proceedings of the Fifteenth Annual Aquatic Toxicity Workshop: November 28-30, 1988, Ed. R. Van Coillie et al., 1989. pp. 166-187.
1989. Kalin, M., M.P. Smith and R.O. van Everdingen, ''Ecological engineering measures developed for acid generating waste from a copper/zinc concentrator in Northern Ontario." Proceedings of the Conference "Reclamation, A Global Perspective," Calgary, Alberta, August 27-31, 1989, pp. 661-672.
1988. Kalin, M., "Ecological engineering and biological polishing methods to economize waste management." Proceedings of the 20th Annual Meeting of the Canadian Mineral Processors Ontario, January 19-21, 1988, pp. 302-318.
1988. Kalin, M., "Ecological engineering and biological polishing: Its application in close-out of acid generating waste management areas." Proceedings of the 1988 Mine Drainage and Surface Mine Reclamation Conference, Sponsored by the ASSMR, Pittsburgh, Pennsylvania, April 19-21, 1988, p. 399.
1988. Kalin, M. and R.O. van Everdingen, "Ecological engineering: Biological and geochemical aspects, Phase I experiments." in Environmental Management of Solid Waste, W. Salomons and U. Forstner (Eds.), Springer-Verlag, New York, pp. 114-128.
1988. van Everdingen, R.O., H.R. Krouse. "Interpretation of isotopic compositions of dissolved sulphates in acid mine drainage". Paper presented at the annual meeting of the American Society for Surface Mining and Reclamation, April 17-22, 1988, Pittsburgh, PA.
Boojum Research Limited South Bay 1992 Report for: BP Resources

APPENDIX B ELECTROMAGNETIC SURVEYS AT SOUTH BAY. GEOMAR 1992
Boojum Research Limited South Bay 1992 Report for: BP Resources

EM SURVEY SOUTH BAY RECLAMATION PROJECT
SOUTH BAY, ONTARIO
PREPARED FOR BOOJUM RESEARCH LIMlTED
PREPARED BY GEOMAR GEOPHYSICS LTD
MISSISSAUGA ONTARIO
APRIL, 1992

1.0 INTRODUCTION
A geophysical survey was carried out in March, 1992 in the vicinity of Town of South Bay,
Ontario. The purpose of the survey was to detect the presence of contaminants and abandoned
structures at the South Bay mine site. The work was authorized by M. Kalin of Boojum Research
Limited.
2.0 SURVEY DESCRIPTION
2.1 General
In its natural (uncontaminated) state, ground water acts as a relatively poor electrical
conductor. However, the presence of inorganic contaminants in the ground water can increase the
ground water electrical conductivity and thus the electrical conductivity of the saturated soil.
Generally, ground conductivity depends principally on (McNedl, 1987):
o
o
o
o
soil structure (coarser structure and smaller porosity producing lower conductivity)
clay content (increasing clay fraction) producing higher Conductivity
soil moisture content (increasing moisture producing higher conductivity)
conductivity of included pore water.
The conductivity of a water (electrolyte) is proportional both to the total number of ions in the
solution and their mobility. The mobility is different for different ions since it depends on their
diameter. Values for some common ions are given in table 1.

Table 1. Mobility of common ions at 25°C (after Keller and Frischknecht, 1966)
Ion Mobility (m2/s= v)
Ht 36.2 x 10" OH- 20.5 x 10" Sod 8.3 x 10" Nat 5.2 x 10" c1- 7.9 x 10" Kt 7.6 x 10"
NO,' 7.4 x 10" Lit 4.0 x 10"
HCO,' 4.6 x 10"
It has been shown that for average unconsolidated so& an increase of approximately 25 pprn
of total dissolved solids (TDS) of sodium chloride (NaC1) to soil water will increase the saturated
bulk soil conductivity by 1 mS/m (McNeill, 1987).
In order to best delineate the extent of contamination, a method that can resolve relative
changes in the subsoil conductivity caused by increases/decreases in the concentration of
contaminant in terms of total dissolved solids can be employed. For this reason a Fixed Frequency
Electromagnetic (EM) Profiling technique were employed for this survey. The basic principles of
the technique are briefly outlined below.
2.2 Fixed Freauencv EM Profiling
In the EM method, eddy current flow is induced in the ground by a time varying magnetic
field of a vertical or horizontal magnetic transmitter dipole operating at a fixed frequency. This

eddy current flow induces a secondary magnetic field which, together with the primary field, is
sensed by a similar receiver dipole. The ratio of the primary field and secondary fields is related
to the conductivity of the subsurface.
The instrument configuration, frequency and coil separation, are selected so that operation
can be described by the low induction number approximation (range in which the true conductivity
is linearly proportional to the apparent conductivity indicated by the instrument, McNeill, 1980)
over a relatively large range of terrain conductivities. In this sense, each induced eddy current loop
is independent of the others and the measured signal can be thought of as a linear superposition
of the responses of strata within the exploration range of the array used. The effective exploration
depth of the EM equipment can be varied by changing one or more of loop spacing, loop
orientation (vertical or horizontal), or height above the ground. Figure 3.1 shows relative responses
for vertical and horizontal dipoles (where z is the depth normalized by intercoil spacing s).
Frequency domain EM profiling can also be used for down-hole geophysical investigations.
In this case the tool is lowered down a drill hole. Then, with properly selected parameters of the
arrangement (such as the tool length, frequency, etc.), the measurements will be referred to the
conductivity of the subsurface in the vicinity of the plastic-cased (or open) borehole. The
instrument is essentially insensitive to borehole fluid conductivity. This technique is used in the case
when the detailed monitoring of the vertical distribution of the formation conductivity is required.
2.3 Instrumentation
The Fixed Frequency EM measurements were carried out using Geonics EM31-DL and
EM34-3 terrain conductivity meters.
3

42- s -L+ 1;o l i 5 ZiO 0 . 5 1 . 0 1 . 5 2 . 0
I 1
Vertical Dipole-Mode
Figure 3.1 Relative responses for vertical and horizontal dipoles.
The measurements with EM31-DL were taken with vertically oriented magnetic dipoles at
hip level. The instrument in this configuration has a depth of penetration up to 6 m. The distance
between the measurement points along the survey lines varied from 1 to 2 m.
The approximate exploration depths for EM34-3 instrument at various intercoil spacing are
given in Table 2. The relative contribution from material at different depths to the conductivity
indicated by the instrument meter is discussed in detail in literature (McNeill, 1980).
4

Table 2. Approximate Exploration Depths for EM34-3 at various intercoil spacings.
Intercoil Spacing (meters)
10
'Exploration Depth (meters)
Horizontal Dipoles Vertical Dipoles
7.5 15
20 15 30
The measurements with EM34-3 were taken at a distance of 10 m along survey lines. The
intercoil spacing for the horizontal dipole mode was 10 and 20 m, while for the vertical mode it was
20 m.
It should be understood that there are other factors, besides the presence of contaminants,
which can affect conductivity of the subsurface. The major ones are lithology and water content.
Factors affecting the soil conductivity were discussed above, and they are described in detail in
literature (McNeill 1980, and 1987). Those factors were taken into account in the description of
the survey results.
3.0 LOGISTICS
The survey was carried out by a two man crew. Both the crew and equipment were
mobilized from Mississauga to Town of Ear Falls by air. Local commercial facilities were used to
accommodate the crew. The crew travelled daily to the mine site by truck.
5
Three grids were surveyed in six days. Out of those, two days were spent for laying out the
grids, one day for EM31 measurements, and three days for EM34 measurements. The presence
of strong atmospheric noise and the weather conditions precluded the acquisition of EM34 data for
all grids.
4.0 RESULTS
The results of the survey are present in the form of coloured maps for each reading and
each grid. A number of areas of anomalous conductivity can be clearly seen on each grid. The
analysis of readings to different exploration depth shows that the anomalous objects occur as a rule
at shallow depths. The linear anomaly detected near Confederation Lake at the mine site presents
an exception. The amplitude of the anomaly is the greatest in EM34 1OH reading.
5.0. CONCLUSIONS AND RECOMMENDATIONS
A number of anomalies of increased conductivity were detected at all grids. The anomalies
appear to be in agreement with available information regarding the distribution of contaminants and
location of abandoned structures.
Regarding future studies, the following recommendations can be made:
Since many of the anomalies are produced by targets of small lateral extent, tighter survey
grid can be strongly recommended. This would help to outline the extent of anomalies more
accurately and clarify their nature.
6

The technique used is very efficient in mapping lateral variations in the subsurface
conductivity, The use of a sounding technique can be recommended for delineating these variations
in section view.
Many drill holes are available at the site. It will be beneficial to perform downhole
geophysical measurements. This would allow for accurate determinations of lithology and ground
water properties and provide valuable information for the analysis of surface data.
BIBLIOGRAPHY
1. G.V. Keller, F.C. Frischknecht (1966) "Electrical Methods in Geophysical Prospecting.
Ch.1. Pergamon Press, N.Y.
2. J.D. McNeil (1980) "Electrical Conductivity of Soils and Rocks" . Geonics Limited,
Technical Note TN-522 p.
3. J.D. McNeil (1980) "Electromagnetic Terrain Conductivity Measurements at Low
Induction Number". Geonics Limited, Technical Note TN-6, 15 p.
4. J.D. McNeil (1987) "Advances in Electromagnetic Methods for Groundwater Studies".
In: Proc. of Emloration '87, Ontario Geological Survey, Special Volume 3. 678 - 702.
7

Respectfully submitted Per Geomar Geophysics Ltd.
J. Pawlowski MSc..
8

200 E -100 N I
150 E I
100 E 1
50 E I
0 I 100 N -
I
I \ 50 N - I \
\ I I \
I I zoo s - A 50 E 100 E
I.- 150 S I ,
I I -200 s 150 E 200 E
Conductivity [ m s / m l
Scale 1:2400 25 0 25 50 75 100
(metres)
BOOJUM RESEARCH LIMITED
SOUTH BAY DIVERSION DITCH
March, 1992
ELECTROMAGN ETlC SURVEY INSTRUMENT EM31 -DL
VERTICAL DIPOLE MODE Soil Conductivity in rnS/rn - - Survey Line
Geomar Geophysics Ltd. Map 2- A


100
50
50
100
200 E -100 N I
100 E 150 E I I
0 50 E I I N -
I I I loo s- 0 50 E 100 E
/'- 150 S I
I
I I -200 s 150 E 200 E
Conductivity [ms /ml
h Scale 1:2400
25 0 25 50 75 100
(metres)
BOOJUM RESEARCH LIMITED
SOUTH BAY DIVERSION DITCH
March, 1992
ELECTROMAGNETIC SURVEY
HORIZONTAL DIPOLE MODE COIL SEPARATION 20 m Soil Conductivity in rnS/rn
INSTRUMENT EM34-3
- - Survey Line
Geomar Geophysics Ltd. Map 2- C

1
00 N - 250 W
I 200 w 150 W 100 w 50 W
I I I I 0 I
50 N - -50 N
50
. O
50 S
-100 s
-150 S
Scale 1:2400 25 0 25 50 75 100 125
(metres)
I0
3s
38
37
50 E 3e
-100 N '' I 3,
33
32 ,I
30
29
20
27
28
15
21
13
22 $3
PO IS ,a 17
16
I5
I +
13 I ?
I t
10
9
8
7
0
0
+ 3
2
2
I I I I I I 250 W 200 w 150 W 100 w 50 W A 50 E
Conductivity [ms/ml
BOOJUM RESEARCH LIMITED
SOUTH BAY TAILINGS DAMS 1 & 2
March, 1992
ELECTROMAGNETIC SU R V N INSTRUMENT EM31 -DL
VERTICAL DIPOLE MODE Soil Conductivity in mS/m - - Survey Line
Geornar Geophysics Ltd. MOP 3-A

APPENDIX C SEEPAGES OF THE SOUTH BAY MlNElMlLL SITE. By R.O. VAN EVERDINGEN, NOVEMBER 1992.
Boojum Research Limited South Bay 1992 Report for: BP Resources

SEEPAGES OF THE SOUTH BAY
MINE/MILL SITE
BY: R. van EVERDINGEN
NOVEMBER 1992

TABLE OF CONTENTS
A . CONFEDERATION LAKE SURVEY . . . . . . . . . . . . . . . . . . . . . . . . . . . . 1
B . WATERLEVEL ELEVATIONS . . . . . . . . . . . . . . . . . . . . . . . . . . . . . . . . 2
C . VARIATIONS IN CHEMICAL COMPOSITION WITH TIME . . . . . . . . . . . . 3
D . GEOCHEMICAL CALCULATIONS . . . . . . . . . . . . . . . . . . . . . . . . . . . . . 5
CONCLUSIONS / RECOMMENDATIONS . . . . . . . . . . . . . . . . . . . . . . . 11
APPENDIX A: Analyses used in WATEQ4F and NETPATH Modelling
Saturation Indices from WATEQ4F
Output from NETPATH Modelling
APPENDIX B:
APPENDIX C:
LIST OF FIGURES
Figure l a :
Figure 1 b:
Figure 1c:
Figure Id :
Figure 2a:
Figure 2b:
Figure 3a:
Figure 3b:
Figure 4a:
Figure 4b:
Survey Locations. July 1992 . . . . . . . . . . . . . . . . . . . . . . . . . . . . . 13
Survey Depths (m). July 1992 . . . . . . . . . . . . . . . . . . . . . . . . . . . 13
Conductivity Survey. July 1992 . . . . . . . . . . . . . . . . . . . . . . . . . . .
pH Survey. July 1992 . . . . . . . . . . . . . . . . . . . . . . . . . . . . . . . . . 14
14
Zinc Concentrations. July 12. 1992 . . . . . . . . . . . . . . . . . . . . . . . . 15
Water levels. July 12. 1992 . . . . . . . . . . . . . . . . . . . . . . . . . . . . . 15
Mine Site Piezometers . . . . . . . . . . . . . . . . . . . . . . . . . . . . . . . . . 16
Other Sources . . . . . . . . . . . . . . . . . . . . . . . . . . . . . . . . . . . . . . . 16
Piezometers MI4 . . . . . . . . . . . . . . . . . . . . . . . . . . . . . . . . . . . . . 17
Piezometers MI8 . . . . . . . . . . . . . . . . . . . . . . . . . . . . . . . . . . . . . 17

Figure 4c: Piezometer M38 . . . . . . . . . . . . . . . . . . . . . . . . . . . . . . . . . . . . . 18
Figure 4d: Piezometer M57 . . . . . . . . . . . . . . . . . . . . . . . . . . . . . . . . . . . . . 18
Figure 4e: Fe vs . S for Piezometer Samples . . . . . . . . . . . . . . . . . . . . . . . . . 19
Figure 4f: Fe vs . S for samples from Other Sources . . . . . . . . . . . . . . . . . . . 19
Figure 5a: Warehouse Seep . . . . . . . . . . . . . . . . . . . . . . . . . . . . . . . . . . . . . 20
Figure 5b: BR-CAP . . . . . . . . . . . . . . . . . . . . . . . . . . . . . . . . . . . . . . . . . . . 20
Figure 5c: Mill Pond . . . . . . . . . . . . . . . . . . . . . . . . . . . . . . . . . . . . . . . . . . . 21
Figure5d: BR-13 . . . . . . . . . . . . . . . . . . . . . . . . . . . . . . . . . . . . . . . . . . . . . 21
Figure 5e: C13-(-30) . . . . . . . . . . . . . . . . . . . . . . . . . . . . . . . . . . . . . . . . . . 22
Figure 5f: PR-Seep . . . . . . . . . . . . . . . . . . . . . . . . . . . . . . . . . . . . . . . . . . . 22
Figure 59: PR-Cap . . . . . . . . . . . . . . . . . . . . . . . . . . . . . . . . . . . . . . . . . . . . 23
LIST OF TABLES
Table 1: July 1992. Transects . . . . . . . . . . . . . . . . . . . . . . . . . . . . . . . . 24-28
Table 2: Seepage in the Backfill Raise Area . . . . . . . . . . . . . . . . . . . . . . 29-39
Table 3: Waterlevel Elevations . . . . . . . . . . . . . . . . . . . . . . . . . . . . . . . 40-52
Table 4: Data Sources for 1992 Samples Used in WATEQ4F and NETPATH . . . . . . . . . . . . . . . . . . . . . . . . . . . . . . 53
Table 5: Chemistry of Precipitation . . . . . . . . . . . . . . . . . . . . . . . . . . . . 54-56

SEEPAGES OF THE SOUTH BAY MlNElMlLL SITE
A. CONFEDERATION LAKE SURVEY
In mid-July 1992 the area of Confederation Lake along the shore of the South Bay
minelmill site was surveyed, and several water quality parameters were measured at
a number of points. The results are listed in Table 1 and illustrated by Figures IA-
ID. The locations are shown in Figure 1A and water depths in Figure IB. Results
of the measurements of conductivity and pH are shown in Figures 1C and ID,
respectively. The figures include the locations of, and measurements in, the Backfill
Raise Pond (BRP), Piezometer M18, seepage pond BR13, the Portal Raise Cap
(PRC), and the Portal Raise Seep (PRS), for comparison. (Note that the Easting
and Northing scales on these figures are not the same).
The data in Table 1 indicate imperfect vertical mixing, with the highest conductivity
being found near the bottom. The areal variations in water conductivity (Figure 1C)
and in pH (Figure ID) indicate two separate areas of more highly conductive water
with slightly lower pH, to the WNW from point PRS, and to the WSW from point
BR13. The more conductive water with lower pH was found some (minor) distance
out from the shore. These results suggest that contaminated water is discharging
from the lake-bottom sediments, some distance from the shore.
Table 2 lists partial analyses (pH, Cu, Zn, Fe, S, Ca, and Mg) for water samples
collected from various points in the mine/mill area at various times between
November 1986 and August 1992. Zinc concentrations for samples collected in July
1992 are plotted in Figure 2A. The areal variation in conductivity and pH values
(Figures 1C and ID), and in [Zn] values (Figure 2A) suggest that the more highly
contaminated water discharged at points BR13 and the PRS seeps has bypassed
Piezometer M I8 and the Portal Raise Cap.
1

The composition of the 1992 samples from the seepages (and from Piezometer
M14) differs from the composition of samples from piezometers M11, M18, and M38
(and from BR13B and PRC). In the seepage waters, Ca<SO, and Mg<Zn; the
piezometer waters, and the samples from PRC and B13B all show Ca>SO, and
Mg>Zn. As the piezometers sample the lower part of the overburden, and bedrock,
this suggests that heavy-metal contamination is concentrated in the near-surface
overburden.
The following may be sources for the heavy metals in the seepage:
a - tailings spill(s);
b -
c - d - e -
contaminated materials in the former Backfill Raise pond;
contaminated 'fill' on the minelmill site;
the Mill Pond; and
the mine shaft, the Backfill Raise, or the Portal.
B. WATERLEVEL ELEVATIONS
Waterlevel elevations determined in the minelmill area during 1992 are listed in
Table 3, and illustrated by Figures 2B, 3A, and 3B. Figure 2B shows the
waterlevels for the various sample sources on 12 July 1992. It indicates that
waterlevel decreases from MI3 to M57; that waterlevels in the former M11, the Mill
Pond, and M38 are relatively similar; that from there waterlevels decrease
progressively to WHS to BRP to MI8 to BRClPRC to BR13 and PRS, and finally to
Confederation Lake and the subaqueous seeps. In M14, in the small valley carrying
the overflow from the Mill Pond, the waterlevel is slightly lower than that of the WH
Seep
Seasonal variations in waterlevels for the piezometers in the minelmill area, during
the period from October 1986 to August 1992, are shown in Figure 3A. The graphs
indicate that the highest measured waterlevels in all these piezometers occurred
2

during the spring of 1990 (it should be noted that no measurements were recorded
during 1991, and that the few waterlevel measurements during 1992 may have
missed the maximum waterlevels). During most of the period of record, waterlevels
decrease from MI3 to M57 (to the former M11) to M38 to M18; the waterlevel in
M I4 was intermediate between the levels in M38 and M18.
The few waterlevel measurements made during 1992 in ponds, seepages and mine
structures are illustrated by Figure 3B. The plot again indicates that the waterlevels
decrease from MP to WHS to BRP to BRCIPRC to PRS. Waterlevels below the
Backfill Raise Cap and below the Portal Raise Cap are virtually the same; they are
likely to represent the waterlevel in the mine.
Distances from the tailings spill site and from Mill Pond to Confederation Lake are
about 260 m; distances from those points to Boomerang Lake are about 335 m and
about 450 m, respectively. This means that, where bedrock does not obstruct flow,
subsurface water would preferentially move towards Confederation Lake, due to a
stronger gradient.
Depths to bedrock determined during piezometer installation were: M I 1 - 25.0 ft;
M I8 - 24.7 ft; and M38 - 18.5 ft. Only a few scattered bedrock depths are shown on
the bedrock contour map by Morton Geotech (their Drawing #8). Additional depth-to-
bedrock data might be available from exploration drillholes.
C. VARIATIONS IN CHEMICAL COMPOSITION WITH TIME
Figures 4A to 4D show the variations in the concentrations of S, Fe, Mn, Zn, Ca,
and Cu (if present) in samples collected from piezometers M14, M18, M38, and M57
in the minelmill area in the period from November 1986 to August 1992. With the
exception of [Mn] in M14, and possibly [Fe] in M57, the sulfur and metal
concentrations show a small long-term decrease. Compared to the other
3

piezometers, the water in M I4 was high in both zinc and copper; this has been
interpreted as being due to blowing metal-sulfide dust from the mill site.
Figures 4E and 4F show the relationship between [Fe] and [S] for samples from all
piezometers at South Bay, and for samples from other (surface-water) sources,
respectively. The location of a number of the points in Figure 4E between the lines
for pyrite and pyrrhotite suggests that at least some of the Fe and S has been
derived from the oxidation of pyrrhotite; there is no indication of this in Figure 4F. It
is likely that the low Fe content of most of the samples in Figure 4F reflects a higher
degree of loss of Fe due to aeration.
Figures 5A to 5G show the variations in metal and sulfur concentrations during the
(spring and) summer of 1992 in samples from several of the other sources in the
minelmill area (from Tables 2 and 3B).
The samples from the Warehouse Seep (Figure 5A) show minor dilution (decrease
in S and Ca), and significant depression of the metal concentrations which may be
related to an increase in pH. [Fe] reacts anomalously.
The samples from the Backfill Raise Cap (Figure 5B) also show minor dilution
(decrease in S and Ca), and depression of metal concentrations.
The samples from the Mill Pond (Figure 5C) show minor dilution between 24 March
and 13 July, more dilution between 13 July and 18 July, and a recovery between 18
July and 14 August. Both the initial decrease and the subsequent increase were
largest for [Fe].
The samples from the BR13 Seep (Figure 5D) show dilution between 13 July and
16 July, followed by a recovery between 16 July and 14 August. Again, the effects
were largest for [Fe].
4

The samples from the Cl3-30 Seep (Figure 5E) show the effects of dilution from 24
March to 15 July, followed by a recovery between 15 July and 14 August. [Fe]
again showed the largest effects.
The samples from the Portal Raise Seep (Figure 5F) show and increase in
concentrations (except [Ca]), between 13 July and 16 July, followed by decreases in
concentration between 16 July and 14 August. Fe concentrations showed the
largest effects.
The samples from the Portal Raise Cap (Figure 5G) show increases in
concentration between 14 July and 14 August. [Fe] showed the largest effect.
D. GEOCHEMICAL CALCULATIONS
In early October 1992 it was suggested that geochemical calculations, using
WATEQ4F and NETPATH, should be carried out to try and shed more light on the
development of the water chemistry in the area, and on the potential source(s) of
the heavy-metal contamination. For this purpose all available analyses for samples
from the area were evaluated for their possible use in such calculations. It was
found that some of the required data, including field measurements of water
temperature, pH and Eh, were missing for a number of the analyses.
MISSING DATA
Field data on temperature, pH, and Eh are not available for the 34 samples of
March 1992, and no alkalinity concentrations were determined for those samples.
Similarly, field data are not available for 18 of the 51 samples of July 1992, and
alkalinity (or TIC) concentrations were determined, in the laboratory, on only 17 of
the 51 samples. Finally, field data are not available for 12 of the 29 samples of
August 1992, and alkalinity concentrations were determined, in the laboratory, on
only 12 of the 29 samples.
5

TIC values were given for eight of the July 1992 samples, all with pH values above
4.5, and not for any of the samples with pH values below 4.5, for which such
information would have been very useful.
[CI] data were not available for any of the 1992 samples; data on phosphate and
nitrate concentrations were very limited.
In addition to the above, Table 2 lists a number of samples from "seepages in the
Backfill Raise area", collected in July '87, May '89, and in May, June, July and
September '91. Only partial analyses were made available for the samples
collected in May 1989, and on those collected on the 4 dates in 1991.
Table 4 indicates the sources of the values of T, pH, Eh, and alkalinity (or TIC) for
the selected sample analyses that were used in the geochemical modelling.
Appendix A presents the analytical data for each of the selected samples used in
the modelling. It includes an analysis of "distilled water"; an estimated analysis for
"precipitation" in the area; and an analysis of water from a pond in a gravel pit
outside the minelmill area, to represent "uncontaminated" groundwater. The
concentration values for "precipitation" were derived from geometric mean monthly
values for 1981-1983, shown in Table 5 (from "Summary Statistics", Acid
Precipitation Study, Ontario Ministry of Environment).
DEGREES of SATURATION (from WATEQ4Fl
In order to determine which minerals were likely to be dissolved by, or precipitated
from, any of the selected water samples, the speciation program WATEQ4F (version
2.0, USGeological Survey Open-File Report 91-183) was used to calculate
saturation indices (SI values) for any minerals containing a combination of the
elements determined during chemical analysis of the water samples. This
information enabled the selection of the most likely dissolved and precipitated
6

minerals to be used in the program NETPATH (version 1.5, U.S.Geological Survey
Water-Resources Investigation Report 91-4078), as described in the next section of
this report.
It was assumed that pyrite, chalcopyrite, and sfalerite were the minerals most likely
to be dissolved by waters in the minelmill area. Appendix B lists the calculated
positive saturation indices (SI) with respect to the most likely precipitate minerals, for
each of the selected samples. It should be pointed out that a positive SI value for a
particular water with respect to a particular mineral means (1) that the water is
supersaturated with respect to that mineral; (2) that the water is not likely to dissolve
more of that mineral (if available); and (3) that the mineral may be precipitated from
the water. If supersaturation is shown with respect to more than one mineral
containing the same elements, then the mineral showing the highest SI value is
most likely to precipitate.
It should also be pointed out that due to the lack of data on the concentrations of
carbon species, chloride, nitrate and phosphate, all carbonate, chloride, nitrate and
phosphate minerals had to be omitted from consideration.
The main observations from the WATEQ4F results are:
1.
2.
All samples containing Ba showed supersaturation with respect to barite.
All samples containing Cu showed supersaturation with respect to cuprous
ferrite.
All samples containing Fe showed supersaturation with respect to goethite
and hematite.
All samples containing Al showed supersaturation with respect to annite;
some also showed supersaturation with respect to boehmite and gibbsite;
the samples from BRC, PRS, and the gravel-pit pond also showed
supersaturation with respect to one or more clay minerals.
3.
4.
7

5. All samples except that from the gravel-pit pond ([Si]=0.34mg/L) showed
supersaturation with respect to quartz.
All samples except those from WHS, Mill Pond, and BR13, showed
supersaturation with respect to ZnSiO,. The July and August samples from
WHS, Mill Pond, and BR13 were understurated with respect to this mineral.
6.
The use of laboratory measurements of Eh may of course have distorted the extent
of goethitelhematite supersaturation, whereas the use of laboratory measurements
of pH may have distorted the extent of supersaturation with respect to pH-sensitive
minerals, including goethite, hematite, boehmite, and gibbsite.
DISSOLUTION, PRECIPITATION, MIXING. and DILUTION (using NETPATH)
Appendix C presents the input and the results of the NETPATH modelling for each
of the selected samples.
As pointed out earlier, due to lack of information on the concentrations of carbonate,
chloride, nitrate, and phosphate in the samples, these ions, as well as the mineral
species to which they would contribute, had to be omitted from consideration. This
will have tended to limit the reliability of the results.
For some of the sample sources, precipitation (rain or snowmelt) or uncontaminated
groundwater was assumed to be the original input ("Initial Source" in Appendix C),
and NETPATH was used to determine how much of which minerals had to be
dissolved (or precipitated) to derive the final water ("Final Source"), as sampled.
For some of the other sources, a mixture of contaminated and uncontaminated
waters ("Initial Source 1" and "Initial Source 2") was assumed as input, and
NETPATH was used to determine the probable mixing ratio, as well as possible
mineral dissolution and precipitation. Finally, for some of the sample sources two
samples taken before and after dilution by rain or snowmelt ("Initial Source" and
"Final Source") were used in NETPATH to determine the dilution ratio.
8

The waterlevel relationships (Figure 3B) suggested that M57, M38, (MII) , WHS,
and MP (and probably BRP and M18) receive their heavy-metal contamination from
near-surface sulfide sources on the minelmill site; that BRC and PRC both contain
mine water; and that BR13, C13-30, and PRS discharge water with progressively
smaller fractions of heavy-metal contaminated water.
The WHS water can be derived from either precipitation (Appendix C-I) or
uncontaminated groundwater (Appendix C-2 and C-3) through dissolution of oxygen,
sfalerite, pyrite, minor chalcopyrite, and some felspar, and precipitation of goethite
(or hematite), silica, and gibbsite.
The BRC water of 14 July can be derived from either precipitation (Appendix C-4) or
uncontaminated groundwater (Appendix C-5) through dissolution of somewhat
smaller amounts of oxygen, sfalerite, pyrite, a trace of chalcopyrite, and some
felspar, and precipitation of goethite, silica, and gibbsite.
The PRC water of 14 August can be derived from a mixture of some 4% WHS water
and 96% uncontaminated groundwater (Appendix C-6) or from a mixture of about
5% BRC water with 95% uncontaminated groundwater (Appendix C-7),
accompanied by dissolution of minor amounts of oxygen and felspar, and
precipitation of minor amounts of zinkite, goethite, and copper sulfate (or, more
likely, carbonate). The decreases in CalS and Ca/Zn ratios, and increases in sulfur
and heavy-metal concentrations between 14 July and 14 August indicate that the
percentage of contaminated water in PRC water is increasing.
The PRS water of 13 July can be derived from a mixture of some 14% WHS water
and 86% uncontaminated groundwater (Appendix C-8), accompanied by dissolution
of minor amounts of oxygen, felspar, and chalcopyrite, and precipitation of zinkite,
and a minor amount of goethite. Between 13 July and 14 August, the PRS water
was likely diluted by a factor of about 1.5, accompanied by dissolution of trace
9

amounts of oxygen and pyrite, and precipitation of some zinkite and trace amounts
of copper sulfate and MnOOH (Appendix C-9). The decrease in the percentage of
WHS water between 13 July and 14 August, is indicated by decreases in metal
concentrations and a change in the CalS ratio (Figure 5F). The peak in sulfur and
metal concentrations on 16 July, shown in Figure 5F, may well reflect the discharge
of a slug of contaminated water, pushed by infiltrating rainwater.
The MP water can be derived from precipitation (Appendix C-10) through dissolution
of oxygen, sfalerite, pyrite, and some chalcopyrite and felspar, and precipitation of
goethite, and some silica. Between 13 and 18 July, the MP water was likely diluted
by a factor of about 1.3, accompanied by dissolution of a trace amount of oxygen,
and precipitation of some zinkite and trace amounts of copper sulfate and MnOOH
(Appendix C-I 1). Similarly, it is likely that the sample of 14 August was a mixture of
about 90% of the MP water of 13 July and 10% precipitation, accompanied by
dissolution of a trace amount of silica, and precipitation of zinkite, some gibbsite,
and a trace amount of copper sulfate or possibly carbonate (Appendix C-12). "Blue"
holes observed in the Mill Pond in mid-July may well have reflected some
precipitation of secondary copper minerals.
The BR13 water can be derived from a mixture of some 43% BRC water and 57%
uncontaminated groundwater (Appendix C-I 3), accompanied by dissolution of minor
amounts of oxygen, pyrite, and felspar, and precipitation of zinkite, and minor
amounts of MnOOH and cuprous-ferrite. Between 13 and 16 July the PRS water
was likely diluted by a factor of about 2.2, accompanied by dissolution of trace
amounts of oxygen and sfalerite, and precipitation of trace amounts of goethite and
MnOOH (Appendix C-14).
The C13-30 water can be derived from a mixture of some 41% BRC water and 59%
uncontaminated groundwater (Appendix C-I 5), accompanied by dissolution of minor
amounts of oxygen and pyrite, and precipitation of zinkite, and minor amounts of
10

MnOOH, cuprous-ferrite, and silica. Between 15 July and 14 August the PRS water
recovered from a likely dilution by a factor of about 2.0, which had been
accompanied by dissolution of trace amounts of oxygen, sfalerite, and MnOOH, and
precipitation of a trace amount of goethite (Appendix C-16).
CONCLUSIONS I RECOMMENDATIONS
The drainage ditch from the BRC site to Boomerang Lake, currently under
construction, is likely to divert a significant portion of the contaminated seepage that
may at present be directed from the minelmill area towards Confederation Lake.
Perforation of the Backfill Raise at the level of the new drainage ditch would limit the
maximum possible waterlevel in the mine, and this would in turn reduce the potential
for discharge of highly contaminated water from the mine, through the Portal area, to
Confederation Lake.
Lowering the water table in any of the sulfide-bearing materials in the subsurface of
the minelmill area may of course enhance oxidation of the metal-sulfides contained
in them. A further point that should be checked is the potential effect of watertable
drawdown on vegetation in the vicinity of the drainage ditch.
Although removal of spilled tailings (and any other sulfide-bearing materials) from
the minelmill area to the tailings area could eliminate significant potential sources of
contamination, the disturbance created by the removal operation itself could cause
increased contamination of subsurface waters in the site, at least temporarily.
In early October it was suggested that water samples should be collected from all
significant inflows (seeps) during excavation of the ditch. If at all possible, pH, Eh,
and temperature of the samples should be measured in the field; samples should be

properly preserved for analysis; and they should be forwarded to Boojum Research
Limited for laboratory analysis.
In addition, if significant flows with elevated Zn andlor Cu concentrations are
encountered, approximate discharge rates should be determined to allow an
estimate of the additional Zn and Cu loadings to Boomerang Lake.
The above information on water chemistry and flow rates will be needed to allow a
proper "post-mortem" analysis of the ditch project, particularly if the ditching does
not solve the seepage problem completely.
R. 0. van Everdingen
27 November 1992
12


I I I I I I I I I I I I I I I
Figure 1 -C. Conductivity Survey July 1992
14oOo
13800
18m
130
13500,
13400
62 186 eu
133m. 11
Figure 1-0. pH Survey July 1992
13900 7.1
3.6 13800
'.2 6.7 6.6 6.0 6.2 6.0 5.36,7 5.3
6.1 6.1 5.7537 6.6
6.6 6.S6.7
6.6 6.66t7
7.8
.. . 6.9
3.5 $5
6.2 6.$
6.4 6.3%5.45 I I I I
13500
7.0 6.S.Z.4 6.9 7.6.4 7.0 63.0
7.06.5 7.1
13400
13300 11 0 llh llb 12bo 12400 I& I& 1:
EASTING, m


FIGURE 3-A. Mine-Sii Piezarneters
450
iy - !&=&a ..............................................................................................................................................................................................
-- I ..............................................................................................................................................................................................
E .............................................................................................................................................................................................. n
'- I ............................................................................................................................................................................................... '4
-1
0 , w I I
mar-86 11 dug-87 mec-88 07Mq-80 1 Bsep-al 31 -. DATE
42€
424
422
41 6
41 4
41 2 16-1
FIGURE 3-8. OTHER SOURCES
........................................................................................................................................................................................
........................................................................................................... ,
........................................................................................................................................................................................
........................................................................................................... * .........................................................................
........................................................................................................................................................................................ 3#
..............................................................................................................................................................
A
I I I 3-€0 OE&r-92 26Maym 1 WUI-92 M S E p - 9 2 2%
DATE
M14
M18
BRC
st-92

I
+

I low
I
I I
I I I I I I
100
6
I
11/08/81 21/12/80 31/01/03
+s + F . C y I 8% *B
I I I

I I I I I I I I I I I I I I I I I I I
/

I I
I
I I
I
I I I I I I
Ff 0 5 a w A & L € - s m
lWD0
IWO


I I I I I I I I I I I I I I I I I I I
CONFEDERATION LAKE JULY 1992 TRANSECTS COORDINATES, n COORDINATES, m
EASTINQ NORTHINQ DEPTH,m W-E S-N Point # n n z rn m .-.-.-.-----l_l- -I.--.------_ ======= =======
BRC WH8 M38 BRP M18 PRC
BR13 PRS
36 37 38 39 40 41 42 43
1 2 3 4 5 6 7 8 9
10 11 12 13 14 15 16 17 18 19 20 21 22 23 24 25 26 27 28 29 30
29A 31 32 33 34 35 c8
12610 12720 12660 12400 12315 12320 12155 12118 1xx)3 11996 11998 12013 12018 1ZXO 12035 12045 11998 12001 11998 11988 11981 11988 1- 12008 12018 1Xn3 11974 11981 1 1976 11969 11961 11969 11981 11986 11993 11996 11946 11937 11927 11922 11922 11932 11944 11949 1195s 11961 11895 11919 11887 11838 11779 11720 11570
13781 13700 13380 13965 13900 13660 13795 13515 13460 13500 13537 13581 13628 13669 13692 13716 13357 13394 13426 13455 13512 13554 13605 13650 13694 13733 13357 13394 13421 12453 13512 13559 13608 13652 13639 13738 13337 13384 13421 13463 13514 13581 13615 13655 13706 13736 13708 13746 13748 13751 13751 13751 13544
0.0 0.0 7.1 0.0 8.7 0.0 0.0 0.0 1.5 1.3 1.8 2.7 2.3 1.3 1.1 0.4 1.1 1.8 2.3 2.7 2.9 2.9 2.5 2.0 1 .o 0.5 1.2 1.9 2.4 2.8 3.2 3.2 2.6 3.2 2.0 2.0 1.5 2.5 3.4 3.6 4.1 4.0 3.5 3.6 3.1 2.1 3.2 2.3 3.5 4.2 4.2 4.3 5.0
330.0 363.8 328.5 240.0 228.8 228.8 174.0 160.5 132.0 129.8 130.5 135.0 136.5 140.3 141.8 144.8 130.5 131.3 130.5 127.5 125.3 127.5 132.0 133.5 136.5 138.0 123.0 125.3 123.8 121.5 119.3 121.5 125.3 126.8 129.0 129.8 114.8 111.8 108.8 107.3 107.3 110.3 114.0 115.5 117.8 119.3 99.0
106.5 96.8 81.8 63.8 45.8 0.0
142.5 117.0 19.5
199.5 179.3 103.5 139.5 48.0 42.8 54.8 66.0 79.5 93.8
106.5 113.3 120.8 11.3 22.5 32.3 41.3 58.5 71.3 87.0
100.5 114.0 126.0 11.3 22.5 30.8 40.5 58.5 72.8 87.8
101.3 115.5 127.5
5.3 19.5 30.8 43.5 59.3 73.5 90.0
102.0 117.8 127.5 118.5 129.8 130.5 131.3 131.3 131.3 68.3

I I I I I I I I I I I I I I I I I I I
CONFEDERATION LAKE JULY 1992TRANSECTS
Conductivity PH Zinc
Point # TOP HALFWAY BOlTOM BOTTOM rndL --I--.-_ ---- --
BRC WH8 M38 BRP M18 PRC
BR13 PRS 36 37 38 39 40 41 42 43
1 2 3 4 5 6 7 8 9
10 11 12 13 14 15 16 17 18 19 20 21 22 23 24 25 26 27 28 29 30
29A 31 32 33 34 35 CB
62.1 62.1 62.1 62.2 61.8 62.4
62 62 62 €3 62 62 61 62 61 55 50 50 60 50 50 50 50 50 50 50 50 50 50 50 50 50 50 50 50 50 50 50 50 50 50 55 50 50 50 50 50 50 50 50 50 50 50 50 50 50
1850 2650 450
850 300
1600 870 60 60 60
1050 1450 550 300 750 185 140 667 757 900
1287 1270 350 550 140 62 50 65
1 70 900 870 550 230
1700 850 60 55 60 60 300 600 270 340 980
1800 700 600
1800 210 340 1 3 0 55
5.6 642 3.2 919 6.3 15.8 3.0 7.1 12.3 7.8 1.24 3.6 173 3.5 122 7.4 7.5 7.5 6.9 6.7
7.0 8.4 6.4 6.4 6.2 62.7 6.4 6.7 5.7 6.7
7.0 6.8 6.3 6.3 6.6
5.8 7.1 7.0 6.9 7.0 6.4 6.2 6.6 6.6 6.1 6.0 71.3 6.1 6.2 6.0 6.6 6.7 7.2 7.7 0.082
/’

I I I I I I I I I I I I I I I I I I I
BRC WH8 M38 BRP M18 PRC
BR13 PRS
36 37 38 39 40 41 42 43
1 2 3 4 5 6 7 8 9
10 11 12 13 14 15 16 17 18 19 20 21 22 23 24 25 28 27 28 29 30
29A 31 32 33 34 35 c8
m . 0 242.5 219.0 160.0 152.5 152.5 116.0 107.0 88.0 88.5 87.0 90.0 91.0 93.5 94.5 96.5 87.0 87.5 87.0 85.0 83.5 85.0 88.0 89.0 91 .o 92.0 82.0 83.5 82.5 81 .o 79.5 81.0 83.5 84.5 86.0 86.5 76.5 74.5 72.5 71.5 71.5 73.5 76.0 77.0
79.5 66.0 71.0 64.5 54.5 42.5 30.5
0
76.5
95.0 0.0 78.0 0.0 13.0 7.1
133.0 0.0 119.5 8.7 69.0 0.0 93.0 0.0 32.0 0.0 28.5 1.5 36.5 1.3 44.0 1.8 53.0 2.7 62.5 2.3 71.0 1.3 75.5 1.1 80.5 0.4 7.5 1.1
15.0 1.8 21.5 2.3 27.5 2.7 39.0 2.9 47.5 2.9 58.0 2.5 67.0 2.0 76.0 1 .o 84.0 0.5 7.5 1.2
15.0 1.9 20.5 2.4 27.0 2.8 39.0 3.2 48.5 3.2 58.5 2.6 67.5 3.2 77.0 2.0 85.0 2.0 3.5 1.5
13.0 2.5 20.5 3.4 29.0 3.6 39.5 4.1 49.0 4.0 60.0 3.5 €8.0 3.6 76.5 3.1 85.0 2.1 79.0 3.2 86.5 2.3 87.0 3.5 87.5 4.2 87.5 4.2 87.5 4.3 45.5 5
1.9 2.7 0.5
0.9 0.3 1.8 0.9 0.1 0 m from shore S-N 0.1 0 m from shore S-N 0.1 0 m from shore S N 1.1 0 in from shore S-N 1.5 0 m from shore S-N 0.6 0 in from shore S-N 0.3 0 m from shore S-N 0.8 0 m from shore S-N 0.2 "5 m from shore S-N 0.1 "5 m from shore S-N 0.7 "5 m from shore S-N 0.8 "5 m from shore S-N 0.9 "5 m from shore S-N 1.3 "5mfromshoreS-N 1.3 "5 m from shore S-N 0.4 "5 m from shore S-N 0.6 "5 m from shore S-N 0.1 "5 m from shore S-N 0.1 "10mfromshoreS-N 0.1 "10mfromshoreS-N 0.1 "10mfromshoreS-N 0.2 "10mfromshoreS-N 0.9 " 10 m from shore S-N 0.9 "10 m from shore S-N 0.6 "10 m from shore S-N 0.2 "10 m from shore S-N 1.7 "10mfromshoreS-N 0.7 "10 m from shore S-N 0.1 "25 m from shore S N 0.1 "25 m from shore S-N 0.1 "25 m from shore S-N 0.1 "25 m from shore S-N 0.3 "25 m from shore S-N 0.6 "25 m from shore S-N 0.3 "25 m from shore S-N 0.3 "25 m from shore S-N 1.0 "25 m from shore S-N 1.8 "25 m from shore S N 0.7 E-W TRANSECT 0.6 E-W TRANSECT 1.8 E-W TRANSECT 0.2 E-W TRANSECT 0.3 E-W TRANSECT 0.1 E-W TRANSECT 0.1 On lake

I I I I I I I I I I I I I I I I I I I
CONFEDERATION LAKE
Point #
JULY 1992 TRANSECTS
BRC WH8 M38 BRP MI8 PRC
BR13 PRS
36 37 36 39 40 41 42 43
1 2 3 4 5 6 7 8 9
10 11 12 13 14 15 16 17 18 19 20 21 22 23 24 25 26 27 28 29 30
29A 31 32 33 34 35 c8 - - - - - - - - - - - - - -
330.0
328.5 240.0 228.8 228.8 174.0 160.5
142.5 117 19.5
199.5 179.3 103.5 139.5
48
363.8 1082.66 1193.57 1077.76
750.66 750.66 570.87 526.57
467.52 383.86 63.98 654.53 588.25 339.57 457.66 157.48
787.40
12610 12720 1B3X 124w 12315 12320 12155 12113
13781 13700 13380 13965 13900 13660 13795 13495
11527.3228 11526.4304 11582.2441 11612.5984 11564.3438 11569.3438 11584.1339 11586.4252 11569
13313.4803 13316.1417 13316.0236 13310.4724 1331 1.7454 13320.4331 13337.3228 13337.5197 13320

I I I I
07-Dec-92 TABLE 2.
SOUTHBAY SEEPAGES IN THE BACKFILL RAISE AREA
DATE ASSAYEFS# LOCATION PH cu Zn Fa S
SOUTHBAY SEEPAGES IN THE BACKFIU RAISE AREA
DATE ASSAYEFS# LOCATION PH cu Zn Fe S
16Jun-90 1807 CS13 5.4 1.05 0.08 7 - 16-Map91
I I I I I I I I I I I I I I I
25-Mar-92 15Jul-92
14-Aug-92 1 5 - J U l e
14-Aug-92 25Jun-91 26Jul-91
25sep-91 13Jul-92 16Jul-92
14-Aug-92 14-Maya9 14-Aug-92 14-Maya9 25-Aug43 23Jun-90 16-May-91 25Jun-91 26Jul-91
25Sep-91 14-Aug-92 1 5 ~ ~ 1 - 9 7
12-Aug-97 1 3 ~ ~ 1 - 9 7
12-Aug-97 05-o~i-97 11-Aprm 26Jul-91 13Jul-87
12-Aug-97 05-0ct-97 20Jun-88 14-Maya9 26Ju1-91 14Ju192
14-Aug-92 05-o~t-97 1 3 ~ ~ 1 - 9 7
12-Aug-97 16-May41 13Ju1-97
20Junm 06-Nova 02-Apr-87 14Jul-92
14-Aug-92 14Jul-92
13-Aug-92 24-Mar-92 13Jul-92 18Jul-92
3675 3886 4016 3887 4019 2887 3w7 3450 3867 3876 4019 1040 4022 1024 1285 1790 26M) 2868 3006 3449 4ox)
12 120 25
117 168 304
3005 4
119 1 75 471
1035 3004 3874 4023
169 17
118 2656
8 504
3878 4039 3873 4024 3678 3841 3848
CS13 CS13-6
CS13-30 CS13-30
BR13 BR13 BR13 BR13 BR13 BR13
BR13C BR13C
BR19 BR18 BR18 BR18 BR19 BR18 BR16 BR18 BRP BRP
BR1A BRlA BRlA BRlA BR1A BR5 BR5 BR5 BR4 BR4 BR4 BR4 BR4
BR3.5 BR3 BR3 BR3
BP2.5 BR2.5
M11 M11
WHS WHS BRC BRC MPC MPO MPO
~ ~ 1 3 - 9
.. . 5.2
3.39 5.73 6.04 5.78 5.78 3
3.14 3.72 3.63 5.54 3.61 5.6
4.97 3.28 3.52 4.2 3.5
3.22 3.56 3.7
5.41 3
4.54
3.6 3.35
2.62
5.87
3.02 2.95 3.86 3.14 6.34
3.1
6.7 6.57 3.24 3.55 5.61 4.6
4.67 3.25 3.65
0.04
0.007
6.22
4
1.02 5.9
0.405 10 0.1 0.7
0.76 0.78
1 0.073
0.7 0.5 0.5
0.01 0.5
0.06 2
0.5 0.02 0.1
1.4
0.356
0.5 0.01 0.24 0.2
0.01 0.1
0.07 9.29 7.46 1.85 1.29
4 25.2
14
1.62 168
62.7 17.5 71.3 142 295 199 221 173
84.2 163 881 78.2 249 1.3 128 81
96.2 73
138 18.9 119 11
14.8 2.5 19
4.1 101
7.2 0.7 20 39
6.94 16.8 0.4
0.1 96.9
3.6 22 15
919 492 642 4w 383 329 233
17 4.25
2.88 20.6 47.2 44 23
13.7 4.31 20.6 9.3
4.24 56 0.5 29 9.8
8 9
42 0.01 1
83 17
107 0.6
9 1
88
0.7
0.1 72 21
2.91 52.2
3.5 0.1
30.3
0.7 70
25.3 38.5 74.2 19.5 14.2
84 16.9
18
6. 43 23 63. 17 35 68 46 49 36 16 39
125 21 65 18 38 34 28 28 42 11 66 14 25 6
12 2
33 5
11 1
16 14
49. 15 2 4 2
22
3 60 56
107 97 83 81 63 49 39

I I I I I I I I I I I I I I I I I I I
07-Dec-92 TABLE 2.
SOUTHBAY: SEEPAGES IN THE BACKFILL RAISE AREA
DATE ASSAYERS# LOCATION PH CU Zn
13-Aug-92 16Jul-92 18JUl-92
13-Aug-92 13-Aug-92 13Jul-92
14-Aug-92 06-Nova 02-Apr-87 12-Apr-88 25-Mar-92 14JuI-92
14-Aug92
02-Apr-87 01Jun-87 12-Apr-88 14-0ct-W 25-Mar-92 14-Ju1-92
14Aug-92 14Jul-92
14-Aug-92 14-Aug-92 13-Aug-92
16Jul-92
06-N0v-86
4032 MPO 3861 TRO 3865 TRO 4033 TRO 4034 TRO 3868 PRS 3877 PRS 4038 PRS
M18 M16
330 M18 3651 M18 3870 M18 4026 M10
M38 M38 M38 M38
1478 M38 3672 M38 3871 M38 4036 M38 3875 PRC 4037 PRC 4G21 BR13B 4030 CAT2
3.69 2.96 4.74 2.4 4.2
5.62 3.51 5.64 6.7 6.6 5.8
8.52 7.13 6.6 6.5
6.25 6.03 6.07 5.55 6.07 6.31 6.13 7.81 6.26 6.51 7.5
14.3
3.78 1.32 4.7 1.5
19.6 0.578 0.05 0.02 0.1
0.007 0.06 0.01 0.07 0.03 0.06
0.017
0.038 0.024 0.M
191 116 154 213 2x2 46.2 122
22.2 7.4 4.8 19 10
12.3 8.91
55 TI 70 41 30 19
15.6 12.7 1.24 2.95 3.19 0.054
Fe
36.8 53.5 12.9 552 1.3
3.74 0.201
88 25 54
6.3 14.5
2.2 0.1
2
0.035
0.245 0.035 0.071
S
44 50 54
111 76 15 17
99. 32 39 34 21 21 22 12 17 17 15 8 8
80. 75. 24. 41. 11. 2.6

07-Dec-92 TABLE 2.
I I I
SOUTHBAY SEEPAGES IN THE BACKFILL RAISE AREA
DATE ASSAYERS# LOCATION Ca Mg
SOUTHBAY SEEPAGES IN THE BACKFILL RAISE AREA
DATE ASSAYERS# LOCATION Ca Mg
16Jun-90 1807 CS13 - 16-May.91
I I I I I I I I I I I I I I I
25-Mar-92 15Jul-92
14-Aug-92 15-Jul-92
14-Aug-92 25-Jun-91 26Jul-91
25Sep-91 13Jul-92 16JuI-92
14-Aug-92 14-May43 14-Aug-92 14-May# 25-Aug43 23Jun-90 16-May-91 25Jun-91 26Jul-91
25Sep-91 14-Aug-92 15Ju1-87
12-Aug-87 13Ju1-87
12-Aug-87 05-Oct-87 11-Apr-88 26Jul-91 l3Jul-87
12-Aug-87 05-Oct-87 XMun-88 14-May# 26Jul-91 14Jul-92
14-Aug-92 05-Oct-87 13Jul-87
12-Aug-87 16-May91 13 Ju1-67
20Jun88 06-Nova 02-Apl-67 14Jul-92
14-Aug-92 14Jul-92
13-Aug-92 24-Mar-92 13JuI-92 18Jul-92
2661 CS13 3675 3886 4016 3887 4016 2867 3007 3450 3867 3876 4019 1040 4G22 1M4 1285 1790 2660 2868 3w6 3449 4Mo
12 120 25
117 168 304 3005
4 119 175 471
1035 3004 3874 m 3 164 17
116 2656
8 504
3878 4039 3873 4024 3678 3841 3848
-13 CS13-6 '313-6
CS13-30 CS13-30
BR13 BR13 BR13 BR13 BR13 BR13
BR13C BR13C
BR18 BR16 BR18 BR18 BR16 BR18 BR18 BR16 BRP BRP
BR1A BRIA BR1A BRlA BR1A
BR5 BR5 BR5 BR4 BR4 BR4 BR4 BR4
BR3.5 BR3 BR3 BR3
BR2.5 BR2.5
M11 M11
WHS WHS BRC BRC MPC MPO MPO
302 196
61.7 129 275
221 118 240
158
99.7
29.5 47.3
683 728 513 483 476 474 373 278 236
85 32.4 10.5 23.8 46
47.7 26.7 53.5
32
16.2
6.84 15.1
61 79
153 132 129 111 79
51.4 42
-13 CS13-6
CS13-30 BR13
BR13C
BR18
BRP
BR1A
BR5
BR4
BR3.5
BR3
BR2.5 M11
WHS
BRC
MP

I I I I I I I I I I I I I I I I I I I
07-Dec-92 TABLE 2.
SOUTHBAY SEEPAGES IN THE BACKFILL RAISE AREA
DATE ASSAYERS# LOCATION Ca Mg
13-Aug92 16Jul-92 18Jul-92
13-Aug-92 13Aug-92 13Ju1-92 16Jul-92
14-Aug-92 06-Nova 02-Apr-87 12-Apr-88 25-Mar-92 14Jul-92
14-Aug-92 06-Nova 02-Apr-97 01Jun-97 12-Apr-88 14-Oct-83 25-Msr-92 14Jul-92
14-Aug-92 14Jul-92
14-Aug-92 14-Aug-92 13-Aug-92
__ 4032 3861 3865 4033 4034 3868 3877 4038
330 .?a57 3870 4026
1478 3672 3871 4036 3875 4037 4G21 4030
MPO TRO TRO TRO TRO PRS PRS PFS M18 M18 M18 M18 M16 M18 M38 M38 M38 M38 M38 M38 M38 M38 PRC PRC
BR13B CAT2
304 303 461 318 564 126
93.5 90.7 372 539 276 257 240 278 134 191 154 144 105 128 119 117
62.7 86
61.1 13.9
49.7 58.6 79.3 1 07
95.9 20.9 15.6 14.6 56 74 46 38
36.3 39.4
13 19 16 16 11 15
15.1 15.1 5.63 9.72 12.6 1.91
TRO
PRS
M18
M38
PRC BRl3B

07-Dec-92 TABLE 2.
I I I I I I I I 1 I I I I I I I I I
SORTED FOR ZINC SEEPAGES IN THE BACKFILL RAISE AREA
DATE ASSAYERS# LOCATION PH cu
SORTED FOR ZINC SEEPAGES IN THE BACKFILL RAISE AREA
DATE
12-Aug-87 13Jul-87 13Jul-87 13Ju1-87
13-Aug.92 12-Aug-87
20Jun-88 16Jun-90 14JUl-92
25Aug49 16-May91
14-Aug-92 14-Aug-92 20Jun-88 11-Apr-86 02-Apr-87 14JuI.92
05-o~t-87 06-Nov-86 14-Aug-92 25-Mar42 12-Aug-87 14Jul-92
13Ju1-97 02-Apr-87 14Jul-92
14-Aug-92 05-oct-87 14-Aug-92 14-Aug-92 25-Mare 12-Apr-86
14-May49 06-Nova 14-Aug-92 14-0ct49 26Jul-91 12-Apr-86 13Jul-92
06-Nov-86 15Jul-92
01 Jun-87 1Wul-92 26Jul-91 02-Apr-87 14-Aug-92 16-May41 16Jul-92
25Jun-91 16-May91
05-o~t-87
12-A~g-87
14-A~g.92
ASSAYERSX
119 8
17 4
4030 116 169 471
1807 3875 1285 2661
117 4037 4021 504 304
3874 1 75
4026 3657
120 3870 4036
25
3871 4016
168 4023 4Mo 3672
1035
4036
3004
3868
3886
3887 3006
4022 2660 3876 2868 2656
LOCATION
BR5 BR2.5
BR3 BR5
CAT2 BR3
BR3.5 BPd
'313 PRC
BR18 CS13 BRlA PRC
BR13B BR2.5 BRlA M18 BPd BR5 M18 M18 M18 BRP M18 M38
BR1A M11 M38
BRlA BPd
BR16 M38 M18 BR4 M11 PRS M38 BR4 M38 PRS M38
CS13-6 M38
cs13-30 BR18 M38
BR13C BR18 BR13 BR18 BR3
~ ~ 1 3 - 8
PH
7.5
8.34
5.4 7.81 3.52 5.2 3.6
6.28 6.51
6.6 3.86 5.87 6.7 6.6
6.52 4.54 7.13 6.13
6.57 6.31 6.04 3.35 3.14 5.41 6.07 5.8
3.02 6.7
5.64
2.95 6.07 5.62 6.5
5.73 6.03 5.78 3.56 6.25 4.97 3.5
5.54 3.22 3.1
c u
0.02 0.2 0.5 0.5
0.005 0.01
0.1 0.04 0.01
0.038 0.024 0.01 0.06 0.02
0.1 0.05
0.007
0.5
0.017 0.5
0.07
0.007 0.5
0.356 0.073
0.1 1.4 0.1
0.578
0.03 1.5
0.06
0.07
0.01 0.405 0.76
0.78 0.24
Zn
Zn
0.054 0.1 0.4 0.7
1.05 1.24 1.3
1.62 2.5
2.95 3.19 3.6 4.1 4.8
6.94 7.2 7.4
8.91 10 11
12.3 12.7 14.8
15 15.8 17.5
18 18.8 18.9
19 19 20 22
22.2 30 39 41
46.2 55
62.7 70
71.3 73 77
78.2 81
84.2 96.2 96.9
Fe
Fe
0.7
3.5
0.071 0.1
0.1 0.08
0.5
0.6 0.245 0.035
0.7 1
25 2.91
88
17
0.035 107
25.3
9 52.2
0.011 2
54 72 70
0.201 0.1 21 2.2
6.3 4.25
2.88 9
14.5 4.24 9.6
4.31 8
30.3
S
s
4 5
2.6 2 2 1 7
24. 18 6. 6
41. 11.
3 2 39 49. 11 32 22 21 14 21 75. 25 58 60. 63. 12 15 11 8 34 16 60 99.
8 14 15 15 12 23 17 17 28 17 21 34 18 28 22

07-Dec-92 TABLE 2.
I SORTED FOR ZINC SEEPAGES IN THE BACKFILL RAISE ARE4
I I I I I I I I I I I I I I I I I
DATE ASSAYERS#
WUl-91 3M)5 16Jul-92 3861 154 -87 12 1Mul-92 3677
23.Jun-90 1790 25Sep-91 3449 l4-Aug-SZ 4016 18JUl-92 3665
14-Aug-52 4019 25-Mar-92 3675 13Jul-92 3867
13-Aug-92 4032 26Jul-91 3007
13-Aug-92 4034 13-Aug-92 4033 25Sep-91 3450 18Jul-92 3848
14-Maye 1024 25Jun-91 2667 13.Jul-92 3841
24-Mar- 3678 13-Aug-92 4024 14Aug-92 4039
14-Maya 1040 14Jul-92 3873
14Jul-92 3676
LOCATION
BRlA TRO BRP PRS
BR18 BR18
'313-30 TRO
BR13 '313 BR13 MPO BR13 TRO TRO
BR13 MPO BR18 BR13 MPO MPC BRC
WHS BRC
BR13C WHS
PH
2.62 2.96
3 3.51 4.2 3.7
5.78 4.74 3.61 3.39 3.63 3.69 3.14 4.2 2.4
3.72 3.65 3.28
3 3.25 4.67 4.8
3.55 5.61 5.8
3.24
c u
2
0.7 19.6 0.7
1
3.78 1 .M
14.3
4.7 1.32
4 14 10
6.22 25.2
4 1 .29 7.46 1.65 5.9
9.29
Zn
101 116 119 122 129 136 142 154 163 168 173 191 199 209 213 221 233 249 295 329 383 400 492 642 681 919
Fe
88 53.5
63 3.74
29 42
20.6 12.9 20.6
17 13.7 36.8
44 1.3
552 23 18 58
47.2 18.9
84 14.2 74.2 19.5 9.3
36.5
5
33 50 68 17 38 42 35 54 39 43 36 44 46 76
111 49 39 65 68 49 63 81 97 83
125 1 07

07-Dec-92 TABLE 2. I I I I I I I I I I I I I I I I I I I
SORTED FOR ZINC SEEPAGES IN THE BACKFILL RAISE AREA
DATE ASSAYERS# LOCATION FeIS ZtVS
SORTED FOR ZINC SEEPAGES IN THE BACKFILL RAISE AREA
DATE
12-Aug-87 13Jul-87 13Jul-87 13Jul-87
13-Aug-92 12-Aug-87 05-Oct-87 20Jun-88 16Jun-90 14Jul-92
25-Aug-89 16-May91 12-Aug-87 14-Aug-92 14-Aug-92 XMun-88 11 -AprBB 02-Apr-87 l4JUl-92
05-Oct-87 06-Nova 14-Aug-92 25-Mar-92 12-Aug-87 14Jul-92
14-Aug-92 13Jul-87 02-Apr-87 14JUl-92
14Aug-92 05-Oc1-87 14-Aug-92 14-Aug-92 25-Mar-92 12-Apr-88
14-May- 06-Nov-88 14-A~g-92 14-Oct-89 26JuI-91 12-Apr-88 13Jul-92
06-Nov-88 15JuI-92
01 Jun-87 15Jul-92 26Jul-91 02-Apr-87 14-Aug-92 16-May41 16JuI-92
25Jun-91 16-May41
ASSAYERS#
119 8
17 4
4030 118 169 471
1807 3875 1285 2661
117 4037 4021 504 304
3874 175
4026 3657
120 3870 4036
25
3871 4018
168 4023 4Mo 3672
1035
4038
3004
3868
3886
3887 3006
4022 2660 3876 2868 2656
LOCATION
BR5 BR2.5
BR3 BR5
CAT2 BR3
BR3.5 BR4
CS13 PRC
BR18 CS13 BR1A PRC
BR13B BR2.5 BRlA MI6 BR4 BR5 M18 M18 M19 BRP MI8 M38
BRlA M11 M38
CS13-6 BRlA
BR4 BR18 M38 M18 BR4 M11 PRS M38 BR4 M38 PRS M38
CS13-6 M38
CS13-30 BRIE M38
ER13C BR18 BR13 BR18
BR3
FelS
3.93% 5.47% 2.66% 2.16% 1.46% 2.99%
0.42% 1.13% 0.17%
5.10% 0.15% 4.38% 1.63% 1.64% 1.83% 5.73% 0.01%
15.45% 3.68% 8.93% 0.00% 0.00% 0.00%
24.38% 0.52% 4.07% 2.50%
15.13%
0.00%
0.00%
0.41% 24.46% 8.31% 3.39%
18.97%
0.00% 4.67% 0.23% 7.80%
0.00% 1.12%
6.61% 2.48%
ZWS
21.00% 21.12% 21.85% 23.31% 24.43% 20.16%
34.34% 17.75% 13.49%
18.70% 0.34%
16.52% 11.48% 16.85% 12.65% 16.07% 8.13%
1.11% 0.60% 2.68% 2.29% 2.81% 1.92%
2.88% 1.86% 6.95% 8.74%
14.83%
0.00%
3.12%
2.45% 5.80%
13.19% 6.90% 5.83%
0.73% 0.00% 0.17%
21.31%
0.00% 4.90%
1.77% 1.26%
FeEn
FeRn
8.02% 11.15% 5.43% 4.41% 2.99% 6.09%
0.87% 2.30% 0.35%
10.40% 0.31% 6.93% 3.32% 3.34% 3.72%
11.68% 0.01%
31.51% 7.50%
18.22% 0.00% 0.00% 0.00%
49.71% 1.06% 8.30% 5.09% 30.84%
0.00%
0.00%
0.84% 49.88% 16.95% 6.91%
38.68%
0.00% 9.53% 0.40%
15.91%
0.00% 2.28%
13.48% 5.06%
BR13 BR13 BR13 BR13 BR13 BR13
BR13C BR13C BR13B
BR16 BR18 BR16 BR16 BR18 br16 BR16 BR18
m18 M19 M18 M18 M16 m18
BR1A BRlA BRlA BR1A BRlA
BR5 BR5 BR5
BR4 BR4 BR4 BR4 BR4
BR3.5 BR3 BR3 BR3
BW.5 BR2.5
M11 M11

I I I I I I I I
07-Dec-92 TABLE 2.
SORTED FOR ZINC SEEPAGES IN THE BACKFILL RAISE AREA
DATE
26Jul-91 16Jul-92 15Jul-87 16Jul-92
23Jun-90 25Sep-91 14-Aug-92 16Jul-92
14Aug-92 25Mar-92 13Jul-92
13-Aug-92 26JUl-91
13-Aug-92 13Aug-92 25Sep-91 18JuI-92
14-Maya 25Jun-91 13Jul-92
24-Mar-92 13-Aug-92
ASSAYERSR
3005 3661
12 3677 1790 3449 4018 3855 4019 3675 3667 4032 3007 4034 4033 3450 3848 1024 2867 3841 3678 m 4
LOCATION
BRlA TRO BRP PRS
BR16 BR18
CS1330 TRO
BR13 CS13 BR13 MPO BR13 TFIO
BR13 MPO BR16 BR13 MPO MPC BRC
mo
14-Aug-92 4039 WHS 14Jul-92 3673 BRC
14-Maya 1040 BR13C 14Jul-92 3678 WHS
FeIS
0.00% 1.12%
6.61% 2.46%
1.64% 1.63%
0.06% 1.34%
6.09% 1.36%
28.55%
ERR ERR
0.06% 0.00%
ZnlS
0.00% 4.90%
1.77% 1.26%
16.85% 12.65%
16.53% 10.63%
11.29% 13.91% 9.41%
ERR ERR
0.71% 12.22%
FeRn
0.00% 2.26%
13.46% 5.06%
3.34% 3.72%
0.13% 2.72%
12.43% 2.76% 56.22%
0.00% 2.50% 0.24%
0.13%
WHS WHS
BRC BRC
BRP BRP
PRC PRC
PRS PRS PRS
PRS PRS PRS
CS13
I I I I I I I I

I I I
I I I I I I 1 I I I I I I I I
07-Dee92 TABLE 2.
SOUTHBAY SEEPAGES IN THE BACKFILL RAISE ARE4
DATE ASSAYERSX LOCATION PH c u Zn Fe S
DATE ASSAYERS# LOCATION PH c u Zn Fe S
25-Mar-92 15Jul-92
14-Aug-92
15Jul-92 14-Aug-52
13JuI-92 16Jul-92
14-Aug-92 14-Aug-92
14-Aug-92
14Jul-92 14-Aug-92
14JuI-52 14-AUg-92
14JuI-52 13-Aug-92
24-Mar-92 13Jul-92 18Jul-92
13-Aug-92
16Jul-92 l&JUl-92
13-Aug-92 13-Aug-92
13Jul-92 16Jul-92
14-Aug-92
06-Nov-86 02-Apr-87
25-Mar-92 14 JuI-92
14-Aug-92
25-Mar-92 144.11-92
14-Aug-92
144~1-92 14-Aug-92
3675 3886 4016
3887 4018
3867 3876 4019 4022
4020
3874 4023
3678 4039
3873 4024
3678 3841 3848 4032
3861 3865 4033 4034
3868 3877 4038
3657 3870 4026
3672 3871 4036
3875 4037
CS13 CS13.6 CS13.6
CS13-30 CS13-30
BR13 BR13 BR13
BR13C
BR18
BR4 BR4
WHS WHS
BRC BRC
MPC MPO MPO MPO
TRO TRO TRO TRO
PRS PRS PRS
M11 M11
M18 M18 M18
M38 M38 M38
PRC PRC
3.39 5.73 6.04
5.78 5.78
3.63 5.54 3.61 4.97
5.41
3.86 3.14
3.24 3.55
5.61 4.8
4.67 3.25 3.65 3.69
2.96 4.74 2.4 4.2
5.62 3.51 5.64
6.7 6.57
6.52 7.13 6.6
6.07 6.31 6.13
7.81 6.28
0.007
1 .a2 0.405
0.073
0.356
8.29 7.46
1.85 1.29
4 25.2
14 14.3
3.78 1.32 4.7
1.5 19.6
0.578
0.1 0.07
0.007
0.017
0.038
168 62.7 17.5
71.3 142
173 84.2 163
78.2
18.9
6.94 18.8
919 492
642 400
383 329 233 191
116 154 213 209
46.2 122
22.2
22 15
10 12.3 8.91
19 15.8 12.7
1.24 2.95
17 43 4.25
2.86 20.6
13.7 4.31 20.6 4.24
0.01 1
2.91 52.2
38.5 74.2
19.5 14.2
84 18.9
18 36.8
53.5 12.9 552 1.3
3.74 0.201
70 25.3
2
0.035
0.245
23 63.
17 35
38 16 39 21
11
49. 15
107 97
83 81
63 49 39 44
50 54
111 76
15 17
99.
60 58
21 21 22
8 80. 75.
24. 41.

I I I I I I I I I I I I I I I I I I I
07-Dec-92 TABLE 2.
SOUTHBAY SEEPAGES IN THE BACKFILL RAISE ARE4
DATE ASSAYERS# LOCATION PH cu Zn Fe s
14-Aug-92 4021 BR13B 6.51 0.024 3.19 0.035 11.
13-Aug-92 4030 CAT2 7.5 0.005 0.054 0.071 2.6
DATE

I I I I I I 1 I I I I I I I I I I I I
07-Dec-92 TABLE 2.
SOUTHBAY SEEPAGES IN THE BACKFILL RAISE AREA
DATE ASSAYERSX LOCATION Ca Mg
25-Mar@ 3675 CS13 3M 65 CS13 lWUl-92
14-Aug-92
15Jul-92 14-Aug-92
13Jul-92 16Jul-92
14-Aug-92 14-Aug-92
14-Aug-92
14.JUl-92 14-Aug-92
14Jul-92 14-Aug-92
14Jul-92 13-Aug@
24-Mar-92 13Jul-92 1aJul-92
13Aug-92
16JUl-92 18JUl.92
13-Aug-92 13-Aug-92
13-Ju1-92
14-Aug-SZ
06-N0v-66
16Jul-92
02-Apr-87
25-Mar-92
14-Aug-92
25-Mar@ 14Jul-92
14-Aug-92
14Jul-92 14-Aug-92
14-Aug-92
14JUl-92
13-Aug-92
3886 CS134 196 32.4 4016
3887 4018
3867 3676 4019 4M2
4020
3674 4023
3678 4039
3673 4024
3676 3841 3848 4032
3861 3865 4033 4034
3868 3677 4038
3657 3870 4026
3672 3671 4038
3675 4037
4021
4030
CS13.6
CS13-30 CS13-30
BR13 BR13 BR13
BR13C
BR18
BR4 BR4
WHS WHS
BRC BRC
MPC MPO MPO MPO
mo TRO TRO TRO
PRS PRS PRS
M11 M11
M18 M18 M18
M36 M36 M38
PRC PRC
BR13B
CAT2
61.7
129 275
221 118 240 158
99.7
29.5 47.3
513 483
476 474
373 278 236 304
303 461 318 564
126 93.5 90.7
683 726
257 240 276
128 119 117
62.7 86
61.1
13.9
10.5
23.6 46
47.7 26.7 53.5
32
16.2
6.84 15.1
153 132
129 111
79 51.4
42 49.7
58.6 79.3 107
95.9
20.9 15.6 14.6
61 79
36 36.3 39.4
15 15.1 15.1
5.63 9.72
12.8
1.91
CS13-30
BR13 BR13C
BR18
BR4
WHS
BRC
MP
TRO
PRS
M11 I
M18
M36
PRC
BR13B
CAT2

07-Dec-92 TABLE 3
WATERLNEL ELEVATIONS. m
Elevations. m
CmrdinaWR) sbsk-up *men m coilor
LOCATION SOURCE SOUFCE Northing Easting TOP Bottom
M 1 3 PIELOMETER PiEZOMETER 13585 13740 0.17 427.38 428.28 413.28
MP MIUFUND MIU FUND 13180 13800
M 5 7 PIEMMETER PIEMMETER 13430 13800 0.73 4z.a 412.87 412.87
M 3 8 PIEMMETER PIEMMETER 13380 12880 0.- 423.53 417.m 418.48
M i l * PIEZOMETER PIEMMETEU 13580 13035 0.18 423.81 418.63 415.72
WHS WH SEEP WH SEEP 13703 12720
BRP SFR POND BFR FOND 13885 12-
M i 8 PIEMMETER PIEMMETER 13800 12315 0.71 417.13 W.41 409.18
PRC PR CAP PR CAP 13880 1 w O
BRC BFR CAP SFR CAP 13781 12810
B R 1 3 FUND FUND 13785 12155
PRS NORM SEEP NORTH SEEP 13515 12118
C30 SEEP in LK SEEP in LK 13738 12003
C6 SEEP in LK SEEP in LK 135% 12003
M 1 4 PIEZOMETER PIWMETER 13140 13855 0.30 418.24 414.80 413.28
------ _ _ _ _ _ _ ------- =E=PP=PP-=D =========== =====I===== p==ppP=p=== ===PPp-m=pp ==mPPE=I-=- =-====-====

collar b np
LOCATION SOURCE m
M13 PIEZOMETER 1410
MP MILL FUND
M57 PIEMMETER 8.88
M11 * PIEZOMETER 7.85
WHS WH SEEP
M14 PIUOMETER 488
M38 PIEMMETER 7.11
BRP BFR WND
M18 P l a O M m R a87
PRC PR CAP
BRC BFRCAP
BR13 POND
PUS NORM SEEP
C30 SEEP in LK
C6 SEEP in LK ------ ------ ===-======= ======s====

421.35
421.78
418.08
414.71
WATERLEVELS rn
1-88 05NWM4 Z2.NW.W JGNWM4 07-88 14DeoBB 21- 31700 31721 31738 31748 31753 31760 31787
LOCATION
M13 424.37 423.25 423.00 422.80 42284 4p.70 42270
MP
M38 420.77
M11 * 421.63
WHS M14 418.08
BRP
PRC BRC BR13 PRS C30 C6
M57 418.48
M18 414.41
_ _ _ _ _ - ------ =======in== =========== =========== =========== =========== ==========-

WATERLMLS. m
Z e - M w a r l a 7 I I ~ 0 n . 8 7 25~en-87 MKet-87 15-Few 21-FeW 31774 31781 31788 31802 31818 318p 31828
LOCATION
418.88 418.81 418.54 418.25 418.14
421.23 421.21 420.88 420.78 420.78
418.m
420.71
413.94 413.82 4i3.n 413.M 41960 413.58

07-Dec-92 TABLE 3
418.83
420.88
418.51
M13 421.88 421.69 423.83 423.83 423.84 423.82 423,Y 423.42
MP
M38 418.74 419.08 421.47 421.38 421.23 421.01 420.88
WHS
BRP
PRC BRC BR13 PRS C30 C6
M57 421.50 421.83 421.W 421.35 421.17 421.37
M11 * 420.63 420.83 421.72 420.73 420.71 420.87 420.71
M14 417.71 417.78 417.71 417.74 417.74 417.74
M18 413.48 413.78 414.01 41453 414.63 414.48 41440

WATERLEVEIS, m
w u n a 7 l IJ""a7 2oJUma7 wun-37 O S J U I ~ ~ lW" la7 I E - A U ~ ~ ~ 25seF-w 31831 31838 31848 31858 31883 31978 32004 3a45
LOCATION
M i 3 423.87 423.58 423.44 423.08 a 8 3 423.08 422.88 422.40
MP M57 421.58 421.35 421.14 420.80 420.78 420.88 420.e-l 420.63
M11 * 420.75 420.78 420.72 420.88 420.85 420.81 420.51 420.21
WHS
BRP
PRC BRC BR13 PRS C30 C6
M38 420.88 420.88 420.83 420.83 420.50 420.32 418.83 419.27
M14 417.74 417.74 417.74 417.74 417.74 417.73 417.80 417.44
M18 41423 414.35 414.30 414.18 414.13 413.88 413.83 413.87
------ --------=== ___-_--- ====3====1= ----------- ----_______ ----------- _________-- =========== _ _ - _ _ _

oBocc87 12NOVa7 1 W 17Jana OSApraa 25-Apraa 1aJ""aa 23dugBB 32058 32o(a 32125 32158 32241 a88 32310 32378
LOCATION

WATERLEVELS. m
PJ"I88 2BA"QBB -pea 25SeF-m 0 7 0 6 8 8 15CGt.89 17.Nw88 32711 32148 32180 32774 32788 32788 32828
LOCATION
M13 423.32 423.24 423.88 423.62 425.43 423.28 a 8 8
MP M57 421.12 421.16 421.85 421.57 421.28 421.13 420.84
M38 421.01 420.81 421.13 421.12 420.91 420.80 420.55
M11* WHS M14 418.24 418.M 418.24 418.M 418.m 418.W 417.05
BRP
PRC BRC BR13 PRS C30 C6
-11
M18 415.74 414.88 415.32 wma 41475 41487 414.48
_ _ _ _ _ _ ------ =========== =========== =========== ===ip===_=D EPP==DPPPP= IIp_p_P__p_ _======s===

WATERLEMLS. m
WDeu88 27Mar-80 2 o A p r a l (aMayBo lBMay80 1&l"".80 141"lBo 1eAugBo 32848 32858 32883 gsga 33m5 33040 33xa 33104
LOCATION
M13 422.87 422.88 425.14 425.12 424.84 424.80
MP M57 420.81 420.83 420.81 420.83 421.81 421.78 421.88 420.88
M11 * WHS
BRP M18 414.45 414.43 415.48 415.41 415.40 415.38 415.07 414.88
PRC BRC BR13 PRS C30 C6
M38 420.54 420.13 42218 42214 42204 4p,m 421.30 420.70
M14 417.82 417.80 417.04 417.88 418.24 4ie.w 418.04 417.88
_----- =========== =========== ----------- =====I===== .-----====== ___-- ~ppppp-pDpD 3 3 p p p - ~ ~ p - = _-__-_


41438

12Julg2 13-Augg2 1502WZ 33787 33828 33883 '88'82 '88'82
LOCATION MIN MAX
M13 423.88
MP 421.82
425.5 421.88 425.14
421.82 421.82
M57 421.53 421.31 418.48 421.85
M38 421.35 421.10 421.13 417.53 42218
M11 * 421.0. 420.21 421.78
WHS 418.18 418.18 418.18
M14 4i8.m 418.88 418.24
BRP 415.88 415.88 415.88
MI8 415.14 415.11 415.14 41282 415.74
PRC 414.83 414.81 414.84 414.81 414.83
BRC 414.82 41483 414.07 414.82 414.83
BR13 413.54 413.54 41x54
PUS 413.04 413.04 413.04
C30 408.75 409.75 408.75 409.75
C6 408.85 408.05 m.e5 408.05 ------ ------ =P=P======= =~========= =====-===== ====IPPP===

07-Dec-92 TABLE 3
LOCATION SOURCE LOCATION SOURCE zn
M13 PIEMMETER M13 PIEMMETER 135% 13740
MP MILL FUND MP MIUWND 13180 1-
M57 P i m M m R M57 PIEMMETER 13430 1-
M38 PiEMMETER M38 PIEMMETER 13380 12860
WHS WH SEEP WHS WH SEEP 13700 1 2720
Mi4 PIEZOMETER M14 PIEMMETER 13140 13865
BRP EFRFUND BRP Bm FUND 13885 1 2-
PRC PRCAP PRC PR CAP 13660 1 2320
BRC BFRCAP BRC BFR CAP 13781 1%10
BR18 FUND BR18 FUND 13870 123U
BR13 FUND BR13 FUND 13785 12155
PRS NORTHSEEP PRS NORTH SEEP 13515 12118
C30 SEEP in LK C30 SEEP in LK 13738 1MM)
C6 SEEP in LK C6 SEEP in LK 13554 1-
MI1 ** PIEMMETER MI1 ** PIEMMETER 1 m 1 W 5
M18 PIEMMETER M18 PIEMMETER 138w 12315
_ _ _ _ _ _ ------ -----..--*== ___ -____ ------ pp=mp===p== ====-====== =========== =*=======Dm p=pp=I===p= ------

I I
P U
0 0
0 0
U
U
s s u

I I I I I I I I I I I I I I I I I I I
07-Dec-92 TABLE 4.
SOUTHBAY: DATA SOURCES for 1992 samples used in WATEQ4F and NETPATH
Alk. # T PH Eh (TIC)
JULY '92 SAMPLES WHS (1 6) BRC (1 5) MP F BR13 F C13-30 F PRS F PRC (1 6)
AUGUST '92 SAMPLES WHS L L L (2) BRC F F L (2) MP L L L (2) BR13 L L L (2) C13-30 F F L (2) PRS L L L (2) PRC L L L L

CHEMISTRY OF PRECIPITATION - EAR FALLS, ONT.
Monthly Ca Mg K Na Mn Ni Zn Fe YEAR YEAR Preclp. ma/mA2 ma/mA2 mglm"2 me/m"2 me/m"2 me/m"2 me/mA2 me/m"2
1981 1981 32.4 6.781 1.394 2.215 1.741 0.2859 0.0514 0.38 1.692 1982 1982 32.9 7.516 1.286 2.837 2.498 0.2192 0.0397 0.3 2.4247 1983 1983 32.7 4.487 1.342 1.65 1.402 0.0686 0.0232 0.16 2.2038
-- -.-.--.I - -___ -
-I_--- ~ -.I_-- ------I_- _- 32.7 6.262 1.341 2.234 1.880 0.198 0.038 0.280 2.107
m A3/m "2 mg/L m e n me/L me/L maR me/L me/L me/L 0.03266667 0.19169388 0.04104082 0.06838776 0,05756122 O.Oo606M 0.00116633 0.03657143 0.0644949
40.08 24.305 39.098 22.98977 55 56.71 65.38 55.647
Ca Mg K Na Mn NI Zn Fe mmole/L mmole/L mmoleIL mmolelL mmole/L mmoleIL mmoleIL mmoleR
4.78E-03 1.69E-03 1.75E-03 2.50E-03 1.1OE-04 1.99E-05 1.31E-04 1.15E-03 --_-.--I

CHEMISTRY OF PRECIPITATION - EAR FALLS, ONT.
Monthly Pb V Al cu cd YEAR Preclp. mg/mA2 mglm^2 mg/mA2 mg/rnA2 mg/m-2
1981 32.4 0.2828 0.062 1,221 0.2405 0.00537 1982 32.9 0.111 0.056 1.944 0.1308 0.00424 1983 32.7 0.0838 0.034 2.143 0.0679 0.00365
32.7 0.159 0.051 1.769 0.146 0.004
m ̂ 3lm -2 mg/L me/L mg/L m a me/L 0.03266667 0.00487347 0.00155102 0.05416327 0.00448163 O.wO13531
207.2 51 27 63.546 112.4
Pb V Al cu cd mmolell mmolell mmolell mmolell mmolelL
2.35E-05 3.04E.05 2.01E-03 7.05E-05 1.20E.06 I- .----I.--- I.-.I_


APPENDIX A
ANALYSES used in WATEQ4F and NETPATH modelling

ANALYSES used in WATEQ4F and NETPATH modelling 1
Source : WH-SEEP - 92/07/14 Type : SEEP WATER
Dateltime sampled : 92/07/14
Temperature 16. degrees C Copper Sp. Cond. 2650. Nickel PH 3.24 Nitrite-Nitrate Eh ,536 volts NH4 (Kjd) Density N.D. glcm3 Phosphate Dissolved Oxygen N.D. mgll Boron Total carbon # 2. mgll Aluminum Calcium 513. mgll Silica Magnesium 153. mgll DOC Sodium 10.6 mgll RS of DOC Potassium 11.3 mgll CH4 (as) Barium N.D. mg/l Delta C-13 TDlC Strontium 1.05 mg/l Carbon 14 TDlC Iron 38.5 mg/l Delta S-34 (S04) Manganese 54.9 mg/l Delta S-34 (H2S) Zinc 919. mgll Sr 87/86 Chloride N.D. mgll Delta Deuterium Sulfate 3206. mgll Delta 0-18 Hydrogen Sulfide N.D. mgll Tritium
EPMCAT 72.75 EPMAN 66.82 ERROR 4.24% ......................................... N.D. = not determined or not detected TDlC = Total Dissolved Inorganic Carbon DOC = Dissolved Organic Carbon Sp. Cond. = Specific Conductivity (uslcm) RS = Redox State # = total carbon, reported as HC03-
8.29 mgll N.D. mgll N.D. mgll as N N.D. mgll as N N.D. mgll as P N.D. mgll 14.3 mgll 50.5 mgll as Si02 N.D. mgll N.D. N.D. mgll N.D. oloo N.D. % modern N.D. oloo N.D. oloo N.D. N.D. oloo N.D. oloo N.D. TU

ANALYSES used in WATEQ4F and NETPATH modelling 2
Source : WH-SEEP - 92/08/14 Type : SEEP WATER
Dateltime sampled : 92/08/14
Temperature 16. degrees C Sp. Cond. 3460. PH 3.55 Eh ,349 volts Density N.D. glcm3 Dissolved Oxygen N.D. mgll Total carbon # 2. mgll Calcium 483. mgll Magnesium 132. mgll Sodium 9.14 mgll Potassium 11.5 mgll Barium ,021 mgll Strontium ,956 mgll Iron 74.2 mgll Manganese 42. mgll Zinc 492. mgll Chloride N.D. mgll Sulfate 2924. mgll Hydrogen Sulfide N.D. mgll
Copper Nickel Nitrite-Nitrate NH4 (Kjd) Phosphate Boron Aluminum Silica DOC RS of DOC
Delta C-13 TDlC Carbon 14 TDlC Delta S-34 (S04) Delta S-34 (H2S) Sr 87/86 Delta Deuterium Delta 0-18 Tritium
CH4 (aq)
EPMCAT 56.92 EPMAN 60.95 ERROR -3.41% ......................................... N.D. = not determined or not detected TDlC = Total Dissolved Inorganic Carbon DOC = Dissolved Organic Carbon Sp. Cond. = Specific Conductivity (uSlcm) RS = Redox State # = total carbon, reported as HC03-
7.46 mgll .28 mgll N.D. mgll as N N.D. mgll as N N.D. mgll as P 1.57 mgll 14.4 mgll 52.2 mgll as Si02 N.D. mgll N.D. N.D. mgll N.D. oloo N.D. % modern N.D. oloo N.D. oloo N.D. N.D. oloo N.D. oloo N.D. TU

ANALYSES used in WATEQ4F and NETPATH modelling 3
Source : BR-CAP - 92/07/14 Type : SHAFT WATER
Dateltime sampled : 92/07/14
Temperature 15. degrees C Sp. Cond. 1850. PH 5.61 Eh ,320 volts Density N.D. glcm3 Dissolved Oxygen N.D. mgll Alkalinity # 11. mgll Calcium 476. mgll Magnesium 129. mgll Sodium 9.97 mgll Potassium 8.2 mgll Barium N.D. mgll Strontium N.D. mgll Iron 19.5 mgll Manganese 55.3 mgll Zinc 642. mgll Chloride N.D. mgll Sulfate 2490. mgll Hydrogen Sulfide N.D. mgll
EPMCAT 57.78 EPMAN 52.06 ERROR
Copper Nickel Nitrite-Nitrate NH4 (Kjd) Phosphate Boron Aluminum Silica DOC RS of DOC CH4 (a@ Delta C-13 TDlC Carbon 14 TDlC Delta S-34 (S04) Delta S-34 (H2S) Sr 87/86 Delta Deuterium Delta 0-18 Tritium
5.21 %
1.85 mgll N.D. mgll N.D. mgll as N N.D. mgll as N N.D. mgll as P N.D. mgll 3.46 mgll 34.2 mgll as Si02 N.D. mgll N.D. N.D. mgll N.D. o/oo N.D. % modern N.D. oloo N.D. oloo N.D. N.D. oloo N.D. oloo N.D. TU
N.D. = not determined or not detected TDlC = Total Dissolved Inorganic Carbon DOC = Dissolved Organic Carbon Sp. Cond. = Specific Conductivity (uslcm) RS = Redox State # = uncorrected, reported as HC03-

ANALYSES used in WATEQ4F and NETPATH modelling 4
Source : BR-CAP - 92/08/13 Type : SHAFT WATER
Dateltime sampled : 92/08/13
Temperature 16.9 degrees C Sp. Cond. 2680. PH 4.8 Eh ,178 volts Density N.D. glcm3 Dissolved Oxygen N.D. mgll Alkalinity # 10. mgll Calcium 474. mgll Magnesium 111. mgll Sodium 9.84 mgll Potassium 13.2 mgll Barium ,019 mgll Strontium ,898 mgll Iron 14.2 mgll Manganese 43.5 mgll Zinc 400. mgll Chloride N.D. mgll Sulfate 2427. mgll Hydrogen Sulfide N.D. mgll
Copper Nickel Nitrite-Nitrate NH4 (Kjd) Phosphate Boron Aluminum Silica DOC RS of DOC CH4 (a@ Delta C-13 TDlC Carbon 14 TDlC Delta S-34 (S04) Delta S-34 (H2S) Sr 87/86 Delta Deuterium Delta 0-18 Tritium
EPMCAT 48.26 EPMAN 50.73 ERROR -2.49% ......................................... N.D. = not determined or not detected TDlC = Total Dissolved Inorganic Carbon DOC = Dissolved Organic Carbon Sp. Cond. = Specific Conductivity (uSlcm) RS = Redox State # = uncorrected, reported as HC03-
1.29 mgll .24 mgll N.D. mgll as N N.D. mgll as N N.D. mgll as P N.D. mgll 2.83 mg/l 36.15 mgll as Si02 N.D. mgll N.D. N.D. mgll N.D. oloo N.D. % modern N.D. oloo N.D. oloo N.D. N.D. oloo N.D. oloo N.D. TU
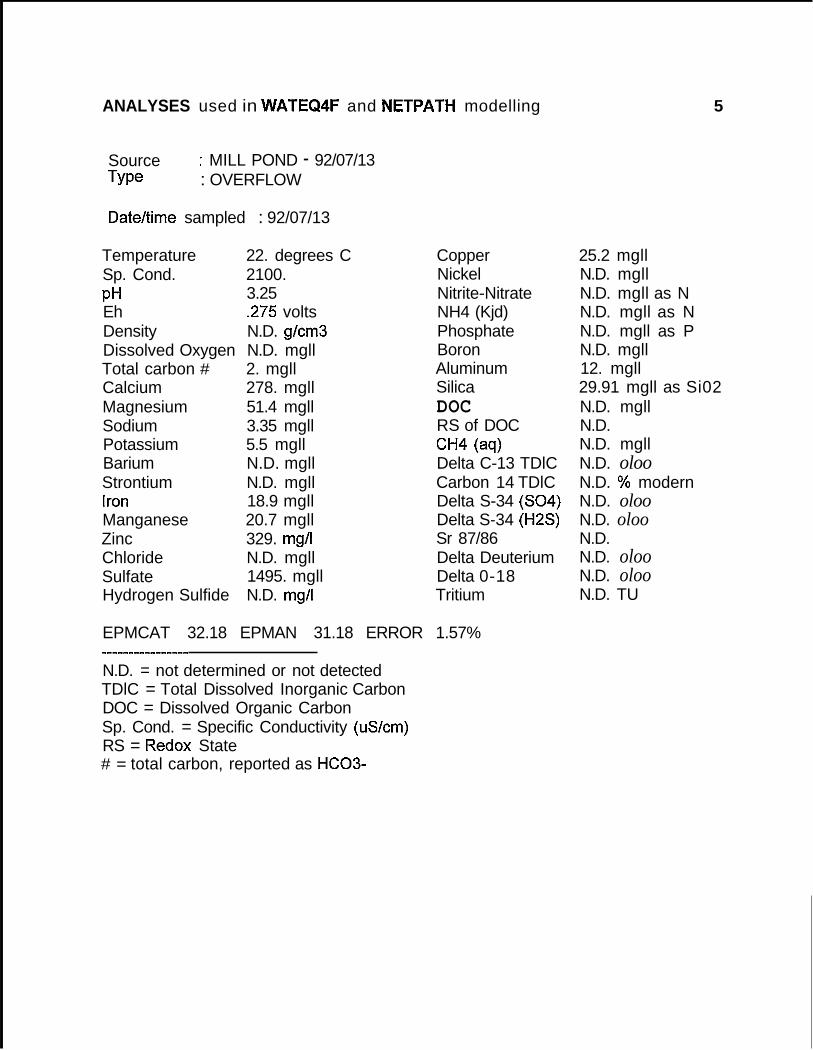
ANALYSES used in WATEQ4F and NETPATH modelling 5
Source : MILL POND - 92/07/13 Type : OVERFLOW
Dateltime sampled : 92/07/13
Temperature 22. degrees C
PH 3.25 Eh ,275 volts Density N.D. glcm3 Dissolved Oxygen N.D. mgll Total carbon # 2. mgll Calcium 278. mgll Magnesium 51.4 mgll Sodium 3.35 mgll Potassium 5.5 mgll Barium N.D. mgll Strontium N.D. mgll Iron 18.9 mgll Manganese 20.7 mgll Zinc 329. mgll Chloride N.D. mgll Sulfate 1495. mgll Hydrogen Sulfide N.D. mg/l
Sp. Cond. 2100. Copper Nickel Nitrite-Nitrate NH4 (Kjd) Phosphate Boron Aluminum Silica DOC RS of DOC CH4 (as) Delta C-13 TDlC Carbon 14 TDlC Delta S-34 (S04) Delta S-34 (H2S) Sr 87/86 Delta Deuterium Delta 0-18 Tritium
EPMCAT 32.18 EPMAN 31.18 ERROR 1.57%
N.D. = not determined or not detected TDlC = Total Dissolved Inorganic Carbon DOC = Dissolved Organic Carbon Sp. Cond. = Specific Conductivity (uslcm) RS = Redox State # = total carbon, reported as HC03-
25.2 mgll N.D. mgll N.D. mgll as N N.D. mgll as N N.D. mgll as P N.D. mgll 12. mgll 29.91 mgll as Si02 N.D. mgll N.D. N.D. mgll N.D. oloo N.D. % modern N.D. oloo N.D. oloo N.D. N.D. oloo N.D. oloo N.D. TU

ANALYSES used in WATEQ4F and NETPATH modelling 6
Source : MILL POND - 92-07-18 Type : OVERFLOW
Dateltime sampled : 92/07/18
Temperature 22. degrees C Sp. Cond. 1650. PH 3.65 Eh .257 volts Density N.D. gkm3 Dissolved Oxygen N.D. mgll Total carbon # 2. mgll Calcium 236. mgll Magnesium 42. mgll Sodium 3. mgll Potassium 5.6 mgll Barium N.D. mgll Strontium N.D. mgll Iron 18.6 mgll Manganese 15.3 mgll Zinc 233. mgll Chloride N.D. mgll Sulfate 1168.9 mgll Hydrogen Sulfide N.D. mgll
Copper Nickel Nitrite-Nitrate NH4 (Kjd) Phosphate Boron Aluminum Silica DOC RS of DOC CH4 ( a d Delta C-13 TDlC Carbon 14 TDlC Delta S-34 (S04) Delta S-34 (H2S) Sr 87/86 Delta Deuterium Delta 0-18 Tritium
EPMCAT 25.04 EPMAN 24.38 ERROR 1.32%
N.D. = not determined or not detected TDlC = Total Dissolved Inorganic Carbon DOC = Dissolved Organic Carbon Sp. Cond. = Specific Conductivity (uSlcm) RS = Redox State # = total carbon, reported as HC03-
14. mgll N.D. mgll N.D. mgll as N N.D. mgll as N N.D. mgll as P N.D. mgll 6.61 mgll 22. mgll as Si02 N.D. mgll N.D. N.D. mgll N.D. oloo N.D. % modern N.D. oloo N.D. oloo N.D. N.D. oloo N.D. oloo N.D. TU

ANALYSES used in WATEQ4F and NETPATH modelling 7
Source : MILL POND - 92/08/14 Type : OVERFLOW
Dateltime sampled : 92/08/14
Temperature 17. degrees C Sp. Cond. 1800. PH 3.69 Eh ,310 volts Density N.D. glcm3 Dissolved Oxygen N.D. mgll Total carbon # 2. mgll Calcium 304. mgll Magnesium 49.7 mgll Sodium 3.02 mgll Potassium 6. mgll Barium ,028 mgll Strontium ,386 mg/l Iron 36.8 mgll Manganese 14.4 mgll Zinc 191. mgll Chloride N.D. mgll Sulfate 1339. mgll Hydrogen Sulfide N.D. mgll
Copper Nickel Nitrite-Nitrate NH4 (Kjd) Phosphate Boron Aluminum Silica DOC RS of DOC CH4 (aq) Delta C-13 TDlC Carbon 14 TDlC Delta S-34 (S04) Delta S-34 (H2S) Sr 87/86 Delta Deuterium Delta 0-18 Tritium
EPMCAT 28.38 EPMAN 27.93 ERROR .81%
N.D. = not determined or not detected TDlC = Total Dissolved Inorganic Carbon DOC = Dissolved Organic Carbon Sp. Cond. = Specific Conductivity (uSlcm) RS = Redox State # = total carbon, reported as HC03-
.........................................
14.3 mgll .08 mgll N.D. mgll as N N.D. mgll as N N.D. mgll as P N.D. mgll 6.41 mgll 27.6 mgll as Si02 N.D. mgll N.D. N.D. mgll N.D. oloo N.D. % modern N.D. oloo N.D. o/oo N.D. N.D. o/oo N.D. oloo N.D. TU

ANALYSES used in WATEQ4F and NETPATH modelling 8
Source : BR13-SEEP - 92/07/13 Type : SEEP WATER
Dateltime sampled : 92/07/13
Temperature 22. degrees C Sp. Cond. 1600. PH 3.63 Eh ,248 volts Density N.D. glcm3 Dissolved Oxygen N.D. mgll Total carbon # 3.5 mgll Calcium 221. mgll Magnesium 47.7 mgll Sodium 4.55 mgll Potassium 6.4 mgll Barium N.D. mgll Strontium N.D. mgll Iron 13.7 mgll Manganese 18.6 mgll Zinc 173. mgll Chloride N.D. mgll Sulfate 1091. mgll Hydrogen Sulfide N.D. mgll
Copper Nickel Nitrite-Nitrate NH4 (Kjd) Phosphate Boron Aluminum Silica DOC RS of DOC CH4 (as) Delta C-13 TDlC Carbon 14 TDlC Delta S-34 (S04) Delta S-34 (H2S) Sr 87/86 Delta Deuterium Delta 0-18 Tritium
EPMCAT 23.30 EPMAN 22.79 ERROR 1.11%
N.D. = not determined or not detected TDlC = Total Dissolved Inorganic Carbon DOC = Dissolved Organic Carbon Sp. Cond. = Specific Conductivity (uSlcm) RS = Redox State # = total carbon, reported as HC03-
.........................................
N.D. mgll N.D. mgll N.D. mgll as N N.D. mgll as N N.D. mgll as P N.D. mgll 11.6 mgll 21.8 mgll as Si02 N.D. mgll N.D. N.D. mgll N.D. oloo N.D. % modern N.D. oloo N.D. oloo N.D. N.D. oloo N.D. oloo N.D. TU

ANALYSES used in WATEQ4F and NETPATH modelling 9
Source : BRl3-SEEP - 92-07-16 Type : SEEP WATER
Datehime sampled : 92/07/16
Temperature 19. degrees C Sp. Cond. 800.
Eh .I46 volts Density N.D. glcm3 Dissolved Oxygen N.D. mgll Alkalinity # 10. mgll Calcium 118. mgll Magnesium 26.7 mgll Sodium 3. mgll Potassium 5. mg/l Barium N.D. mgll Strontium N.D. mgll Iron 4.31 mgll Manganese 9.04 mgll Zinc 84.2 mgll Chloride N.D. mgll Sulfate 506.4 mgll Hydrogen Sulfide N.D. mgll
PH 5.54
Copper Nickel Nitrite-Nitrate NH4 (Kjd) Phosphate Boron Aluminum Silica DOC RS of DOC CH4 (as) Delta C-13 TDlC Carbon 14 TDlC Delta S-34 (S04) Delta S-34 (H2S) Sr 87/86 Delta Deuterium Delta 0-18 Tritium
EPMCAT 11.57 EPMAN 10.71 ERROR 3.84% ......................................... N.D. = not determined or not detected TDlC = Total Dissolved Inorganic Carbon DOC = Dissolved Organic Carbon Sp. Cond. = Specific Conductivity (uSlcm) RS = Redox State # = uncorrected, reported as HC03-
N.D. mgll N.D. mgll N.D. mg/l as N N.D. mgll as N N.D. mgll as P N.D. mgll 1.48 mgll 24. mgll as Si02 N.D. mg/l N.D. N.D. mgll N.D. o/oo N.D. % modern N.D. o/oo N.D. oloo N.D. N.D. oloo N.D. oloo N.D. TU

ANALYSES used in WATEQ4F and NETPATH modelling 10
Source : BRl3-SEEP - 92/08/14 Type : SEEP WATER
Dateltime sampled : 92/08/14
Temperature 16. degrees C Sp. Cond. 1600. PH 3.61 Eh .384 volts Density N.D. glcm3 Dissolved Oxygen N.D. mgll Total carbon # 2. mgll Calcium 240. mgll Magnesium 53.5 mgll Sodium 4.9 mg/l Potassium 7.4 mgll Barium ,024 mgll Strontium ,455 mgll Iron 20.6 mgll Manganese 17.9 mgll Zinc 163. mg/l Chloride N.D. mgll Sulfate 1187. mgll Hydrogen Sulfide N.D. mgll
Copper Nickel Nitrite-Nitrate NH4 (Kjd) Phosphate Boron Aluminum Silica DOC RS of DOC CH4 (as) Delta C-13 TDlC Carbon 14 TDlC Delta S-34 (S04) Delta S-34 (H2S) Sr 87/86 Delta Deuterium Delta 0-18 Tritium
EPMCAT 24.83 EPMAN 24.76 ERROR .14%
N.D. = not determined or not detected TDlC = Total Dissolved Inorganic Carbon DOC = Dissolved Organic Carbon Sp. Cond. = Specific Conductivity (uS/cm) RS = Redox State # = total carbon, reported as HC03-
.........................................
1.02 mgll . I2 mgll N.D. mgll as N N.D. mgll as N N.D. mgll as P N.D. mgll 12.6 mgll 45.78 mgll as Si02 N.D. mgll N.D. N.D. mg/l N.D. o/oo N.D. % modern N.D. oloo N.D. oloo N.D. N.D. oloo N.D. oloo N.D. TU

ANALYSES used in WATEQ4F and NETPATH modelling 11
Source : C13-Stn30 - 92/07/15 Type : BOTTOM WATER
Datehime sampled : 92/07/15
Temperature 12. degrees C Sp. Cond. 850. PH 5.78 Eh ,115 volts Density N.D. glcm3 Dissolved Oxygen N.D. mgll Alkalinity # 10. mgll Calcium 129. mgll Magnesium 23.8 mgll Sodium 5.62 mgll Potassium 6.1 mgll Barium N.D. mgll Strontium N.D. mgll Iron 2.88 mgll Manganese 10.6 mgll Zinc 71.3 mgll Chloride N.D. mg/l Sulfate 527. mgll Hydrogen Sulfide N.D. mg/l
Copper Nickel Nitrite-Nitrate NH4 (Kjd) Phosphate Boron Aluminum Silica DOC RS of DOC CH4 ( 4 ) Delta C-13 TDlC Carbon 14 TDlC Delta S-34 (S04) Delta S-34 (H2S) Sr 87/86 Delta Deuterium Delta 0-18 Tritium
EPMCAT 11.47 EPMAN 11.14 ERROR 1.44%
N.D. = not determined or not detected TDlC = Total Dissolved Inorganic Carbon DOC = Dissolved Organic Carbon Sp. Cond. = Specific Conductivity (uslcm) RS = Redox State # = uncorrected, reported as HC03-
.........................................
N.D. mgll N.D. mgll N.D. mgll as N N.D. mgll as N N.D. mgll as P N.D. mgll N.D. mgll 8.6 mgll as 3 0 2 N.D. mgll N.D. N.D. mgll N.D. oloo N.D. % modern N.D. oloo N.D. oloo N.D. N.D. oloo N.D. oloo N.D. TU
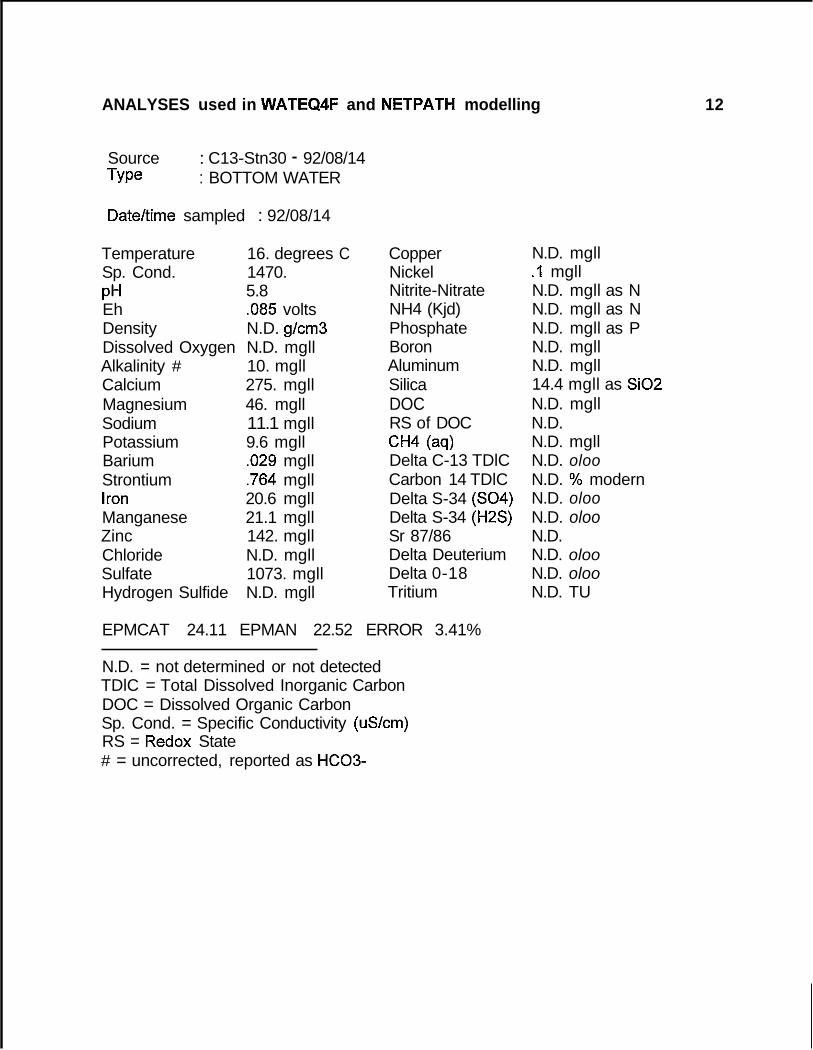
ANALYSES used in WATEQ4F and NETPATH modelling 12
Source : C13-Stn30 - 92/08/14 Type : BOTTOM WATER
Dateltime sampled : 92/08/14
Temperature 16. degrees C Sp. Cond. 1470. PH 5.8 Eh ,085 volts Density N.D. glcm3 Dissolved Oxygen N.D. mgll Alkalinity # 10. mgll Calcium 275. mgll Magnesium 46. mgll Sodium 11.1 mgll Potassium 9.6 mgll Barium ,029 mgll Strontium ,764 mgll Iron 20.6 mgll Manganese 21.1 mgll Zinc 142. mgll Chloride N.D. mgll Sulfate 1073. mgll Hydrogen Sulfide N.D. mgll
Copper Nickel Nitrite-Nitrate NH4 (Kjd) Phosphate Boron Aluminum Silica DOC RS of DOC CH4 (as) Delta C-13 TDlC Carbon 14 TDlC Delta S-34 (S04) Delta S-34 (H2S) Sr 87/86 Delta Deuterium Delta 0-18 Tritium
EPMCAT 24.11 EPMAN 22.52 ERROR 3.41%
N.D. = not determined or not detected TDlC = Total Dissolved Inorganic Carbon DOC = Dissolved Organic Carbon Sp. Cond. = Specific Conductivity (uslcm) RS = Redox State # = uncorrected, reported as HC03-
N.D. mgll .I mgll N.D. mgll as N N.D. mgll as N N.D. mgll as P N.D. mgll N.D. mgll 14.4 mgll as 3 0 2 N.D. mgll N.D. N.D. mgll N.D. oloo N.D. % modern N.D. oloo N.D. oloo N.D. N.D. oloo N.D. oloo N.D. TU

ANALYSES used in WATEQ4F and NETPATH modelling 13
Source : PR-SEEP - 92/07/13 Type : SEEP WATER
Dateltime sampled : 92/07/13
Temperature 22. degrees C Sp. Cond. 800. PH 5.62 Eh ,162 volts Density N.D. g/cm3 Dissolved Oxygen N.D. mgll Alkalinity # 15. mg/l Calcium 126. mgll Magnesium 20.9 mgll Sodium 3.3 mgll Potassium 4.1 mgll Barium N.D. mgll Strontium N.D. mgll Iron N.D. mgll Manganese 6.36 mg/l Zinc 46.2 mgll Chloride N.D. mgll Sulfate 458. mgll Hydrogen Sulfide N.D. mgll
Copper Nickel Nitrite-Nitrate NH4 (Kjd) Phosphate Boron Aluminum Silica DOC RS of DOC CH4 (a4 Delta C-13 TDlC Carbon 14 TDlC Delta S-34 (S04) Delta S-34 (H2S) Sr 87/86 Delta Deuterium Delta 0-18 Tritium
EPMCAT 9.93 EPMAN 9.79 ERROR .70%
N.D. = not determined or not detected TDlC = Total Dissolved Inorganic Carbon DOC = Dissolved Organic Carbon Sp. Cond. = Specific Conductivity (uslcm) RS = Redox State # = uncorrected, reported as HC03-
________________________________________-
.5 mgll N.D. mgll N.D. mgll as N N.D. mgll as N N.D. mgll as P N.D. mgll N.D. mgll 14.8 mgll as Si02 N.D. mgll N.D. N.D. mgll N.D. oloo N.D. YO modern N.D. oloo N.D. oloo N.D. N.D. o/oo N.D. o/oo N.D. TU

ANALYSES used in WATEQ4F and NETPATH modelling 14
Source : PR-SEEP - 92/08/14 Type : SEEP WATER
Datehime sampled : 92/08/14
Temperature 15. degrees C Sp. Cond. 470. PH 5.64 Eh ,248 volts Density N.D. glcm3 Dissolved Oxygen N.D. mg/l Alkalinity # 10. mgll Calcium 90.7 mgll Magnesium 14.6 mgll Sodium 2.76 mgll Potassium 3.6 mgll Barium ,036 mgll Strontium ,243 mgll Iron ,201 mgll Manganese 3.85 mg/l Zinc 22.2 mgll Chloride N.D. mgll Sulfate 298.7 mgll Hydrogen Sulfide N.D. mgll
Copper Nickel Nitrite-Nitrate NH4 (Kjd) Phosphate Boron Aluminum Silica DOC RS of DOC
Delta C-13 TDlC Carbon 14 TDlC Delta S-34 (S04) Delta S-34 (H2S) Sr 87/86 Delta Deuterium Delta 0-18 Tritium
CH4 ( 4
EPMCAT 6.79 EPMAN 6.39 ERROR 3.05%
N.D. = not determined or not detected TDlC = Total Dissolved Inorganic Carbon DOC = Dissolved Organic Carbon Sp. Cond. = Specific Conductivity (uslcm) RS = Redox State # = uncorrected, reported as HC03-
________________________________________-
,578 mgll N.D. mgll N.D. mgll as N N.D. mgll as N N.D. mgll as P N.D. mgll ,046 mgll 18.4 mgll as SiO2 N.D. mgll N.D. N.D. mgll N.D. oloo N.D. % modern N.D. oloo N.D. oloo N.D. N.D. o/oo N.D. o/oo N.D. TU

ANALYSES used in WATEQ4F and NETPATH modelling 15
Source : PR-CAP - 92/07/14 Type : SHAFT WATER
Dateltime sampled : 92/07/14
Temperature 16. degrees C Sp. Cond. 300. PH 7.81 Eh ,320 volts Density N.D. glcm3 Dissolved Oxygen N.D. mgll Alkalinity # 130.5 mgll Calcium 62.7 mgll Magnesium 5.63 mgll Sodium 8.63 mgll Potassium 14.6 mgll Barium N.D. mgll Strontium N.D. mgll Iron N.D. mgll Manganese N.D. mgll Zinc 1.24 mgll Chloride N.D. mgll Sulfate 73.7 mgll Hydrogen Sulfide N.D. mgll
Copper Nickel Nitrite-Nitrate NH4 (Kjd) Phosphate Boron Aluminum Silica DOC RS of DOC CH4 ( 4 Delta C-13 TDlC Carbon 14 TDlC Delta S-34 (S04) Delta S-34 (H2S) Sr 87/86 Delta Deuterium Delta 0-18 Tritium
EPMCAT 4.38 EPMAN 3.67 ERROR 8.75%
N.D. = not determined or not detected TDlC = Total Dissolved Inorganic Carbon DOC = Dissolved Organic Carbon Sp. Cond. = Specific Conductivity (uSlcm) RS = Redox State # = uncorrected, reported as HC03-
-_--_--_----_----_--____________________-
N.D. mgll N.D. mgll N.D. mgll as N N.D. mg/l as N N.D. mgll as P N.D. mgll N.D. mgll 8.99 mgll as Si02 N.D. mgll N.D. N.D. mgll N.D. oloo N.D. % modern N.D. oloo N.D. oloo N.D. N.D. oloo N.D. oloo N.D. TU

ANALYSES used in WATEQ4F and NETPATH modelling 16
Source : PR-CAP - 92/08/14 Type : SHAFT WATER
Dateltime sampled : 92/08/14
Temperature 17. degrees C Sp. Cond. 440. PH 6.28 Eh ,110 volts Density N.D. glcm3 Dissolved Oxygen N.D. mgll Alkalinity # 125. mgll Calcium 86. mgll Magnesium 9.72 mgll Sodium 4.92 mgll Potassium 9.5 mgll Barium ,041 mgll Strontium .21 mg/l Iron ,245 mgll Manganese . I2 mgll Zinc 2.95 mgll Chloride N.D. mgll Sulfate 124. mgll Hydrogen Sulfide N.D. mgll
Copper Nickel Nitrite-Nitrate NH4 (Kjd) Phosphate Boron Aluminum Silica DOC RS of DOC CH4 (aq) Delta C-13 TDlC Carbon 14 TDlC Delta S-34 (S04) Delta S-34 (H2S) Sr 87/86 Delta Deuterium Delta 0-18 Tritium
EPMCAT 5.66 EPMAN 4.63 ERROR 9.97%
N.D. = not determined or not detected TDlC = Total Dissolved Inorganic Carbon DOC = Dissolved Organic Carbon Sp. Cond. = Specific Conductivity (uSlcm) RS = Redox State # = uncorrected, reported as HC03-
,038 mgll N.D. mgll N.D. mgll as N N.D. mgll as N N.D. mgll as P N.D. mgll N.D. mgll 9.52 mgll as Si02 N.D. mgll N.D. N.D. mgll N.D. o/oo N.D. YO modern N.D. oloo N.D. o/oo N.D. N.D. oloo N.D. oloo N.D. TU

ANALYSES used in WATEQ4F and NETPATH modelling 17
Source : DISTILLED WATER Type : DISTILLED WATER
Dateltime sampled : 92/11/23
Temperature 15. degrees C Sp. Cond. N.D. PH 7. Eh ,320 volts Density N.D. glcm3 Dissolved Oxygen N.D. mgll Alkalinity # ,0061 mgll Calcium N.D. mgll Magnesium N.D. mgll Sodium N.D. mgll Potassium N.D. mgll Barium N.D. mgll Strontium N.D. mgll Iron N.D. mgll Manganese N.D. mgll Zinc N.D. mgll Chloride N.D. mgll Sulfate N.D. mgll Hydrogen Sulfide N.D. mgll
Copper Nickel Nitrite-Nitrate NH4 (Kjd) Phosphate Boron Aluminum Silica DOC RS of DOC CH4 (as) Delta C-13 TDlC Carbon 14 TDlC Delta S-34 (S04) Delta S-34 (H2S) Sr 87/86 Delta Deuterium Delta 0-18 Tritium
EPMCAT .OO EPMAN .OO ERROR .01%
N.D. = not determined TDlC = Total Dissolved Inorganic Carbon DOC = Dissolved Organic Carbon Sp. Cond. = Specific Conductivity (uSlcm) RS = Redox State # = uncorrected, reported as HC03-
N.D. mgll N.D. mgll N.D. mgll as N N.D. mgll as N N.D. mgll as P N.D. mgll N.D. mgll N.D. mgll as Si02 N.D. mgll N.D. N.D. mgll N.D. oloo N.D. % modern N.D. oloo N.D. oloo N.D. N.D. oloo N.D. oloo N.D. TU

ANALYSES used in WATEQ4F and NETPATH modelling 18
Source : PRECIPITATION Type : WATER
Dateltime sampled : 92/11/23
Temperature 15. degrees C Sp. Cond. N.D. PH 4.96 Eh ,320 volts Density N.D. glcm3 Dissolved Oxygen N.D. mgll Total carbon # 1. mgll Calcium ,191694 mgll Magnesium ,041041 mgll Sodium .057561 mgll Potassium ,068388 mgll Barium N.D. mgll Strontium N.D. mgll Iron ,064495 mgll Manganese ,00606 mgll Zinc ,008571 mgll Chloride ,09699 mgll Sulfate 1.415612 mgll Hydrogen Sulfide N.D. mgll
Copper Nickel Nitrite-Nitrate NH4 (Kjd) Phosphate Boron Aluminum Silica DOC RS of DOC CH4 (a4 Delta C-13 TDlC Carbon 14 TDlC Delta S-34 (S04) Delta S-34 (H2S) Sr 87/86 Delta Deuterium Delta 0-18 Tritium
EPMCAT .08 EPMAN .07 ERROR 9.32%
N.D. = not determined or not detected TDlC = Total Dissolved Inorganic Carbon DOC = Dissolved Organic Carbon Sp. Cond. = Specific Conductivity (uSlcm) RS = Redox State # = total carbon, reported as HC03-
.........................................
,004482 mgll .001166 mgll ,272469 mgll as N ,812 mgll as N ,028953 mgll as P N.D. mgll ,054163 mgll N.D. mgll as Si02 N.D. mgll N.D. N.D. mgll N.D. oloo N.D. % modern N.D. oloo N.D. oloo N.D. N.D. oloo N.D. oloo N.D. TU

ANALYSES used in WATEQ4F and NETPATH modelling 19
Source : GRAVEL PIT - 92/08/13 Type : POND WATER
Dateltime sampled : 92/08/13
Temperature 20. degrees C Sp. Cond. 75. PH 7.5 Eh .320 volts Density N.D. glcm3 Dissolved Oxygen N.D. mgll Alkalinity # 41.5 mgll Calcium 13.9 mgll Magnesium 1.91 mg/l Sodium 1.38 mgll Potassium 3.6 mgll Barium ,021 mgll Strontium .04 mgll Iron ,071 mgll Manganese ,022 mgll Zinc ,054 mgll Chloride N.D. mgll Sulfate 7.94 mgll Hydrogen Sulfide N.D. mgll
Copper Nickel Nitrite-Nitrate NH4 (Kjd) Phosphate Boron Aluminum Silica DOC RS of DOC
Delta C-13 TDlC Carbon 14 TDlC Delta S-34 (S04) Delta S-34 (HZS) Sr 87/86 Delta Deuterium Delta 0-18 Tritium
CH4 (4
EPMCAT 1.01 EPMAN .85 ERROR 9.03%
N.D. = not determined or not detected TDlC = Total Dissolved Inorganic Carbon DOC = Dissolved Organic Carbon Sp. Cond. = Specific Conductivity (uSlcm) RS = Redox State # = uncorrected, reported as HC03-
,005 mgll N.D. mgll N.D. mgll as N N.D. mgll as N N.D. mgll as P N.D. mgll ,038 mgll ,727 mgll as 3 0 2 N.D. mgll N.D. N.D. mgll N.D. oloo N.D. % modern N.D. oloo N.D. oloo N.D. N.D. oloo N.D. oloo N.D. TU

27-Apr-93
SATURATION INDICES (Sl) from WATEQ4F
MINERAL
ADULARIA ALLOPHANE ALUNITE ANNITE BARITE BASALUMINITE BEIDELLITE BOEHMITE CHALCEDONY CRISTOBALITE CU-METAL CUPROUS FERRITE DIASPORE GlBBSlTE GOETHITE GYPSUM HEMATITE MAGNETITE PYROPHILLITE QUARTZ ZN-SILICATE
HALLOYSITE ILLITE JURBANITE KAOLlNlTE K-MICA LAUMONTITE LEONARDmE MAGHEMKE CA-MONTMORILLONI
WHS
14/07 14/00
17.521 49.674 0.406
0.595 0.608
0.648 0.661
3.045 4.532
3.103 1.065 -0.013 -0.013
7.511 3.435 2.081 -1.084
-1.511 0.381
1,053 1.066 -2.419 -2.059
BRC
14/07 13/08
1.04
1.166
9.074
54.986
9.157
7.368
2.015 0.436
0.491 9.622
1 1.598 3.809
2.626
6.182 -0.062 13.588 12.587
10.517
0.897 1.985
2.648
4.945 1.14
7.828
11.846
2.93
13.972
3.979
51.465
0.334 0.953
1.627
-0.308 0.436
0.487 0.305
8.084
1.469 0.276
1.154 -0.043
3.686
6.106 0.891 0.266
0.326
3.123
7.122 1.401
MP
13/07 14/08
5.458
0.289 0.331
3.697
1.574 0.366
1.371
0.838
0.727
2.672
48.41
0.448
0.314 0.365
5.346
0.622 ,0317 2.629
0.111 0.768
-2.28
APPENDIX B
BR13
13/07 14/08
0.102
16.723 48.537 0.391
0.15 0.545 0.192 0.599
3.629
-0.992 1.434 -0.498 -0.431 .0.205 4.172
1.034 0.957 0.589 1,003 -2.28 -2.315
C13-30
15/07 14/08
0.461
-0.133 0.043
-0.071 0.096
2.432 2.801 -0.612 -0.389
5.841 6.907 4.404 6.475
0.338 0.501 0.863 1.514
PRS
13/07 14/08
0.02 0.021
0.929
0.418
1.075
0.349 3.506
47.409 0.417
3.16 3.132
0.677
0.159 0.214
9.783 2.471 1.288
3.299
7.822
5.166
6.732 0.62
0.626
4.598
2.923
PRC
14/07 14/0(
0.18l
0.741
10.60i
2.9:
7.2a 6.051
0.29 0.302 3.26 0.831
Page 1
iRAVELPlT
13/08
0.463
37.681 0.878
1 1.871 2.627 1.42
7.842
17.306
16.298
1.881 -0.864 0.666
1.916
4.688
0.937
7.298

APPENDIX C
OUTPUT from NETPATH modelling

OUTPUT from NETPATH modelling 1
Initial Source : PRECIPITATION Final Source : WH-SEEP - 92/07/14
S cu SI ZN FE RS NA AL
Final 33.5415 .I311 ,8447 14.1288 ,6928 202.6379 ,4634 ,5327
CHALCOPYCU - 1.0000 GOETHITEFE - 1.0000 0 2 GAS RS - 4.0000 SFALERITZN - 1.0000 SiO2 SI - 1.0000 PYRITE FE - 1.0000 PLAGAN38CA - .3800 GIBBSITEAL - 1.0000
Initial (millimoldL) ,0147 .0001 .oooo .0001 .0012 ,0907 ,0025 .0020
FE - 1.0000 S - 2.0000 RS - 2.0000 RS - 3.0000
S - 1.0000 RS - 2.0000
S - 2.0000 RS - .OOOO 13 - 60.0000 NA - ,6200 AL - 1.3800 SI - 2.6200
MODEL 1 (- indicates precipitation) CHALCOPY + ,13104 GOETHITE - -9.00736 02 GAS + 64.52217 SFALERIT + 14.12870 SiO2 - -1.10290 PYRITE + 9.56801 PLAGAN38 .74335 GlBBSlTE -.49519
Data used for Carbon-I3 Insufficient data
Data used for C-14 (% mod) Insufficient data
Data used for Sulfur-34 Insufficient data
Data used for Strontium-87 Insufficient data
1 models were tested. 1 models were found which satisfied the constraints.

OUTPUT from NETPATH modelling 2
Initial Source : GRAVEL PIT - 92/08/13 Final Source : WH-SEEP - 92/07/14
S cu SI ZN FE RS NA AL
Final 33.5415 ,1311 ,8447 14.1288 ,6928 202.6379 ,4634 ,5327
CHALCOPYCU - 1.0000 GOETHITEFE - 1.0000 0 2 GAS RS - 4.0000 SFALERITZN - 1.0000 Si02 SI - 1.0000 PYRITE FE - 1.0000
GIBBSITEAL 1.0000 PLAGAN38CA - ,3800
Initial (millimole/L) ,0827 .0001 ,0121 ,0008 .0013 ,4998 .0600 .0014
FE - 1.0000 S - 2.0000 RS - 2.0000 RS - 3.0000
S - 1.0000 RS - 2.0000
S - 2.0000 RS -.OOOO 13 - 60.0000 NA - ,6200 AL - 1.3800 SI - 2.6200
MODEL 1 (- indicates precipitation) CHALCOPY + ,13103 GOETHITE - -8.97387 0 2 GAS + 64.39444 SFALERIT + 14.12800
PYRITE + 9.53441 PLAGAN38 55056 GlBBSlTE -.36654
SiO2 - -.87189
Data used for Carbon-I3 Insufficient data
Data used for C-14 (% mod) Insufficient data
Data used for Sulfur-34 Insufficient data
Data used for Strontium-87 Insufficient data
1 models were tested. 1 models were found which satisfied the constraints.

OUTPUT from NETPATH modelling 3
Initial Source : GRAVEL PIT - 92/08/13 Final Source : WH-SEEP - 92/08/14
Final Initial (millimole/L) S 30.5686 ,0827 cu ,1179 .0001 SI ,8725 ,0121 ZN 7.5585 ,0008 FE 1.3343 ,0013
NA ,3993 .0600 AL ,5360 .0014
RS 186,0803 .499a
CHALCOPYCU - 1.0000 FE - 1.0000 S - 2.0000 RS - 2.0000 02 GAS RS - 4.0000
SiO2 SI - 1.0000 PYRITE FE - 1.0000 S - 2.0000 RS - .OOOO 13 - 60.0000
GIBBSITEAL - 1.0000 HEMATITEFE - 2.0000 RS - 6.0000
SFALERITZN - 1.0000 S - 1.0000 RS - 2.0000
PLAGAN38CA - ,3800 NA - ,6200 AL - 1.3800 SI - 2.6200
MODEL 1 CHALCOPY + 0 2 GAS + SFALERIT + SiO2 - PYRITE + PLAGAN38 GlBBSlTE HEMATITE -
(- indicates precipitation) .I 1782 57.83120 7.55766 -57314 11.34633 54715 -22049 -5.06556
Data used for Carbon-I3 Insufficient data
Data used for C-14 (% mod) Insufficient data
Data used for Sulfur-34 Insufficient data
Data used for Strontium-87 Insufficient data
1 models were tested. 1 models were found which satisfied the constraints.

OUTPUT from NETPATH modelling 4
Initial Source : PRECIPITATION Final Source : BR-CAP - 92/07/14
Final S 26.0218 cu ,0292 SI ,5714 ZN 9.8593 FE ,3505 RS 156.8337 NA ,4354 AL ,1287
CHALCOPYCU - 1.0000 GOETHITEFE - 1.0000 02 GAS RS - 4.0000 SFALERITZN - 1.0000 SiO2 SI - 1.0000 PYRITE FE - 1.0000 PLAGAN38CA - ,3800 GIBBSITEAL - 1.0000
Initial (rnillimole/L) ,0147 .0001 .oooo .0001 .0012 ,0907 ,0025 .0020
FE - 1.0000 S - 2.0000 RS - 2.0000 RS - 3.0000
S - 1.0000 RS - 2.0000
S - 2.0000 RS - .OOOO 13 - 60.0000 NA - ,6200 AL - 1.3800 SI - 2.6200
MODEL 1 CHALCOPY + GOETHITE - 02 GAS + SFALERIT + SiO2 - PYRITE + PLAGAN38 GlBBSlTE
(- indicates precipitation) ,02916
49.92335 9.85915 -1.25777 8.04482
-7.72459
,69816 -.a3673
Data used for Carbon-I3 Insufficient data
Data used for C-14 (% mod) Insufficient data
Data used for Sulfur-34 Insufficient data
Data used for Strontium-87 Insufficient data
1 models were tested. 1 models were found which satisfied the constraints.

OUTPUT from NETPATH modelling 5
Initial Source : GRAVEL PIT - 92/08/13 Final Source : BR-CAP - 92/07/14
Final S 26.0218 cu ,0292 SI ,5714 ZN 9.8593 FE ,3505 RS 156.8337 NA ,4354 AL .I287
CHALCOPYCU - 1 .OOOO GOETHITEFE - 1.0000 0 2 GAS RS - 4.0000 SFALERITZN - 1.0000 SiO2 SI - 1.0000 PYRITE FE - 1.0000 PLAGAN38CA - ,3800 GlBBSlTEAL - 1.0000
Initial (millimole/L) .0827 .0001 .0121 .0008 ,0013 ,4998 ,0600 ,0014
FE - 1.0000 S - 2.0000 RS - 2.0000 RS - 3.0000
S - 1.0000 RS - 2.0000
S - 2.0000 RS - .OOOO 13 - 60.0000 NA - ,6200 AL - 1.3800 SI - 2.6200
MODEL 1 CHALCOPY +
02 GAS + SFALERIT + Si02 - PYRITE + PLAGAN38 GlBBSlTE
GOETHITE -
(- indicates precipitation) ,02915 -7.691 10 49.79561 9.85845 -1.02676 8.01122 ,60537 -.70808
Data used for Carbon-I3 Insufficient data
Data used for C-14 (% mod) Insufficient data
Data used for Sulfur-34 Insufficient data
Data used for Strontium-87 Insufficient data
1 models were tested. 1 models were found which satisfied the constraints

OUTPUT from NETPATH modelling 6
Initial Source 1 : WH-SEEP - 92/08/14 Initial Source 2 : GRAVEL PIT - 92/08/13 Final Source : PR-CAP - 92/08/14
Final Initial 1 Initial 2 (millimole/L) S 1.291 3 30.5686 .0827 CU ,0006 ,1179 .0001 SI ,1585 ,8725 .0121 ZN ,0451 7.5585 ,0008 FE ,0044 1.3343 ,0013 RS 7.7567 186.0803 ,4998
GOETHITEFE - 1.0000 RS - 3.0000 0 2 GAS RS - 4.0000 ZlNKlTE ZN - 1.0000
PLAGAN38CA - ,3800 NA - ,6200 AL - 1.3800 SI - 2.6200 CUSULFATCU - 2.0000 C - 1.0000 RS - 4.0000
MODEL 1 INlT 1 + F INlT 2 + F
02GAS + GOETHITE -
ZlNKlTE -
PLAGAN38 CUSULFAT -
(- indicates precipitation) ,03965 ,96035 -.04973 .01420 -.25532 -.00208 ,04286
Data used for Carbon-I3 Insufficient data
Data used for C-14 (% mod) Insufficient data
Data used for Sulfur-34 Insufficient data
Data used for Strontium-87 Insufficient data
1 models were tested. 1 models were found which satisfied the constraints.

OUTPUT from NETPATH modelling 7
Initial Well 1 : BR-CAP - 92/08/13 Initial Well 2 : GRAVEL PIT - 92/08/13 Final Well : PR-CAP - 92/08/14
Final Initial 1 Initial 2 (millimolelL) S 1.2913 25.3549 ,0827 CU ,0006 ,0204 .0001 SI ,1585 ,6038 ,0121 ZN ,0451 6.1408 ,0008 FE ,0044 ,2552 ,0013 RS 7.7567 152.6397 ,4998
GOETHITEFE - 1.0000 RS - 3.0000 0 2 GAS RS - 4.0000 ZlNKlTE ZN - 1.0000 CUSULFATCU - 2.0000 C - 1 .OOOO RS - 4.0000 PLAGAN38CA - ,3800 NA - ,6200 AL - 1.3800 SI - 2.6200
MODEL 1 INlT 1 + F INlT 2 + F GOETHITE - 02GAS +
CUSULFAT - PLAGAN38
ZlNKlTE -
(- indicates precipitation) .04783 .95217 -.00902 ,00218 -.24934
,04508 -.00023
Data used for Carbon-I3 Insufficient data
Data used for C-14 (% mod) Insufficient data
Data used for Sulfur-34 Insufficient data
Data used for Strontium-87 Insufficient data
1 models were tested. 1 models were found which satisfied the constraints.

OUTPUT from NETPATH modelling 8
Initial Source 1 : WH-SEEP - 92/07/14 Initial Source 2 : GRAVEL PIT - 92/08/13 Final Source : PR-SEEP - 92/07/13
Final Initial 1 Initial 2 (millimolelL) S 4.7711 33.5415 ,0827 CU ,0236 ,1311 .0001 SI .2465 ,8447 ,0121 ZN ,7072 14.1288 ,0008 FE .OOOO ,6928 ,0013 RS 28.6266 202.6379 ,4998
GOETHITEFE - 1.0000 RS - 3.0000 0 2 GAS RS - 4.0000 ZlNKlTE ZN - 1.0000 PLAGAN38CA - ,3800 NA - ,6200 AL - 1.3800 SI - 2.6200 CHALCOPYCU - 1.0000 FE - 1.0000 S - 2.0000 RS - 2.0000
MODEL 1 lNlT 1 + F INlT 2 + F GOETHITE - 0 2 GAS +
PLAGAN38 + CHALCOPY t
ZlNKlTE -
(- indicates precipitation) .I3981 ,86019 -.I 031 8 ,04630
,04503 .00522
-1.26887
Data used for Carbon-I3 Insufficient data
Data used for C-14 (% mod) Insufficient data
Data used for Sulfur-34 Insufficient data
Data used for Strontium-87 Insufficient data
1 models were tested. 1 models were found which satisfied the constraints.

OUTPUT from NETPATH modelling 9
Initial Well : PR-SEEP - 92/07/13 Final Well : PR-SEEP - 92/08/14
Final Initial (millimole/L) S 3.1109 4.771 1 ZN ,3398 ,7072 FE ,0036 .oooo RS 18.8129 28.8583 MN ,0701 .I158 cu ,0091 .0236
0 2 GAS RS - 4.0000 MnOOH MN - 1.0000 RS - 3.0000
CUSULFATCU - 1.0000 S - 1.0000 RS - 6.0000 ZINKITE ZN - 1.0000
PYRITE FE - 1.0000 S - 2.0000 RS - .OOOO 13 - 60.0000
MODEL 1 (- indicates precipitation) 0 2 GAS + ,01395 MnOOH -.00540 ZINKITE - -.I2125 CUSULFAT - -.00630 PYRITE + ,00360 Dilution factor: 1.534
Data used for Carbon-I3 Insufficient data
Data used for C-14 (% mod) Insufficient data
Data used for Sulfur-34 Insufficient data
Data used for Strontium-87 Insufficient data
1 models were tested. 1 models were found which satisfied the constraints.

OUTPUT from NETPATH modelling 10
Initial Source : PRECIPITATION Final Source : MILL POND - 92/07/13
Final S 15.5984 cu ,3975 SI ,4989 ZN 5.0444 FE ,3392 RS 94.2685 NA ,1461
Initial (millimolelL) .0147 .0001 .oooo .0001 .0012 .0907 ,0025
0 2 GAS RS - 4.0000 PLAGAN38CA - ,3800 NA - ,6200 AL - 1.3800 SI - 2.6200 CHALCOPYCU - 1.0000 FE - 1.0000 S - 2.0000 RS - 2.0000
SFALERITZN - 1.0000 S - 1 .OOOO RS - 2.0000 GOETHITEFE - 1.0000 RS - 3.0000 SiO2 SI - 1.0000
PYRITE FE - 1.0000 S - 2.0000 RS - .OOOO 13 - 60.0000
MODEL 1 0 2 GAS + PLAGAN38 + CHALCOPY + PYRITE + SFALERIT + GOETHITE - Si02 -
(- indicates precipitation) 29.96399 ,23153 ,39740 4.87230 5.04422 -4.93166 -.I0768
Data used for Carbon-I3 Insufficient data
Data used for C-14 (% mod) Insufficient data
Data used for Sulfur-34 Insufficient data
Data used for Strontium-87 Insufficient data
1 models were tested. 1 models were found which satisfied the constraints.

OUTPUT from NETPATH modelling 11
Initial Source : MILL POND - 92/07/13 Final Source : MILL POND 92-07-18
Final Initial (millimole/L) S 12.1 898 15.5984 ZN 3.5706 5.0444 RS 73.6966 94.3454 MN ,2790 ,3776 CU ,2207 ,3975
GOETHITEFE - 1.0000 RS - 3.0000 0 2 GAS RS - 4.0000 MnOOH MN - 1.0000 RS - 3.0000
ZlNKlTE ZN - 1.0000 CUSULFATCU - 2.0000 C - 1.0000 RS - 4.0000
MODEL 1 (- indicates precipitation) 0 2 GAS .04899 MnOOH - -.01613
ZlNKlTE - -.37141 Dilution factor: 1.280
CUSULFAT - -.04496
Data used for Carbon-I3 Insufficient data
Data used for C-14 (% mod) Insufficient data
Data used for Sulfur-34 Insufficient data
Data used for Strontium-87 Insufficient data
5 models were tested. 1 models were found which satisfied the constraints

OUTPUT from NETPATH modelling 12
Initial Source 1 : MILL POND - 92/07/13 Initial Source 2 : PRECIPITATION Final Source : MILL POND - 92/08/14
Final S 13.9668 CU 2255 SI .4603 ZN 2.9277 RS 83.8010 NA ,1316 AL ,2381
Initial 1 15.5984 ,3975 ,4989 5.0444 93.5901 ,1461 ,4458
Initial 2 (millimolelL) ,0147 .0001 .oooo .0001 ,0884 ,0025 .0020
GIBBSITEAL - 1.0000 CUSULFATCU - 2.0000 S - 1.0000 RS - 6.0000
PLAGAN38CA - ,3800 NA - ,6200 AL - 1.3800 SI - 2.6200 SiO2 SI - 1.0000 GYPSUM CA - 1.0000 S - 1.0000 RS - 6.0000 13 - 22.0000
ZlNKlTE ZN - 1.0000
GOETHITEFE - 1.0000 RS - 3.0000
MODEL 1 INlT 1 + F INlT 2 + F GlBBSlTE CUSULFAT - ZlNKlTE - PLAGAN38 + SiO2 GOETHITE
(- indicates precipitation) ,89954 ,10046 -. 16313 -.06603 -1.60995 .ooooo ,01146 .ooooo
MODEL 2 INlT 1 + F INlT 2 + F GlBBSlTE CUSULFAT ZlNKlTE - 3 0 2 GYPSUM - GOETHITE
(- indicates precipitation) ,89955 ,10045 -.I6313 -.06604 -1.60997 ,01146 -.00007 .ooooo
7 models were tested. 2 models were found which satisfied the constraints,

OUTPUT from NETPATH modelling 13
Initial Source 1 : BR-CAP - 92/07/14 Initial Source 2 : GRAVEL PIT - 92/08/13 Final Source : BR13-SEEP - 92/07/13
Final S 11.3756 cu .oooo SI .3634 ZN 2.6508 FE ,2457 RS 69.4232 MN ,3391
Initial 1 26.0218 ,0292 ,5714 9.8593 ,3505 158.8547 1.0105
Initial 2 (millimolelL) ,0827 .0001 ,0121 ,0008 ,0013 5006 .0004
0 2 GAS RS - 4.0000 ZlNKlTE ZN - 1.0000 MnOOH MN - 1.0000 RS - 3.0000 CUFERRITCU - 1.0000 FE - 1.0000 RS - 3.0000 PLAGAN38CA - .3800 NA - ,6200 AL - 1.3800 SI - 2.6200 PYRITE FE - 1.0000 S - 2.0000 RS - .OOOO 13 - 60.0000
MODEL 1 INIT 1 + F INlT 2 + F 02 GAS + ZlNKlTE - MnOOH - CUFERRIT - PLAGAN38 + PYRITE +
(- indicates precipitation) .42705 ,57295 ,40324 -1,56014 -.09265 -.01253 ,04292 ,10782
Data used for Carbon-I3 Insufficient data
Data used for C-14 (% mod) Insufficient data
Data used for Sulfur-34 Insufficient data
Data used for Strontium-87 Insufficient data
1 models were tested. 1 models were found which satisfied the constraints.

OUTPUT from NETPATH modelling 14
Initial Source : BR13-SEEP - 92/07/13 Final Source : BR13 SEEP 92-07-16
Final Initial (millimolelL) S 5.2758 11.3756 ZN 1.2891 2.6508 RS 32.1386 69.4232 FE ,0772 ,2457 MN .I647 ,3391
GOETHITEFE - 1.0000 RS - 3.0000 0 2 GAS RS - 4.0000 SFALERITZN - 1.0000 S - 1 .OOOO RS - 2.0000 MnOOH MN - 1.0000 RS - 3.0000
MODEL 1 (- indicates precipitation) GOETHITE - -.03503 0 2 GAS ,16203 SFALERIT + ,07784 MnOOH ,00972 Dilution factor: 2.188
Data used for Carbon-I3 Insufficient data
Data used for C-14 (% mod) Insufficient data
Data used for Sulfur-34 Insufficient data
Data used for Strontium-87 Insufficient data
1 models were tested. 1 models were found which satisfied the constraints.

OUTPUT from NETPATH modelling 15
Initial Source 1 : BR-CAP - 92/07/14 Initial Source 2 : GRAVEL PIT - 92/08/13 Final Source : C13-Stn30 - 92/08/14
Final S 11.1881 cu .oooo SI ,2401 ZN 2.1758 FE .3695 RS 68.6365 MN ,3847
Initial 1 26.0218 .0292 ,5714 9.8593 ,3505 158.8547 1.0105
Initial 2 (millimolelL) ,0827 .0001 .0121 ,0008 ,0013 ,5006 ,0004
0 2 GAS RS - 4.0000
MnOOH MN - 1.0000 RS - 3.0000 CUFERRITCU - 1.0000 FE - 1.0000 RS - 3.0000
Si02 SI - 1.0000
ZlNKlTE ZN - 1.0000
PYRITE FE - 1.0000 S - 2.0000 RS - .OOOO 13 - 60.0000
MODEL 1 INlT 1 + F INlT 2 + F 0 2 GAS + ZlNKlTE - MnOOH - CUFERRIT PYRITE + Si02 -
(- indicates precipitation) ,40985 ,59015 ,83976
-.02970 -.01203 ,23707 -.00129
-1.86558
Data used for Carbon-I3 Insufficient data
Data used for C-14 (% mod) Insufficient data
Data used for Sulfur-34 Insufficient data
Data used for Strontium-87 Insufficient data
1 models were tested. 1 models were found which satisfied the constraints.

OUTPUT from NETPATH modelling 16
Initial Source : C13-Stn30 - 92/08/14 Final Source : C13-Stn30 - 92/07/15
Final Initial (millimole/L) S 5.4904 11.1881 ZN 1.0916 2.1758 RS 33.4320 68.6365 FE ,0516 ,3695 MN ,1931 ,3847
GOETHITEFE - 1.0000 RS - 3.0000 0 2 GAS RS - 4.0000
MnOOH MN - 1.0000 RS - 3.0000 SFALERITZN - 1.0000 S - 1.0000 RS - 2.0000
MODEL 1 (- indicates precipitation) GOETHITE - -.I2872 0 2 GAS ,09007 SFALERIT + ,02959 MnOOH ,00533 Dilution factor: 2.049
Data used for Carbon-I3 Insufficient data
Data used for C-14 (% mod) Insufficient data
Data used for Sulfur-34 Insufficient data
Data used for Strontium-87 Insufficient data
1 models were tested. 1 models were found which satisfied the constraints,

APPENDIX D BOOJUM QNQC INFORMATION
Methods for field sampling and the storage and handling of samples are summarised in MEND summary report, February 1990. The MEND document also describes methods used for determinations of pH, conductivity, acidity and alkalinity, and information on calibration, etc. The method for Eh determination is available on request. Microbiology and analytical chemistry methods carried out at Dearborn are summarised in the following MEND reports:DSS 23440-8-905/015Q (1 988); DSS 0395Q.23440-8-9264 (June 1990); DSS 0145Q.23440-0-9065 (March 1991).
External quality control (quality assurance)
Cationlanion balances of both water and solid samples were carried out by ICP (Inductively Coupled Plasma Spectrophotometry), U.S. EPA Method No.200.7 at certified laboratories. The QNQCs of EPL and X-Ral are available on request. To assure the validity of the results, blanks and standards were sent together with field samples. These samples were packaged and marked as per the field samples. Standards with different concentrations of metals were sent (0.1, 1, 10, 100, 1000 mg L-' of metals) every few months. The composition of the standards and the procedure for sending these samples to Chauncey Laboratories are available on request. US. National Bureau of Standards 1645 (River Sediment) and 1571 (Orchard Leaves) samples were sent as solid standards. The quality control data for these is available on request. In 1991, 12 standards were sent to Chauncey laboratories and 24 to X- Ral. In 1992, one Al standard and 4 Boojum standards were sent to X-Ral and 18 standards were sent to EPL. The standard analyses were not consistently accurate for any of the three laboratories. These results and those of field samples were thoroughly screened on receipt and where obvious inaccuracies or anomalies were detected, the laboratory was informed, the errors explained and the samples reanalysed.
Boojum Research Limited South Bay 1992 Report for: BP Resources

APPENDIX E Water and Sediment ICP Data
Boojum Research Limited South Bay 1992 Report for: BP Resources


Transect 2
12 12 12 13
1 14/07 3.25 615 18.1 2 14/07 3.26 613 17.8
2.2 14/07 3.34 1250 17.8 sur 14/07 3.26 614 18.2
13 13 13 14 14
1 14/07 3.26 614 18.1 2 14/07 3.27 622 18.7
2.5 14/07 2.99 1320 17.8 sur 14/07 3.26 614 183
1 14/07 3.27 61 2 18
20 20 20
sur 14/07 3.25 612 18.5 1 14/07 3.24 615 18.4
1.4 14/07 3.2 658 18.1


