

See important disclosures at the end of this report Powered by EFATM
Platform 1
Company Update, 24 March 2015
GD Express Courier (GDX MK) Buy (Maintained) Transport - Logistics Target Price: MYR2.05
Market Cap: USD540m Price: MYR1.66
Defying Valuations With Its Earnings Trajectory
Macro
3.00
Risks
2.00
Growth
3.00
Value
3.00
92
97
101
106
110
115
119
124
128
133
137
1.20
1.25
1.30
1.35
1.40
1.45
1.50
1.55
1.60
1.65
1.70
GD Express Courier (GDX MK)Price Close Relative to FTSE Bursa Malaysia KLCI Index (RHS)
1122334455
Ma
r-1
4
Ma
y-1
4
Ju
l-1
4
Se
p-1
4
No
v-1
4
Ja
n-1
5
Vo
l m
Source: Bloomberg
Avg Turnover (MYR/USD) 0.66m/0.18m
Cons. Upside (%) 12.7
Upside (%) 23.7
52-wk Price low/high (MYR) 1.27 - 1.67
Free float (%) 27
Share outstanding (m) 1,201
Shareholders (%)
GD Express (M) SB 31.1
Singapore Post 24.2
GD Holdings International 9.7
Share Performance (%)
YTD 1m 3m 6m 12m
Absolute 5.4 5.7 7.4 8.5 22.2
Relative 3.0 6.0 4.3 10.5 23.1
Shariah compliant
Ahmad Maghfur Usman 603 9207 7654
Forecasts and Valuations Jun-13 Jun-14 Jun-15F Jun-16F Jun-17F
Total turnover (MYRm) 135 159 204 258 319
Reported net profit (MYRm) 13.6 23.4 30.5 41.3 56.6
Recurring net profit (MYRm) 14.5 23.2 30.5 41.3 56.6
Recurring net profit growth (%) 65.7 59.8 31.5 35.5 36.9
Recurring EPS (MYR) 0.02 0.03 0.02 0.03 0.05
DPS (MYR) 0.01 0.01 0.01 0.01 0.02
Recurring P/E (x) 89.7 58.3 67.7 50.0 36.5
P/B (x) 20.0 13.9 16.1 13.3 10.8
P/CF (x) 76.5 50.8 65.5 49.0 36.1
Dividend Yield (%) 0.7 0.7 0.5 0.7 1.0
EV/EBITDA (x) 48.5 42.8 46.8 35.4 26.3
Return on average equity (%) 23.2 28.8 27.1 29.2 32.6
Net debt to equity (%) 12.7 net cash net cash net cash net cash
Our vs consensus EPS (adjusted) (%) 0.0 0.0 0.0
Source: Company data, RHB
GDEX’s exposure in the growing online retail industry (which accounts for just 10% of total revenue) is still at an early stage. BUY with a higher MYR2.05 TP (24% upside), assuming a slightly higher 6.9% WACC. In view of its aggressive expansion ahead, we lift our FY15F-17F earnings by 10%/19%/27%. GDEX could bear more fruit ahead as its capex outlay relative to its strong operating cash flow churn is minimal.
Riding on the eCommerce bandwagon. While 40% of GD Express
Courier’s (GDEX) volume comprises household products, only 10% of its total volume handled is from business-to-consumer (B2C) customers like Lazada, Zalora and Go Shop, Astro’s Home TV shopping arm. As online retail continues to grow, we believe GDEX is poised to be on a growing earnings trajectory ahead. Astro, which kicked off Go Shop in Nov 2014, is becoming one of its fastest-growing customers and could become a Top 5 customer if its home-shopping business does well going forward.
Forecasts. In view of GDEX’s aggressive expansion ahead, we lift our
volume projections for FY15/FY16/FY17 by 12%/25%/37% which, coupled with the expectation of further improvement in its operating efficiency and lower petrol pump prices, have led us to increase our earnings projections by 10%/19%/27% respectively.
A cash cow. We expect GDEX’s outlook to be rosy ahead with very
minimal capex outlay relative to its strong operating cash flow churn. As it could be embarking on an exponential growth trajectory, dividends could be minimal for now but as the courier industry matures eventually without needing any major capex, GDEX’s payout ratio could potentially increase from 35% currently.
Still a BUY, but with a higher TP. We maintain our BUY
recommendation. Following the upward revision in earnings, our TP rises to MYR2.05 (from MYR1.82), premised on a slightly higher WACC of 6.9% (from 6.8% earlier). GDEX’s share price has defied all price-relative valuation metrics. Its average trailing P/E (for four quarters) since 2005 has hovered around 61.4x. Given its expected earnings growth, superior ROEs and strong free cash flow growth trajectory, we deem as reasonable its high P/E multiple.
Risks. The industry is competitive which could impact pricing; any
economic slowdown may result in lower business volumes.

GD Express Courier (GDX MK)
24 March 2015
See important disclosures at the end of this report 2
ASEAN eCommerce: How Far Is The Horizon? eCommerce about to take off in ASEAN. eCommerce has revolutionised retail
markets globally, and is here to stay. Its growth surged in China, now the world’s largest online retail market, and is still poised to expand by a 24% CAGR until 2018. In ASEAN, online retailing is still at a nascent stage, making up less than 1% of total retail sales. We believe it is about to take off, although growth is likely to be more gradual.
Running along speedbumps. Save for Singapore, internet and smartphone
penetration rates in ASEAN countries are still lagging behind markets like China. The lack of “trust” in online transactions is another impediment to eCommerce. Critically, it is difficult for eCommerce players to achieve profitable scale with their high overhead business model, owing to intra-ASEAN trade tariffs and legislations. We believe the move towards ASEAN integration will be a boon for eCommerce players
Philippines and Vietnam have substantial potential. In our view, these two
markets display a strong potential for eCommerce to grow. The Philippines has the youngest median age (23 years) in ASEAN – and 44m active internet users, the second largest in the region. Vietnam already has a relatively high internet penetration rate of 47% and the number of local start-ups is expanding rapidly.
Negative impact on discretionary retailers. eCommerce will have a negative
impact on discretionary retailers, in products such as apparels and electronics which target mid-higher end consumers, in our view. Hence, we are wary of the long-term prospects for retailers which are not brand owners, as they are at risk of disintermediation and competition from online counterparts. Online grocery retailers on the other hand, are unlikely to achieve sufficient scale to challenge brick-and-mortar counterparts for the foreseeable future, in our view.
The above are the key summaries of our ASEAN e-commerce report dated 2 Feb 2015. For full report, please click: How Far Is The Horizon?
Figure 1: Top 5 Countries, ranked by eCommerce sales Figure 2: ASEAN internet retailing as a % of total retail sales
USD b 2013 2014F 2015F 2016F 2017F 2018F
1. China 315.8 426.3 562.7 714.6 871.8 1011.3
% chg 47.0% 35.0% 32.0% 27.0% 22.0% 16.0%
% of total retail sales 8.3% 10.1% 12.0% 13.8% 15.5% 16.6%
2. US 264.3 305.7 349.1 394.4 442.6 493.9
% chg 16.5% 15.7% 14.2% 13.0% 12.2% 11.6%
% of total retail sales 5.8% 6.5% 7.1% 7.7% 8.3% 8.9%
3. UK 70.4 82.0 93.9 104.2 114.6 125.0
% chg 17.0% 16.5% 14.5% 11.0% 10.0% 9.0%
% of total retail sales 11.6% 13.0% 14.4% 15.6% 16.9% 18.0%
4. Japan 62.1 70.8 79.3 88.1 96.9 106.1
% chg 17.9% 14.0% 12.0% 11.0% 10.0% 9.5%
% of total retail sales 4.4% 4.9% 5.4% 5.8% 6.2% 6.7%
5. Germany 51.9 63.4 73.5 82.9 92.0 99.3
% chg 21.7% 22.1% 15.9% 12.9% 10.9% 8.0%
Title:
Source:
Please fill in the values above to have them entered in your report
3.4
0.9
1.2
0.7
0.50.6
0.0
0.5
1.0
1.5
2.0
2.5
3.0
3.5
4.0
Singapore Malaysia Thailand Indonesia Philippines Vietnam
%
Source: eMarketer 2014 Source: Euromonitor 2014

GD Express Courier (GDX MK)
24 March 2015
See important disclosures at the end of this report 3
Figure 3: Internet penetration rates in ASEAN and the USA Figure 4: Potential online retail market sizes in ASEAN*
Title:
Source:
Please fill in the values above to have them entered in your report
74.269.4
30.6
17.3
40.746.6
85.3
49.3
0
10
20
30
40
50
60
70
80
90
Sin
gap
ore
Mala
ysia
Thaila
nd
Ind
onesia
Phili
pp
ines
Vie
tnam
United
Sta
tes
Chin
a
%
Title:
Source:
Please fill in the values above to have them entered in your report
1,267
2,730
4,501
7,524
3,481
4,153
0
1,000
2,000
3,000
4,000
5,000
6,000
7,000
8,000
Singapore Malaysia Thailand Indonesia Philippines Vietnam
USD m
Source: Euromonitor 2014 Source: Euromonitor 2014
* assuming online retail hits 5% of current total retail sales
Figure 5: Per cent (%) of population that made an online purchase in the past month
Figure 6: Online retail top categories - Consumers more likely to browse and purchase non-consumables online*
Title:
Source:
Please fill in the values above to have them entered in your report
46
37
1618
21
24
0
5
10
15
20
25
30
35
40
45
50
Singapore Malaysia Indonesia Thailand Philippines Vietnam
%
Category Buy Browse
Clothing, Accessories and Shoes 57 49
Airline tickets 59 43
Tour & Hotel 53 44
Event ticket 50 39
Hardcopy book 50 40
Mobile phone 44 39
E-books 43 39
Cosmetics 43 39
Personal Care 43 38
Electronic Equipment 41 43
*Survey for intentions over next 6 months Source: Nielsen’s global survey Aug 2014
Source: We are Social Jan 2015 Survey
A growing sector. The courier segment has grown tremendously over the years.
Since data was compiled back in 2001 by the Malaysian Communications and Multimedia Commission (MCMC), the industry’s annual revenue accumulated by the top 10 courier companies has grown to total revenue of MYR2.187bn in 2013 from only MYR954m in 2001, representing a CAGR of 7.2%. Volume wise, the sector has seen a CAGR of 11.2% since 2005 on documents couriered while the number of parcels has grown at a CAGR of 9.4% over the same period. The growing volume from courier activities reflects the rising need for urgent and secure shipments on the back of the broader economic growth. Coupled with technological advancement in the digital age, this has also propelled the growth of online retail shopping.

GD Express Courier (GDX MK)
24 March 2015
See important disclosures at the end of this report 4
Figure 7: Documents and parcels handled by the courier industry
Figure 8: Revenue of the top 10 courier players in Malaysia (MYRm)
Title:
Source:
Please fill in the values above to have them entered in your report
15.1 14.8 15.4
23.726.2
27.929.3
30.432.7
34.7
12.1
8.09.3
11.412.5 12.1
13.7 12.714.6
16.5
0
5
10
15
20
25
30
35
40
2004 2005 2006 2007 2008 2009 2010 2011 2012 2013
Documents handled (m) Parcels handled (m)
Title:
Source:
Please fill in the values above to have them entered in your report
9541049 1079 1099
1297
15501625
1511 1491
1737
20302105
2187
0
500
1000
1500
2000
2500
2001200220032004200520062007200820092010201120122013
Source: MCMC Source: MCMC
Figure 9: Number of courier licenses Figure 10: Market share of the top 10 courier players (by revenue)
Title:
Source:
Please fill in the values above to have them entered in your report
115 117110
114 112 114109
113105
112108 105
93 93
0
20
40
60
80
100
120
140
Title:
Source:
Please fill in the values above to have them entered in your report23%
24%
15%
12%
7%
6%
5%
4%
2% 2%
DHL Fedex UPS Pos Laju TNT
City Link GD Express Nationwide Skynet ABX
Source: MCMC Source: MCMC
Figure 11: Quarterly YoY revenue growth rates since 2009 Figure 12: Quarterly revenue (MYRm) of the three listed courier companies
Title:
Source:
Please fill in the values above to have them entered in your report
-20
-10
0
10
20
30
40
50
60
1Q
09
2Q
09
3Q
09
4Q
09
1Q
10
2Q
10
3Q
10
4Q
10
1Q
11
2Q
11
3Q
11
4Q
11
1Q
12
2Q
12
3Q
12
4Q
12
1Q
13
2Q
13
3Q
13
4Q
13
1Q
14
2Q
14
3Q
14
4Q
14
Nationwide GD Express Pos Laju
Title:
Source:
Please fill in the values above to have them entered in your report
0
20
40
60
80
100
120
140
1Q
00
4Q
00
3Q
01
2Q
02
1Q
03
4Q
03
3Q
04
2Q
05
1Q
06
4Q
06
3Q
07
2Q
08
1Q
09
4Q
09
3Q
10
2Q
11
1Q
12
4Q
12
3Q
13
2Q
14
Nationwide GD Express Pos Laju
Source: RHB, Company data Source: RHB, Company data

GD Express Courier (GDX MK)
24 March 2015
See important disclosures at the end of this report 5
Online shopping has yet to come in a big way. Over the recent years, driving
volume growth for the sector has been increasing the number of online retail shopping activities, which require the last mile delivery to the customers’ doors. These deliveries can be channeled through two different platforms:
1) Business to Customers(B2C): the online shopping delivery experience, where a customer (as the end user) would purchase from a company (ie online retailer) and have their purchased goods delivered to their doorstep. These kind of delivery methods have been growing significantly with the rise of online retailers such as Lazada, Zalora, Groupon, Rakuten, MySales.com etc.
2) Customers to Customers (C2C): the online shopping experience where two customers trade with each other. This has been the driver for online auctions and classifieds, which play a prominent role on the rise of online classified platforms such as eBay, lelong.com and mudah.my.
The rapid growth of these two segments requires last mile delivery to the customers’ doorsteps. This has built up the need of having to outsource delivery services to courier providers, as this would be a more feasible avenue given the massive capex outlay and costs required if one were to set up its own in-house fleet of trucks.
The growth in the online retail shopping segment from both B2Cs and C2Cs has been the driving force of the growing courier delivery industry. While there is no valid data on how much these online retail sales contribute to total deliveries, according to GDEX, household goods represent as much as 40% of their total deliveries.
With Malaysia seeing only 0.9% of its retail sales transacted online currently (as of 2014), and as more middle-income households are created coupled with the improved smartphone penetration rate, we think Malaysia is well positioned to post further growth in the online retail sales segment to potentially position itself where Singapore is. Singapore is currently seeing almost 3.4% of its total retail sales transacted online. This essentially means that Malaysia’s online retail shopping market could more than triple if it accounts for at least 3% of the total retail online shopping market.
Another driving force that could propel the industry growth of the courier segment is if the traditional brick and mortar retail outlets start to expand its distribution channels online. A research revealed by Ecommercemilo.com reveals that only 16 (accounting for 44%) of the top 36 retail brands have setup their own online shopping portals.

GD Express Courier (GDX MK)
24 March 2015
See important disclosures at the end of this report 6
Figure 13: Top retail brands in Malaysia
Category Retailer Own Online Store
Giant No
Tesco Yes
AEON Big No
7-Eleven No
KK Super Mart No
99 Speedmart No
AEON No
Parkson Yes
The Store No
Padini No
Bata Yes
Kamdar No
Senheng Yes
Harvey Norman Yes
Best Denki No
Guardian Yes
Watsons Yes
Caring Pharmacy No
The Body Shop Yes
Sa Sa Yes
L'Occitane Yes
IKEA No
Courts Yes
ACE Yes
Poh Kong No
Tomei Yes
City Chain No
Popular No
MPH Yes
Borders Yes
PetsMore.com Yes
Pets Wonderland No
Pets Lover Centre No
Al Ikhsan Sports Yes
Takasima Yes
Royal Sporting House No
Sports
Grocery
Convenience Store
Departmental Store
Apparel & Footwear
Electronics & Appliance
Health & Beauty
Beauty Specialist
Home & Garden
Jewellery & Watch
Bookstore
Pet
Source: Ecommercemilo.com
GD Express Courier (GDX MK)
24 March 2015
See important disclosures at the end of this report 7
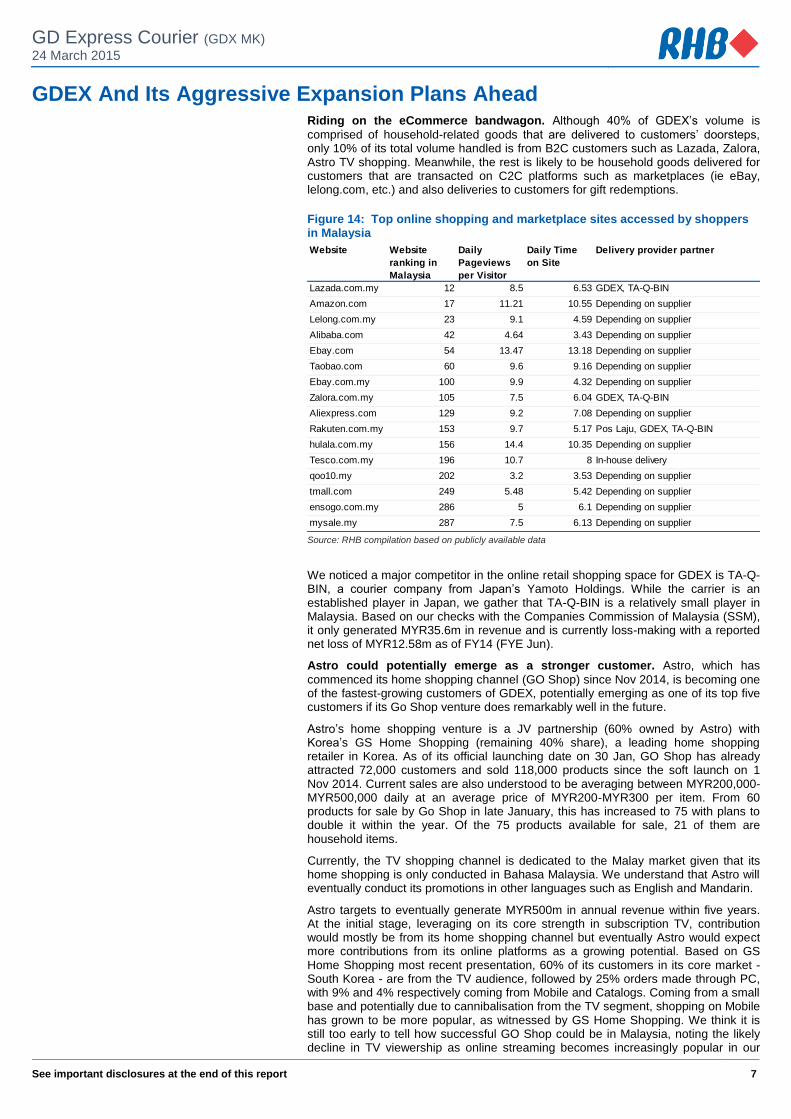
GDEX And Its Aggressive Expansion Plans Ahead Riding on the eCommerce bandwagon. Although 40% of GDEX’s volume is
comprised of household-related goods that are delivered to customers’ doorsteps, only 10% of its total volume handled is from B2C customers such as Lazada, Zalora, Astro TV shopping. Meanwhile, the rest is likely to be household goods delivered for customers that are transacted on C2C platforms such as marketplaces (ie eBay, lelong.com, etc.) and also deliveries to customers for gift redemptions.
Figure 14: Top online shopping and marketplace sites accessed by shoppers in Malaysia
Website Website
ranking in
Malaysia
Daily
Pageviews
per Visitor
Daily Time
on Site
Delivery provider partner
Lazada.com.my 12 8.5 6.53 GDEX, TA-Q-BIN
Amazon.com 17 11.21 10.55 Depending on supplier
Lelong.com.my 23 9.1 4.59 Depending on supplier
Alibaba.com 42 4.64 3.43 Depending on supplier
Ebay.com 54 13.47 13.18 Depending on supplier
Taobao.com 60 9.6 9.16 Depending on supplier
Ebay.com.my 100 9.9 4.32 Depending on supplier
Zalora.com.my 105 7.5 6.04 GDEX, TA-Q-BIN
Aliexpress.com 129 9.2 7.08 Depending on supplier
Rakuten.com.my 153 9.7 5.17 Pos Laju, GDEX, TA-Q-BIN
hulala.com.my 156 14.4 10.35 Depending on supplier
Tesco.com.my 196 10.7 8 In-house delivery
qoo10.my 202 3.2 3.53 Depending on supplier
tmall.com 249 5.48 5.42 Depending on supplier
ensogo.com.my 286 5 6.1 Depending on supplier
mysale.my 287 7.5 6.13 Depending on supplier
Source: RHB compilation based on publicly available data
We noticed a major competitor in the online retail shopping space for GDEX is TA-Q-BIN, a courier company from Japan’s Yamoto Holdings. While the carrier is an established player in Japan, we gather that TA-Q-BIN is a relatively small player in Malaysia. Based on our checks with the Companies Commission of Malaysia (SSM), it only generated MYR35.6m in revenue and is currently loss-making with a reported net loss of MYR12.58m as of FY14 (FYE Jun).
Astro could potentially emerge as a stronger customer. Astro, which has
commenced its home shopping channel (GO Shop) since Nov 2014, is becoming one of the fastest-growing customers of GDEX, potentially emerging as one of its top five customers if its Go Shop venture does remarkably well in the future.
Astro’s home shopping venture is a JV partnership (60% owned by Astro) with Korea’s GS Home Shopping (remaining 40% share), a leading home shopping retailer in Korea. As of its official launching date on 30 Jan, GO Shop has already attracted 72,000 customers and sold 118,000 products since the soft launch on 1 Nov 2014. Current sales are also understood to be averaging between MYR200,000-MYR500,000 daily at an average price of MYR200-MYR300 per item. From 60 products for sale by Go Shop in late January, this has increased to 75 with plans to double it within the year. Of the 75 products available for sale, 21 of them are household items.
Currently, the TV shopping channel is dedicated to the Malay market given that its home shopping is only conducted in Bahasa Malaysia. We understand that Astro will eventually conduct its promotions in other languages such as English and Mandarin.
Astro targets to eventually generate MYR500m in annual revenue within five years. At the initial stage, leveraging on its core strength in subscription TV, contribution would mostly be from its home shopping channel but eventually Astro would expect more contributions from its online platforms as a growing potential. Based on GS Home Shopping most recent presentation, 60% of its customers in its core market - South Korea - are from the TV audience, followed by 25% orders made through PC, with 9% and 4% respectively coming from Mobile and Catalogs. Coming from a small base and potentially due to cannibalisation from the TV segment, shopping on Mobile has grown to be more popular, as witnessed by GS Home Shopping. We think it is still too early to tell how successful GO Shop could be in Malaysia, noting the likely decline in TV viewership as online streaming becomes increasingly popular in our

GD Express Courier (GDX MK)
24 March 2015
See important disclosures at the end of this report 8
view. Furthermore, we also noted that China is GS Home Shopping’s only profitable market, while the rest remains loss making.
Fleet expansion and raising its capacity further. We understand that management
is currently looking to increase its total parcel sorting capacity up to 150,000 daily in the coming years from an expected 100,000 daily this year. This expansion will potentially see the set up of two new hubs (one Northern and one Southern region) from the current one it operates in Petaling Jaya, Selangor. This expansion will likely enhance the room for further network optimisation rather than having all shipments centralised into one hub, thus, allowing greater operational cost savings. We understand that most of the capacity expansion will be at its current hub in Petaling Jaya, given that most of its volume is still within the Klang Valley. GDEX also owns an unutilised landbank of 40,000 sqf next to its existing operations for this expansion. Annual capex targeted by management is expected to be within MYR15m-20m. Our forecasts work out a total capex of MYR55m for FY15F to FY18F.
Figure 15: Tonnage handled Figure 16: Daily Sorting Capacity ('000 items)
Title:
Source:
Please fill in the values above to have them entered in your report
15,42217,81520,457
23,99027,786
33,766
43,413
53,865
65,603
78,385
86,827
0.00
10000.00
20000.00
30000.00
40000.00
50000.00
60000.00
70000.00
80000.00
90000.00
100000.00
Title:
Source:
Please fill in the values above to have them entered in your report
30 30 30
60 60
72 72
100
120
150 150
0
20
40
60
80
100
120
140
160
Source: RHB, Company Source: RHB, Company
The management expects the carrier to expand its lodge in centers (currently at 22 centres) to grow its customer reach, although we understand that GDEX has no intention to grow its network visibility to compete against Pos Malaysia’s large network base of postal offices. In view of its hub expansions, fleet count (currently at 509 trucks) will also increase in tandem, which we expect could potentially grow to 682 by 2020. Note that GDEX also has 2,570 motor bikes in its fleet although most are owned by its delivery workforce.
Room to grow for revenue. GDEX is also looking to generate additional revenues
by offering other services such as insurance coverage and cash on delivery collection on home delivered goods. GDEX tends to be very selective in securing new accounts as it does not want to compromise timely delivery of products at the expense of market share. Based on our personal experience, timeliness in the delivery of goods can greatly enhanced one’s online shopping experience.
Collaboration with SingPost and potentially Alibaba. One of GDEX’s major
shareholders is SingPost (with a 24.2% shareholding), which emerged as a major shareholder back in 2011. SingPost, in turn, also saw the entry of Alibaba as its shareholder with a 10.35% stake back in late May 2014. While it has been four years since SingPost became a shareholder, we noticed that volume contribution between GDEX and SingPost is still very minimal. According to the related party transactions disclosure in its FY14 annual report, GDEX only saw MYR349,900 in revenue derived from SingPost, although this has almost doubled from MYR183,400 in FY13. We understand that these transactions were done at arm’s length basis. Alibaba has yet to make its foray into the Malaysian market but last month, it had opened a dedicated online shopping portal to serve the Indonesian market with a tie-up between Pos Indonesia and SingPost. We believe it is only a matter of time before Alibaba would serve the Malaysian market in a bigger way eventually.

GD Express Courier (GDX MK)
24 March 2015
See important disclosures at the end of this report 9
Regional expansion. Management has always expressed its desire to expand
overseas. Its first initial potential foray was back in 2009, where Laos would be marked as its first attempt at overseas expansion. The MoU was to partner with Laos' national postal company, Enterprise Des Postes Lao (EPL) to develop international and domestic express delivery services under shared brands for the Laotian market. However, due to the policy risks involved as a foreign entity and noting that GDEX was unable to take a controlling stake, the venture was called off. This demonstrates that management does take a cautious approach to its expansion overseas. In the near term, the express carrier cited the possibility of Indonesia and Thailand as two potential markets to tap into, with the former being a current priority. We understand this expansion could likely be in the form of an acquisition.
Indonesia’s courier industry has grown by a CAGR of 16% from 2007 – 2012 and is expected to grow 12% from 2012 – 2018, according to a research by Euromonitor back in Dec 2013. The growth is mainly driven by B2B transactions and we expect the improved internet literacy and penetration to drive online retail shopping activities at key metropolitan cities in the country. Euromonitor also observed that the logistics sector is a very lucrative sector, where profit margin can be as high as 50%. Given its archipelago geography, the industry is very fragmented. Like most shareholding policies in many ASEAN nations, foreigners are only restricted to a 49% ownership. According to the Indonesian Courier and Cargo Association (Asperindo), there are currently 167 express postal carriers in Indonesia (data updated as of Jul 2013).
Given the poor infrastructure in Indonesia, delivery time for express courier services is typically much longer compared with other neighbouring countries. We understand that shipments to Indonesia for purchases made through Aliexpress.com, Alibaba’s worldwide online shopping portal could take as long as 35 days or even more.
Earlier last month, SingPost and AliExpress have tied up with Pos Indonesia to improve delivery speed for products delivered to Indonesia. It targets to reduce delivery time to two weeks. It remains to be seen whether GDEX would play a role in this tie-up. As it is, we understand that GDEX is already in a working relationship with Pos Indonesia as a last mile delivery courier provider in Malaysia. Potential ventures in Indonesia could be in the form of a tie-up with a local partner through a 49% acquisition, as this would give GDEX an immediate footing in Indonesia.
While we are aware of the risks on such venture, we think GDEX would take a cautious approach to any form of regional expansion, as it had in the past when the express carrier tried to venture into the Laos market. Funding for its regional expansion should come from a private placement exercise, which management expects to raise as much as MYR200m. We understand that the exercise will be on a tiered basis instead of a one-shot placement exercise.

GD Express Courier (GDX MK)
24 March 2015
See important disclosures at the end of this report 10
Forecasts Upgrading earnings. We revisit our earnings model in view of GDEX’s aggressive
expansion in going forward. Given the upcoming capacity increase, coupled with the growing volume base from its B2C online retail shopping platforms - which currently only contribute 10% in FY14 revenue - we expect volume growth to remain strong. GDEX’s volume is projected to grow 29%/24%/22% in FY15/FY16/FY17 respectively. Coupled with the economies of scale achieved on the higher volume churned as well as lower petrol pump prices; this should potentially give further boost to margins and earnings ahead.
In Figure 17 we show the changes to our earnings forecasts; since we have raised volume projections for FY15/FY16/FY17 by 12%/25%/37%, coupled with the improved operating efficiencies to be achieved and lower petrol pump prices, our earnings projections are consequently raised by 10%/19%/27% respectively.
Figure 17: Changes to earnings forecasts and assumptions
Source: RHB
A cash cow business. Having invested over MYR42m from FY05 to FY14, GDEX
has been able to generate MYR61m in additional free cash flow on the back of total revenue of MYR366.2m over the same period. We envision GDEX bearing more fruit ahead with very minimal capex outlay relative to its strong operating cash flow churn. While GDEX is embarking on an exponential growth trajectory, dividends will be minimal for now but as the industry matures eventually, the payout ratio could potentially increase from the current payout ratio of 35%. Port operators that have stable cash flow such as Westports (WPRTS MK, BUY, TP: MYR3.96) are dishing out a 75% dividend payout ratio.
Previous Revised % chg from previous forecast
FY14 FY15F FY16F FY17F FY14 FY15F FY16F FY17F FY15F FY16F FY17F
Average volume per day 42,000 48,240 53,600 59,400 42,000 54,000 67,000 81,600 12% 25% 37%
Growth (% chg YoY) 15% 11% 11% 29% 24% 22%
Revenue (MYRm) 158.703 181.857 208.481 237.772 158.703 204.267 258.349 319.101 12% 24% 34%
Diesel price assumption (MYRm) 2.1 2.2 2.3 2.4 2.1 2.0 2.25 2.3 -9% -2% -4%
Core net income (MYRm) 23.1905 27.6438 34.8062 44.6243 23.1905 30.5128 41.335 56.5831 10% 19% 27%
Growth (% chg YoY) 19% 26% 28% 32% 35% 37%

GD Express Courier (GDX MK)
24 March 2015
See important disclosures at the end of this report 11
Valuation And Recommendation Defying gravity. GDEX’s stock price has defied all price relative valuation metrics.
Its average trailing four quarter P/Es since 2005 has hovered at 61.4x. Given the earnings and free cash flow growth trajectory, we deem this justifiable coupled with its superior ROEs averaging at 20% over the past five years. GDEX’s possible closest competitor would be Nationwide (NAT MK, NR), which is trading at 52x trailing four quarters P/E. It has been loss making over the past two FYEs, raking in a ROE average of between 1-2% in the past five years, despite the steady revenue growth. That said, it posted a much lower revenue growth rate compared with GDEX. Another possible close competitor in the niche express carrier play on the international level is Yamoto Holdings (9064 JP; NR), which trades at 30x FY15 P/E (FYE March). Yamoto’s low P/E is justifiable in our view, given that it operates in a mature market (Japan) and it also has low ROEs.
Maintain BUY at a higher TP. We maintain our BUY recommendation. Following the
upward revision in earnings, our TP is consequently raised to MYR2.05 (from MYR1.82), premised on a slightly higher WACC of 6.9% (from 6.8% earlier). Our TP results in an implied FY16 P/E of 62x which is almost in line with its historical average. While our assumption of a terminal growth rate of 3.8% may seem high, we believe this is reasonable if one were to quantify the long-term GDP growth with the combination of a multiplier effect from the growing trend of online retail shopping ahead. Our sensitivity analysis of various terminal growth rates to GDEX’s potential TP is also illustrated below.
Figure 18: GDEX's DCF-derived TP (all figures MYRm unless stated otherwise)
FY14 FY15F FY16F FY17F FY18F FY19F FY20F FY21F FY22F FY23F FY24F FY25F FY26F
Tonnage handled (tonnes) 33,766 43,413 53,865 65,603 78,385 86,827 95,268 100,333 105,479 111,910 123,809 132,652 137,958
Revenue 159 204 258 319 390 440 493 529 567 607 678 733 770
EBITDA 32 44 57 76 108 131 155 168 183 194 218 235 242
Core net income 23 31 41 57 73 90 108 118 128 136 154 166 171
Operating cash flow 27 32 42 55 69 91 109 123 134 142 154 170 180
Capex (4) (10) (15) (20) (10) (15) (10) (20) (20) (20) (30) (20) (20)
Free cash flow to firm 23 22 27 35 59 76 99 103 114 122 124 150 160
Period 1 2 3 4 5 6 7 8 9 10 11
PV to free cash flow 21.9 24.8 30.9 48.2 58.3 70.8 69.4 71.7 71.7 68.0 77.2 77.0
Total PV of free cash flow 679.0
Terminal value at 3.8% growth 3,803.6
PV of terminal value 1834.0
Net cash 41.4
Total equity value 2,554.4
Number of shares after conversion of warrant A (m) 1244.1
TP 2.05
WACC computation
Risk free rate 3.8%
Market risk premium 5.5%
Beta 0.80
Cost of equity 8.2%
After-tax cost of debt 4.9%
Long term weightage for equity 60.0%
Long term weightage for debt 40.0%
WACC 6.9%
Terminal growth rate 3.80% Source: RHB
Figure 19: Sensitivity of TP to WACC and the terminal growth rate
Source: RHB
1.8% 2.8% 3.8% 4.8% 5.8%
WACC 8.9% 1.32 1.48 1.72 2.09 2.78
7.9% 1.44 1.62 1.88 2.29 3.05
6.9% 1.57 1.77 2.05 2.51 3.36
5.9% 1.71 1.93 2.25 2.76 3.69
4.9% 1.87 2.12 2.47 3.03 4.07
Terminal growth rate

GD Express Courier (GDX MK)
24 March 2015
See important disclosures at the end of this report 12
Financial Exhibits
Profit & Loss (MYRm) Jun-13 Jun-14 Jun-15F Jun-16F Jun-17F
Total turnover 135 159 204 258 319
Cost of sales (27) (34) (45) (55) (63)
Gross profit 108 125 159 203 256
Gen & admin expenses (70) (81) (99) (122) (151)
Other operating costs (16) (19) (24) (32) (39)
Operating profit 22 25 36 49 67
Operating EBITDA 27 31 43 57 76
Depreciation of fixed assets (5) (6) (7) (8) (10)
Operating EBIT 22 25 36 49 67
Interest income 0 1 1 1 1
Interest expense (1) (1) (1) (1) (1)
Exceptional income - net (1) 0 - - -
Pre-tax profit 19 24 36 49 67
Taxation (6) (1) (5) (7) (10)
Profit after tax & minorities 14 23 31 41 57
Reported net profit 14 23 31 41 57
Recurring net profit 15 23 31 41 57
Source: Company data, RHB
Cash flow (MYRm) Jun-13 Jun-14 Jun-15F Jun-16F Jun-17F
Operating profit 22 25 36 49 67
Depreciation & amortisation 5 6 7 8 10
Change in working capital (5) (4) (7) (9) (12)
Other operating cash flow 1 2 0 1 2
Operating cash flow 23 29 37 50 67
Interest received 0 1 1 1 1
Interest paid (1) (1) (1) (1) (1)
Tax paid (4) (2) (5) (7) (10)
Cash flow from operations 17 27 32 42 57
Capex (5) (4) (10) (15) (20)
Other investing cash flow 1 1 1 1 1
Cash flow from investing activities (4) (3) (9) (14) (19)
Dividends paid (3) (0) (11) (14) (20)
Proceeds from issue of shares 2 9 5 (6) (6)
Increase in debt (5) (7) 1 1 1
Other financing cash flow (2) 2 (4) (4) (4)
Cash flow from financing activities (8) 4 (9) (24) (29)
Cash at beginning of period 12 18 42 59 67
Total cash generated 4 27 13 5 9
Implied cash at end of period 17 45 56 64 77
Source: Company data, RHB

GD Express Courier (GDX MK)
24 March 2015
See important disclosures at the end of this report 13
Financial Exhibits
Balance Sheet (MYRm) Jun-13 Jun-14 Jun-15F Jun-16F Jun-17F
Total cash and equivalents 18 42 59 67 78
Inventories 1 1 2 2 3
Accounts receivable 30 32 41 52 64
Other current assets 4 6 8 10 12
Total current assets 53 82 110 131 157
Tangible fixed assets 32 36 43 55 69
Total other assets 22 22 21 21 20
Total non-current assets 54 58 64 75 90
Total assets 107 140 175 207 247
Short-term debt 7 4 4 4 4
Accounts payable 3 4 5 7 7
Other current liabilities 10 10 13 17 19
Total current liabilities 21 19 23 27 31
Total long-term debt 19 21 21 21 22
Other liabilities 2 3 3 3 3
Total non-current liabilities 21 24 24 24 25
Total liabilities 42 42 47 52 55
Share capital 26 42 45 45 45
Retained earnings reserve 36 55 83 110 147
Other reserves 3 - - - -
Shareholders' equity 65 97 128 155 192
Total equity 65 97 128 155 192
Total liabilities & equity 107 140 175 207 247
Source: Company data, RHB
Key Ratios (MYR) Jun-13 Jun-14 Jun-15F Jun-16F Jun-17F
Revenue growth (%) 16.2 17.4 28.7 26.5 23.5
Operating profit growth (%) 57.3 14.7 46.3 35.2 36.2
Net profit growth (%) 55.6 71.8 30.5 35.5 36.9
EPS growth (%) (49.0) 65.4 (14.5) 35.5 36.9
Bv per share growth (%) (59.1) 44.0 (13.8) 21.0 23.7
Operating margin (%) 16.0 15.6 17.7 19.0 20.9
Net profit margin (%) 10.1 14.7 14.9 16.0 17.7
Return on average assets (%) 13.4 18.9 19.4 21.7 25.0
Return on average equity (%) 23.2 28.8 27.1 29.2 32.6
Net debt to equity (%) 12.7 (17.5) (26.7) (26.7) (27.2)
DPS 0.01 0.01 0.01 0.01 0.02
Recurrent cash flow per share 0.02 0.03 0.03 0.03 0.05
Source: Company data, RHB

GD Express Courier (GDX MK)
24 March 2015
See important disclosures at the end of this report 14
SWOT Analysis
Good management as evidenced by the steady growth in earnings over the past 10 years
High staff productivity translates into high profit margins
A surge in operating expenses (mainly fuel costs) could dampen its earnings
The e-commerce boom in the region could help drive its business volume
Unattractive valuation in terms of P/E
Operating in a highly competitive and fragmented industry
-60%
-37%
-13%
10%
33%
57%
80%
0
20
40
60
80
100
120
Jan
-13
Jan
-14
Jan
-15
Jan
-16
Jan
-17
P/E (x) vs EPS growth
P/E (x) (lhs) EPS growth (rhs)
0%
7%
14%
21%
28%
35%
0.0
5.0
10.0
15.0
20.0
25.0
Jan
-13
Jan
-14
Jan
-15
Jan
-16
Jan
-17
P/BV (x) vs ROAE
P/B (x) (lhs) Return on average equity (rhs)
Source: Company data, RHB Source: Company data, RHB
Company Profile GD Express Courier (GDEX) is the leading express delivery company in Malaysia and is currently entering the third-party logistics (3PL) business.

GD Express Courier (GDX MK)
24 March 2015
See important disclosures at the end of this report 15
Recommendation Chart
0.00
0.20
0.40
0.60
0.80
1.00
1.20
1.40
1.60
1.80
Mar-10 Jul-11 Oct-12 Jan-14
Price Close
na
2.4
2
1.8
2 Recommendations & Target Price
Buy Neutral Sell Trading Buy Take Profit Not Rated
Source: RHB, Bloomberg
Date RecommendationTarget Price Price
2015-02-13 Buy 1.82 1.61
2014-11-12 Buy 2.42 1.57
Source : RHB, Bloomberg

16
RHB Guide to Investment Ratings Buy: Share price may exceed 10% over the next 12 months Trading Buy: Share price may exceed 15% over the next 3 months, however longer-term outlook remains uncertain Neutral: Share price may fall within the range of +/- 10% over the next 12 months Take Profit: Target price has been attained. Look to accumulate at lower levels Sell: Share price may fall by more than 10% over the next 12 months Not Rated: Stock is not within regular research coverage
Investment Research Disclaimers
RHB has issued this report for information purposes only. This report is intended for circulation amongst RHB and its aff iliates’ clients generally or such
persons as may be deemed eligible by RHB to receive this report and does not have regard to the specific investment objectives, financial situation and
the particular needs of any specific person who may receive this report. This report is not intended, and should not under any circumstances be construed
as, an offer or a solicitation of an offer to buy or sell the securities referred to herein or any related financial instruments.
This report may further consist of, whether in whole or in part, summaries, research, compilations, extracts or analysis that has been prepared by RHB’s
strategic, joint venture and/or business partners. No representation or warranty (express or implied) is given as to the accuracy or completeness of such
information and accordingly investors should make their own informed decisions before relying on the same.
This report is not directed to, or intended for distribution to or use by, any person or entity who is a citizen or resident of or located in any locality, state,
country or other jurisdiction where such distribution, publication, availability or use would be contrary to the applicable laws or regulations. By accepting
this report, the recipient hereof (i) represents and warrants that it is lawfully able to receive this document under the laws and regulations of the jurisdiction
in which it is located or other applicable laws and (ii) acknowledges and agrees to be bound by the limitations contained herein. Any failure to comply with
these limitations may constitute a violation of applicable laws.
All the information contained herein is based upon publicly available information and has been obtained from sources that RHB believes to be reliable and
correct at the time of issue of this report. However, such sources have not been independently verified by RHB and/or its affiliates and this report does not
purport to contain all information that a prospective investor may require. The opinions expressed herein are RHB’s present opinions only and are subject
to change without prior notice. RHB is not under any obligation to update or keep current the information and opinions expressed herein or to provide the
recipient with access to any additional information. Consequently, RHB does not guarantee, represent or warrant, expressly or impliedly, as to the
adequacy, accuracy, reliability, fairness or completeness of the information and opinion contained in this report. Neither RHB (including its officers,
directors, associates, connected parties, and/or employees) nor does any of its agents accept any liability for any direct, indirect or consequential losses,
loss of profits and/or damages that may arise from the use or reliance of this research report and/or further communications given in relation to this report.
Any such responsibility or liability is hereby expressly disclaimed.
Whilst every effort is made to ensure that statement of facts made in this report are accurate, all estimates, projections, forecasts, expressions of opinion
and other subjective judgments contained in this report are based on assumptions considered to be reasonable and must not be construed as a
representation that the matters referred to therein will occur. Different assumptions by RHB or any other source may yield substantially different results
and recommendations contained on one type of research product may differ from recommendations contained in other types of research. The
performance of currencies may affect the value of, or income from, the securities or any other financial instruments referenced in this report. Holders of
depositary receipts backed by the securities discussed in this report assume currency risk. Past performance is not a guide to future performance. Income
from investments may fluctuate. The price or value of the investments to which this report relates, either directly or indirectly, may fall or rise against the
interest of investors.
This report does not purport to be comprehensive or to contain all the information that a prospective investor may need in order to make an investment
decision. The recipient of this report is making its own independent assessment and decisions regarding any securities or financial instruments referenced
herein. Any investment discussed or recommended in this report may be unsuitable for an investor depending on the investor’s specific investment
objectives and financial position. The material in this report is general information intended for recipients who understand the risks of investing in financial
instruments. This report does not take into account whether an investment or course of action and any associated risks are suitable for the recipient. Any
recommendations contained in this report must therefore not be relied upon as investment advice based on the recipient's personal circumstances.
Investors should make their own independent evaluation of the information contained herein, consider their own investment objective, financial situation
and particular needs and seek their own financial, business, legal, tax and other advice regarding the appropriateness of investing in any securities or the
investment strategies discussed or recommended in this report.
This report may contain forward-looking statements which are often but not always identified by the use of words such as “believe”, “estimate”, “intend”
and “expect” and statements that an event or result “may”, “will” or “might” occur or be achieved and other similar expressions. Such forward-looking
statements are based on assumptions made and information currently available to RHB and are subject to known and unknown risks, uncertainties and
other factors which may cause the actual results, performance or achievement to be materially different from any future results, performance or
achievement, expressed or implied by such forward-looking statements. Caution should be taken with respect to such statements and recipients of this
report should not place undue reliance on any such forward-looking statements. RHB expressly disclaims any obligation to update or revise any forward-
looking statements, whether as a result of new information, future events or circumstances after the date of this publication or to reflect the occurrence of
unanticipated events.

17
The use of any website to access this report electronically is done at the recipient’s own risk, and it is the recipient’s sole responsibility to take precautions
to ensure that it is free from viruses or other items of a destructive nature. This report may also provide the addresses of, or contain hyperlinks to,
websites. RHB takes no responsibility for the content contained therein. Such addresses or hyperlinks (including addresses or hyperlinks to RHB own
website material) are provided solely for the recipient’s convenience. The information and the content of the linked site do not in any way form part of this
report. Accessing such website or following such link through the report or RHB website shall be at the recipient’s own risk.
This report may contain information obtained from third parties. Third party content providers do not guarantee the accuracy, completeness, timeliness or
availability of any information and are not responsible for any errors or omissions (negligent or otherwise), regardless of the cause, or for the results
obtained from the use of such content. Third party content providers give no express or implied warranties, including, but not limited to, any warranties of
merchantability or fitness for a particular purpose or use. Third party content providers shall not be liable for any direct, indirect, incidental, exemplary,
compensatory, punitive, special or consequential damages, costs, expenses, legal fees, or losses (including lost income or profits and opportunity costs) in
connection with any use of their content.
The research analysts responsible for the production of this report hereby certifies that the views expressed herein accurately and exclusively reflect his or
her personal views and opinions about any and all of the issuers or securities analysed in this report and were prepared independently and autonomously.
The research analysts that authored this report are precluded by RHB in all circumstances from trading in the securities or other financial instruments
referenced in the report, or from having an interest in the company(ies) that they cover.
RHB and/or its affiliates and/or their directors, officers, associates, connected parties and/or employees, may have, or have had, interests in the securities
or qualified holdings, in subject company(ies) mentioned in this report or any securities related thereto and may from time to time add to or dispose of, or
may be materially interested in, any such securities. Further, RHB and/or its affiliates may have, or have had, business relationships with the subject
company(ies) mentioned in this report and may from time to time seek to provide investment banking or other services to the subject company(ies)
referred to in this research report. As a result, investors should be aware that a conflict of interest may exist.
The contents of this report is strictly confidential and may not be copied, reproduced, published, distributed, transmitted or passed, in whole or in part, to
any other person without the prior express written consent of RHB and/or its affiliates. This report has been delivered to RHB and its affiliates’ clients for
information purposes only and upon the express understanding that such parties will use it only for the purposes set forth above. By electing to view or
accepting a copy of this report, the recipients have agreed that they will not print, copy, videotape, record, hyperlink, download, or otherwise attempt to
reproduce or re-transmit (in any form including hard copy or electronic distribution format) the contents of this report. RHB and/or its affiliates accepts no
liability whatsoever for the actions of third parties in this respect.
The contents of this report are subject to copyright. Please refer to Restrictions on Distribution below for information regarding the distributors of this
report. Recipients must not reproduce or disseminate any content or findings of this report without the express permission of RHB and the distributors.
The securities mentioned in this publication may not be eligible for sale in some states or countries or certain categories of investors. The recipient of this
report should have regard to the laws of the recipient’s place of domicile when contemplating transactions in the securities or other financial instruments
referred to herein. The securities discussed in this report may not have been registered in such jurisdiction. Without prejudice to the foregoing, the
recipient is to note that additional disclaimers, warnings or qualifications may apply based on geographical location of the person or entity receiving this
report.
RESTRICTIONS ON DISTRIBUTION
Malaysia
This report is issued and distributed in Malaysia by RHB Research Institute Sdn Bhd. The views and opinions in this report are our own as of the date
hereof and is subject to change. If the Financial Services and Markets Act of the United Kingdom or the rules of the Financial Conduct Authority apply to a
recipient, our obligations owed to such recipient therein are unaffected. RHB Research Institute Sdn Bhd has no obligation to update its opinion or the
information in this report.
Thailand
This report is issued and distributed in the Kingdom of Thailand by RHB OSK Securities (Thailand) PCL, a licensed securities company that is authorised
by the Ministry of Finance, regulated by the Securities and Exchange Commission of Thailand and is a member of the Stock Exchange of Thailand. The
Thai Institute of Directors Association has disclosed the Corporate Governance Report of Thai Listed Companies made pursuant to the policy of the
Securities and Exchange Commission of Thailand. RHB OSK Securities (Thailand) PCL does not endorse, confirm nor certify the result of the Corporate
Governance Report of Thai Listed Companies.
Indonesia
This report is issued and distributed in Indonesia by PT RHB OSK Securities Indonesia. This research does not constitute an offering document and it
should not be construed as an offer of securities in Indonesia. Any securities offered or sold, directly or indirectly, in Indonesia or to any Indonesian citizen
or corporation (wherever located) or to any Indonesian resident in a manner which constitutes a public offering under Indonesian laws and regulations
must comply with the prevailing Indonesian laws and regulations.
18
Singapore
This report is issued and distributed in Singapore by RHB Research Institute Singapore Pte Ltd and it may only be distributed in Singapore to accredited
investors, expert investors and institutional investors as defined in the Financial Advisers Regulations and the Securities and Futures Act (Chapter 289), as
amended from time to time. By virtue of distribution to these categories of investors, RHB Research Institute Singapore Pte Ltd and its representatives are
not required to comply with Section 36 of the Financial Advisers Act (Chapter 110) (Section 36 relates to disclosure of RHB Research Institute Singapore
Pte Ltd ’s interest and/or its representative's interest in securities). Recipients of this report in Singapore may contact RHB Research Institute Singapore
Pte Ltd in respect of any matter arising from or in connection with the report.
Hong Kong
This report is issued and distributed in Hong Kong by RHB OSK Securities Hong Kong Limited (興業僑豐證券有限公司) (CE No.: ADU220) (“RHBSHK”)
which is licensed in Hong Kong by the Securities and Futures Commission for Type 1 (dealing in securities) and Type 4 (advising on securities) regulated
activities. Any investors wishing to purchase or otherwise deal in the securities covered in this report should contact RHB OSK Securities Hong Kong
Limited.
United States
This report was prepared by RHB and is being distributed solely and directly to “major” U.S. institutional investors as defined under, and pursuant to, the
requirements of Rule 15a-6 under the U.S. Securities and Exchange Act of 1934, as amended (the “Exchange Act”). RHB is not registered as a broker-
dealer in the United States and does not offer brokerage services to U.S. persons. Any order for the purchase or sale of the securities discussed herein
that are listed on Bursa Malaysia Securities Berhad must be placed with and through Auerbach Grayson (“AG”). Any order for the purchase or sale of all
other securities discussed herein must be placed with and through such other registered U.S. broker-dealer as appointed by RHB from time to time as
required by the Exchange Act Rule 15a-6.
This report is confidential and not intended for distribution to, or use by, persons other than the recipient and its employees, agents and advisors, as
applicable.
Additionally, where research is distributed via Electronic Service Provider, the analysts whose names appear in this report are not registered or qualified
as research analysts in the United States and are not associated persons of Auerbach Grayson AG or such other registered U.S. broker-dealer as
appointed by RHB from time to time and therefore may not be subject to any applicable restrictions under Financial Industry Regulatory Authority
(“FINRA”) rules on communications with a subject company, public appearances and personal trading.
Investing in any non-U.S. securities or related financial instruments discussed in this research report may present certain risks. The securities of non-U.S.
issuers may not be registered with, or be subject to the regulations of, the U.S. Securities and Exchange Commission. Information on non-U.S. securities
or related financial instruments may be limited. Foreign companies may not be subject to audit and reporting standards and regulatory requirements
comparable to those in the United States.
The financial instruments discussed in this report may not be suitable for all investors.
Transactions in foreign markets may be subject to regulations that differ from or offer less protection than those in the United States.
OWNERSHIP AND MATERIAL CONFLICTS OF INTEREST
Malaysia
RHB does not have qualified shareholding (1% or more) in the subject company (ies) covered in this report except for:
a) -
RHB and/or its subsidiaries are not liquidity providers or market makers for the subject company (ies) covered in this report except for:
a) -
RHB and/or its subsidiaries have not participated as a syndicate member in share offerings and/or bond issues in securities covered in this report in the
last 12 months except for:
a) -
RHB has not provided investment banking services to the company/companies covered in this report in the last 12 months except for:
a) -
Thailand
RHB OSK Securities (Thailand) PCL and/or its directors, officers, associates, connected parties and/or employees, may have, or have had, interests
and/or commitments in the securities in subject company(ies) mentioned in this report or any securities related thereto. Further, RHB OSK Securities
(Thailand) PCL may have, or have had, business relationships with the subject company(ies) mentioned in this report. As a result, investors should
exercise their own judgment carefully before making any investment decisions.
19
Indonesia
PT RHB OSK Securities Indonesia is not affiliated with the subject company(ies) covered in this report both directly or indirectly as per the definitions of
affiliation above.
Pursuant to the Capital Market Law (Law Number 8 Year 1995) and the supporting regulations thereof, what constitutes as affiliated parties are as follows:
1. Familial relationship due to marriage or blood up to the second degree, both horizontally or vertically;
2. Affiliation between parties to the employees, Directors or Commissioners of the parties concerned;
3. Affiliation between 2 companies whereby one or more member of the Board of Directors or the Commissioners are the same;
4. Affiliation between the Company and the parties, both directly or indirectly, controlling or being controlled by the Company;
5. Affiliation between 2 companies which are controlled, directly or indirectly, by the same party; or
6. Affiliation between the Company and the main Shareholders.
PT RHB OSK Securities Indonesia is not an insider as defined in the Capital Market Law and the information contained in this report is not considered as
insider information prohibited by law.
Insider means:
a. a commissioner, director or employee of an Issuer or Public Company;
b. a substantial shareholder of an Issuer or Public Company;
c. an individual, who because of his position or profession, or because of a business relationship with an Issuer or Public Company, has access to
inside information; and
d. an individual who within the last six months was a Person defined in letters a, b or c, above.
Singapore
RHB Research Institute Singapore Pte Ltd and/or its subsidiaries and/or associated companies do not make a market in any securities covered in this
report, except for:
(a) -
The staff of RHB Research Institute Singapore Pte Ltd and its subsidiaries and/or its associated companies do not serve on any board or trustee positions
of any issuer whose securities are covered in this report, except for:
(a) -
RHB Research Institute Singapore Pte Ltd and/or its subsidiaries and/or its associated companies do not have and have not within the last 12 months had
any corporate finance advisory relationship with the issuer of the securities covered in this report or any other relationship (including a shareholding of 1%
or more in the securities covered in this report) that may create a potential conflict of interest, except for:
(a) -
Hong Kong
RHBSHK or any of its group companies may have financial interests in in relation to an issuer or a new listing applicant (as the case may be) the securities
in respect of which are reviewed in the report, and such interests aggregate to an amount equal to or more than (a) 1% of the subject company’s market
capitalization (in the case of an issuer as defined under paragraph 16 of the Code of Conduct for Persons Licensed by or Registered with the Securities
and Futures Commission (the “Code of Conduct”); and/or (b) an amount equal to or more than 1% of the subject company’s issued share capital, or issued
units, as applicable (in the case of a new listing applicant as defined in the Code of Conduct). Further, the analysts named in this report or their associates
may have financial interests in relation to an issuer or a new listing applicant (as the case may be) in the securities which are reviewed in the report.
RHBSHK or any of its group companies may make a market in the securities covered by this report.
RHBSHK or any of its group companies may have analysts or their associates, individual(s) employed by or associated with RHBSHK or any of its group
companies serving as an officer of the company or any of the companies covered by this report.
RHBSHK or any of its group companies may have received compensation or a mandate for investment banking services to the company or any of the
companies covered by this report within the past 12 months.
Note: The reference to “group companies” above refers to a group company of RHBSHK that carries on a business in Hong Kong in (a) investment
banking; (b) proprietary trading or market making; or (c) agency broking, in relation to securities listed or traded on The Stock Exchange of Hong Kong
Limited.
20
Kuala Lumpur Hong Kong Singapore
RHB Research Institute Sdn Bhd Level 11, Tower One, RHB Centre
Jalan Tun Razak Kuala Lumpur
Malaysia Tel : +(60) 3 9280 2185 Fax : +(60) 3 9284 8693
RHB OSK Securities Hong Kong Ltd.
12th Floor
World-Wide House 19 Des Voeux Road Central, Hong Kong
Tel : +(852) 2525 1118 Fax : +(852) 2810 0908
RHB Research Institute Singapore
Pte Ltd (formerly known as DMG & Partners Research Pte Ltd)
10 Collyer Quay #09-08 Ocean Financial Centre
Singapore 049315 Tel : +(65) 6533 1818 Fax : +(65) 6532 6211
Jakarta Shanghai Phnom Penh
PT RHB OSK Securities Indonesia
Wisma Mulia, 20th Floor Jl. Jend. Gatot Subroto No. 42
Jakarta 12710, Indonesia Tel : +(6221) 2783 0888 Fax : +(6221) 2783 0777
RHB OSK (China) Investment Advisory Co. Ltd.
Suite 4005, CITIC Square 1168 Nanjing West Road
Shanghai 20041 China
Tel : +(8621) 6288 9611 Fax : +(8621) 6288 9633
RHB OSK Indochina Securities Limited
No. 1-3, Street 271 Sangkat Toeuk Thla, Khan Sen Sok
Phnom Penh Cambodia
Tel: +(855) 23 969 161 Fax: +(855) 23 969 171
Bangkok
RHB OSK Securities (Thailand) PCL
10th Floor, Sathorn Square Office Tower 98, North Sathorn Road, Silom
Bangrak, Bangkok 10500 Thailand
Tel: +(66) 2 862 9999 Fax : +(66) 2 862 9799


