

DELAWARE GEOLOGICAL SURVEYREPORT OF INVESTIGATIONS NO. 46
SHALLOW SUBSURFACE TEMPERATURES ATSELECTED LOCATIONS IN DELAWARE
80
.Bl ckW,l;dState or..e70
70 DeptH 1D fee ••1Dw laa4 eurface
65
ra. 60•""IIGI
'" 55
50
415
40
351'1187 year 1988
BY
K. D. WOODRUFF
STATE OF DELAWAREUNIVERSllY OF DELAWARE
NEWARK, DELAWAREOCTOBER 1989
public ACCe.e::O~':YDO NOT R
om 208.from ro

SHALLOW SUBSURFACE TEMPERATURES AT
SELECTED LOCATIONS IN DELAWARE
By
K. D. Woodruff
Delaware Geological Survey
October 1989

CONTENTS
ABSTRACT.
INTRODUCTION.Purpose.Previous Work.Acknowledgments.
BACKGROUND.
SITE CHARACTERISTICS AND INSTRUMENTATION.
RESULTS •New Castle County.Sussex County.
APPLICATION •Heat Pumps •Determination of Thermal Diffusivity •
CONCLUSIONS •
REFERENCES.
APPENDIX.
ILLUSTRATIONS
Figure
Page
1
1122
3
4
467
121213
14
15
16
1 •
2.
3.
4.
5.
Map of Delaware showing location of temperaturemeasuring stations •
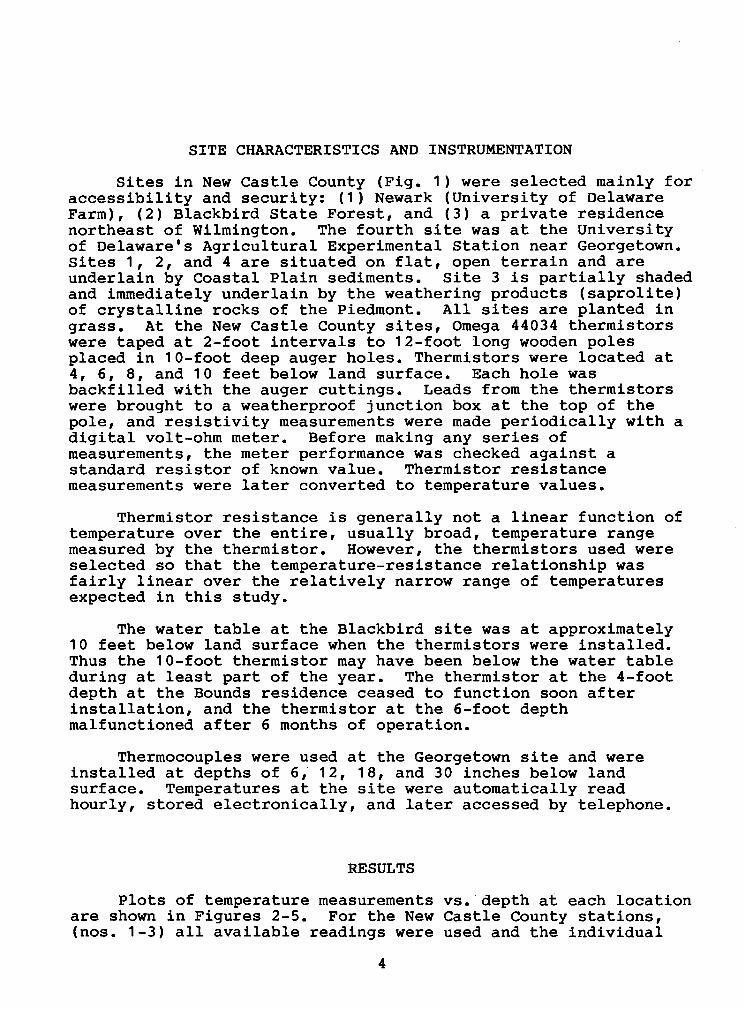
Subsurface temperatures at Newark and BlackbirdState Forest, Delaware •
Subsurface temperatures at Bounds residence(Wilmington area).
Subsurface temperatures at Georgetown:6 and 12 inches below land surface.
Subsurface temperatures at Georgetown:18 and 30 inches below land surface.
5
8
9
10
11

TABLES
Table Page
1 •
2.
Observed ground temperature ranges, projectduration (January 1987-July 1988) ••••••
Monthly average air temperatures (degreesFahrenheit) at Wilmington, project duration.
• • • •
• • • •
6
7

SHALLOW SUBSURFACE TEMPERATURES ATSELECTED LOCATIONS IN DELAWARE
by Kenneth D. Woodruff
ABSTRACT
Subsurface temperatures were measured in instrumentedboreholes for about one and one-half years at depths down to 10feet below land surface at four locations in the State. In NewCastle County, temperatures were measured periodically in thefield about twice a month at three sites, and, in Sussex County,they were automatically recorded every 15 minutes at one site.The depths of interest are generally in the unsaturated zone andare subject to both daily temperature fluctuations and longerseasonal changes. The magnitude and phase of change in relationto surface temperatures depend on the type of material and thedepth. The difference in temperature extremes between 4 and 10feet below land surface may be as much as 8 0
- 10 0 F. At 10 feettemperatures reflect mostly the seasonal trend.
Thermal diffusivity values of the earth materials penetratedwere determined at three of the four locations by measuring theseasonal temperature lag with depth. The temperature differencesat 6 feet and at 10 feet can be significant in terms ofefficiency of horizontal loop heat pump systems.
INTRODUCTION
Purpose
Subsurface temperature data at shallow depths are oftenneeded in the design of ground-source heat pump systems,determination of frost depth, and evaluation of productperformance in buried pipelines.· In Delaware, as in most states,temperature data below the water table are generally availableand often augmented by measurements made in current ground-waterstudies. However, there have been few studies of temperatures atdepths shallower than about 10 feet below land surface which, inmuch of Delaware, is above the water table.
The purpose of this report is to document, at selectedlocations, temperatures that occur over one to two years atdepths of less than 10 feet. The thermal characteristics of thesoil or upper few feet of sediments beneath the study sites werealso determined and the results examined in terms of efficiency
1

of heat pump systems. Systems considered here are those thatcirculate fluids through lengths of pipe buried horizontally afew feet below ground surface. The circulating fluids eitherextract heat from the earth in the heating mode or give up heatin the cooling mode.
Previous Work
Temperatures in wells in the unconfined aquifer just southof Dover were measured by Hodges (1982). His work, directedtoward the use of ground-water source heat pumps, indicates thatwater, for the best efficiency, should come from depths exceeding30 feet below land surface.
Temperatures at greater depths in Delaware and nearby stateswere studied by a number of workers (Costain et al., 1979;Costain and Glover, 1980; Renner and Vaught, 1979; and Woodruff,1979). Most of these and similar studies were stimulated by theU. S. Department of Energy initiative in the late 1970s forassessing the geothermal energy potential of the eastern UnitedStates.
Belknap (1979) measured a yearly integrated temperature in2-meter (6.6 feet) deep auger holes at several locations alongthe east coast, including one location in Delaware. He used aprobe containing a sucrose solution that changes opticalcharacteristics with temperature (Pallman method) and found thatthe ground temperatures approximated the mean annual airtemperature.
Soil temperatures at depths to 30 inches below land surfacehave been measured at Georgetown since January 1986 by theDepartment of Agricultural Engineering at the University ofDelaware. Data from that study supplement those generated in thepresent investigation.
Acknowledgments
Roland S. Bounds allowed installation of a temperaturemeasuring hole on his property near Wilmington. Robert W.Scarborough, Department of Agricultural Engineering, Universityof Delaware, provided soil temperature data from the Universityof Delaware Experimental Station at Georgetown. Monthlytemperature data for New Castle County were provided by theWilmington office of the National Weather Service. This projectwas partially supported by an internal research grant from theDelaware Geological Survey.
2

BACKGROUND
Heat sources from within the earth generally governtemperatures deeper than a few tens of feet below land surface.Temperatures at the shallower depths investigated in this studyare, to varying extents, influenced by atmospheric processes.Diurnal and hourly variations in temperature are generallyattenuated at depths of a few feet, but yearly variations may bedetected to depths of between 50 to 75 feet. Seasonal extremeslonger than days to weeks further complicate the temperatureregime at shallow depths and may be superimposed on the longerwavelength yearly variations.
The propagation of heat through the subsurface depends onthe thermal diffusivity of the earth materials which in turndepends on the material density, water content, and specificheat. Diffusivity and change of temperature with depth arerelated according to the following expression (Olmsted, 1977)
t x - to = ~ \}'IT ( ~x) (1 )
where:
p
x
= thermal diffusivity (cm2/sec)
= period of one temperature cycle (sec)
= time difference in temperature lag from a pointon the surface to base of layer X (sec)
= thickness of layer X (em).
If the thermal diffusivity is known it can be used tocalculate the time lag of the seasonal surface temperaturevariation with depth. A related equation can also be used tocalculate the temperatures at any given depth for a givendiffusivity. The top of layer X is usually the ground surface,and, thus, average surface temperatures are needed to apply theequations. The equations predict that the time lag for downwardpropagation of a heat wave increases linearly with depth and thatthe amplitude of the wave decreases exponentially with depth.There are few values of thermal diffusivity in the literature.Instead, the thermal conductivity (K) is usually determined fromcore samples, and diffusivity can then be calculated from therelationship:
where:
Kpc
p = bulk density
c = specific heat.
3
SITE CHARACTERISTICS AND INSTRUMENTATION
Sites in New Castle County (Fig. 1) were selected mainly foraccessibility and security: (1) Newark (University of DelawareFarm), (2) Blackbird State Forest, and (3) a private residencenortheast of Wilmington. The fourth site was at the Universityof Delaware's Agricultural Experimental Station near Georgetown.Sites 1, 2, and 4 are situated on flat, open terrain and areunderlain by Coastal Plain sediments. Site 3 is partially shadedand immediately underlain by the weathering products (saprolite)of crystalline rocks of the Piedmont. All sites are planted ingrass. At the New Castle County sites, Omega 44034 thermistorswere taped at 2-foot intervals to 12-foot long wooden polesplaced in 10-foot deep auger holes. Thermistors were located at4, 6, 8, and 10 feet below land surface. Each hole wasbackfilled with the auger cuttings. Leads from the thermistorswere brought to a weatherproof junction box at the top of thepole, and resistivity measurements were made periodically with adigital volt-ohm meter. Before making any series ofmeasurements, the meter performance was checked against astandard resistor of known value. Thermistor resistancemeasurements were later converted to temperature values.
Thermistor resistance is generally not a linear function oftemperature over the entire, usually broad, temperature rangemeasured by the thermistor. However, the thermistors used wereselected so that the temperature-resistance relationship wasfairly linear over the relatively narrow range of temperaturesexpected in this study.
The water table at the Blackbird site was at approximately10 feet below land surface when the thermistors were installed.Thus the 10-foot thermistor may have been below the water tableduring at least part of the year. The thermistor at the 4-footdepth at the Bounds residence ceased to function soon afterinstallation, and the thermistor at the 6-foot depthmalfunctioned after 6 months of operation.
Thermocouples were used at the Georgetown site and wereinstalled at depths of 6,· 12, 18, and 30 inches below landsurface. Temperatures at the site were automatically readhourly, stored electronically, and later accessed by telephone.
RESULTS
Plots of temperature measurements vs. depth at each locationare shown in Figures 2-5. For the New Castle County stations,(nos. 1-3) all available readings were used and the individual
4

PENNSYLVANIA
NEW JERSEY
EXPLANATION
emtalllne rocks(Piedmont Promce)unconsolidated rocks<Atlantic Coastal Plain)
temperature sta1ion
o
••Georgetown(4)
0; Dover • 0 10 20 MILES,i
i
0 10 20 30 KILOMETERS~
nso NDELAWARE
+390
\('-BAY
-....),J Milford
J--_/
MARYLAND
Figure 1. Map of Delaware showing location of temperaturemeasuring stations.
5

measurements are given in the Appendix. For the Georgetownstation, noon readings every fifth day of the month were used;the hourly measurements are available from the DelawareGeological Surveyor from the Department of AgriculturalEngineering at the University of Delaware.
New Castle County
The greatest range of temperatures occurred at theshallowest depth (Table 1) with progressive dampening of shortterm variations with increasing depth. At 10 feet, temperaturesreflect almost entirely the average seasonal trend of airtemperatures as measured by the National Weather Service at the
Table 1. Observed ground temperature ranges, project duration(January 1987 - July 1988)
Location and Depth Observed Temp. Range of tJ.°F
Newark 4' 38.5 - 72.2 33.76 ' 39.9 - 68.5 28.68' 43.7 - 66.2 22.5
10' 45.2 - 63.9 18.7
Blackbird 4 ' 39.3 - 70.5 31.26 ' 42.4 - 68.0 25.68' 45.7 - 66.1 10.4
10' 47.4 - 63.6 15.2
Wilmington 6' (1 ) 33.7(1) - 64.9 31 .2(Bounds)
(2)8' 41.8 - 63.8 22.010' 46.0 - 64.9 18.9
Georgetown 0.5' 33.3 - 87.7 54.41 .0' 35.4 - 85.5 50.11 .5' 36.5 - 81.6 45.12.5' 39.7 - 79.9 40.2
(1)(2)
record incompleteprobably not seasonal low
6
Greater Wilmington Airport (Table 2). Some of the minordeviations in the temperature profiles for New Castle County areprobably the result of sampling errors; yearly extremes may nothave been sampled. Figures 2 and 3 show that temperatureextremes at the 10-foot depth lagged behind those at the 2-footdepth by about 1! to 2 months. This lag is a function of thethermal diffusivity of the sediments. Freezing temperatures werenot recorded at any of the sites even though the Wilmingtonaverage monthly temperature for January and February 1987 wasjust below freezing and for January 1988 it was 27.4°F (see Table2). There was only occasional snow cover in 1987 and almost nonein 1988.
Table 2. Monthly average air temperatures (degrees Fahrenheit)at Wilmington, project duration.
(January 1987 - July 1988)
JanuaryFebruaryMarchAprilMayJuneJulyAugustSeptemberOctoberNovemberDecember
1987
31 .431 .944.652.363.173.579.174.368.351 .747.438.6
1988
27.434.844.250.862.971.679.4
Source: National Weather Service
Sussex County
The Georgetown data (Figs. 4-5) show the short-termvariations in temperature superimposed on the seasonal trends.These data reflect both the greater sampling frequency and theshallower depths measured as compared with sites 1-3.Temperature changes are transferred rapidly downward, at least inthe top 2 to 3 feet of material. The time lag of dailyvariations was usually negligible between 6 inches and 12 inches,and a matter of hours between 6 inches and 30 inches. Freezingtemperatures were not recorded as shallow as 6 inches even thoughthere were several days temperatures did not rise above freezing.surface temperatures below O°F were recorded for a short time on
7

BO
Newark (University Farm)
75
Depths in feet below land Aurface
70
65
~ 600
l:loEll\I.. 55
50
45
40
3519B7 year 19BB
BO
Blackbird State Forest
75
70 Depths in feet below land Aurface
65
~ 600
/l:loEll\I t/.. 55
~/50
45
40
351987 year 1ge8
Figure 2. Subsurface temperatures at Newark and Blackbird State Forest, Delaware.
8

BOi-I
Dep
ths
infe
et
bel
ow
lan
dsu
rface
75
-
70
I- I- I-6
5-I
~.
j.~
~\j/
l-.'
de.t
h..
.,ti
on-/;
'\
/
~60]
.~r
_1
£I((
"j
l-.
~j/
~ljI
\04
J55
l-SO
-I
j:.l\
\~/
I-4
5-I
"",
\/8
'I-
\40
-I
"'-i
i,y-..
I
I1
9B
B
..I
,3
5I
ii
I
19
87
yea
r
Fig
ure
3.
Su
bsu
rfac
ete
mp
erat
ure
sat
Bou
nds
resi
den
ce
(Wil
min
gton
are
a).

90 r---------------------------------.....
85
80
75
70
65
~ 60QI~
55
l50
A5
AO
19B7
6"
year 19BB
85,------------T------------------------,.
year
Figure 4. Subsurface temperatures at Georgetown, Delaware: 6 and 12 inchesbelow land surface.
80
75
70
65t>..o
PoII 60QI~
55
50
45
40
1987
12"
19BB
10

a5
ao
75
70
65Il<o•~ 60IIIGIu
55
!l0
45
40
351987 1988
year
a5
ao
75
70
65
Il<o•~ 60BGIu
55
!l0
45
40
351987 year 1988
Figure 5. Subsurface temperatures at Georgetown, Delaware: 18 and 30 inchesbelow land surface.
11

the coldest day during the project period. Again, snow cover waspractically nonexistent throughout most of the project periodexcept for a few days in March 1988.
APPLICATION
Heat Pumps
Horizontal, closed loop heat pump systems are usually lessefficient than vertical systems. Vertical systems are installedbelow the water table in conventional wells but horizontal loopsare placed at a nominal depth of about 6 feet below land surfaceand thus subject to considerable temperature fluctuations.However, the temperature differential between 6 feet and 10 feetmay be significant in terms of the efficiency of the system.Figure 2 and Table 1 indicate that a reasonable difference mightbe about 5°F in the Coastal Plain for the New Castle County sitesmeasured but is probably higher in the Piedmont. The differencein BTU content of heat extracted at various depths can beevaluated by:
where:
BTU/min = Q x 8.4 x ~T (2)
Q = flow rate of circulating fluid, gallons per minute
~T = difference between source temperature and outsideambient temperature (OF).
For the Newark site at a depth of 6 feet the coldesttemperature recorded in this study was about 40°F. For a systemflow rate of 12 gallons per minute (gpm) and a design temperatureof 30°F, ~T = (40°-30°) = 10° and (2) becomes
BTU/min = 12 x 8.4 x 10 = 1008
or
BTU/day = 1008 x 1440 = 1.2 x 10⁶•
At a depth of 10 feet ~T = (45°_30°) = 15° and (2) becomes
BTU/min = 12 x 8.4 x 15 = 1512.
or
BTU/day = 1512 x 1440 = 2.2 x 10⁶•
12

Some idea of the value of this difference might be gained byassuming the BTU cost is the same as for fuel oil, or at 1988prices, about $7.50 for 1 million BTUs (about 75 cents/gallon).In the example above, the difference between the 6-foot and 10foot depth is about 800,000 BTUs per day or $6.00 at what areprobably extreme temperature conditions.
Figure 2, in particular, shows that the temperatures at 6feet recovered rapidly during the last half of March and werehigher than temperatures at 8 and 10 feet by the time cooling wascalled for, about the last of May. Thus the most cost effectivehorizontal systems are those installed as deep as possible.
The temperature difference between 6 and 10 feet appears tobe a minimum of about 5°F from the last half of December throughthe beginning of March in the Newark area and from the beginningof January through the beginning of March at the Blackbird site.During the summer months the same order of magnitude prevails.Note that most heat pumps generally are not designed to operatebelow a source temperature of about 40°F.
Determination of Thermal Diffusivity
Few, if any, thermal diffusivity values are available forshallow earth materials in Delaware. Therefore, diffusivity wasdetermined in this study by using the depth interval between twothermistors and solving equation (1) for diffusivity. The period(P) was taken as 1 year, the time for a complete cycle of heatingand cooling. Applying this procedure to the University farm sitein Newark, for example, yields:
(1 )
x = difference in depth between 4-foot and 10-footmeasuring points = 6 ft = 183 cm )
t x - to = 55 days (time lag from observations)
= 4.75 x 10⁶ sec
P = 1 year = 3.15 x 10⁷ sec
therefore:
4.75 x 106 = 183-2-
solving for diffusivity:
13
solving for diffusivity:
ax = 3.7 x 10⁻³ cm/sec or approx. 0.004 cm2/sec.
This is a relatively low value and can be indicative of asandy clay with 15% moisture content, according to a compilationof values by Lovering and Goode (1963). The sediment lithologyin which the thermistors were installed is best classified as asilty to clayey sand and thus is in reasonable agreement with theLovering and Goode data.
A similar calculation for the Blackbird sije bftween 4 and 8feet gave a comparable ~alue of about 2.7 x 10- cm /sec(approximately 0.003 cm /sec) (the highest temperature for the10-foot depth may not have been recorded).
Data from the Georgetown site !or 1moothed curves gavedi~fusivity values of about 1 x 10- cm /sec (approximately 0.01cm /sec) between various depth intervals and for both high andlow temperature extremes. These values appear high for CoastalPlain soils but may be very site specific; therefore, the timelag of the surface temperature with depth is much less than atthe other sites.
CONCLUSIONS
Minimum subsurface temperatures in northern Delawareaverage 8 0 to 10 0 F higher at 10 feet below land surface than at 4feet below land surface. Maximum temperatures at 10 feet appearto be lower than maximum surface temperature by about the sameamount. Short-term temperature fluctuations are generallydampened below about 10 feet; only seasonal variations areapparent at this depth. The time lag between temperatureextremes at 4 feet and 10 feet is on the order of 6 to 8 weeks.In some areas, temperature lags down to depths of at least 2.5feet (30 inches) may be very short (hours to 1 or 2 days).However, particularly in southern Delaware, freezing temperaturesin the subsurface, even as shallow as 2 feet, are probably rare.
Shallow, horizontal loop, heat pump systems are generallynot as efficient as vertical systems. However the efficiency ofboth the heating and cooling functions of the horizontal systemcould be improved by installing the loops as deep as possible.
14

REFERENCES
Belknap, D. F., 1979, Application of amino acid geochronology tostratigraphy of late Cenozoic marine units of the AtlanticCoastal Plain: unpublished Ph.D. dissertation, University ofDelaware, 532 p.
Costain, J. K., Glover, L., and Sinha, A. K., 1979, Evaluationand targeting of geothermal energy resources in thesoutheastern United States: Virginia Polytechnic Instituteand State University Progress Report 78ET-27001, July 1,1979 - September 30, 1979, for U. S. Dept. of Energy.
Costain, J. K., and Glover, L., 1980, Evaluation and targeting ofgeothermal energy resources in the southeastern UnitedStates: VPI and SU Progress Report 78ET-27001, October 1,1979 - March 31, 1980, for U. S. Department of Energy.
Hodges, A. L., 1982, Ground-water temperature of the WyomingQuadrangle in central Delaware, with application to groundwater source heat pumps: U. S. Geological Survey WaterResources Investigations Report 82-53, 29 p.
Lovering, T. S., and Goode, H. D., 1963, Measuring geothermalgradients in drill holes less than 60 feet deep, East TinticDistrict, Utah: U. S. Geological Survey Bulletin 1172, 48 p.
Olmsted, F. H., 1977, Use of temperature surveys at a depth of 1meter in geothermal exploration in Nevada: U. S. GeologicalSurvey Professional Paper 1044-B, 25 p.
Renner, J. L., and Vaught, T. L., 1979, Geothermal resources ofthe eastern United States: U. S. Department of EnergyContract Report DOE/NVO/1558-7, 59 p.
Woodruff, K. D., 1979, Preliminary targeting of geothermalresources in Delaware: U. S. Department of Energy ProgressReport July 15, 1978 - July 14, 1979, Contract ET-78-5-024715, 31 p.
15
APPENDIX
Measured Temperatures (Degrees Fahrenheit)for New Castle County Sites
16

BOUN
DSN
EWA
RKBL
ACK
BIRD
STA
TEFO
RES
T
date
dep
th!t
ml
de»
thd
enth
19
87
.§..!
.jl!
..l.Q
..!1
98
7J!
...§
!...
J.!.
.1.Q
!.!.!
..~
~.1Q
.!..
4/4
48
.34
7.5
47
.42
/17
38
.54
1.9
45
.14
7.9
4/1
24
8.7
48
.04
7.9
2/2
43
9.3
43
.24
6.7
50
.8
4/2
54
9.3
49
.24
9.7
3/2
37
.64
0.8
43
.94
6.7
5/2
49
.85
0.0
50
.63
/19
41
.04
2.2
43
.74
5.7
42
.14
3.6
46
.04
7.9
5/9
50
.35
0.7
51
.33
/27
44
.04
4.3
46
.04
7.4
6/7
51
.45
4.1
55
.84
/14
6.3
44
.94
4.8
45
.8
7/5
59
.55
7.6
59
.54
/13
47
.34
6.9
47
.64
8.5
7/1
14
9.9
58
.46
0.3
4/1
44
7.1
46
.54
6.2
46
.6
8/2
46
.86
2.3
64
.15
/18
55
.85
2.7
50
.54
9.5
9/5
44
.86
3.2
64
.55
/21
55
.75
3.2
51
.35
0.8
9/2
74
1.6
63
.86
4.9
5/2
95
8.1
54
.95
2.4
50
.8
10
/26
39
.06
2.0
62
.06
/29
67
.56
2.7
58
.65
5.5
11
/19
36
.95
9.2
58
.27
/26
7.7
63
.25
9.2
56
.1
12
/53
5.3
57
.15
5.9
7/1
06
6.8
62
.75
8.3
56
.1
12
/19
33
.75
5.1
53
.67
/29
72
.26
7.4
63
.45
9.9
69
.76
5.4
60
.85
8.1
......
19
88
8/4
72
.46
8.0
64
.26
0.7
1-...1
1/3
13
5.5
41
.84
6.0
8/5
70
.26
6.1
61
.55
8.8
4/2
46
.84
6.7
8/1
27
0.5
66
.76
2.1
59
.5
8/6
60
.56
3.1
8/2
76
9.2
66
.96
3.1
63
.69
/17
0.4
68
.56
6.2
63
.49
/10
69
.46
7.5
65
.96
3.6
9/2
26
9.7
68
.06
6.1
63
.96
7.9
68
.06
6.1
61
.71
0/9
64
.26
5.2
65
.36
3.8
10
/21
60
.36
2.0
63
.36
3.1
59
.16
0.4
60
.56
0.3
11
/45
6.7
59
.06
1.0
61
.55
6.0
57
.75
8.7
59
.11
1/2
35
2.5
55
.45
8.1
59
.21
2/3
04
5.8
48
.55
2.1
54
.24
6.4
48
.95
1.7
53
.91
98
81
/11
41
.64
5.7
50
.25
2.6
1/1
23
7.4
45
.55
0.0
52
.51
/28
39
.44
2.9
47
.15
0.4
1/2
93
8.9
42
.34
6.9
49
.93
9.3
42
.84
6.9
50
.22
/53
9.0
41
.64
6.0
48
.82
/18
37
.84
0.2
44
.44
7.1
2/2
43
8.3
39
.94
3.7
46
.34
0.6
42
.24
5.7
48
.33
/11
40
.84
0.7
43
.54
5.2
3/2
14
1.8
41
.94
5.7
45
.24
3.3
44
.84
6.0
47
.64
/20
48
.34
6.5
47
.24
6.7
48
.14
7.4
47
.94
8.5
5/2
55
8.2
52
.95
1.9
49
.85
5.9
51
.75
1.1
50
.36
/27
66
.25
8.7
57
.55
4.3
62
.55
6.9
55
.25
3.6
7/2
76
8.6
61
.65
9.5
56
.8


