

Department of Public Safety Division of Fire and Life Safety
2012


Alaska State Fire Marshal
Fire In Alaska - 2012
Kelly Nicolello
State Fire Marshal
Department of Public Safety
Division of Fire and Life Safety
5700 East Tudor Road
Anchorage, Alaska 99507-1225
Phone: 907-269-5491
Web site: www.burny.alaska.gov

Table of Contents
Division of Fire and Life Safety Organizational Chart ............................................................................. 4
Letter of Introduction from State Fire Marshal, Kelly Nicolello ........................................................ 5 – 6
Director’s Office ..................................................................................................................................... 7 - 8
Life Safety Inspection Bureau ................................................................................................................... 9
Fire Inspections ......................................................................................................................................... 9
Fire Investigations ................................................................................................................................... 10
Field Offices ..................................................................................................................................... 11 - 14
Plan Review Bureau .................................................................................................................................. 15
Plan Reviews ........................................................................................................................................... 16
Construction Inspections ................................................................................................................... 17- 18
Training and Education Bureau ............................................................................................................... 19
Office of Rural Protection ........................................................................................................................ 19
Public Education...................................................................................................................................... 20
Field Offices ............................................................................................................................................ 21
Fire Department Registration................................................................................................................... 22
Flashing Blue Lights ................................................................................................................................. 23
Alaska National Fire Incident Reporting System (ANFIRS) .................................................................. 24
Fire Picture at a Glance ................................................................................................................... 25 - 26
Non-Fire Incidents ................................................................................................................................... 27
Alaska’s 2012 Fires ................................................................................................................................. 28
Statewide Fire Dollar Loss ...................................................................................................................... 29
Mobile Property Fires .............................................................................................................................. 30
Structure Fires ......................................................................................................................................... 31
Residential Structure Fires ...................................................................................................................... 32
Occupancy and Leading Causes ............................................................................................................ 32
Heat Source and Area of Origin .............................................................................................................. 33
Smoke Alarm Presence and Performance .............................................................................................. 34
When Fires Occur ................................................................................................................................... 35
Intentionally Set Fires .................................................................................................................................. 36
Juveniles Involved with Fire ........................................................................................................................ 37
Fire Injuries and Fatalities ........................................................................................................................ 38
Firefighter Injuries.................................................................................................................................... 38
Civilian Fire Injuries ................................................................................................................................. 39
Civilian Fire Deaths .......................................................................................................................... 40 - 41
Fire Fatality Rates ................................................................................................................................... 42
Burn Injuries ..................................................................................................................................... 43 - 45
ANFIRS Participants ................................................................................................................................. 46
Fire Department Participation .......................................................................................................... 47 - 60

Kelly Nicolello
State Fire Marshal/
Director
Diana Parks
Plan Review
Building Plans Examiner II
John Bond
Life Safety Inspection
Deputy Fire Marshal II
Victoria Clyde
Fire Training
Specialist
Fairbanks
Mahlon Greene
Public Education
Coordinator
Palmer
Todd Kollar
Fire Training
Specialist
Juneau
Mary Wall
Office Assistant II
Anchorage
Lisa Shield
Office Assistant I
Palmer
Jillian Roberts
Building
Plans Examiner I
Anchorage
Tim Fisher
Building
Plans Examiner I
Anchorage
Jessica Faulkner
Office Assistant II
Anchorage
Susan Tullo
Office Assistant II
Fairbanks
David Aden
Building
Plans Examiner I
Fairbanks
Vacant
Deputy Fire
Marshal I
Anchorage
Nathan Rocheleau
Deputy Fire
Marshal I
Anchorage
Chris Grooms
Deputy Fire
Marshal I
Fairbanks
Amy Noket
Office Assistant II
Anchorage
Judith Miller
Office Assistant II
Juneau
Robert Plumb
Deputy Fire
Marshal I
Juneau
Vacant
Deputy Fire
Marshal I
Anchorage
State of Alaska
DIVISION OF FIRE AND LIFE SAFETY
Organizational Chart (2013)
John Cawthon
TAPS SpecialistDonna Wills
Director’s Secretary
Jan Mitchell
Training & Education
Fire Training Administrator
Steven Schreck
Fire Training
Specialist
Palmer
Dane Waisanen
Deputy Fire
Marshal I
Anchorage
Marie Collins
Statistical Tech. II
Lloyd Nakano
Assistant State Fire
Marshal
Jarrett Zuspan
Building
Plans Examiner I
Anchorage
Page 4

Fire In Alaska 2012
It is my honor to present the 2012 edition of “Fire in Alaska”, the annual report of statistical reporting by fire departments throughout the State of Alaska and a report of the Department of Public Safety, Division of Fire and Life Safety.
The information results in this report are based on strategic actions taken by the Division in calendar year 2012 and fiscal year 2012/2013 as reported back to the Division of Fire and Life Safety from 169 emergency response organizations throughout Alaska participating in Alaska National Fire Information Reporting System (ANFIRS).
It was not a good year for the reduction of civilian fire deaths. Fire deaths increased from calendar year 2011 by 52% to 23. The fire fatality rate was zero for the very young, adolescents and those in their late 30’s. We attribute that to public education through the use of smart phone applications, social media, and using every opportunity to take advantage of speaking to youth groups. 20 of the unintended fire deaths occurred in those age 40 and older, with half who were 60 years or older. 57% of all fire fatalities had alcohol or drugs as a contributing factor to the fire cause or death. Smoke alarms were not installed in 43% of the residences where fire fatalities occurred. The Division will continue to focus on high risk groups. We have done well with the young but will have to improve ways to reach elder groups and make it relative to their culture. I continue to be encouraged to say that no fire deaths have occurred in any structures that are part of a Fire Prevention Inspection Program.
Letter from Alaska State Fire Marshal, Kelly Nicolello
Page 5
Fire In Alaska 2012
Dollar property loss values continue to change due to fluctuation in state and national economy changes. However, we can capture the realities of property loss by examining the number and type of structures involved in fire. Property loss increased from 2011 by 18% to just above 55 million dollars; of that amount, 31.6 million dollars or 64% of all property loss was contributed by residential fires.
The persistence of documenting intentional fires is ever more important to substantiate and eradicate this issue. There was a significant increase in the number of reported intentional fires. We are still analyzing if the increase is due to diligent reporting, an increase of fires or both. Regardless, I can report that of 2,644 reported fires 6% or 165 of all structural fires were reported as intentionally set. Intentional fires accounted for 26% or 12.8 million dollars of all structure property loss. Our staff is transitioning to facilitate full case management of these types of fires so we can further drive down the number of intentionally set fires in Alaska.
I’d like to thank the fire departments and agencies throughout the state for timely reporting to ANFIRS. This information is critical in determining the strategies and tactics of our efforts to assist your department’s efforts and develop educational and training priorities throughout the state. Speaking of training, I hope most of the fire departments throughout the state have had a chance to meet and work with Jan Mitchell, the newest member of the Director’s management team. She is the Training and Education Bureau Supervisor and has been reaching out to understand the needs and wishes of your programs to improve the services we provide.
Thank you for your dedication to community service and support of our Division of Fire and Life Safety. Together we will partner to reduce the negative effects of fire in our communities. If you have any questions feel free to contact me or Marie Collins, our Statistical Technician, at 269-5625. For more detailed information comparing prior years go to our website at www.burny.alaska.gov.
Letter from Alaska State Fire Marshal, Kelly Nicolello
Page 6

Fire In Alaska 2012
Director’s Office
The staff of the Director’s Office is comprised of Alaska’s State Fire Marshal, Assistant State Fire Marshal, Statistical Technician and their Executive Secretary. These individuals are responsible for establishing the vision, direction, operations and policies to accomplish the Division of Fire and Life Safety’s mission, “To prevent the loss of life and property from fire and explosion”. They work to achieve this mission by providing funding mechanisms, budgetary priorities and bureau work production. They advise, educate and collaborate with legislative and executive contacts on fire and life safety issues, public policy and safety throughout Alaska.
Lloyd Nakano, Assistant State Fire Marshal
The Director’s office achieved significant accomplishments this year by; establishing a fire and life safety inspection program for unregulated oil and gas pipeline facilities and refineries; developing and implementing the new electronic fire inspection program with hand held computers; and streamlining the procedures of the fire protection system, extinguisher, fireworks (display, retail and wholesale) and pyrotechnic operator permit programs.
The Director’s office saw continued success with: continuing the Fire and Building Officials Forum which encourages networking and information sharing between fire and building safety officials; modifying modern and up-to-date building, fire and mechanical codes to meet the needs of Alaska; developing Public Education programs that provide meaningful and relevant fire safety information practices to targeted cultures throughout the state; and providing training classes, systems and equipment for maintaining the professionalism of the fire community in Alaska.
Donna Wills, Executive Director’s Secretary
We continue to upgrade our web page and have seen success with its use by the fire service, regulated community, general public and our staff. If you haven’t checked it out go to http://dps.alaska.gov/Fire/
Kelly Nicolello, State Fire Marshal
Page 7

Fire In Alaska 2012
Director’s Office
Working within the Director’s Office and directly for the Director is John Cawthon the Trans-Alaska Pipeline System (TAPS) Fire Safety Specialist. He provides fire protection education, engineering, inspection and investigative oversight of the Trans-Alaska oil pipeline facilities, regulated and unregulated oil and gas pipeline facilities and refineries. He is the liaison between the Director, Joint Pipeline Office and numerous state and federal agencies.
John Cawthon, TAPS Fire Safety Specialist
Marie Collins, Statistical Technician, II
Due to the unique nature of the Statistical
Technician position; which is responsible for the
Alaska National Fire Incident Reporting System
(ANFIRS), fire department registration and
flashing blue light programs, it was recently
moved from the Training and Education Bureau
to the Director’s Office.
Page 8
Fire In Alaska 2012
Life Safety Inspection Bureau (LSIB) currently has four Deputy Fire Marshal I’s, Chris Grooms, Nathan Rocheleau, Dane Waisanen and Robert (Bob) Plumb. They conduct fire inspections, fire investigations, plan reviews and provide training throughout the State. On January 21, 2013, Deputy Fire Marshal II, John Bond was promoted to Supervisor for LSIB. There are two support staff; Amy Noket and Judith (Judy) Miller.
FIRE INSPECTIONS
Building inspections are a customer-oriented, multi-faceted unit with statutory authority to conduct fire safety
inspections in commercial properties and applicable regulated industries throughout the state. These
occupancies include, but are not limited to; restaurants, bars, churches, schools, daycare facilities, prisons, jails,
hospitals, nursing homes, assisted living homes, apartments and hotels with more than 15 rooms and high
impact facilities including major fish processing plants.
Prioritizing of building inspections continues to be based upon those occupancies that are at greatest risk of fire-
related injuries, fatalities, property loss and high community impact. The Division is striving to increase
owner/occupancy awareness of hazards so a greater number of buildings will be found in compliance with legal
standards at time of inspection. Each deficiency needing correction is issued on an Order to Correct.
Deficiencies must be followed up to completion. In FY 2013, there were 4,376 follow up communication actions
in support of the 1,876 fire inspections that were not in compliance. This is the first year that the Division
completed fire inspections in all oil and gas processing facilities for regulated and unregulated pipelines
throughout the state. The Divisions goal is to have, at the very least, 30% of all buildings inspected meet the
required compliance. In FY 2013, the Division exceeded this at 39%.
Life Safety Inspection Bureau
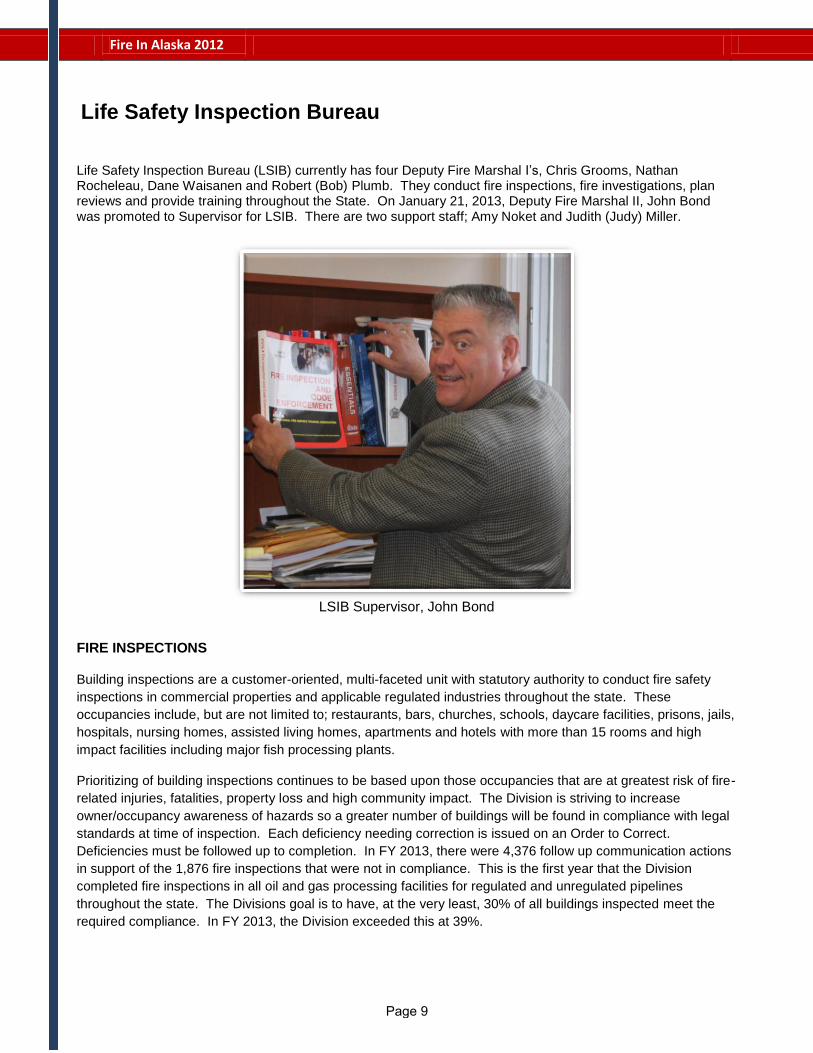
LSIB Supervisor, John Bond
Page 9

Fire In Alaska 2012
0
500
1,000
1,500
2,000
2,500
3,000
3,500
FY 2009 FY 2010 FY 2011 FY 2012 FY 2013
38% 24% 23% 25% 39%
Total Inspections Buildings in Compliance YTD % in Compliance
FIRE INVESTIGATIONS
Fires that will normally be investigated by the Division of Fire and Life Safety are; fires that result in a fatality or serious injuries, that involve a substantial loss of property ($500,000 or more), appear to be intentionally caused as part of an insurance fraud or other criminal activity, have a significant public impact, indicate trends or a serious consumer safety problem and any fire that involves Department of Public Safety facilities or equipment.
Alaska Administrative Code 13AAC52.030 (b) (4): Requires all registered fire departments within the state to investigate all fires within their service area for origin and cause and report this information to the State Fire Marshal's Office.
Our Deputies are highly trained and qualified Fire Investigators. They regularly complete investigative processing of fires scenes, determine the origins and causes of fires and explosions, conduct latent investigations, execute searches, complete seizures and provide expert testimony in judicial proceedings. They are dedicated to developing skills, knowledge and service of sworn members. Training programs are provided to our DFM’s to enhance investigative abilities and high-liability law enforcement training is provided to ensure safety in these interactions.
Life Safety Inspection Bureau
Percentage of Buildings in Compliance with Legal Standards FY 2009 - 2013
Page 10

Fire In Alaska 2012
FIELD OFFICES
Life Safety Inspection Bureau has three offices. They are located in Fairbanks, Anchorage and Juneau.
Northern Office (aka Northern Region) -
DFM I, Chris Grooms, is stationed in the Northern Region located at 1979 Peger Road in Fairbanks. Chris
conducts fire and life safety surveys for the Northern Region of the state. Last year, Chris conducted building
inspections and investigated 9 fires.
Chris Grooms – Fairbanks
Life Safety Inspection Bureau
The Northern region services approximately 101 cities, towns and villages.
Page 11

Fire In Alaska 2012
Anchorage Office (aka Southcentral Region) –
Our Anchorage office is home to four DFM I’s; Nathan Rocheleau and Dane Waisanen (two positions are
currently vacant). The office is located at 5700 East Tudor Road in Anchorage. The Southcentral office
conducted approximately 1616 fire and life safety inspections last year and investigated 32 of the 46 calls for fire
investigations.
Life Safety Inspection Bureau
Deputy Fire Marshals Nathan Rocheleau (left) and Dane Waisanen (right) are working on our new hand held
device called “Mobile Solutions”. This unit will allow mobile data to be taken into the field for input and
extraction needs of fire and life safety inspections. Mobile Solutions device will increase data capturing and
recording vs. our current system of pen and carbon paper. Mobile Solutions is slated to roll out late this fall.
The Southcentral region services approximately 186 cities, towns and villages.
Page 12

Fire In Alaska 2012
Juneau Office (aka Southeast Region) -
DFM I, Bob Plumb, is stationed in the Southeast region. The Southeast office is located at 2760 Sherwood
Lane in Juneau. Bob conducted approximately 312 fire and life safety inspections last year. Bob also provides
plan review services and completed approximately 100 reviews last year.
Life Safety Inspection Bureau
DFM, Bob Plumb (above) is working through fire debris to locate the fire of origin.
The Southeast region services approximately 20 cities, towns and villages.
Page 13

Fire In Alaska 2012
Our support staff, Amy Noket and Judy Miller, keep the wheels turning for us. Without them, we would truly be
lost.
Life Safety Inspection Bureau
Amy Noket, Anchorage Judy Miller, Juneau
Last year Amy issued 381 fire extinguisher permits which included exams, 212 fire systems permits and 86
firework permits. Amy also provides support services for the deputy fire marshals with travel, finance, and
several other data entry programs.
Lloyd Nakano is presenting Judy Miller with the Life Safety Inspections Bureau Employee of the Year award.
Judy provides support, not only for the Fire and Life Safety Bureau, but for the Training and Education Bureau and Plan Review Bureau as well. She has stepped up and took on an extra load during personnel shortages. Judy is a credit to the Division.
Page 14
Fire In Alaska 2012
The objective of the Plan Review Bureau (PRB) is to ensure the public’s safety by identifying building and fire code violations during the design phase of construction. This process increases public safety and reduces overall construction cost and field inspection time.
To best serve the needs of the State, the Bureau has offices in Anchorage, Fairbanks and Juneau. Each office has at least one Plans Examiner or Deputy Fire Marshal and an Office Assistant, who is responsible for a separate portion of Alaska. The Anchorage headquarters consists of three Plans Examiner’s, an Office Assistant and the Bureau Supervisor.
As of this year, we are pleased to welcome Jillian Roberts to PRB. She has a strong background in firefighting and experience in fire system inspections. Her knowledge along with her positive attitude and work ethic should make her a great addition to our team.
Plan Review Bureau
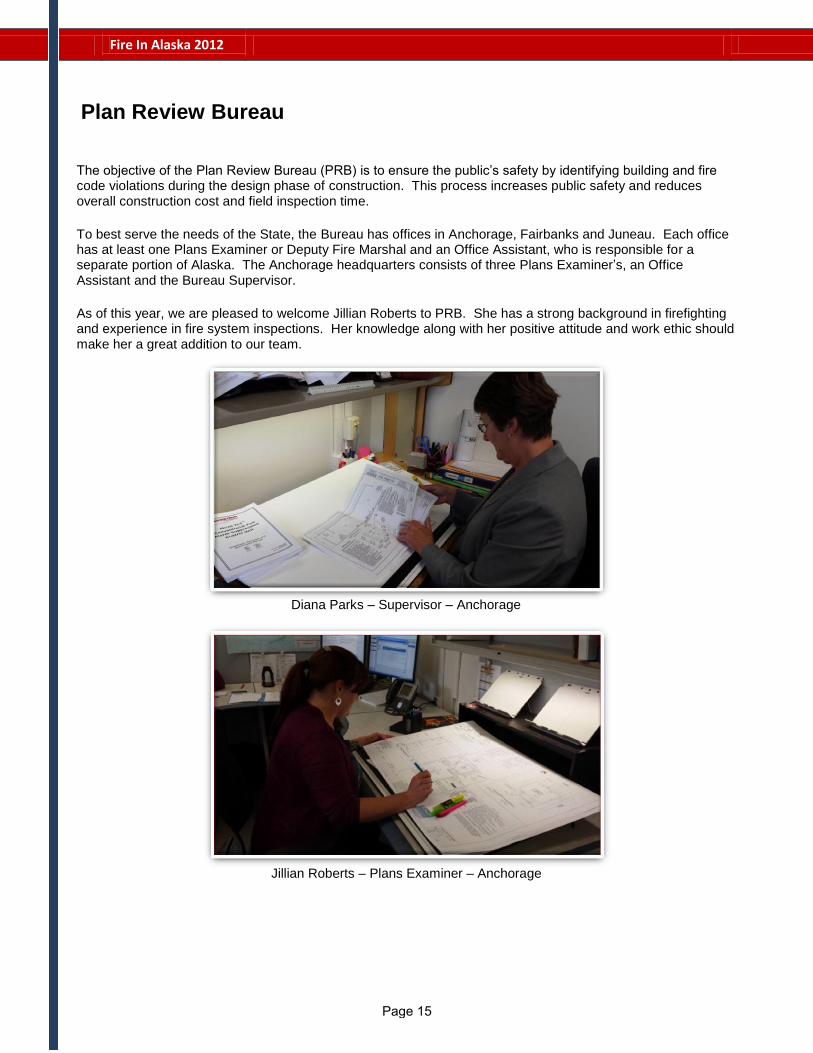
Diana Parks – Supervisor – Anchorage
Jillian Roberts – Plans Examiner – Anchorage
Page 15
Fire In Alaska 2012
The Division of Fire and Life Safety has statewide jurisdiction over building code enforcement except in communities that have received deferrals and claim responsibility for their areas: Anchorage, Juneau, Fairbanks, Kenai, Ketchikan, Seward, Kodiak, Sitka, Soldotna, University of Alaska Fairbanks, Wasilla/Lakes.
PLAN REVIEW PRB ensures the public’s safety by identifying building and fire code violations during the building construction design phase, which decreases deficiencies, eases construction costs and reduces field inspection time. To ensure current building and fire code requirements are being met, the Bureau is responsible for examining building plans for new construction, renovations, additions, occupancy changes, fuel systems and fire suppression, alarm and detection systems. During the early stages of the design process, the Bureau is able to assists design professionals to meet the minimum code requirements, which also saves the customer time and money by eliminating significant reengineering later on. Each year, PRB receives over 1,200 applications ranging from small home daycares to large oil and gas projects.
Plan Review Bureau
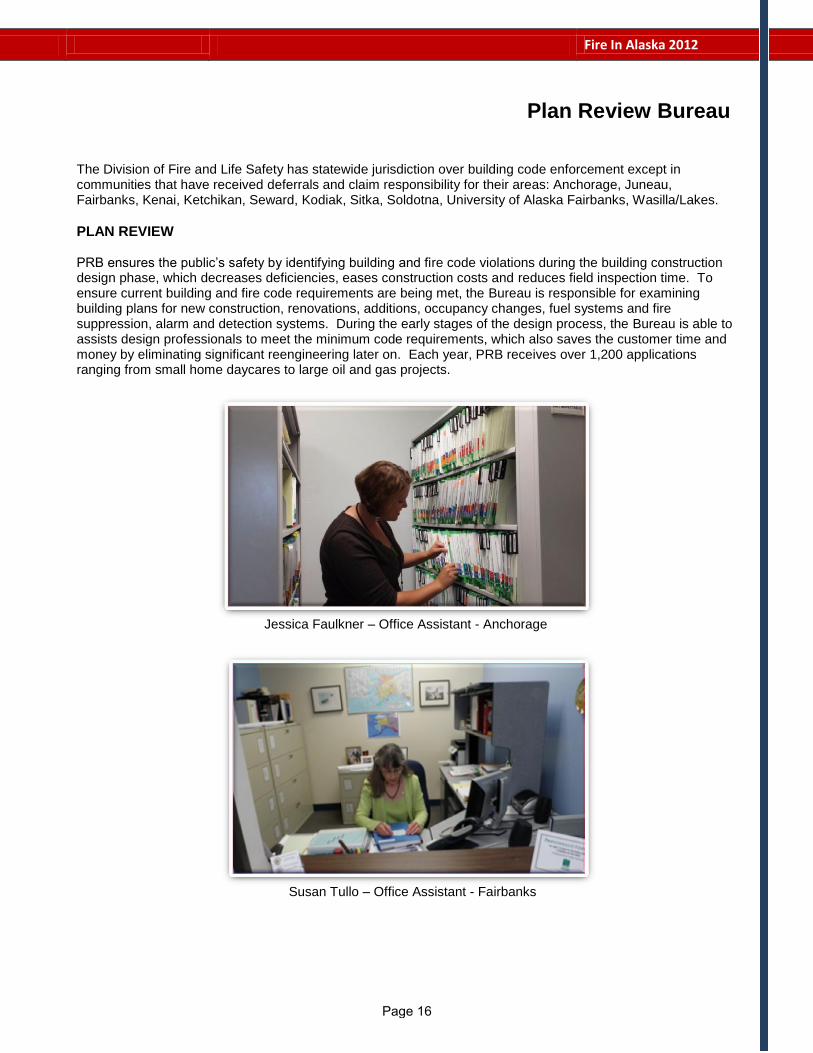
Jessica Faulkner – Office Assistant - Anchorage
Susan Tullo – Office Assistant - Fairbanks
Page 16

Fire In Alaska 2012
CONSTRUCTION INSPECTIONS The Bureau performs construction inspections at 60% (framing) and 90% (before enclosure) of project completion. Inspections are limited to special interest facilities and buildings with a valuation that exceeds $5,000,000. Construction inspections are a recurring part of PRB’s objective to ensure public safety by determining if buildings are built properly and according to their approved plans.
Plan Review Bureau
Jarrett Zuspan – Plans Examiner – Anchorage
David Aden – Plans Examiner - Fairbanks
Page 17
Fire In Alaska 2012
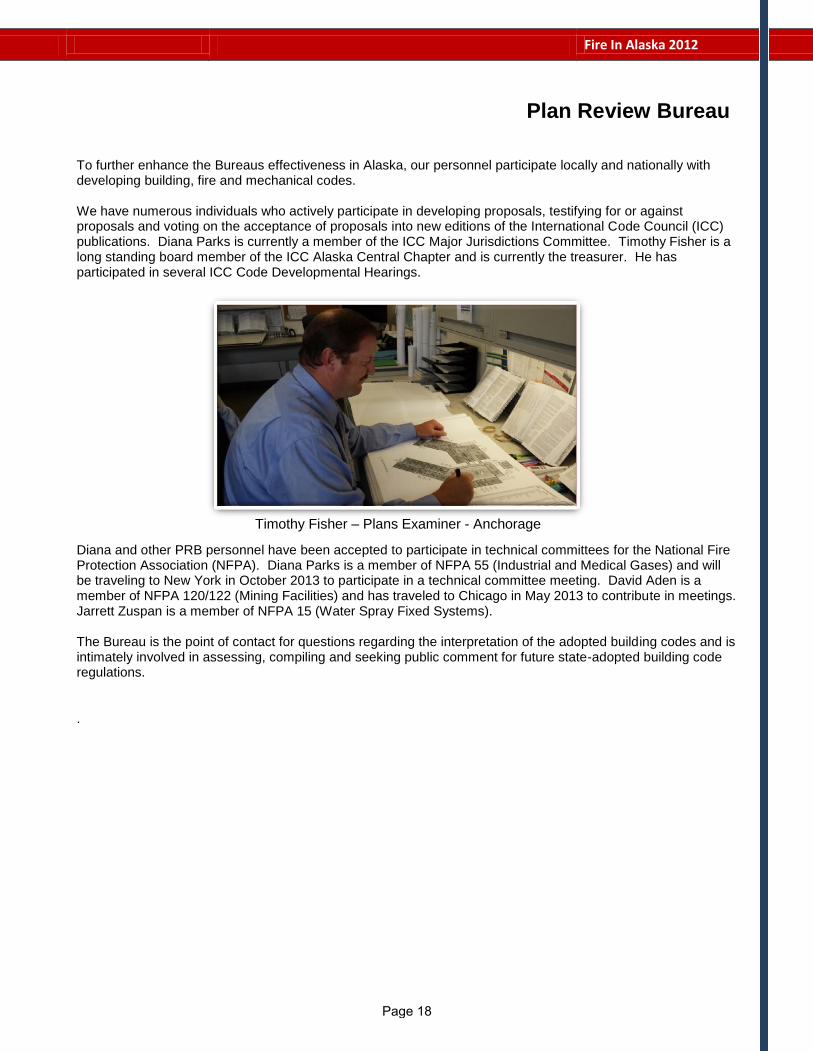
To further enhance the Bureaus effectiveness in Alaska, our personnel participate locally and nationally with developing building, fire and mechanical codes. We have numerous individuals who actively participate in developing proposals, testifying for or against proposals and voting on the acceptance of proposals into new editions of the International Code Council (ICC) publications. Diana Parks is currently a member of the ICC Major Jurisdictions Committee. Timothy Fisher is a long standing board member of the ICC Alaska Central Chapter and is currently the treasurer. He has participated in several ICC Code Developmental Hearings.
Diana and other PRB personnel have been accepted to participate in technical committees for the National Fire Protection Association (NFPA). Diana Parks is a member of NFPA 55 (Industrial and Medical Gases) and will be traveling to New York in October 2013 to participate in a technical committee meeting. David Aden is a member of NFPA 120/122 (Mining Facilities) and has traveled to Chicago in May 2013 to contribute in meetings. Jarrett Zuspan is a member of NFPA 15 (Water Spray Fixed Systems). The Bureau is the point of contact for questions regarding the interpretation of the adopted building codes and is intimately involved in assessing, compiling and seeking public comment for future state-adopted building code regulations.
.
Plan Review Bureau
Timothy Fisher – Plans Examiner - Anchorage
Page 18

Fire In Alaska 2012
The Training and Education Bureau (TEB) provides training for the fire service and also provides education for the public. TEB has four offices. They are located in Anchorage, Palmer, Fairbanks and Juneau. TEB delivers training for the fire service that faces the daily challenges of keeping their communities safe from the devastation of fire. The public education section provides a variety of opportunities in community outreach to reduce the loss of life and property to fire.
TEB’s Anchorage office manages the following programs:
Program oversight for TEB
Fire Training Program Accreditation
Training records
Technical assistance
ANCHORAGE OFFICE
Anchorage houses the Supervisor of TEB and an Office Assistant II. A central function of the Supervisor is to provide federally funded training through the National Fire Academy. Grants application and management is another crucial function in providing training with limited resources and funding, which is a constant challenge.
OFFICE OF RURAL FIRE PROTECTION
The Office of Rural Fire Protection (ORFP) is co-housed with Public Education in Palmer. ORFP and Public Education are provided administrative support through an Office Assistant I, located in Palmer, and the Office Assistant II located in Anchorage. ORFP provides training, equipment and education for the rural fire departments. Working closely with the Alaska State Trooper Village Public Safety Officer (VPSO) program, ORFP teaches a segment on fire safety at the State Trooper Academy located in Sitka. VPSO’s complete the program with knowledge of fire behavior, hazardous materials, front line firefighting skills and the ability to present public education programs when they return to their community.
Training and Education Bureau
Jan Mitchell, TEB Supervisor
Mary Wall, Office Assistant II
Page 19

Fire In Alaska 2012
Through a multi-year grant provided by the Alaska State Firefighters Association, ORFP has been able to enhance firefighting efforts by recruiting and hosting 20-25 rural fire leaders at the Palmer training facility as well as provides scholarships to the Alaska Fire Conference. Community leaders, with an interest in protecting their communities from fire, attend the hands-on training and learn the basics of preventing fire and then mitigating the hazard should a fire occur. In conjunction with the U.S. Marshal’s and the Alaska State Troopers, ORFP attend the week-long Alaska Youth Academy, hosted throughout the state and aimed at 15-18 year old high school students. Through the Youth Academy, students learn how to use a fire extinguisher and the importance of working smoke alarms. The training enhances not only fire safety, but gives the students an increased sense of community and self-confidence. This year, five Youth Academies were scheduled in Barrow, Bethel, Hooper Bay, Fairbanks and Mountain Village.
PUBLIC EDUCATION
Public Education in Alaska is a challenge, both from a logistical standpoint and infrastructure. Reaching rural communities is difficult and this year Public Education will team with the Council on Domestic Violence and Sexual Assault and send fire and life safety education literature to 151 rural communities. Public Education also takes the lead in coordinating delivery of fire and life safety programs for the communities on the road-system by attending home improvement shows, Native Alaska Corporation gatherings and filling a busy schedule at the highly attended Alaska State Fair. Public Education is an active participant in the State Fire Marshal Juvenile Firesetter Forum, the first of its kind in Alaska, scheduled to bring together the many disciplines needed to combat juvenile firesetting behavior.
The Public Education outreach efforts received a boost this year with purchase of a new and highly popular Sparky costume. The Palmer based Sparky allowed a second Sparky to be deployed to the Juneau office and increased visibility for public education in Southeast Alaska.
Steve Schreck, Rural Fire
Training Specialist
Lisa Shield, Office Assistant I
Training and Education Bureau
Mahlon Greene, Public
Educator Coordinator
Page 20

Fire In Alaska 2012
NORTHERN OFFICE
The Northern Operations Office is located in Fairbanks and is responsible for delivery of fire training from Girdwood, north to Barrow and west to Nome. Northern Ops is staffed by one Fire Training Specialist and supported by the Office Assistant II located in the Anchorage office.
Northern Ops Fire Training Specialist works with her communities to tailor training programs suited to their needs. This past summer saw the community of Kotzebue attain the goal of increasing fire safety by graduating seven certified Firefighter I’s. Another example of the tailored programing is the successful effort by Central Mat-Su Fire Department to prepare future leaders of their department by attendance in three National Fire Academy courses on leadership.
SOUTHEAST OFFICE
The Southern Operations Office is located in Juneau and has geographical responsibility for the areas south of Girdwood to Metlakatla and out the Aleutian Chain, an area that encompasses almost 200,000 square miles. The Southern office is staffed by one Fire Training Specialist with administrative support provided by an Office Assistant II that is shared with another bureau. With Juneau being a gateway for all cruise ship traffic, Southern Ops provides fire safety training for hundreds of commercial cruise ship lines crew members. With numerous ship ports located through southeast and southwest Alaska, Southern Ops is a leader in marine firefighting safety for land-based fire departments. National Fire Academy training is provided through Southern Ops as well with courses offered this past year in leadership, safety and fire cause determination.
Tori
Training and Education Bureau
Todd Kollar, Fire
Training Specialist
Tori Clyde, Fire Training
Specialist
Page 21

Fire In Alaska 2012
0
50
100
150
200
2009 2010 2011 2012 2013
134 140 138 151
165
2013 totals are
inclusive of all fire
departments
registration received
by July 28, 2013.
FIRE DEPARTMENT REGISTRATION
The Division of Fire and Life Safety, Director’s Office, manages the registration of local fire and emergency response agencies in Alaska. Alaska state regulations require that every local organization that is performing duties as a fire department to be registered with the Division of Fire and Life Safety.
In order to become a newly registered fire department a fire department must submit the following:
1. Enabling Authority - A copy of their enabling authority document and
2. Response Areas/Boundaries - A description of the boundaries or response areas of the department. This can include either a map or a general description of the limits of the response. Also a description under what circumstances and under whose authority the department will respond outside those boundaries. If the response area is within or overlaps another agencies response area a Mutual Aid or Memorandum of Agreement between those two agencies is required and
3. Annual Summary Report - A summary report must be completed annually by using information from the previous calendar year and
4. Membership Roster - Fire Departments are required under the registration process to forward a current list of all members. Any changes in membership must be sent within 10 days of these changes taking place and
5. Public Education – The number of public fire safety and burn prevention education programs conducted in the community and
6. Personnel – Within 30 days of change, submit every addition or deletion from the membership list. This must be forwarded to the State Fire Marshal and
7. ANFIRS - In order for a fire department to continue their registration status, they must report every fire and fire related incident Division of Fire and Life Safety monthly per 13 AAC 52.020. The fire department may lose their registered status if they fail report.
*Note* To continue fire department registration, departments must submit the Annual Summary Report,
Membership Roster, annual fire prevention/burn injury prevention education programs, membership changes and ANFIRS, authority per 13 AAC 52.030.
Division Programs
Total Registered Fire Departments 2009 - 2013
Page 22

Fire In Alaska 2012
FLASHING BLUE LIGHTS
The authorization to use flashing blue lights are under limited circumstances (13 AAC 02.517 and 13 AAC 04.100) and is approved by the Director of Fire and Life Safety, Kelly Nicolello.
This delegation of authority is subject to cancellation at any time without cause and without prior notice.
All authorizations approved under this delegation must be done in strict accordance with all applicable statutory and regulatory provisions.
The approved agency head is responsible to verify that the person meets the drivers licensing requirements, their driving history is otherwise acceptable to them, insure that each person receiving such an authorization from them has read and understands the requirements for and limitations on the use of flashing blue lights on their vehicle and prior to installing or using a flashing blue light on their vehicle, has completed and returned to the commissioner or the commissioner's designee on a signed and notarized form prepared by the department a certification that:
1. the person’s motor vehicle(s) complies with the equipment standards set out in 13 AAC 04.100; and
2. the person holds a valid Alaska driver’s license that has not been suspended, revoked, cancelled, or limited within the three years before the form is returned; and
3. the person has read and understands the regulations for emergency vehicle operation set out in 13 AAC 02.140, 13 AAC 02.517 and 13 AAC 04.100; and
4. the person and the persons vehicle meet the insurance requirements for operation in the State of Alaska; and
5. if request by the commissioner or the commissioner’s designee, the person provides a certified copy of the person’s driving record.
Authorizations are valid for five (5) years from the date of insurance and are non-transferable. When a person to whom a permit was issued ceases to be an active member in good standing of a volunteer fire company, volunteer first aid or rescue squad, the head agency must notify the Alaska State Fire Marshal who is the has been giving the delegation for the State of Alaska.
The following Departments/Agencies have been authorized and have members approved:
Bear Creek Fire/EMS Dept.
Butte VFD
Butte Ambulance
Hoonah VFD
Houston FD
City of Kodiak, FD
Ninilchik Emergency Services
North Tongass VFD
Salcha Fire and Rescue
Unalaska Fire/EMS
Valdez FD
Division Programs
Page 23

Fire In Alaska 2012
0
50
100
150
200
2008 2009 2010 2011 2012
153 157 151 154
169
ALASKA NATIONAL FIRE INFORMATION REPORTING SYSTEM (ANFIRS)
Alaska has seen an increase in fire department participation in the ANFIRS program. The number of fire departments reporting should be considered when reviewing data comparisons between years.
Fire departments use this reporting system to uniformly code incident information. Accurate and complete information about fires and other incidents can provide a fire department with a valuable reference to:
· help allocate limited resources
· justify budget needs
· review the need for personnel training
· focus the direction of fire education/prevention programs
State lawmakers, the press, the general public, insurance companies, and fire service administrators and leaders request ANFIRS summary reports to help address fire safety concerns and new legislation issues.
ANFIRS data is forwarded to the National Fire Data Center (NFDC) at the U.S. Fire Administration (USFA) each year. The NFDC can then compare and contrast statistics from states and large metropolitan departments to:
· develop national fire and life safety education campaigns
· make recommendations for national codes and standards
· guide allocation of federal grants
· ascertain consumer product failures
· identify the focus for research efforts
· support federal legislation
National Fire Information Reporting System (NFIRS) data is used as the basis for the USFA’s publication Fire in the United States, which is the single most comprehensive reference on the nature and scope of the fire
problem in the United States.
Division Programs
ANFIRS Fire Department Participation 2008 - 2012
Page 24

Fire In Alaska 2012
Fire departments reporting to Alaska National Fire Incident Reporting System (ANFIRS) had 58,643 responses in 2012, with 1,356 of these responses reporting mutual aid assistance.
2012 State Incident Summary
Total Responses 58,643
Less Mutual Aid Responses -1,356
Total Incidents 57,287
2012 State Fire Incident Breakdown:
Structure Fires 738
Confined and/or Contained Inside Structure Fires 499
Motor Vehicle Fires 455
Tree, Brush, or Grass Fires 410
Outside Rubbish or Trash Fires 376
Other Outside Fires 59
Other Fires 23
Exposures 84
Total Fires 2,644
2012 State Non-Fire Incident Breakdown:
Rescue/EMS 36,839
Explosion – No After Fire 57
Hazardous Conditions 1,710
Service Calls 3,728
Good Intent Calls 7,397
Other Calls 223
False Alarms 4,689
Total Non-Fires 54,643
1 minute a fire caused $104.94 damage 9 minutes a fire department responded to a call 14 minutes a fire department responded to a rescue call 1 hour a fire department responded to a good intent call 2 hours a fire department responded to a false call 3 hours a fire department responded to a fire call 2 hours a fire department responded to a service call 5 hours a fire department responded to a hazardous call 12 hours a fire department responded to a structure fire 19 hours a fire department responded to a vehicle fire 9 hours a fire department responded to a residential fire
Alaska 2012 Fire Picture at a Glance
Page 25

Fire In Alaska 2012
The following information has been submitted by fire departments to the Division of Fire and Life Safety. The primary source of data used is the Alaska National Fire Incident Reporting System (ANFIRS).
Important: The data presented in this profile does not represent 100% of the fires that occurred in the state. Rather, it is a sum of the fires reported to the Division of Fire and Life Safety from the fire departments participating in ANFIRS.
This information may be used to give a general picture of the fire incidents in the State of Alaska. Without everyone’s cooperation the information does not show a complete picture of the fire problem in Alaska.
Fires
Fires attended by Alaska Fire Departments decreased from the year of 2011 by 3% to 2644. Fires in structures decreased from the year of 2011 by less than 1% to 1237. Grass/Brush/Wildland fires decreased from the year of 2011 by 14% to 410. Residential properties accounted for 74% or 921 of all structure fires.
Fire Deaths
Civilian fire deaths increased from the year of 2011 by 52% to 23. Twenty-two fatalities occurred in residential structures.
In 57% of all civilian fatalities, alcohol and/or drugs was a contributing factor to the fire and/or victim.
Fire Injuries
Civilian fire injuries increased from the year 2011 by 6% to 79. Firefighter fire injuries increased from the year 2011 by 22% to 49.
Property Damage
Property loss increased from the year 2011 by 18% to $55,157,363. Structure fires caused $49,651,005 or 90% of all property damage. Residential property losses were $31,687,649 or 64% of all structure property loss.
Intentional Fires
Structure fires that were reported as intentional were up from the year of 2011 by 67% to 70. Intentional structure fires accounted for almost 6% of all reported 2012 structure fires. Intentional structure fires accounted for 26% or $12,817,119 of all structure property dollar loss. In all 2,644 reported fires, 6% or 165 were reported as intentional. Intentional fires resulted in 5 civilian fire injuries. Intentional fires resulted in 2 civilian fire deaths. Juvenile firesetters resulted in 26 or 16% of all intentionally set fires.
Alaska 2012 Fire Picture at a Glance
Page 26

Fire In Alaska 2012
5%
0%
63%
3%
6%
13%
8%
0%
2%
Fires
Overpressure Ruptures
Rescue/EMS Calls
Hazardous Conditions…
Service Calls
Good Intent Calls
False Calls
All Other Calls
Mutual Aid Given
20000
25000
30000
35000
40000
45000
50000
55000
60000
To
tal In
cid
en
ts
Alaska fire departments do much more than fight fires. Over the past several decades they have branched out and taken on the added responsibilities for EMS response, many types of specialized rescue, hazardous materials incidents, responding during and after natural disasters, as well as the typical service calls, good intent calls, false alarms and the special types of incidents that do not fit neatly into any of the other categories. We expect these numbers to rise as more fire departments automate their reporting and begin reporting all of their incidents to Alaska National Fire Information Reporting System (ANFIRS). Only then will we have a more complete understanding of the amount of work the Alaska fire service does on a day-to-day basis.
In 2012, 165 fire departments in Alaska reported 57,287 responses to ANFIRS. Of these 57,287 responses, 55,999 non-fire calls were voluntarily reported.
Alaska fire departments began using the National Fire Information Reporting System (NFIRS) in January 2000. NFIRS 5.0 captures information on all incidents, not just fires, to which a fire department responds. As a result of changes in the reporting system and an increase in reporting departments, Alaska fire departments reported 263% more incidents in 2012 from 2000.
Non-Fire Incidents
2012 Reported Incidents by Incident Type
All Incidents Reported 2000 - 2012
2000 2001 2002 2003 2004 2005 2006 2007 2008 2009 2010 2011 2012
Page 27
Fire In Alaska 2012
0
500
1000
1500
2000
2500
3000
3500
2644 2732
3195 3053
2443
3.5
4.4
4.5
3.8
3.6
3.2
3.4
3.6
3.8
4
4.2
4.4
4.6
4.8
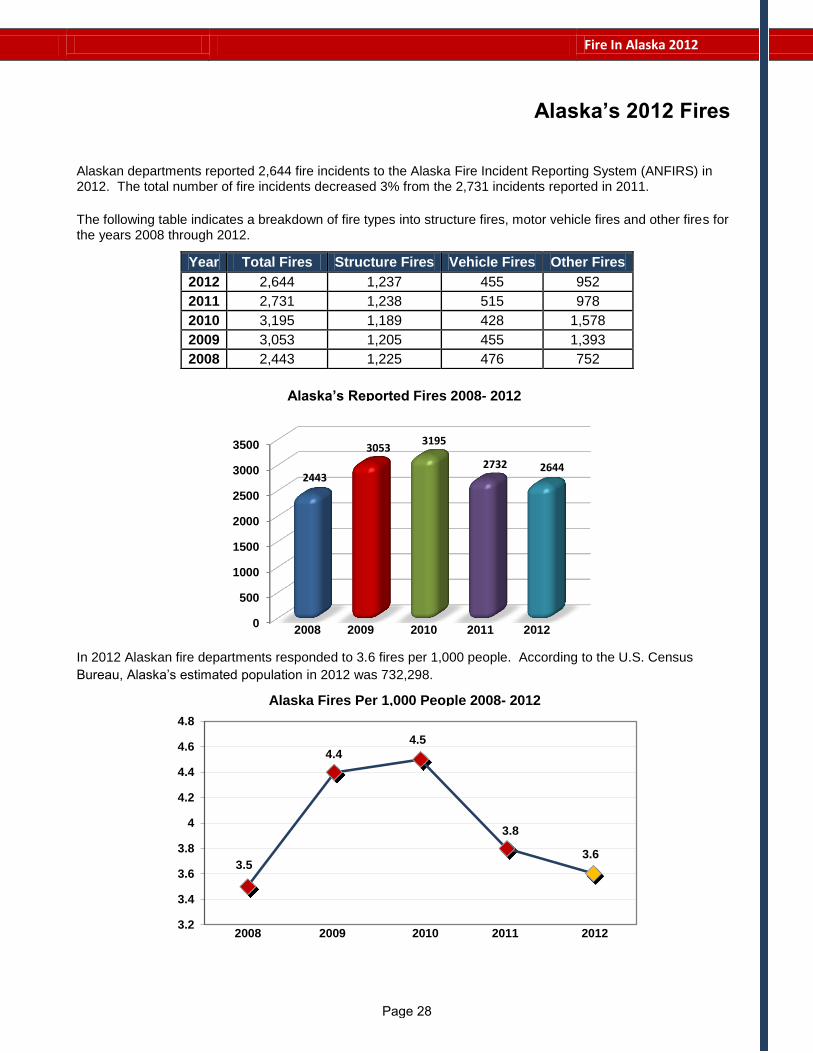
Alaskan departments reported 2,644 fire incidents to the Alaska Fire Incident Reporting System (ANFIRS) in 2012. The total number of fire incidents decreased 3% from the 2,731 incidents reported in 2011.
The following table indicates a breakdown of fire types into structure fires, motor vehicle fires and other fires for the years 2008 through 2012.
In 2012 Alaskan fire departments responded to 3.6 fires per 1,000 people. According to the U.S. Census
Bureau, Alaska’s estimated population in 2012 was 732,298.
Year Total Fires Structure Fires Vehicle Fires Other Fires
2012 2,644 1,237 455 952
2011 2,731 1,238 515 978
2010 3,195 1,189 428 1,578
2009 3,053 1,205 455 1,393
2008 2,443 1,225 476 752
Alaska’s 2012 Fires
Alaska’s Reported Fires 2008- 2012
Alaska Fires Per 1,000 People 2008- 2012
2008 2009 2010 2011 2012
2008 2009 2010 2011 2012
Page 28

Fire In Alaska 2012
$10,000,000
$15,000,000
$20,000,000
$25,000,000
$30,000,000
$35,000,000
$40,000,000
In M
illio
ns
Estimated dollar losses are an indicator of the magnitude of the fire problem and can be used to evaluate progress in fire prevention. This information helps local communities; states and the nation determine the amount that should be spent on fire prevention. Fire loss estimates take into consideration material damaged during extinguishment, as well as material actually damaged by the fire. Estimates are calculated in the total estimated loss.
Fire Dollar Loss by Year
Type of Fire 2009 2010 2011 2012
Structure Fire $32,248,053 $30,942,848 $41,187,568 $49,651,005
Motor Vehicle Fire $2,579,193 $1,623,164 $3,532,965 $4,993,171
Trees, Brush, or Grass Fire $14,161 $1,084,615 $63,515 $278,525
Outside Rubbish or Trash Fire $25,474 $36,296 $17,665 $19,923
Other Fires $142,343 $51,467 $403,805 $214,739
Total Fire Dollar Loss $35,009,224 $33,738,390 $45,205,518 $55,157,363
The reported value of structural property lost due to fire during 2012 was $49,651,005. The reported structural total dollar losses more than $700,000 were in:
St. Paul Island - Warehouse - $10,000,000
Skagway – Hotel & Shopping Buildings- $1,700,000
St. George Island – Maintenance Shop - $1,400,000
Anchorage - Church Assembly - $900,000
Homer – Multi-Family Residential Dwelling - $850,000
Ketchikan – Cruise Liner - $750,000
Homer – Boat - $700,000
Statewide Fire Dollar Loss
Five Year Trend Total Fire Dollar Loss by Month (2008 – 2012)
Page 29

Fire In Alaska 2012
4%
4%
9%
7%
21% Mechanical Failure
Electrical Failure
Misuse of Product
Other
Operational Def.
10%
10%
7%
4%
16% Operating Equipment
Smoldering Object
Arching
Spark/Ember/Flame
Radiated Heat
This bar chart gives
an overview of the
ignition factors of
mobile property fires
excluding
undetermined.
This bar chart
indicates the most
frequently reported
heat source in
vehicles excluding
undetermined.
0
200
400
600
2008 2009 2010 2011 2012
476 455 428
515
455
455 motor vehicle fires were reported in 2012. This accounted for 18% of all reported fires, 6 or 8% civilian injuries, 2 or 4% firefighter injuries, and an estimated property damage of $4.8 million. The 455 mobile property fires in 2012 is a 11% decrease from the 518 motor vehicle fires in 2011.
The majority of these fires involved passenger vehicles. There were 344 fires involving cars, small trucks and vans. Passenger vehicle fires accounted for $1,372,571 or 29% of property damage for all reported motor vehicle fires. The engine area, running gear or wheel area was reported as the fire area or origin in 57% of all reported vehicle fires.
According to NFIRS, a motor vehicle fire is defined as any fire involving a car, truck, boat, airplane, snow machine, four wheeler, construction equipment or other mobile property (not being used as a permanent structure) that occurs outside of a structure.
Total Vehicle Fires 2008 - 2012
Mobile Property Fires
Page 30

Fire In Alaska 2012
Operated 33%
Fire too Small
8%
Failed to Operate
7%
Not Installed 44%
Undetermined 8%
This pie graph gives
an overview of the
alarm
performance/presence
for all non-confined
structure fires.
The 1,237 reported structure fires in 2012 caused 22 civilian deaths, 70 civilian injuries, 39 fire service injuries, and an estimated dollar loss of $48 million. Structure fires accounted for 48% of reported fires and 96% of the civilian fire deaths in 2012.
The number of structure fires decreased by less than 1% from the 1,238 reported in 2011.
2012 Structure Fires by Property Use
Count % Civ.
Deaths Civ.
Injuries FF
Injuries Total Dollar
Loss
Educational 12 1% 0 0 0 $4,000
Health Care 9 1% 0 0 0 $9,500
Industrial 20 2% 0 0 2 $180,101
Manufacturing, Processing 4 0% 0 0 0 $22,450
Mercantile 56 5% 0 1 0 $3,527,035
Other or Special 110 9% 0 3 1 $716,885
Public Assembly 39 3% 0 1 1 $1,732,285
Residential 921 74% 22 64 31 $31,687,649
Storage 66 5% 0 1 4 $11,771,100
Total 1,237 100% 22 70 39 $49,651,005
Property Use Type Alarm
Operated Did Not Operate
Fire Too Small
None Present
Unknown Total
Educational 2 0 1 3 1 7
Health Care 3 0 0 1 1 5
Industrial 1 0 4 7 5 17
Manufacturing, Proc. 0 0 0 2 0 2
Mercantile 10 0 3 11 8 32
Other or Special 0 0 0 21 22 43
Public Assembly 6 0 1 6 9 22
Residential 159 37 35 131 189 551
Storage 2 0 0 44 13 57
Total 183 37 44 226 248 738
Structure Fires
ALARM PERFOMANCE
Page 31

Fire In Alaska 2012
10%
19%
4%
7%
28% Heating
Incendiary/Suspicious
Smoking
Cooking
Equipment Malfunction
The majority of structure fires in Alaska occur in the home. In 2012, there were 921 reported residential structure fires (included structures confined and/or contained inside the structure). These fires caused an estimated direct loss of $31 million. There were 64 civilian injuries, 22 civilian deaths and 31 firefighter injuries caused by these fires. The total number of reported residential structure fires decreased by less than 1% from the 923 reported in 2011.
Occupancy Count % Civ.
Deaths Civ.
Injuries FF
Injuries Total Dollar
Loss
Multifamily 182 20% 4 17 4 $4,477,381
Board and Care 10 1% 0 2 0 $16,250
Hotels & Motels 17 2% 0 0 0 $1,395,000
1 & 2 Family Homes 684 74% 17 44 17 $24,485,260
Dormitories 5 1% 0 0 0 $22,000
Unclassified 23 2% 1 1 0 $1,291,758
Total 921 100% 22 64 21 $31,687,649
Residential Occupancy Sub-Group
Multi-family dwellings: This category includes apartments, condominiums, townhouses, row houses and tenements.
Board Care: This category includes long-term care facilities, halfway houses and assisted care housing facilities.
Hotels & Motels: This occupancy group includes commercial hotels, motels or inns. 1 & 2 Family Homes: This category includes one or two family homes, manufactured homes, cabins
and mobile homes. Dormitories: This category includes dormitory type residences and sorority or fraternity houses. It
also includes barracks; nurses’ quarters, military barracks, monastery/convent, dormitories, bunk houses and workers’ barracks.
Unclassified: Any type of residential occupancy that is not defined above.
The top three leading causes of residential structure fires (excluding unknown which was a reported 21% of all residential structure fires) in 2012 were heating, cooking and incendiary/suspicious.
Residential Structure Fires
LEADING CAUSES (Top Five)
2012 Residential Structure Fire Causes
Page 32

Fire In Alaska 2012
26%
13%
6%
5%
4% Electrical Arching
Open Flame
Cigarette
Hot/Smoldering Object
Operating Equipment
This graph shows
the top five heat
source’s in
residential structure
fires.
HEAT SOURCE
The two most common heat sources in residential structure fires resulted from human acts of intention, error or carelessness. Operating equipment was the number one heat source with hot/smoldering objects being the
second (this excludes undetermined which accounted for 29% reported heat sources).
AREA OF FIRE ORIGIN
The “area of fire origin” element describes the room or area where the fire originated in the structure. The three most common areas of fires in residential structures for 2012 were in the cooking area, bedroom and the attic areas.
Residential Structure Fires
Bedroom
8.29%
Attic
6.35%
Kitchen
10.76% Living/Family
Room
6.00%
Exterior
Balcony
6.17%
Page 33

Fire In Alaska 2012
Top Five Alarm Failure Reasons
Battery Dead 17%
Battery Missing/
Disconnected 63%
Lack of Maintenance
4% Power Failure 4%
Other 13%
SMOKE ALARM PRESENCE AND PERFORMANCE
Smoke alarm performance shows the existence and location of smoke detection equipment relative to the area of fire origin and whether the detection equipment worked. The purpose is to provide information on the usage, reliability and effectiveness of automatic detection equipment. Even though modern codes require all new dwellings to have smoke alarms, the performance relies on proper maintenance by the occupant/owner.
In 2012, 37% of all reported residential structure fires the alarm was present, 32% there was no alarm present, 9% the alarm failed, 8% the fire was too small to activate the alarm and 14% was reported as undetermined.
Smoke Alarm Operation Count % Civ.
Deaths Civ.
Injuries FS
Injuries
Failed to Operate 37 9% 1 5 0
Operated 159 39% 4 32 8
Fire too Small to Operate 35 8% 0 0 0
Undetermined 183 44% 9 16 14
Total 414 100% 14 53 22
Smoke Alarm Failure Reason
Count % Civ.
Deaths Civ.
Injuries FS
Injuries
Battery Missing/Disconnected 15 40% 0 3 0
Hardwired Power Failure 1 3% 0 0 0
Lack of Cleaning 1 3% 0 0 0
Battery Discharged/Dead 4 11% 0 0 0
Other/Defective 2 6% 0 0 0
Undetermined 14 37% 1 2 0
Total 37 100% 1 5 0
Residential Structure Fires
SMOKE ALARM PERFORMANCE IN RESIDENTIAL NON-CONFINED FIRES
Page 34

Fire In Alaska 2012
0%
2%
4%
6%
8%
10%
12%
14%
16%
Jan Feb Mar Apr May Jun Jul Aug Sep Oct Nov Dec
All Fires Residential Structure Fires
0%
2%
4%
6%
8%
10%
12%
14%
16%
00:00-01:59
02:00-03:59
04:00-05:59
06:00-07:59
08:00-09:59
10:00-11:59
12:00-13:59
14:00-15:59
16:00-17:59
18:00-19:59
20:00-21:59
22:00-23:59
All Fires Residential Structure Fires
WHEN RESIDENTIAL FIRES OCCUR
Fires in residential structures were more common in the winter than in the summer in 2012. This trend is related to the leading cause of all residential structure fires, heating. Clearly there are other seasonal factors in addition to winter residential fires – perhaps a greater propensity to stay at home.
For 2012, there were more residential structure fires in the month of November (13%) with the month of August (5%) being the least amount of fires.
When analyzed by time of day, as illustrated below, the highest number of residential structure fires occurred in the evening, similar to the trend for fires generally. The residential structure fire time trend is related to the second leading cause of residential structure fires in Alaska – cooking – since many people prepare dinner in their homes during the early evening. These fires can often be prevented by teaching people to be more vigilant while cooking. Also, the public should be aware that cooking fires can be extinguished by a pot or pan lid or by dousing with baking soda. The wearing of loose-fitted clothing can also be dangerous around cooking areas.
Residential Structure Fires
Fire
Prevention
Month
Residential Structure Fires by Month
Residential Structure Fires by Time of Day
Page 35

Fire In Alaska 2012
39
43
27
14
9
33
0 10 20 30 40 50
8:01 PM - 12:00 AM
4:01 PM - 8:00 PM
12:01 PM - 4:00 PM
8:01 AM - 12:00 PM
4:01 AM - 8:00 AM
00:01 AM - 4:00 AM
Total Incidents
Tim
e In
terv
als
This chart shows
the time for all
reported intentional
fires.
7% 6%
5% 5% 6%
0%
3%
6%
9%
12%
15%
2008 2009 2010 2011 2012
This chart
indicates the
percentage of
fires that have
been reported as
intentional for the
indicated year.
One hundred and sixty-five (165) or 6% of all reported fires were reported as intentionally set. This number increased by seventeen (17) from 2011. All reported intentionally set fires increased 10% from 2011. While Alaska saw a decrease in intentionally set fires, it is more likely that intentionally set fires are severely under reported.
It has been reported there was an increase in property loss due to intentionally set fires from 2011 to 2012 (91%).
In accordance with NFIRS, intentionally set fires are those fires set deliberately by the misuse of a heat source or the intentional ignition of property. Intentionally set fires result in hundreds of thousands dollars in our state each year. The total dollar loss in intentionally set fires was $13,654,619.
Over 42% of all reported intentionally set fires occurred in structure fires. Natural vegetation fires came in second at 26%. Intentionally set fires in structures caused a property loss of $12,816,119 in 2012.
The main areas of origin for intentionally set fires in a structure were in the bedroom and storage areas. The exterior wall surface accounted for 7% with common room accounting for 6% followed by exterior stairways at 4%. Cigarette lighters and or matches were the heat source in over 27% of the incidents.
Intentionally Set Fires
2012 Alarm Time for Intentional Fires
2008 – 2012 Intentionally Set Fires
Page 36

Fire In Alaska 2012
Juveniles Involved With Fire
0
10
20
30
40
50
2008 2009 2010 2011 2012
24 25 28
33 28
Juveniles Involved in Fires by Year
0
2
4
6
8
10
1 - 3 4 - 6 7 - 9 10 - 1213 - 1516 - 18
1
5
7 6
9
0
Smoldering Object
6%
Other Open Flame 15%
Lighter/Match 59%
Cigarette 2%
Undetermed 18%
Juvenile Set Fires by Heat Source 2008 – 2012
Juvenile firesetting is best defined as any unsanctioned use of or involvement with ignition materials with the intent to produce a flame or fire.
In 2012, children playing with matches, lighters and other heat sources caused 28 reported fires, 1 civilian fatality, 1 fire service injury and estimated dollar loss of $758,900. There were 4 exposures due to these fires.
The fires set by children in 2012 included: 11 structure fires, 16 natural vegetation fires and 1 special outside fire. The exposures affected 4 structures which were 1 residential, 1 storage shed and 2 mercantile businesses.
Heat Source
In 2012, seventy-one (71%) of juvenile-set fires were started by lighters or matches. Eight percent (8%) were started with a cigarette and seven percent (7%) were started by some type of open flame. This demonstrates a need for education to both parents and children on the danger of matches, lighters and other open flame.
Juveniles Involved in Fires by Age Group
Page 37
Fire In Alaska 2012
Fire Injuries and Fatalities
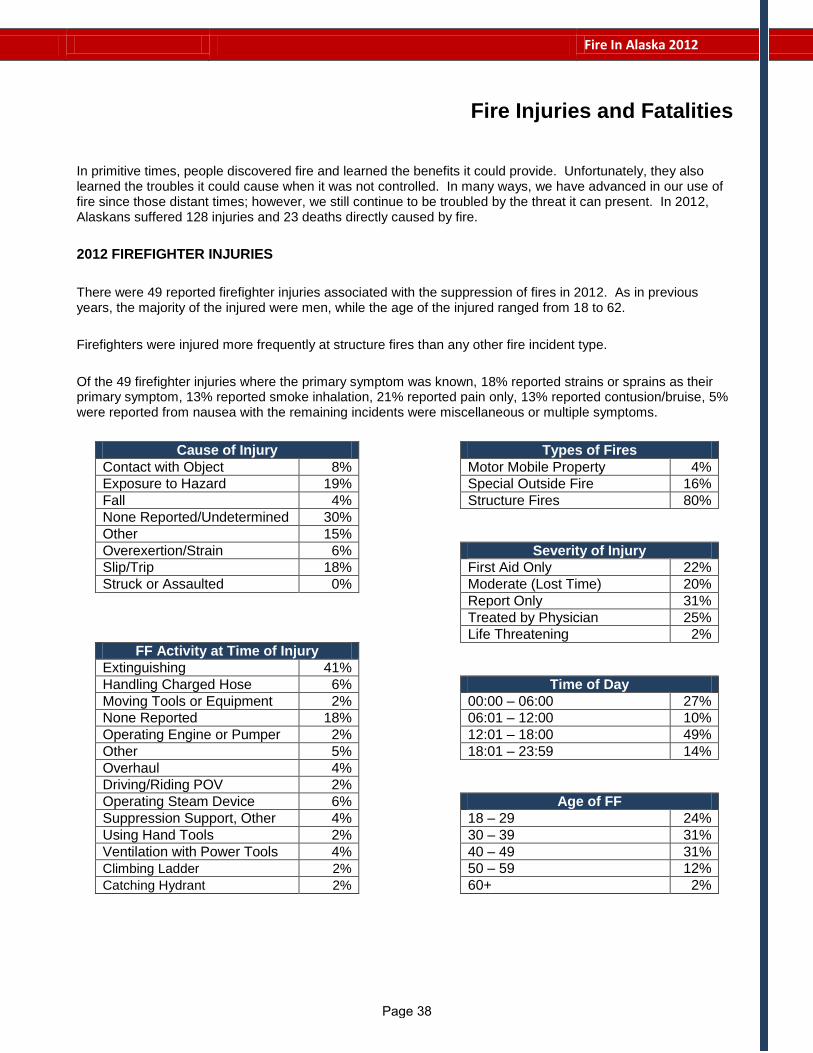
In primitive times, people discovered fire and learned the benefits it could provide. Unfortunately, they also learned the troubles it could cause when it was not controlled. In many ways, we have advanced in our use of fire since those distant times; however, we still continue to be troubled by the threat it can present. In 2012, Alaskans suffered 128 injuries and 23 deaths directly caused by fire.
2012 FIREFIGHTER INJURIES
There were 49 reported firefighter injuries associated with the suppression of fires in 2012. As in previous years, the majority of the injured were men, while the age of the injured ranged from 18 to 62.
Firefighters were injured more frequently at structure fires than any other fire incident type.
Of the 49 firefighter injuries where the primary symptom was known, 18% reported strains or sprains as their primary symptom, 13% reported smoke inhalation, 21% reported pain only, 13% reported contusion/bruise, 5% were reported from nausea with the remaining incidents were miscellaneous or multiple symptoms.
Cause of Injury Types of Fires
Contact with Object 8% Motor Mobile Property 4%
Exposure to Hazard 19% Special Outside Fire 16%
Fall 4% Structure Fires 80%
None Reported/Undetermined 30%
Other 15%
Overexertion/Strain 6% Severity of Injury
Slip/Trip 18% First Aid Only 22%
Struck or Assaulted 0% Moderate (Lost Time) 20%
Report Only 31%
Treated by Physician 25%
Life Threatening 2%
FF Activity at Time of Injury
Extinguishing 41%
Handling Charged Hose 6% Time of Day
Moving Tools or Equipment 2% 00:00 – 06:00 27%
None Reported 18% 06:01 – 12:00 10%
Operating Engine or Pumper 2% 12:01 – 18:00 49%
Other 5% 18:01 – 23:59 14%
Overhaul 4%
Driving/Riding POV 2%
Operating Steam Device 6% Age of FF
Suppression Support, Other 4% 18 – 29 24%
Using Hand Tools 2% 30 – 39 31%
Ventilation with Power Tools 4% 40 – 49 31%
Climbing Ladder 2% 50 – 59 12%
Catching Hydrant 2% 60+ 2%
Page 38

Fire In Alaska 2012
Fire Injuries and Fatalities
0%
5%
10%
15%
20%
25%
30%
Sun. Mon. Tues. Wed. Thurs. Fri. Sat.
9% 9% 11%
18%
14% 16%
23%
2012 CIVILIAN FIRE INJURIES
There were 74 civilians injured by fire in Alaska in 2011. The majority, 79%, were the result of structure fires. Almost 42% of these injuries took place on the weekend.
The top causes of fires that resulted in injuries continue to be:
Misuse of Material or Product Intentional Operational Deficiency
The Top Categories
Type of Fire Cause of Injury
Structure Fire 83% Jumped to Escape 2%
Fire, Other 2% Exposed to Fire Products 60%
Motor Mobile Property (Vehicle) 11% Exposed to Haz. Materials 16%
Outside Fire 4% Fell, Slipped, or Tripped 1%
Multiple Causes 4%
Other 3%
Severity of Injury None Reported 14%
Minor 67%
Moderate 17% Age of Injured Civilian
Severe 7% 0 – 17 8%
Life Threatening 4% 18 - 29 15%
Not Reported 5% 30 – 39 13%
40 – 49 19%
50 – 59 21%
Human Factors 60+ 24%
Asleep 15%
Impaired by Alcohol/Drugs 11% Time of Day
Unconscious 9% 00:00 – 06:00 29%
Physically Restrained 1% 06:01 – 12:00 21%
Age 4% 12:01 – 18:00 19%
None Reported 60% 18:01 – 23:59 31%
Civilian Injuries by Day of Week
Page 39

Fire In Alaska 2012
Fire Injuries and Fatalities
Improper Use of Equip.
9%
Careless Smoking
17%
Misuse of Heat Source
17%
Child Playing With Heat
Source 4%
In fifty-seven (57%)
percent of Alaska’s 2012
civilian fatalities, alcohol
and/or drugs were
contributing factor to the
fire.
In 2012, 71% percent of all
civilian fire fatalities were
male.
From 2008 – 2012, 70% of
all civilian fire fatalities were
male.
Male 70%
Female 30%
0%
10%
20%
30%
40%
0 - 9 10 - 19 20 - 29 30 - 39 40 - 49 50 - 59 60 - 69 70+
0% 0%
13%
0%
30%
9%
26% 22%
2012 CIVILIAN FATALITIES
Even though Alaska experienced 128 injuries and $55 million in estimated losses, the real tragedy was the loss of 23 Alaskans from fire in 2012. Alaska experienced 8.7 fire deaths for each 1,000 fires during this year. In terms of Alaska’s increasing population, the 2012 fire death rate was 3.1 deaths for each one hundred thousand Alaskans.
Top Four Causes of Fire Fatalities
Fire Fatalities by Gender
Number of 2012 Fire Fatalities by Age Group
Page 40

Fire In Alaska 2012
Fire Injuries and Fatalities
Undetermined 47%
Operated 16%
Not Installed 37%
Did Not Operate 5%
20%
29%
17%
8%
0% 1%
17%
0%
10%
20%
30%
40%
10%
2%
13%
3%
21% 18%
22%
0%5%
10%15%20%25%30%35%40%
0 - 9 10 - 19 20 - 2930 - 3940 - 49 50 - 59 60+
By Region
Central Region had the
most fatalities over the rest
of the state, however, per
capita Western Region
continues to have a higher
rate.
By Age
Alaska’s highest death age
group is 60 years old and
older.
Twenty-two, or 97%, of civilian fire fatalities occurred in residential structures. These 23 fire deaths occurred in
12 single residential homes, 1 residential trailer, 4 multi-dwelling residential homes, 2 properties that were being
used as a main residence and 1 outside fire.
A continuing problem is the lack of working smoke alarms in homes and other residential property. The 22 civilian residential fire deaths occurred in 19 separate fire incidents. Of these 19 residential structures only 7 had a smoke alarm present and only 3 operated. In the remaining 9 residential homes, the smoke alarm presence was not installed, did not operate, or was reported as undetermined.
Smoke Alarm Presence/Operation
FIVE-YEAR (2008 – 2012) TRENDS
Page 41

Fire In Alaska 2012
Fire Fatality Rates
Fire service leaders are often asked to show the effectiveness of the services that they perform. This is
especially true in today’s era of decreased budgets. All too often managers and leaders count “things” such as
number of responses or number of hours spent doing key functions.
While counting the number of responses made, the number of inspections conducted, the number of inspection violations cited, or the numbers of hours spent on training are all important “things” to count, they really do not show effectiveness.
One method of showing effectiveness is to track fire rates over time. Are fires, deaths, or injuries going up or down? When doing so, one must be careful to use a large enough data set so as not to be impacted by an unusually high or low years’ worth of data.
Number of Fire Deaths and Fire Death Rate
In Alaska the fire death rate (number of fire deaths per 100,000 population) in 2012 was 3.14. This basically
means that in 2012 a fire death occurs about once a year for every 30,879 people. Compare this to the number
of fire deaths that occurred in 1987 when a fire death occurred about once a year for every 24,318 people. The following table shows the average number of fire death and the fire death rates for the past four decades:
Communities could use the below list as a benchmark to determine how their fire death rate compares with the rest of the state. Communities that are experiencing fire death rates above the state averages should look at initiating measures to reduce the number of fire deaths (public fire safety education and/or fire prevention activities). Communities that are experiencing fire death rates substantially below the state average can probably take comfort in knowing that their efforts seem to be working.
Decade: Total Fire Deaths: Average Fire Deaths/Yr: Fire Death Rate:
1970’s (1970 – 1979) 333 33.3 8.66
1980’s (1980 – 1989) 242 24.2 4.44
1990’s (1990 – 1999) 213 21.3 3.54
2000’s (2000 – 2009) 168 16.8 2.53
Estimated Number of Fire Deaths by Population Per Year
Population: # Deaths by Population:
300,000 9.09
100,000 3.03
75,000 2.27
50,000 1.52
25,000 0.76
15,000 0.45
10,000 0.30
5,000 0.15
1,000 0.03
500 0.02
Page 42

Fire In Alaska 2012
Burn Injuries
0
10
20
30
40
50
60
70
80
2008 2009 2010 2011 2012
72
39
54 56
67
All burn injuries that have been treated by a health care professional must be reported to the Division of Fire and Life Safety within three working days. In 2012, health care professionals reported 67 burn injuries. This is an increase of 16% from the 56 incidents that was reported in 2011.
The data is being collected to identify problems that need to be addressed by public education or development of appropriate intervention strategies. To develop and implement effective prevention programs, we need to know what type of activity injures whom, if the injuries are seasonal and how old the victims are. We appreciate the efforts of the many dedicated doctors, nurses, health aides, paramedics, and clerical personnel who report the burn injuries promptly and completely. They make the program work.
Burn injuries are among some of the most catastrophic injuries that a person can suffer. Depending on the type and severity of the burn, there can be internal injuries, skin damage, infections, cardiac arrest, and other complications. Aside from emergency care, many burn victims require continuous medical treatment, counseling, and rehabilitation.
Types of Burn Injuries Reported in 2012
Thermal Burns – This is the result of direct contact with heat sources such as hot liquids, fire, steam, hot metals, or any other hot objects. An estimated 14% of all burn incidents were fire/flame related, 21% were related to scalding, while another 14% came from contact with a hot object.
Electrical Burns – Electrical burns occur when electric currents pass through the body. A significant part of the damage is done under the surface of the skin. Some of the factors that affects the extent of the injury include the duration of exposure, type of current, intensity of the current, amount of moisture on the body, and the area of the body where the current passed through. Some consequences include cardiac problems, muscle spasms, oral burns, severe skin burns, fractures, and seizures/coma. It can also result to neurological deficits and even death. There were no reported burn injuries caused by electrical burns in 2012.
Chemical Burns – This type represented 18% of burn injury cases. Chemical burns occur when alkaloids, acids, and other types of chemicals come into contact with human skin. There are caustic chemicals that are used in certain industries such as agriculture, construction, medical, and automotive industries. Most cases occur in the workplace. But it is important to note that household cleaners that contain sulfuric acid, phenol, lye, and sodium hypochlorite are also dangerous.
Other Types of Burns – Around 4% of patients suffered from other types of burns. Friction, cold, and radiation (from the sun, tanning beds, or radiation therapy) can cause burn injuries.
Burn Injuries Reported 2008 - 2012
Page 43

Fire In Alaska 2012
Burn Injuries
8%
14%
12%
4%
10%
17%
20%
4%
1%
9%
1%
0 3 6 9 12 15 18
Chemical
Contact with Hot Object
Cooking
Explosives
Flammable Liquids
Gas/Vapor Explosion
Hot Liquid
Other Open Flame
Steam
Structure Fire
Vehicle Fire
18%
15%
15%
8%
8%
0 3 6 9 12
Scald from Spill of Hot Liquid
Inappropiate Use of FlammableLiquids
Explosion
Cooking
Touched Hot Object
Causes of 2012 Reported Burn Injuries:
Top Two Causes of Reported Burn Injuries by Age Group:
Age Group Count # 1 Injury Cause #2 Injury Cause
0 - 4 12 Hot Liquid Contact With Hot Object
5 - 10 2 Hot Liquid Flammable Liquids
10 - 19 2 Cooking Other Open Flame
20 - 29 19 Gas/Vapor Explosion Flammable Liquids
30 – 39 9 Gas/Vapor Explosion Flammable Liquids
40 – 49 5 Gas/Vapor Explosion Cooking
50 – 59 8 Chemical Gas/Vapor Explosion
60 – 69 4 Structure Fire Gas/Vapor Explosion
70+ 6 Chemical Structure Fire
Top Five Specific Items or Behaviors That Caused the Burns
Page 44
Fire In Alaska 2012
18%
3%
0% 1%
31%
13%
7%
12%
6%
9%
0%
5%
10%
15%
20%
25%
30%
35%
Burn Injuries
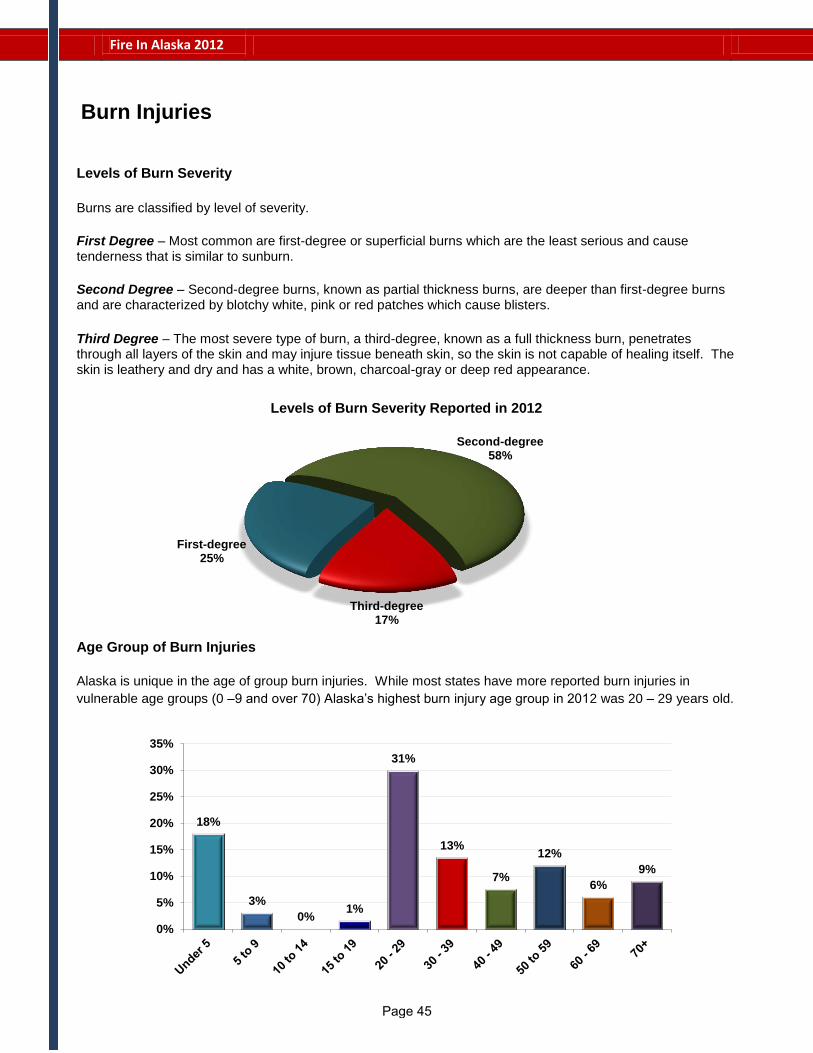
First-degree 25%
Second-degree 58%
Third-degree 17%
Levels of Burn Severity
Burns are classified by level of severity.
First Degree – Most common are first-degree or superficial burns which are the least serious and cause tenderness that is similar to sunburn.
Second Degree – Second-degree burns, known as partial thickness burns, are deeper than first-degree burns and are characterized by blotchy white, pink or red patches which cause blisters.
Third Degree – The most severe type of burn, a third-degree, known as a full thickness burn, penetrates through all layers of the skin and may injure tissue beneath skin, so the skin is not capable of healing itself. The skin is leathery and dry and has a white, brown, charcoal-gray or deep red appearance.
Age Group of Burn Injuries
Alaska is unique in the age of group burn injuries. While most states have more reported burn injuries in
vulnerable age groups (0 –9 and over 70) Alaska’s highest burn injury age group in 2012 was 20 – 29 years old.
Levels of Burn Severity Reported in 2012
Page 45

Fire In Alaska 2012
ANFIRS Participants
Not Reporting
Reporting0
20
40
60
80
100
120
140
160
180
20082009
20102011
2012
89 83 86 89
66
153 157 151 158
169
The following pages are a listing of fire department fire responses submitted to the Alaska National Fire Incident Reporting System (ANFIRS) during 2012. Totals are inclusive of all reports received by April 1, 2012. Exposure fires are not included in the fire counts. Department name will NOT appear on the listing if they failed to submit ANFIRS for the year of 2012.
This annual report is a compilation of the information that we have received from reporting departments.
Without the input from each of the individual fire departments, this report would not be possible and we
appreciate all of their support. If any fire department is not reporting and/or has questions regarding ANFIRS,
please call (907) 269-5625.
ANFIRS Fire Department Participation 2008 – 2012 Comparison
Page 46

Fire In Alaska 2012
Fire Department Name Total Structure Other Civilian Fire Service Fire Dollar
Fires Fires Fires Dths. Inj. Dths. Inj. Loss
Akhiok VFD 0 0 0 0 0 0 0 0
Akutan VFD 0 0 0 0 0 0 0 0
***Alakanuk, Community of 2 2 0 1 0 0 0 125,000
Aleknagik Fire & EMS Dept. 1 1 0 0 0 0 0 3,000
Anchor Point Fire & Emerg. Medical Service Area
18 11 7 0 0 0 0 1,276,600
Anchorage FD 733 364 369 2 26 0 17 11,092,443
Angoon VFD 4 3 1 0 0 0 0 0
Aniak VFD 2 1 1 0 0 0 0 750
Anton Anderson Mem Tun. FD 0 0 0 0 0 0 0 0
Atka VFD 1 0 1 0 0 0 0 0
Bear Creek Fire/EMS Dept. 8 5 3 0 0 0 0 475,000
Bethel FD 45 27 18 0 0 0 0 175,500
***Birch Creek, Community of 1 1 0 0 0 0 0 95,000
Brevig Mission FD 2 1 1 0 0 0 0 600
Bristol Bay Borough Em. Svs. 6 4 2 1 0 0 0 187,000
Butte VFD 32 8 24 0 0 0 0 630,500
Cantwell VFD 0 0 0 0 0 0 0 0
Capital City Fire/Rescue 98 62 36 0 3 0 5 1,311,860
Caswell Lakes FSA #135 2 1 1 0 0 0 0 16,600
Central Emergency Services 92 62 30 1 7 0 0 2,160,410
Central Mat-Su FD 125 48 77 2 4 0 0 684,000
Chefornak VFD 0 0 0 0 0 0 0 0
Chena Goldstream Fire & Res. 27 13 14 0 0 0 0 145,960
Chenega Bay FD 0 0 0 0 0 0 0 0
Chickaloon Fire Service, Inc. 1 1 0 0 0 0 0 200
Chistochina VFD 0 0 0 0 0 0 0 0
Chitina VFD 1 1 0 0 0 0 0 36,500
***Chuathbaluk, Community of 1 1 0 0 0 0 0 180,000
2012 Experience by Fire Department
** Indicates the Department did NOT report for the full year of 2012.
*** Indicates report(s) was completed by the Division of Fire and Life Safety after a serious incident.
Page 47

Fire In Alaska 2012
Pressure Rescue Haz. Service Good Intent Special False Aid Total
Ruptures Calls Cond. Calls Calls Inc. Calls Given Calls
0 0 0 0 0 0 0 0 0
0 0 0 0 0 0 0 0 0
0 0 0 0 0 0 0 0 2
0 0 0 0 0 0 0 0 1
1 0 3 0 6 0 11 2 41
19 21,234 786 2,368 4,933 107 2,354 45 32,579
0 0 0 0 0 0 0 0 4
0 0 0 0 1 0 0 0 3
0 0 0 0 0 0 0 0 0
0 0 0 0 0 0 0 0 1
0 1 4 0 0 6 1 87 107
0 6 20 24 23 1 34 1 154
0 0 0 0 0 0 0 0 1
0 0 0 0 0 0 0 0 2
0 0 0 0 0 0 0 0 6
0 92 12 26 9 0 17 18 206
0 0 0 0 0 0 0 0 0
1 2,614 68 131 269 11 376 3 3,571
0 0 0 0 1 0 1 1 5
4 1,651 67 122 174 2 209 26 2,347
1 708 64 109 444 11 205 68 1,735
0 0 0 0 0 0 0 0 0
0 183 14 4 64 0 14 30 336
0 0 0 0 0 0 0 0 0
0 0 0 0 0 0 0 0 1
0 0 0 0 0 0 0 0 0
0 0 0 0 0 0 0 0 1
0 0 0 0 0 0 0 0 1
2012 Experience by Fire Department
Page 48

Fire In Alaska 2012
2012 Experience by Fire Department
Fire Department Name Total Structure Other Civilian Fire Service Fire Dollar
Fires Fires Fires Dths. Inj. Dths. Inj. Loss
Chugiak Fire Service Area 49 27 22 0 0 0 0 997,400
City of Anderson FD 0 0 0 0 0 0 0 0
City of Fairbanks FD 151 64 87 3 0 0 2 1,212,301
City of False Pass VFD 0 0 0 0 0 0 0 0
***City of Fort Yukon VFD 1 1 0 1 0 0 0 20,000
City of Kasaan VFD 1 1 0 0 0 0 0 0
City of Kodiak FD 19 14 5 0 2 0 0 92,750
City of Kotzebue FD 16 10 6 0 0 0 0 116,300
City of Palmer FD 20 11 9 0 0 0 2 161,950
Coffman Cove VFD 1 1 0 0 0 0 0 300
ConocoPhillips Alaska FD 6 1 5 0 1 0 0 559,700
Cooper Landing VFD 0 0 0 0 0 0 0 0
Cordova VFD 9 9 0 0 0 0 0 220,850
Craig VFD 6 4 2 0 0 0 0 353,700
Crooked Creek VFD 0 0 0 0 0 0 0 0
Delta Junction VFD 3 2 1 0 0 0 0 0
Department of Forestry 137 0 137 0 0 0 0 0
***Dillingham VFD & Rescue 1 1 0 1 0 0 0 50,000
Dot Lake VFD 0 0 0 0 0 0 0 0
Eagle VFD 1 1 0 0 0 0 0 175,000
Edna Bay VFD 0 0 0 0 0 0 0 0
Elfin Cove FD 0 0 0 0 0 0 0 0
Emmonak VFD 1 1 0 0 1 0 0 2,000
Ester VFD 25 9 16 0 0 0 0 196,519
Fairbanks Airport Police & Fire 5 1 4 0 0 0 0 0
**Fire Protection Area No. 1 4 2 2 0 0 0 0 15,000
Gakona VFD 2 1 1 0 2 0 4 240,000
***Galena VFD 1 1 0 2 0 0 0 552,830
** Indicates the Department did NOT report for the full year of 2012.
*** Indicates report(s) was completed by the Division of Fire and Life Safety after a serious incident.
Page 49
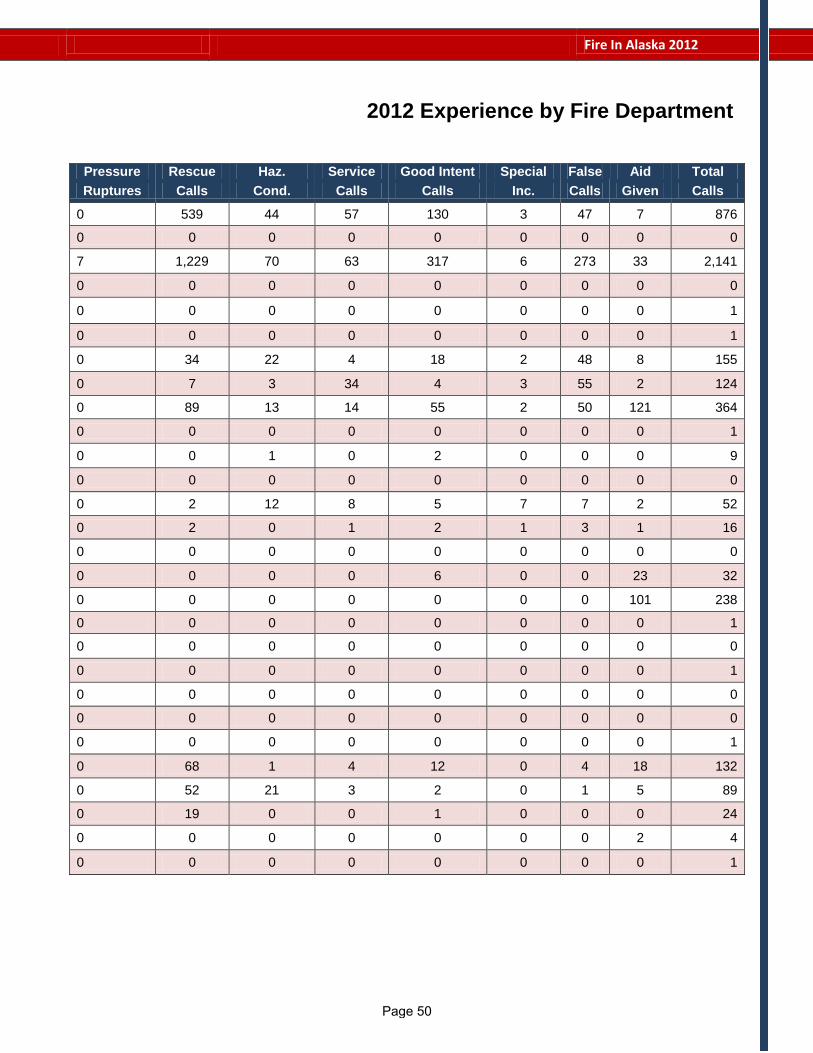
Fire In Alaska 2012
2012 Experience by Fire Department
Pressure Rescue Haz. Service Good Intent Special False Aid Total
Ruptures Calls Cond. Calls Calls Inc. Calls Given Calls
0 539 44 57 130 3 47 7 876
0 0 0 0 0 0 0 0 0
7 1,229 70 63 317 6 273 33 2,141
0 0 0 0 0 0 0 0 0
0 0 0 0 0 0 0 0 1
0 0 0 0 0 0 0 0 1
0 34 22 4 18 2 48 8 155
0 7 3 34 4 3 55 2 124
0 89 13 14 55 2 50 121 364
0 0 0 0 0 0 0 0 1
0 0 1 0 2 0 0 0 9
0 0 0 0 0 0 0 0 0
0 2 12 8 5 7 7 2 52
0 2 0 1 2 1 3 1 16
0 0 0 0 0 0 0 0 0
0 0 0 0 6 0 0 23 32
0 0 0 0 0 0 0 101 238
0 0 0 0 0 0 0 0 1
0 0 0 0 0 0 0 0 0
0 0 0 0 0 0 0 0 1
0 0 0 0 0 0 0 0 0
0 0 0 0 0 0 0 0 0
0 0 0 0 0 0 0 0 1
0 68 1 4 12 0 4 18 132
0 52 21 3 2 0 1 5 89
0 19 0 0 1 0 0 0 24
0 0 0 0 0 0 0 2 4
0 0 0 0 0 0 0 0 1
Page 50

Fire In Alaska 2012
2012 Experience by Fire Department
Fire Department Name Total Structure Other Civilian Fire Service Fire Dollar
Fires Fires Fires Dths. Inj. Dths. Inj. Loss
Gambell VFD 3 3 0 0 0 0 0 265,000
Girdwood FD 15 7 8 0 0 0 0 850,500
**Glennrich Fire Rescue 4 4 0 0 0 0 0 55,500
Goodnews Bay VFD 1 1 0 0 0 0 0 0
**Grayling Village, Comm. of 0 0 0 0 0 0 0 0
Greater Prudhoe Bay FD 15 10 5 0 0 0 0 318,300
Gulkana VFD 0 0 0 0 0 0 0 0
Gustavus VFD 6 3 3 0 0 0 0 50,000
Haines VFD 9 7 2 0 0 0 0 4,000
Hollis VFD 2 2 0 0 0 0 0 150,000
**Holy Cross VFD 0 0 0 0 0 0 0 0
Homer VFD 29 14 15 0 1 0 0 1,772,900
Hoonah VFD 2 2 0 0 3 0 0 105,000
**Hopper Bay VFD 1 1 0 0 0 0 0 200
Hope/Sunrise VFD 1 1 0 1 0 0 0 15,000
Houston FD 16 7 9 0 0 0 0 270,580
Huslia VFD 2 2 0 0 0 0 0 150,500
Igiugug VFD 0 0 0 0 0 0 0 0
Iliamana VFD 0 0 0 0 0 0 0 0
Kachemak Emerg. Services 11 6 5 0 3 0 0 76,000
Kake VFD 1 1 0 0 0 0 0 0
Kenai FD 23 11 12 0 0 0 0 277,150
Kennicott/McCarthy VFD 0 0 0 0 0 0 0 0
**Kenny Lake VFD 2 1 1 1 0 0 0 68,000
Ketchikan FD 32 20 12 0 1 0 0 787,250
Ketchikan Int’l Airport FD 0 0 0 0 0 0 0 0
King Cove Fire & Rescue 3 1 2 0 0 0 0 300
Klawock VFD 6 4 2 0 0 0 1 219,200
** Indicates the Department did NOT report for the full year of 2012.
*** Indicates report(s) was completed by the Division of Fire and Life Safety after a serious incident.
Page 51

Fire In Alaska 2012
2012 Experience by Fire Department
Pressure Rescue Haz. Service Good Intent Special False Aid Total
Ruptures Calls Cond. Calls Calls Inc. Calls Given Calls
0 0 0 0 0 0 0 0 3
0 185 11 78 56 2 35 21 403
0 0 0 0 1 0 0 5 10
0 0 0 0 0 0 0 0 1
0 0 0 0 0 0 0 0 0
2 65 9 1 6 0 0 0 101
0 0 0 0 0 0 0 0 0
0 71 2 14 1 1 12 0 107
0 5 2 0 7 0 4 0 27
0 0 0 0 0 0 0 0 2
0 0 0 0 0 0 0 0 0
2 517 6 7 11 0 18 6 596
0 0 0 0 0 0 0 0 2
0 0 0 0 0 0 0 0 1
0 0 0 0 0 0 0 0 1
0 27 1 4 15 2 13 73 151
0 0 0 0 0 0 0 0 2
0 0 0 0 0 0 0 0 0
0 0 0 0 0 0 0 0 0
0 98 5 7 17 0 3 23 164
0 0 0 0 0 0 0 0 1
0 882 47 79 45 3 70 45 1,194
0 0 0 0 0 0 0 0 0
0 0 0 0 0 0 0 1 3
0 1,027 22 55 81 5 87 0 1,309
0 0 0 0 0 0 0 0 0
0 0 0 0 0 0 0 0 3
0 0 0 0 0 0 0 0 6
Page 52

Fire In Alaska 2012
2012 Experience by Fire Department
Fire Department Name Total Structure Other Civilian Fire Service Fire Dollar
Fires Fires Fires Dths. Inj. Dths. Inj. Loss
Klehini Valley VFD 0 0 0 0 0 0 0 0
Klukwan VFD 0 0 0 0 0 0 0 0
Kokhanok Village Council 0 0 0 0 0 0 0 0
Kwethluk VFD 2 2 0 0 0 0 0 162,000
Lake Louise VFD 0 0 0 0 0 0 0 0
Lowell Point VFD 0 0 0 0 0 0 0 0
***Lower Kalskag VFD 1 1 0 0 1 0 0 225,000
***Mat-Su Borough Other Areas 1 1 0 0 0 0 0 550,000
**Manley Hot Springs VFD 0 0 0 0 0 0 0 0
McGrath VFD 3 3 0 0 0 0 0 450
McKinley VFD 0 0 0 0 0 0 0 0
***Minto, Community of 1 1 0 2 0 0 0 30,000
Moose Pass Vol. Fire Co. 1 0 1 0 0 0 0 13,000
Napaskiak VFD 0 0 0 0 0 0 0 0
Native Village of Karluk 0 0 0 0 0 0 0 0
Naukati VFD 0 0 0 0 0 0 0 0
Nel/Mel VFD 0 0 0 0 0 0 0 0
Nelson Lagoon Fire & Rescue 0 0 0 0 0 0 0 0
**Nenana Fire/EMS Dept. 6 3 3 0 0 0 0 45,500
Newhalen VFD 1 1 0 0 0 0 0 2,000
Nikiski FD 30 18 12 0 0 0 0 1,394,901
**Nikolai FD 0 0 0 0 0 0 0 0
Ninilchik Emergency Services 9 5 4 0 0 0 0 546,750
Nome VFD 24 18 6 1 4 0 3 723,450
North Pole FD 25 12 13 0 0 0 0 68,000
North Slope Borough FD 21 8 13 1 0 0 0 0
North Star VFD 93 42 51 0 1 0 0 1,410,750
North Tongass VFD 11 7 4 0 0 0 0 6,650
** Indicates the Department did NOT report for the full year of 2012.
*** Indicates report(s) was completed by the Division of Fire and Life Safety after a serious incident.
Page 53

Fire In Alaska 2012
2012 Experience by Fire Department
Pressure Rescue Haz. Service Good Intent Special False Aid Total
Ruptures Calls Cond. Calls Calls Inc. Calls Given Calls
0 0 0 0 0 0 0 0 0
0 0 0 0 0 0 0 0 0
0 0 0 0 0 0 0 0 0
0 0 0 0 0 0 0 0 2
0 0 0 0 0 0 0 0 0
0 0 0 0 0 0 0 0 0
0 0 0 0 0 0 0 0 1
0 0 0 0 0 0 0 0 1
0 0 0 0 0 0 0 0 0
0 0 0 0 0 0 0 0 3
0 0 0 0 0 0 0 1 1
0 0 0 0 0 0 0 0 1
0 0 1 0 0 0 0 0 2
0 0 0 0 0 0 0 0 0
0 0 0 0 0 0 0 0 0
0 0 0 0 0 0 0 0 0
0 0 0 0 0 0 0 0 0
0 0 0 0 0 0 0 0 0
0 4 1 0 0 0 0 3 14
0 0 0 0 0 0 0 0 1
2 596 23 165 77 0 19 16 928
0 0 0 0 0 0 0 0 0
0 0 0 0 1 0 0 1 11
5 16 7 3 4 0 15 0 74
1 108 17 11 16 1 24 35 238
2 1,565 13 15 29 1 35 1 1,682
2 557 35 55 129 2 53 45 971
0 123 3 5 9 0 9 5 165
Page 54

Fire In Alaska 2012
2012 Experience by Fire Department
Fire Department Name Total Structure Other Civilian Fire Service Fire Dollar
Fires Fires Fires Dths. Inj. Dths. Inj. Loss
Northwest Arctic Borough FD 14 11 3 0 2 0 0 107,150
Nulato VFD 1 1 0 0 0 0 0 100
Old Harbor VFD 0 0 0 0 0 0 0 0
Ouzinkie VFD 3 2 1 0 1 0 0 12,750
Palmer Fire and Rescue 51 26 25 0 1 0 11 1,978,400
Panguingue VFD 1 1 0 0 0 0 0 1,500
Pedro Bay VFD 0 0 0 0 0 0 0 0
Pelican Volunteer Fire & EMS 0 0 0 0 0 0 0 0
Petersburg VFD 11 8 3 0 0 0 0 228,000
**Pilot Point VFD 0 0 0 0 0 0 0 0
Pilot Station Dept. of Pub. Saf. 3 0 3 0 0 0 0 0
Pogo Mine Fire & Rescue 7 2 5 0 0 0 0 0
Port Alexander VFD 0 0 0 0 0 0 0 0
Port Graham VFD 1 1 0 0 0 0 0 25,000
Port Lions VFD 1 0 1 0 0 0 0 0
Port Protection VFD 0 0 0 0 0 0 0 0
Red Dog Mine Emerg. Svs. 2 1 1 0 0 0 0 38,000
**Ruby VFD 3 0 3 0 0 0 0 0
Rural Deltana VFD 28 11 17 0 0 0 0 1,413,000
Salcha Fire & Rescue 13 4 9 0 0 0 0 88,000
Sand Point VFD 1 1 0 0 0 0 0 40,000
Seldovia Volunteer Fire/Rescue 2 1 1 0 0 0 0 0
Seward FD 13 4 9 0 0 0 0 2,085
Sitka FD 22 15 7 0 1 0 0 37,859
Skagway VFD 7 4 3 0 0 0 0 1,700,000
Slana VFD 0 0 0 0 0 0 0 0
South Tongass VFD 3 2 1 0 1 0 0 260,000
St. George VFD 1 1 0 0 0 0 0 1,400,000
** Indicates the Department did NOT report for the full year of 2012.
*** Indicates report(s) was completed by the Division of Fire and Life Safety after a serious incident.
Page 55

Fire In Alaska 2012
2012 Experience by Fire Department
Pressure Rescue Haz. Service Good Intent Special False Aid Total
Ruptures Calls Cond. Calls Calls Inc. Calls Given Calls
0 0 0 0 0 0 0 0 14
0 0 0 0 0 0 0 0 1
0 0 0 0 0 0 0 0 0
0 0 0 0 0 0 0 0 3
0 1 23 8 56 11 39 61 250
1 0 0 0 0 0 0 0 2
0 0 0 0 0 0 0 0 0
0 0 0 0 0 0 0 0 0
0 3 5 3 5 0 22 0 49
0 0 0 0 0 0 0 0 0
0 0 0 0 0 0 0 0 3
0 0 0 0 0 0 0 0 7
0 0 0 0 0 0 0 0 0
0 0 0 0 0 0 0 0 1
0 0 0 0 0 0 0 0 1
0 0 0 0 0 0 0 0 0
0 0 0 0 0 0 0 0 2
0 0 0 0 0 0 0 0 3
0 24 0 2 13 0 7 12 86
0 0 0 0 2 1 3 0 19
0 0 0 0 0 0 0 0 1
0 29 1 0 0 0 0 0 32
0 187 10 15 24 1 44 10 304
3 16 22 25 9 13 69 1 180
0 155 0 19 4 0 34 0 219
0 0 0 0 0 0 0 0 0
0 108 3 5 8 1 12 7 147
0 0 0 0 0 0 0 0 1
Page 56

Fire In Alaska 2012
2012 Experience by Fire Department
Fire Department Name Total Structure Other Civilian Fire Service Fire Dollar
Fires Fires Fires Dths. Inj. Dths. Inj. Loss
St. Mary’s VFD 1 1 0 1 0 0 0 15,000
St. Paul Dept. of Public Safety 2 2 0 0 0 0 0 10,000,050
Steese Area VFD 35 14 21 0 1 0 0 548,900
Stony River VFD 0 0 0 0 0 0 0 0
Strelna VFD 0 0 0 0 0 0 0 0
Sutton VFD 8 4 4 0 0 0 0 292,000
SVT Barabara Heights FD 0 0 0 0 0 0 0 0
Talkeetna VFD 8 6 2 1 0 0 0 136,000
Tanana VFD 5 1 4 0 0 0 0 610
Ted Stevens Anch. Int'l Airport Police & Fire
20 1 19 0 0 0 0 30
Tenakee Springs Rural FD 0 0 0 0 0 0 0 0
Tetlin VFD 0 0 0 0 0 0 0 0
Thorne Bay VFD 1 1 0 0 0 0 0 0
Togiak VFD 0 0 0 0 0 0 0 0
Tok VFD 6 5 1 0 0 0 0 17,000
Toksook Bay VFD 0 0 0 0 0 0 0 0
Tolsona FD 0 0 0 0 0 0 0 0
Tri-Valley VFD 18 4 14 0 0 0 0 59,000
Unalakleet VFD 0 0 0 0 0 0 0 0
Unalaska Fire/EMS 6 3 3 0 0 0 0 0
University FD 79 33 46 0 2 0 0 383,755
Valdez FD 16 11 5 0 2 0 3 886,400
Venetie VFD 0 0 0 0 0 0 0 0
West Lakes FD 56 26 30 0 0 0 0 897,900
Whale Pass VFD 1 0 1 0 0 0 0 0
White Mountain VFD 1 1 0 0 0 0 0 25,000
Whittier VFD 5 3 2 0 1 0 0 14,000
Willow VFD 18 11 7 1 7 0 1 363,200
** Indicates the Department did NOT report for the full year of 2012.
*** Indicates report(s) was completed by the Division of Fire and Life Safety after a serious incident.
Page 57

Fire In Alaska 2012
2012 Experience by Fire Department
Pressure Rescue Haz. Service Good Intent Special False Aid Total
Ruptures Calls Cond. Calls Calls Inc. Calls Given Calls
0 0 0 0 0 0 0 0 1
0 0 0 0 0 0 0 0 2
1 179 14 9 58 1 10 33 340
0 0 0 0 0 0 0 0 0
0 0 0 0 0 0 0 0 0
0 26 0 2 24 0 5 6 71
0 0 0 0 0 0 0 0 0
0 5 0 1 3 1 11 8 37
0 0 0 0 0 0 0 0 5
0 322 91 42 3 0 15 0 493
0 0 0 0 0 0 0 0 0
0 0 0 0 0 0 0 0 0
0 0 0 0 0 0 0 0 1
0 0 0 0 0 0 0 0 0
0 0 2 0 6 0 0 0 14
0 0 0 0 0 0 0 0 0
0 0 0 0 0 0 0 0 0
0 0 0 0 1 0 13 0 32
0 0 0 0 0 0 0 0 0
0 3 5 5 9 0 7 0 35
3 946 30 41 81 0 177 192 1,549
0 237 29 30 25 0 57 0 394
0 0 0 0 0 0 0 0 0
0 147 29 47 71 11 44 78 483
0 0 0 0 0 0 0 0 1
0 0 0 0 0 0 0 0 1
0 0 0 0 0 0 0 0 5
0 66 15 0 6 4 9 60 178
Page 58

Fire In Alaska 2012
2012 Experience by Fire Department
Fire Department Name Total Structure Other Civilian Fire Service Fire Dollar
Fires Fires Fires Dths. Inj. Dths. Inj. Loss
Womens Bay VFD 7 2 5 0 0 0 0 6,320
**Wrangell VFD 5 3 2 0 0 0 0 3,000
Yakutat VFD 0 0 0 0 0 0 0 0
Total Reported Calls 2,560 1,237 1,323 23 79 0 49 $55,157,363
** Indicates the Department did NOT report for the full year of 2012.
*** Indicates report(s) was completed by the Division of Fire and Life Safety after a serious incident.
Page 59

Fire In Alaska 2012
2012 Experience by Fire Department
Pressure Rescue Haz. Service Good Intent Special False Aid Total
Ruptures Calls Cond. Calls Calls Inc. Calls Given Calls
0 8 1 2 4 0 3 3 28
0 1 0 1 2 0 1 0 10
0 0 0 0 0 0 0 0 0
57 36,839 1,710 3,728 7,397 223 4,689 1,356 58,559
Total Exposures 84
Total FD Incidents 58,643
Page 60


