

Page 837
Design and Analysis of Cyclone Separator Chittamplly Mahender
M.Tech,
Dept of Mechanical Engineering,
AVN Institute of Engineering and Technology,
Hyderabad, T.S, India.
A.Praveena
Assistant Professor,
Dept of Mechanical Engineering,
AVN Institute of Engineering and Technology,
Hyderabad, T.S, India.
Abstract:
The gas-solids cyclone separator is industrial
equipment that has been widely used. Due to its
industrial relevance, a large number of computational
studies have been reported in the literature aimed at
understanding and predicting the performance of
cyclones in terms of pressure and velocity variation.
One of the approaches is to simulate the gas-particle
flow field in a cyclone by computational fluid
dynamics (CFD). Cyclones have often been regarded
as low-efficiency collectors. However, efficiency
varies greatly with particle size and cyclone design.
Advanced design work has greatly improved cyclone
performance. This paper have discussed the design
parameters required to construct a high performing
cyclone through the application of the classical
cyclone design, However, the pressure drop in this
design does not consider any vertical dimensions as
contributing to pressure drop, This is a misleading in
that a tall cyclone would have the same pressure drop
as a short one as long as cyclone inlets and outlets
dimensions and inlet velocities are the same.
I. INTRODUCTION
Dust Collectors
There are four principal types of industrial dust
collectors namely, inertial separators, fabric collectors,
wet scrubbers and electrostatic precipitators. The
inertial separators separate dust from gas streams using
a combination of forces, such as centrifugal,
gravitational, and inertial. These forces move the dust
to an area where the forces exerted by the gas stream
are minimal. The separated dust is moved by gravity
into a hopper, where it is temporarily stored. The three
primary types of inertial separators are settling
chambers, baffle chambers, and centrifugal collectors
(e.g. cyclone separator). Cyclone separator is a method
of removing particulate from an air, gas or liquid
stream without the use of filters, through vortex
separation. Rotational effects and gravity are used to
separate mixtures of solids ands fluids. The method
can also be used to separate fine droplets of liquid
from a gaseous stream. A high speed rotating (air)
flow is established within cylindrical or conical
containers called a cyclone. Air flows in a helical
pattern, beginning at the top (wide end) of the cyclone
and ending at the bottom (narrow) end before exiting
the cyclone in a straight stream through the centre of
this cyclone and out the top.
Larger (denser) particles in rotating stream have too
much inertia to follow the tight curve of fall to the
bottom of the cyclone where they can fall to the
bottom of the stream, and strike the outside wall, then
fall to the bottom of the cyclone where they can be
removed. In a conical system, as the cyclone, the
rotational radius of the stream is reduced, thus
separating smaller particles. The cyclone geometry,
together with flow rate, defined the cut point of the
cyclone. This is the size of particle that will be
removed from the stream with 50% efficiency.
Particles larger than the cut point will be removed with
a greater efficiency and smaller particles with a lower
efficiency.
Principles of Cyclone Separation
In centrifugal devices, the dust-laden gas is initially
brought into a swirling motion. The dust particles are
slung outward to the wall, and transported downward
to the dust outlet by the downwardly directed gas flow
near the wall.
Page 838
II. CYCLONE DESIGN
Cyclone Design Procedure
The cyclone design procedure outlined in Cooper and
Alley (1994), hereafter referred to as the classical
cyclone design (CCD) process, was developed by
Lapple in the early 1950s. The CCD process (the
Lapple model) is perceived as a standard method and
has been considered by some engineers to be
acceptable. However, there are several problems
associated with this design procedure. First of all, the
CCD process does not consider the cyclone inlet
velocity in developing cyclone dimensions. It was
reported (Parnell, 1996) that there is an “ideal” inlet
velocity for the different cyclone designs for optimum
cyclone performance. Secondly, the CCD does not
predict the correct number of turns for different type
cyclones. The overall efficiency predicted by the CCD
process is incorrect because of the inaccurate fractional
efficiency curve generated by the CCD process
(Kaspar et al. 1993).
In order to use the CCD process, it is assumed that the
design engineer will have knowledge of (1) flow
conditions, (2) particulate matter (PM) concentrations
and particle size distribution (PSD) and (3) the type of
cyclone to be designed (high efficiency, conventional,
or high throughput). The PSD must be in the form of
mass fraction versus aerodynamic equivalent diameter
of the PM. The cyclone type will provide all principle
dimensions as a function of the cyclone barrel
diameter (D).
Classification of Study Approaches
There is a widespread literature on the effect of
cyclone geometry on performance, using one or more
of the four main approaches of study, which are:
1. Analytical methods (mathematical models), which
can be classified into:
(a) Theoretical and semi-empirical models (b)
statistical models
2. Experimental measurements
3. Computational fluid dynamics (CFD) simulations
III. MODELLING
THE STAIRMAND OPTIMIZED DESIGN
Stairmand conducted so many experiments on the
cyclone separator and finally developed the optimized
geometrical ratios. By considering this geometric
ratio’s the modeling of the cyclone done in solid
works.
TABLE 1: Cyclone geometry used in this
simulation (stairmand optimized design)
Geometry a/D b
/D
D
x/D
S
/D
h
/D
H
/D
B /D
Stairmand
High
Efficiency
0.5 0.2 0.5 0.5 1.5 4 0.375
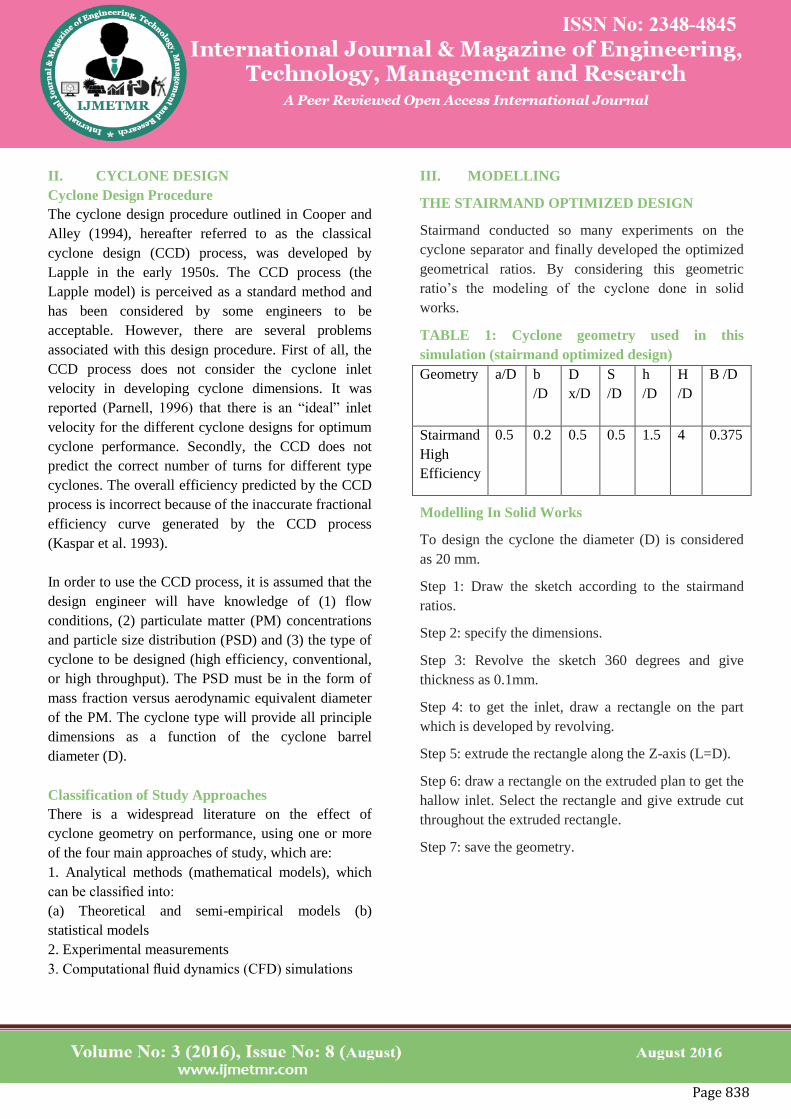
Modelling In Solid Works
To design the cyclone the diameter (D) is considered
as 20 mm.
Step 1: Draw the sketch according to the stairmand
ratios.
Step 2: specify the dimensions.
Step 3: Revolve the sketch 360 degrees and give
thickness as 0.1mm.
Step 4: to get the inlet, draw a rectangle on the part
which is developed by revolving.
Step 5: extrude the rectangle along the Z-axis (L=D).
Step 6: draw a rectangle on the extruded plan to get the
hallow inlet. Select the rectangle and give extrude cut
throughout the extruded rectangle.
Step 7: save the geometry.
Page 839
Fig 1: design of cyclone separator
Fig 2: half sectional view of cyclone
Fig 3: Top view of cyclone
IV. CFD ANALYSIS
Stairmand’s Optimized Design Analysis
Cyclone Geometry
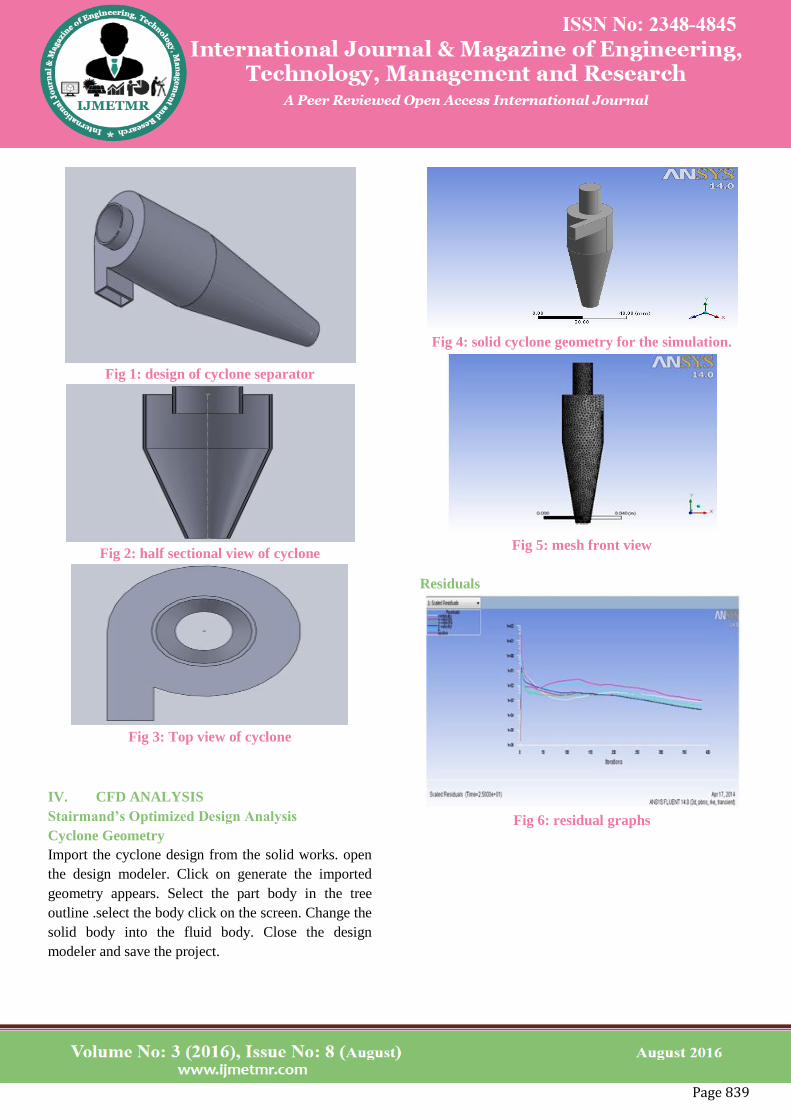
Import the cyclone design from the solid works. open
the design modeler. Click on generate the imported
geometry appears. Select the part body in the tree
outline .select the body click on the screen. Change the
solid body into the fluid body. Close the design
modeler and save the project.
Fig 4: solid cyclone geometry for the simulation.
Fig 5: mesh front view
Residuals
Fig 6: residual graphs
Page 840
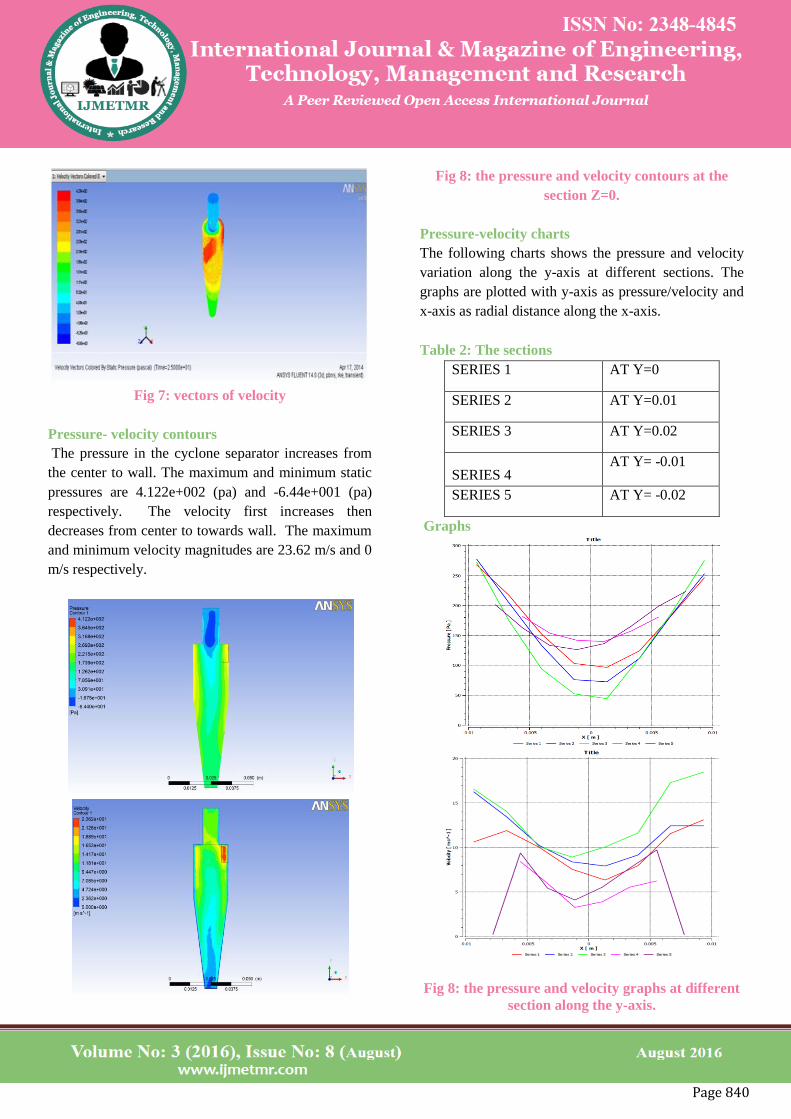
Fig 7: vectors of velocity
Pressure- velocity contours
The pressure in the cyclone separator increases from
the center to wall. The maximum and minimum static
pressures are 4.122e+002 (pa) and -6.44e+001 (pa)
respectively. The velocity first increases then
decreases from center to towards wall. The maximum
and minimum velocity magnitudes are 23.62 m/s and 0
m/s respectively.
Fig 8: the pressure and velocity contours at the
section Z=0.
Pressure-velocity charts
The following charts shows the pressure and velocity
variation along the y-axis at different sections. The
graphs are plotted with y-axis as pressure/velocity and
x-axis as radial distance along the x-axis.
Table 2: The sections
SERIES 1 AT Y=0
SERIES 2 AT Y=0.01
SERIES 3 AT Y=0.02
SERIES 4 AT Y= -0.01
SERIES 5 AT Y= -0.02
Graphs
Fig 8: the pressure and velocity graphs at different
section along the y-axis.
Page 841
The stairman’s optimized design results are shown in
above graphs. To study the variations in pressure and
velocity 5 different sections are created along the y-
axis as shown in the table 2.
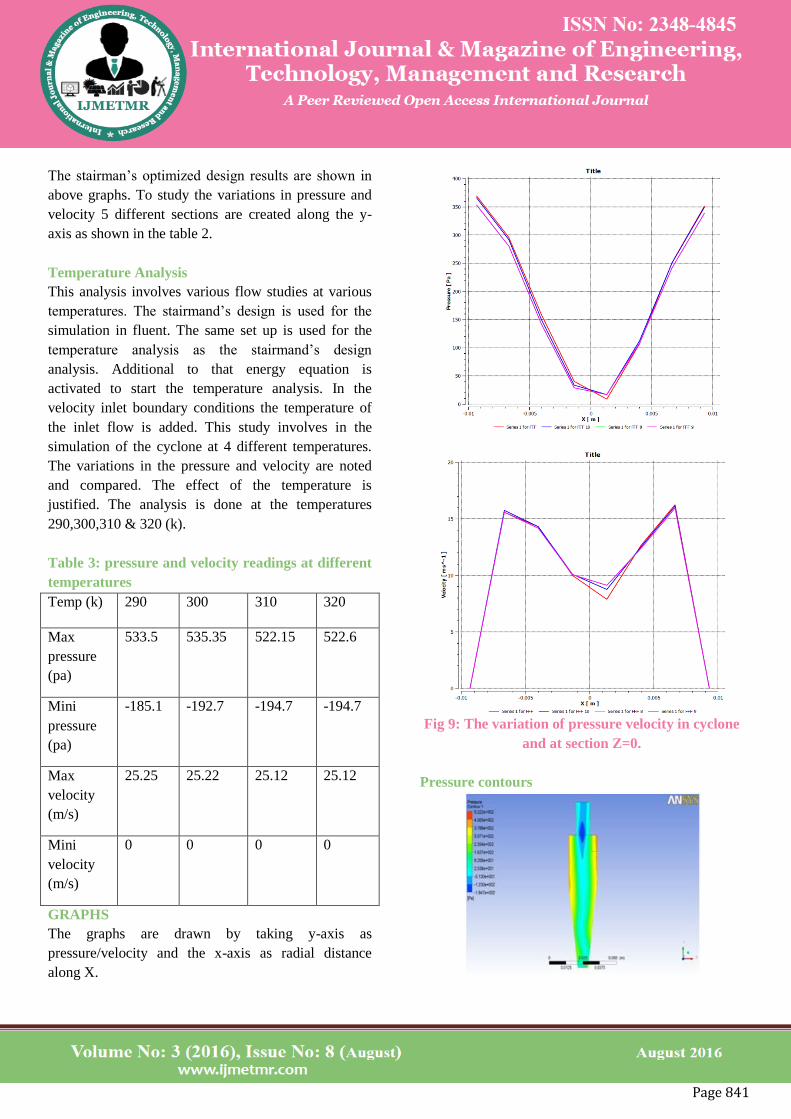
Temperature Analysis
This analysis involves various flow studies at various
temperatures. The stairmand’s design is used for the
simulation in fluent. The same set up is used for the
temperature analysis as the stairmand’s design
analysis. Additional to that energy equation is
activated to start the temperature analysis. In the
velocity inlet boundary conditions the temperature of
the inlet flow is added. This study involves in the
simulation of the cyclone at 4 different temperatures.
The variations in the pressure and velocity are noted
and compared. The effect of the temperature is
justified. The analysis is done at the temperatures
290,300,310 & 320 (k).
Table 3: pressure and velocity readings at different
temperatures
Temp (k) 290 300 310 320
Max
pressure
(pa)
533.5 535.35 522.15 522.6
Mini
pressure
(pa)
-185.1 -192.7 -194.7 -194.7
Max
velocity
(m/s)
25.25 25.22 25.12 25.12
Mini
velocity
(m/s)
0 0 0 0
GRAPHS
The graphs are drawn by taking y-axis as
pressure/velocity and the x-axis as radial distance
along X.
Fig 9: The variation of pressure velocity in cyclone
and at section Z=0.
Pressure contours

Page 842
Fig 10: variation of pressure along the radial
distance (x-axis) at z=0
Velocity contours
Fig 11: variation of velocity along the radial
distance (x-axis) at z=0.
The results are concluded that the cone height has
significant effect on the performance of the cyclone.
The pressure in the cyclone varies along the X-axis as
shown in the contours. The pressure first decreases and
then increases. The minimum pressure occurs at the
mid section (x=0). The graph shows the variation in
the pressure along the radial direction. The curve is in
U shape explains the decrease and increase of pressure.
The velocity in the cyclone first increase from the
centre and then decreases at the wall.

Page 843
The curve will be in M shape or reversed W shape.
The velocity is high at the middle portion of the center
and the wall.The variation in the flow temperature
slightly varies the pressure for every 20k. The velocity
of the flow doesn’t vary with the temperature. So we
can say that the temperature cannot affect the
performance of the cyclone because of the slight
variations we can neglect the effect of temperature.
The Analysis of Stairmand’s Design with Collector
The collector is the attachment to the cyclone where
the particles are collected. Collector is of any shape
(ex: cube, cylindrical). It locates at the end of the cone
tip and it prevents the re-entertainment of particles. In
this analysis a cube shaped collector is provided at the
bottom (with dimensions 15mm*15mm*15mm). The
same set up is used to simulate the cyclone with
collector.
Cyclone Geometry with Collector
Fig 12: geometry of cyclone with collector
Meshing Of the Cyclone with Collector
Fig 13: mesh of the cyclone with collector
The solution of the simulation of the cyclone with
collector is compared with the cyclone without
collector. The variations in pressure and velocity are
noted and compared & the cyclone performance is
justified.
Table 4: the pressure and velocity readings
Without
collector
With collector
Max pressure
(pa)
418.5 403.4
Mini pressure
(pa)
-66.28 -55.11
Max velocity
(m/s)
23.65 23.5
Mini velocity
(m/s)
0 0
Graphs
The graphs are drawn by taking the y-axis as
pressure/velocity and x-axis as radial distance along X
Page 844
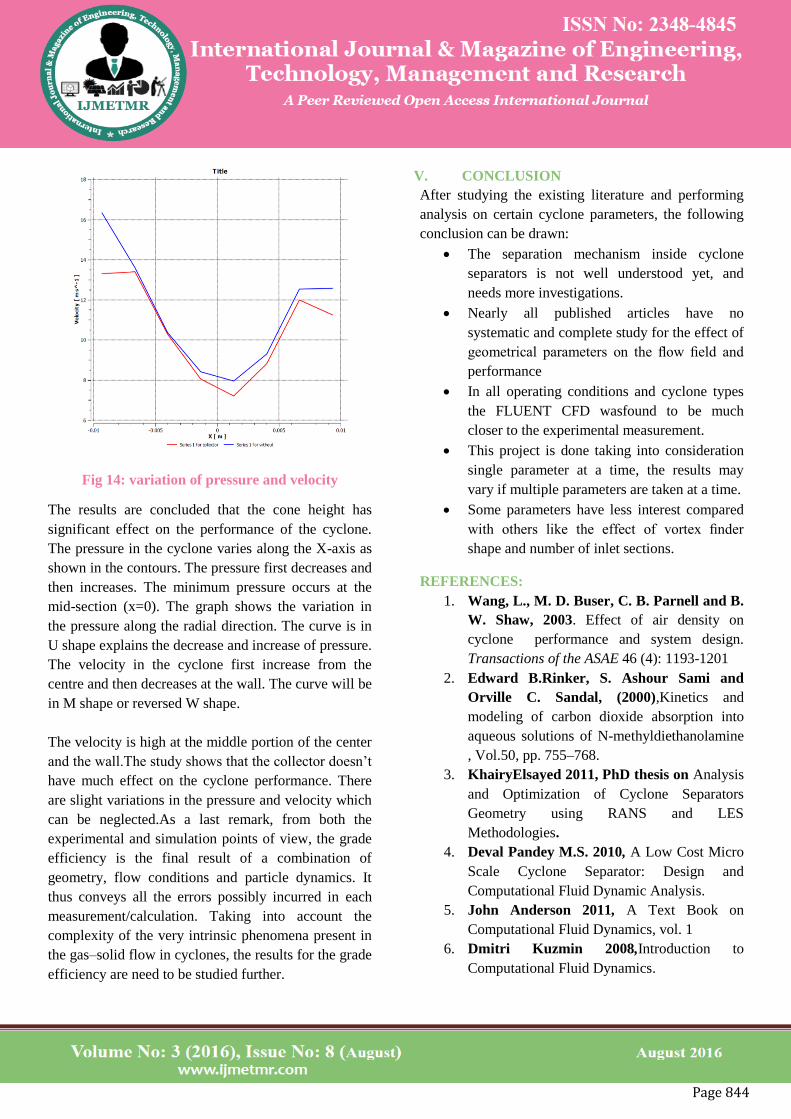
Fig 14: variation of pressure and velocity
The results are concluded that the cone height has
significant effect on the performance of the cyclone.
The pressure in the cyclone varies along the X-axis as
shown in the contours. The pressure first decreases and
then increases. The minimum pressure occurs at the
mid-section (x=0). The graph shows the variation in
the pressure along the radial direction. The curve is in
U shape explains the decrease and increase of pressure.
The velocity in the cyclone first increase from the
centre and then decreases at the wall. The curve will be
in M shape or reversed W shape.
The velocity is high at the middle portion of the center
and the wall.The study shows that the collector doesn’t
have much effect on the cyclone performance. There
are slight variations in the pressure and velocity which
can be neglected.As a last remark, from both the
experimental and simulation points of view, the grade
efficiency is the final result of a combination of
geometry, flow conditions and particle dynamics. It
thus conveys all the errors possibly incurred in each
measurement/calculation. Taking into account the
complexity of the very intrinsic phenomena present in
the gas–solid flow in cyclones, the results for the grade
efficiency are need to be studied further.
V. CONCLUSION
After studying the existing literature and performing
analysis on certain cyclone parameters, the following
conclusion can be drawn:
The separation mechanism inside cyclone
separators is not well understood yet, and
needs more investigations.
Nearly all published articles have no
systematic and complete study for the effect of
geometrical parameters on the flow field and
performance
In all operating conditions and cyclone types
the FLUENT CFD wasfound to be much
closer to the experimental measurement.
This project is done taking into consideration
single parameter at a time, the results may
vary if multiple parameters are taken at a time.
Some parameters have less interest compared
with others like the effect of vortex finder
shape and number of inlet sections.
REFERENCES:
1. Wang, L., M. D. Buser, C. B. Parnell and B.
W. Shaw, 2003. Effect of air density on
cyclone performance and system design.
Transactions of the ASAE 46 (4): 1193-1201
2. Edward B.Rinker, S. Ashour Sami and
Orville C. Sandal, (2000),Kinetics and
modeling of carbon dioxide absorption into
aqueous solutions of N-methyldiethanolamine
, Vol.50, pp. 755–768.
3. KhairyElsayed 2011, PhD thesis on Analysis
and Optimization of Cyclone Separators
Geometry using RANS and LES
Methodologies.
4. Deval Pandey M.S. 2010, A Low Cost Micro
Scale Cyclone Separator: Design and
Computational Fluid Dynamic Analysis.
5. John Anderson 2011, A Text Book on
Computational Fluid Dynamics, vol. 1
6. Dmitri Kuzmin 2008,Introduction to
Computational Fluid Dynamics.

Page 845
Author’s Details:
Chittamplly Mahender
M.Tech,
Dept of Mechanical Engineering,
AVN Institute of Engineering and Technology,
Hyderabad, T.S, India.


