
Argonne National Laboratory is managed by The University of Chicago for the U.S. Department of Energy
Design ReviewSR BPM Upgrade
Tony Pietryla
December 2, 2005
2
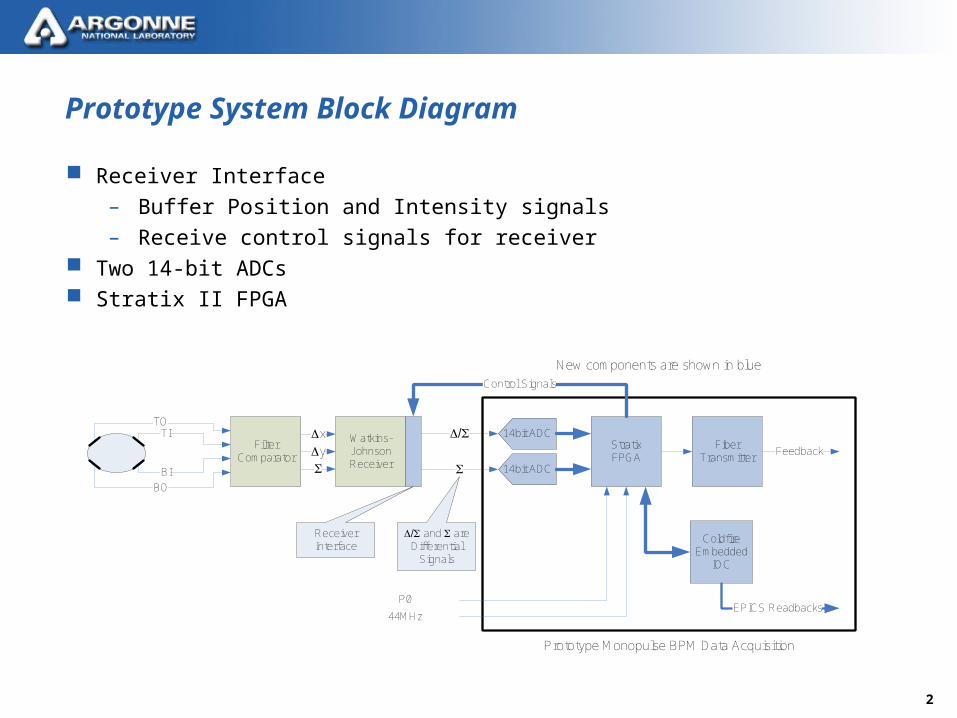
Prototype System Block Diagram
Receiver Interface– Buffer Position and Intensity signals– Receive control signals for receiver
Two 14-bit ADCs Stratix II FPGA
Watkins-Johnson Receiver
Filter Comparator
TOTI
BO
BI
DxDyS
Stratix FPGA
14bit ADC
14bit ADC
D/S
Coldfire Embedded
IOC
EPICS Readbacks
Fiber Transmitter
SFeedback
Prototype Monopulse BPM Data Acquisition
P0
44MHz
D/S and S are Differential
Signals
Receiver Interface
Control Signals
New components are shown in blue

3
Prototype Data Acquisition Chassis
Coldfire IOC
Stratix II FPGA
2 Channel
ADC

4
Prototype Receiver Interface
Backplane
Receiver Interface
Receiver Housing/Heatsin
k
Receiver

5
Lab Test Setup
Tests performed with:
1. CW signal from generator, Dx & Dy terminated on receiver, or
2. 100Hz tone applied to ADC inputs
Power Divider
Watkins-Johnson Receiver
Filter Comparator
TOTI
BOBI
DxDyS
14bit ADC
14bit ADC
D/S
Coldfire Embedded
IOC
EPICS Readbacks
Fiber Transmitter
SFeedback
Prototype Monopulse BPM Data Acquisition
Signal Generator
Stratix FPGA
P0
44MHz
D/S and S are Differential
Signals
Receiver Interface
Control Signals
New components are shown in blue
6
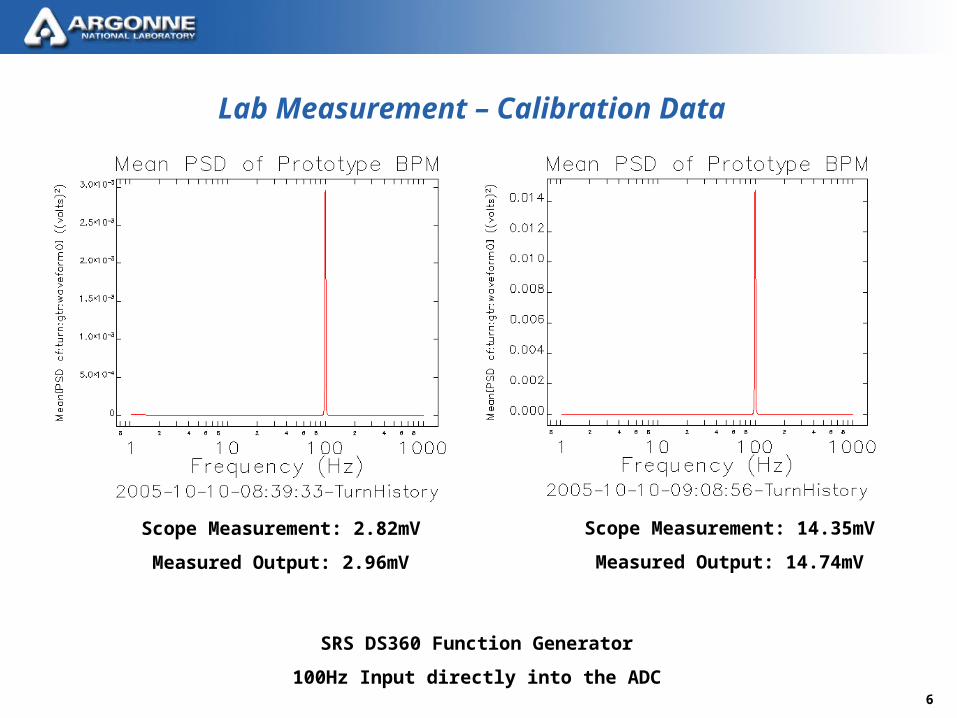
SRS DS360 Function Generator
100Hz Input directly into the ADC
Lab Measurement – Calibration Data
Scope Measurement: 2.82mV
Measured Output: 2.96mV
Scope Measurement: 14.35mV
Measured Output: 14.74mV
7
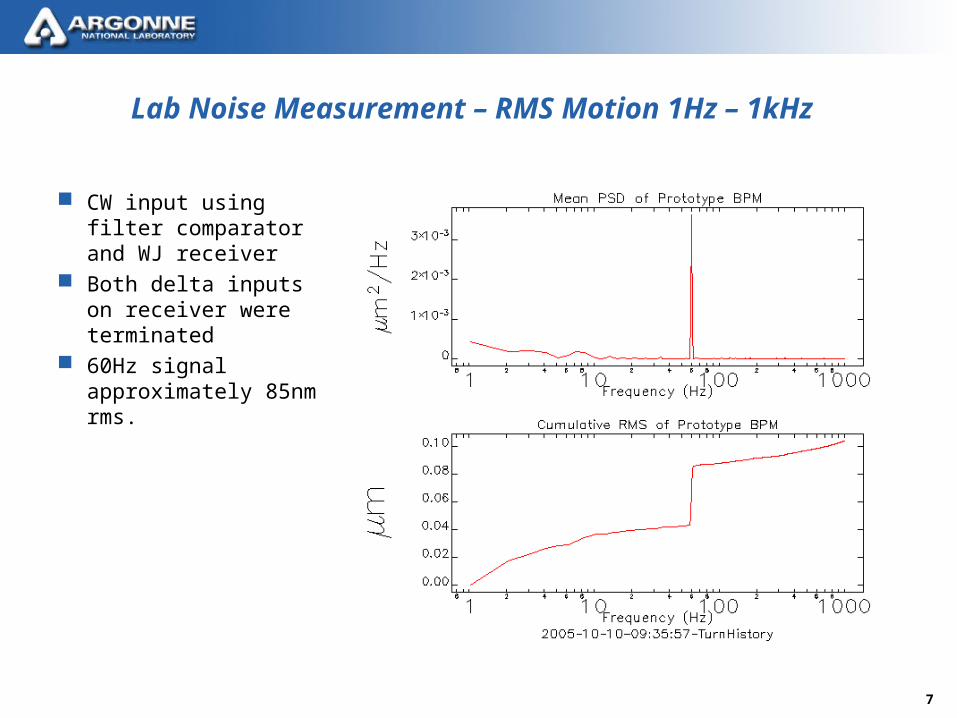
Lab Noise Measurement – RMS Motion 1Hz – 1kHz
CW input using filter comparator and WJ receiver
Both delta inputs on receiver were terminated
60Hz signal approximately 85nm rms.
8
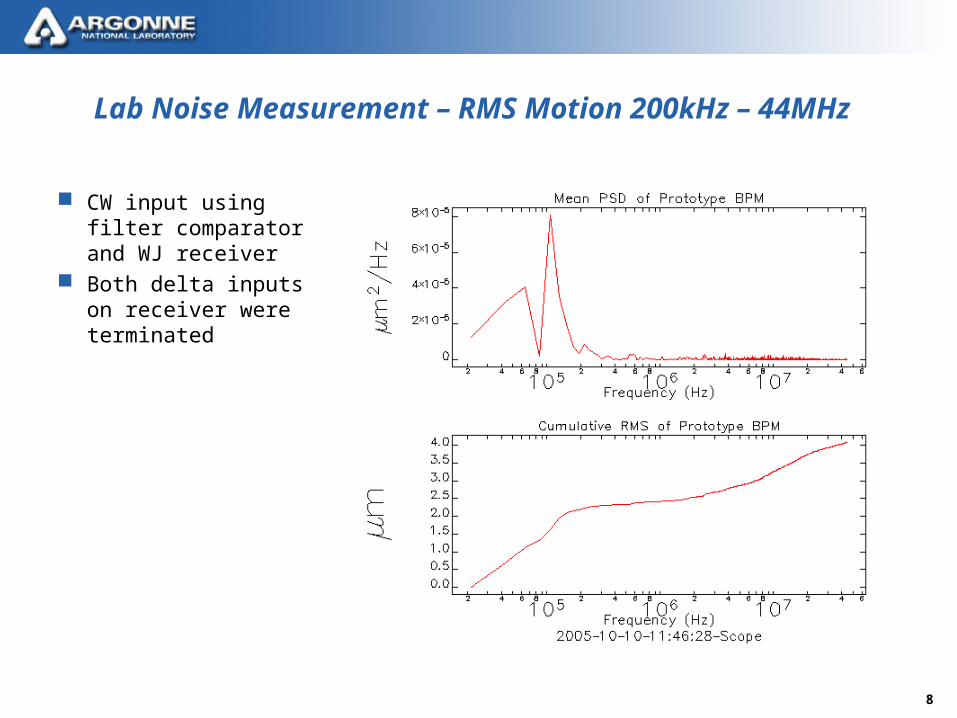
Lab Noise Measurement – RMS Motion 200kHz – 44MHz
CW input using filter comparator and WJ receiver
Both delta inputs on receiver were terminated
9
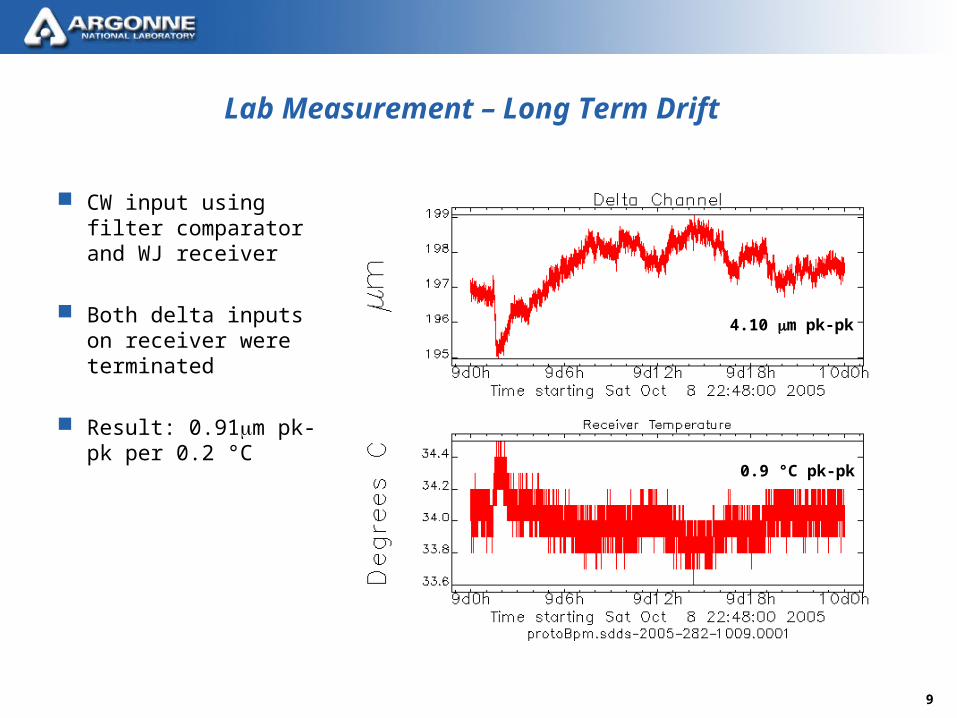
Lab Measurement – Long Term Drift
CW input using filter comparator and WJ receiver
Both delta inputs on receiver were terminated
Result: 0.91m pk-pk per 0.2 °C
4.10 m pk-pk
0.9 °C pk-pk
10
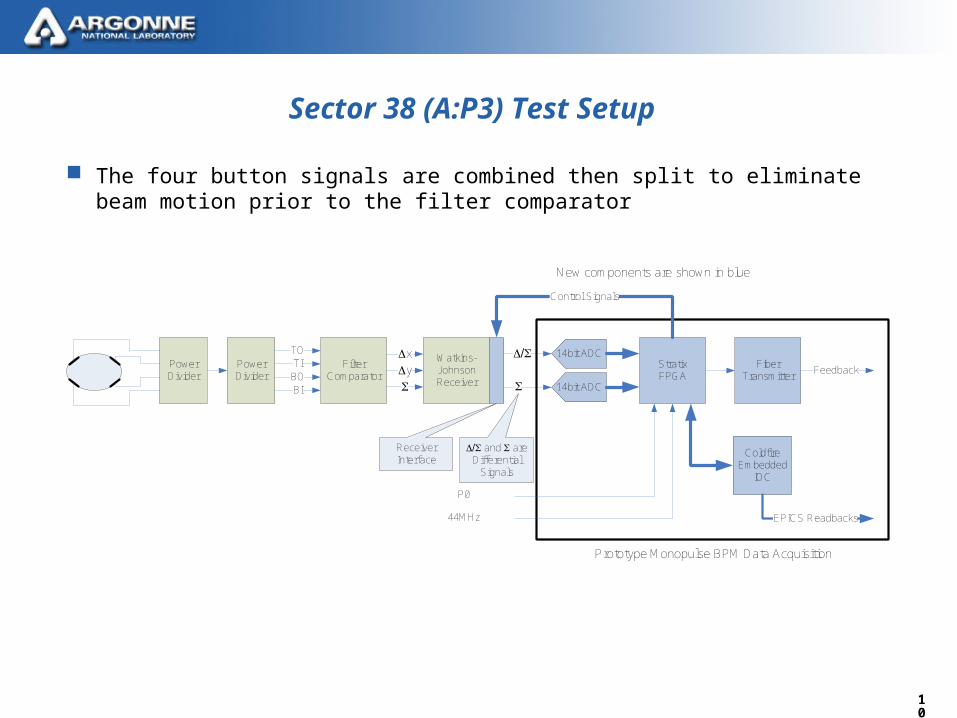
Sector 38 (A:P3) Test Setup
The four button signals are combined then split to eliminate beam motion prior to the filter comparator
Power Divider
Watkins-Johnson Receiver
Filter Comparator
TOTIBOBI
DxDyS
Stratix FPGA
14bit ADC
14bit ADC
D/S
Coldfire Embedded
IOC
EPICS Readbacks
Fiber Transmitter
SFeedback
Prototype Monopulse BPM Data Acquisition
Power Divider
P0
44MHz
D/S and S are Differential
Signals
Receiver Interface
Control Signals
New components are shown in blue

11
Beam Based Calibration
All resolution numbers and graphs were converted to m using a calculated value of 14.28 m/mV
Experiments were performed to determine the calibration of the prototype unit by changing a corrector and measuring the response
Measured response of S35A:P3, S37A:P3 and prototype connected to S38A:P3 buttons
Took average of S35A:P3 and S37A:P3 responses and applied to S38A:P3
14-bit ADC resolution = 122.07V/count
Result:
– Horizontal = 15.3 m/mV
– Vertical = 17.5 m/mV
12
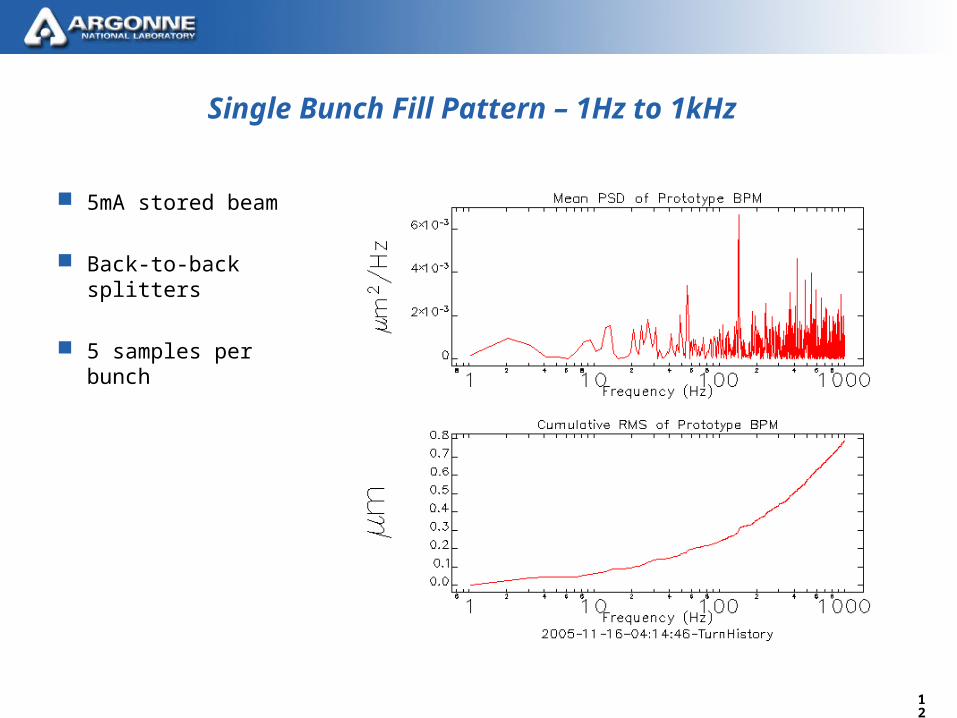
Single Bunch Fill Pattern – 1Hz to 1kHz
5mA stored beam
Back-to-back splitters
5 samples per bunch

13
24 Bunch Fill Pattern – 1Hz to 1kHz
102mA stored beam
Back-to-back splitters
4 samples per bunch

14
324 Bunch Fill Pattern – 1Hz to 1kHz
102mA stored beam
Back-to-back splitters
All samples used
15
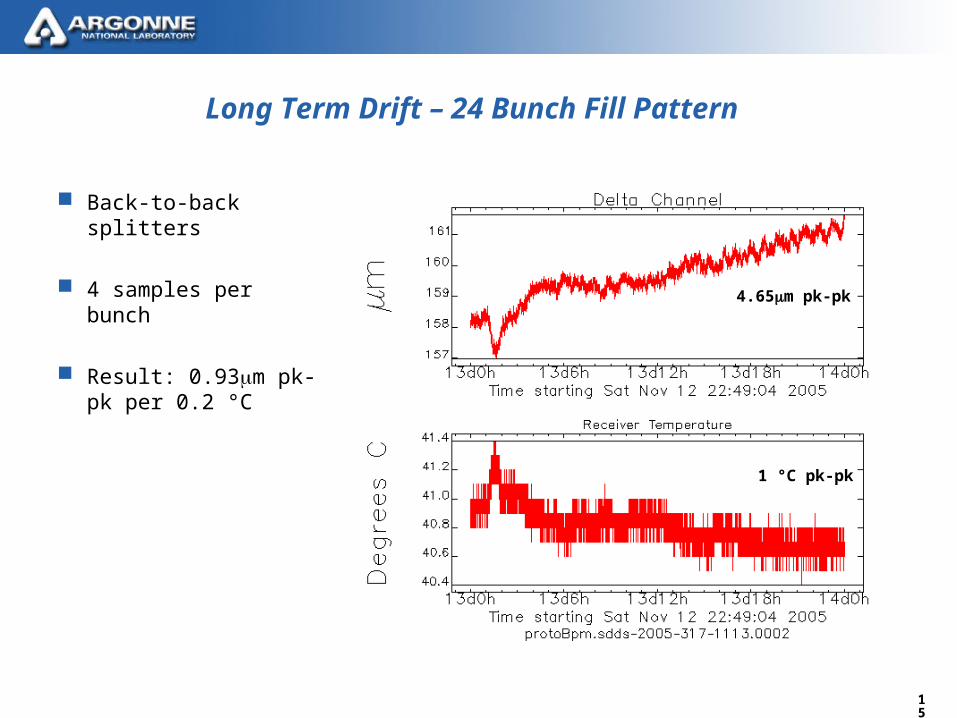
Long Term Drift – 24 Bunch Fill Pattern
Back-to-back splitters
4 samples per bunch
Result: 0.93m pk-pk per 0.2 °C
4.65m pk-pk
1 °C pk-pk
16
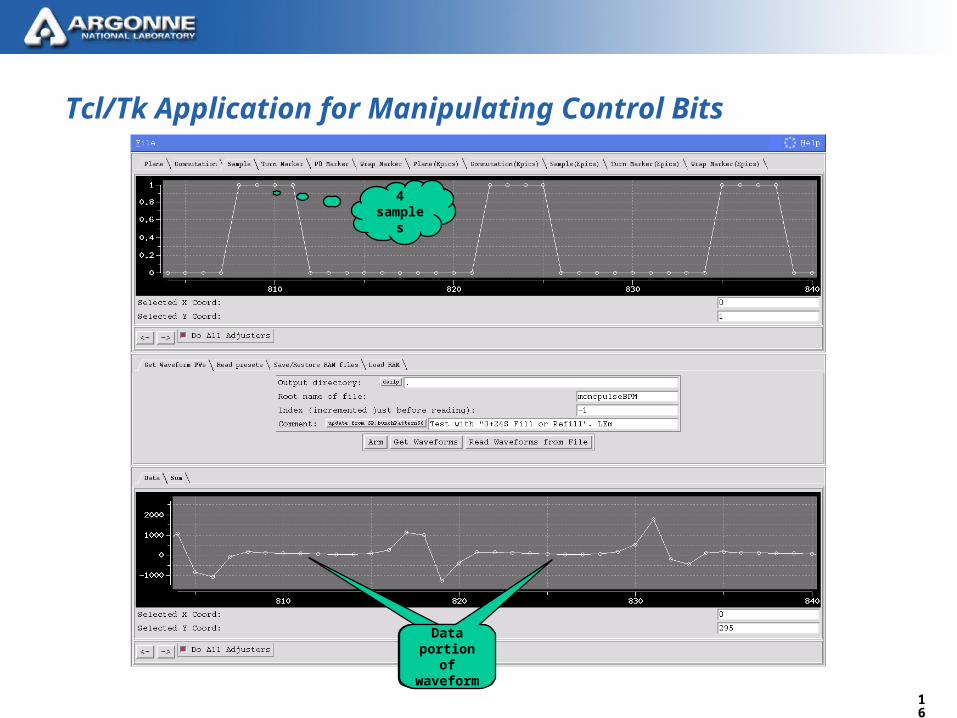
Tcl/Tk Application for Manipulating Control Bits
4 sample
s
Data portion of waveform
Data portion of waveform
17
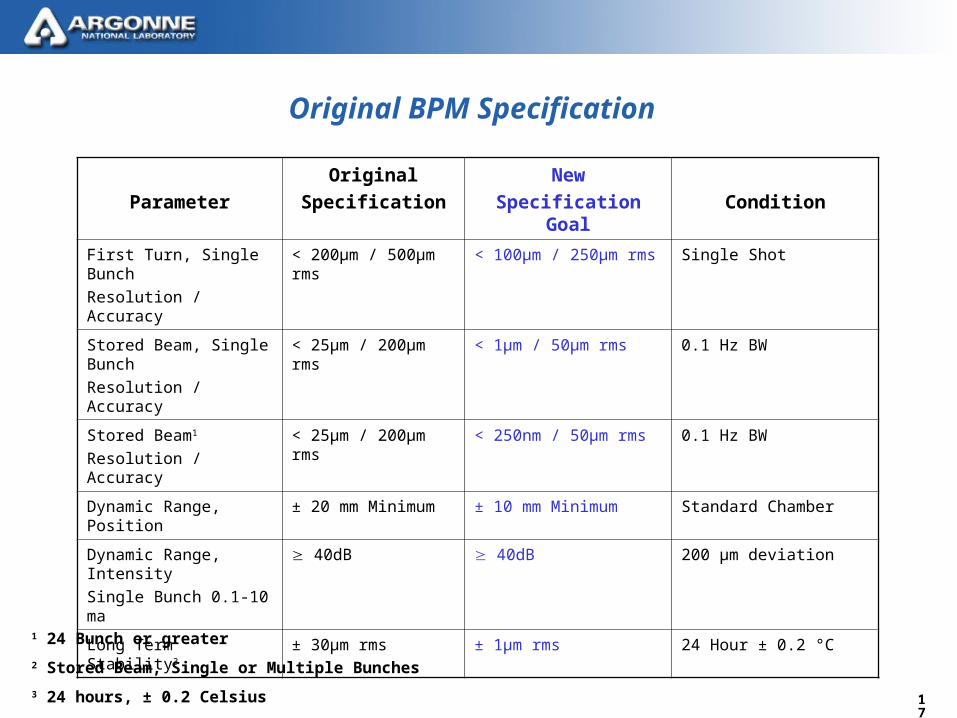
Original BPM Specification
Parameter
Original
Specification
New
Specification Goal Condition
First Turn, Single Bunch
Resolution / Accuracy
< 200μm / 500μm rms < 100μm / 250μm rms Single Shot
Stored Beam, Single Bunch
Resolution / Accuracy
< 25μm / 200μm rms < 1μm / 50μm rms 0.1 Hz BW
Stored Beam1
Resolution / Accuracy
< 25μm / 200μm rms < 250nm / 50μm rms 0.1 Hz BW
Dynamic Range, Position ± 20 mm Minimum ± 10 mm Minimum Standard Chamber
Dynamic Range, Intensity
Single Bunch 0.1-10 ma
40dB 40dB 200 μm deviation
Long Term Stability3 ± 30μm rms ± 1μm rms 24 Hour ± 0.2 °C
1 24 Bunch or greater
2 Stored Beam, Single or Multiple Bunches
3 24 hours, ± 0.2 Celsius
18
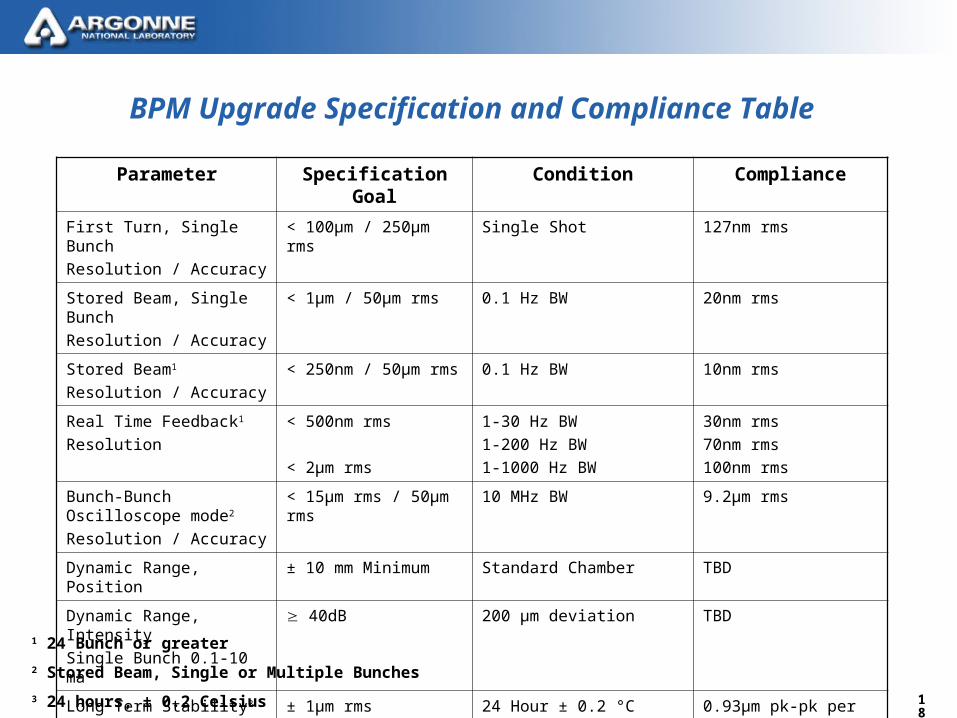
BPM Upgrade Specification and Compliance Table
Parameter Specification Goal Condition Compliance
First Turn, Single Bunch
Resolution / Accuracy
< 100μm / 250μm rms Single Shot 127nm rms
Stored Beam, Single Bunch
Resolution / Accuracy
< 1μm / 50μm rms 0.1 Hz BW 20nm rms
Stored Beam1
Resolution / Accuracy
< 250nm / 50μm rms 0.1 Hz BW 10nm rms
Real Time Feedback1
Resolution
< 500nm rms
< 2μm rms
1-30 Hz BW
1-200 Hz BW
1-1000 Hz BW
30nm rms
70nm rms
100nm rms
Bunch-Bunch Oscilloscope mode2
Resolution / Accuracy
< 15μm rms / 50μm rms 10 MHz BW 9.2μm rms
Dynamic Range, Position ± 10 mm Minimum Standard Chamber TBD
Dynamic Range, Intensity
Single Bunch 0.1-10 ma
40dB 200 μm deviation TBD
Long Term Stability3 ± 1μm rms 24 Hour ± 0.2 °C 0.93μm pk-pk per 0.2 °C
1 24 Bunch or greater
2 Stored Beam, Single or Multiple Bunches
3 24 hours, ± 0.2 Celsius


