
®
IBM Software Group
© 2007 IBM Corporation
Designing your BI Architecture
Exploiting your Data Warehouse
David Cope
EDW Architect – Asia Pacific
IBM Software Group
2
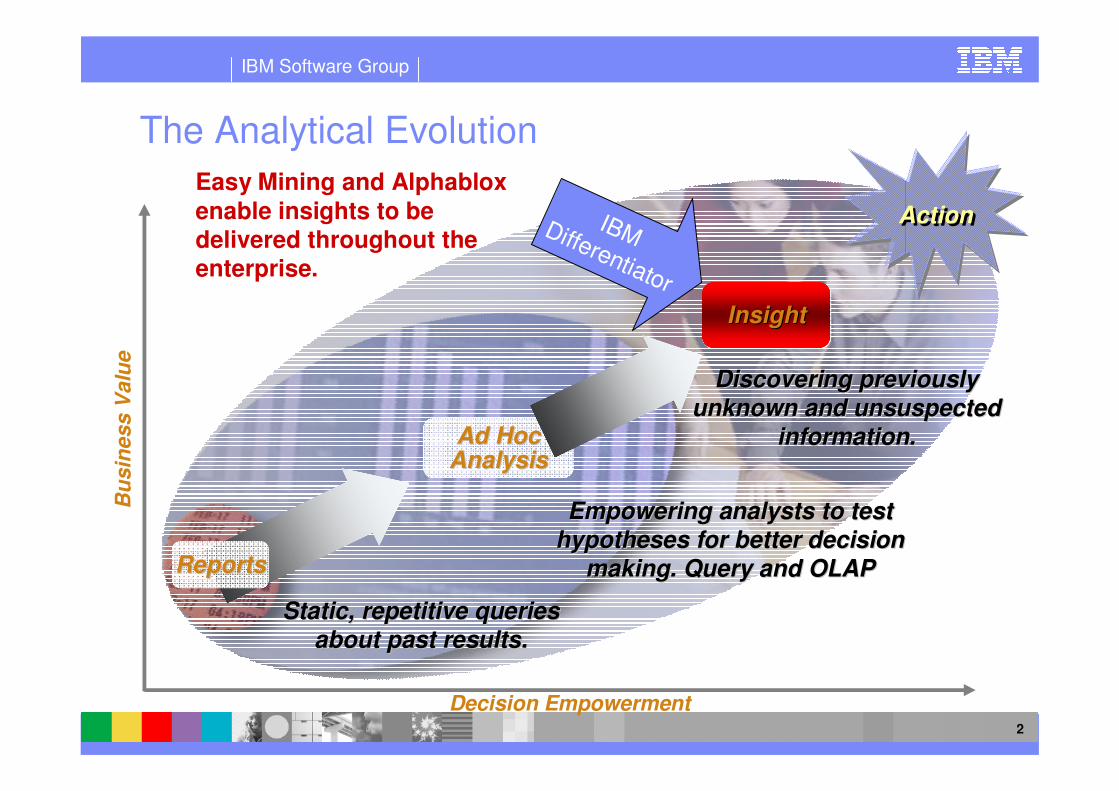
Ad HocAd HocAnalysisAnalysis
Bu
sin
ess V
alu
e
Decision Empowerment
ReportsReports
Static, repetitive queries Static, repetitive queries
about past results. about past results.
Empowering analysts to test Empowering analysts to test
hypotheses for better decision hypotheses for better decision
making. Query and OLAP making. Query and OLAP
Discovering previously Discovering previously
unknown and unsuspected unknown and unsuspected
information.information.
The Analytical Evolution
InsightInsight
ActionActionIBMDifferentiator
Easy Mining and Alphablox
enable insights to be
delivered throughout the
enterprise.
InsightInsight

IBM Software Group
3
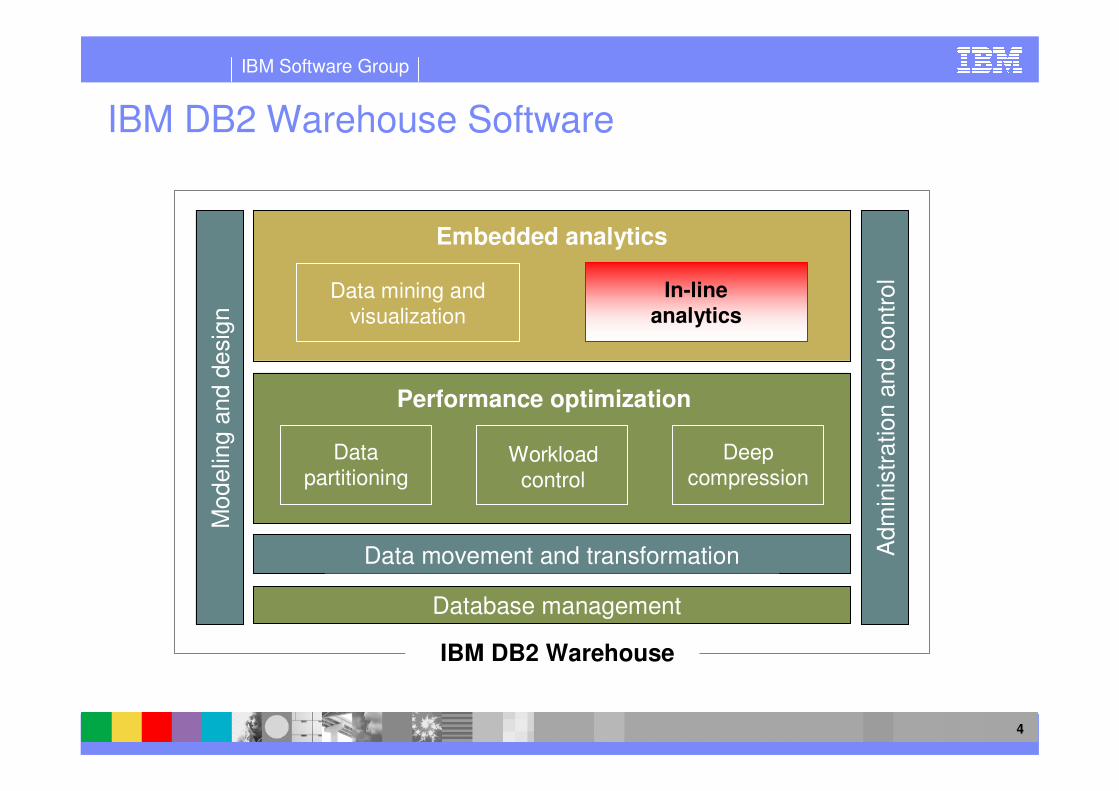
Embedded analytics
Data mining and
visualization
In-line
analytics
IBM DB2 Warehouse Software
Mo
de
ling
an
d d
esig
n
Ad
min
istr
atio
n a
nd
co
ntr
ol
Data movement and transformation
Database management
Performance optimization
Workloadcontrol
Data partitioning
Deepcompression
IBM DB2 Warehouse
Embedded analytics
Data mining and visualization
In-line analytics
IBM Software Group
4
IBM DB2 Warehouse Software
Mo
de
ling
an
d d
esig
n
Ad
min
istr
atio
n a
nd
co
ntr
ol
Data movement and transformation
Database management
Performance optimization
Workloadcontrol
Data partitioning
Deepcompression
Embedded analytics
Data mining and visualization
IBM DB2 Warehouse
In-line analytics

IBM Software Group
5
DWE OLAP Model
Relational
tables in DB2
fact table
dimension tables dimension tables
Cube dimension
Join
AttributeAttribute Join
Hierarchy
Measure
Facts
Dimension
Cube Model
MeasureCube Facts
Cube hierarchy
LevelCube Level
Cube
Join Attribute

IBM Software Group
6
Model
OLAP MetadataOLAP Metadata
Base TablesAdministrator Catalog Tables
MQT's
Time & Space constraints
Query Types
Model Information
Data Samples
Performance Advisor
Statistics
Model-Based Optimization
Benefits� Smart Aggregate Selection� Smart Index Selection� SQL Generation� DB2 Exploitation

IBM Software Group
7
DB2 Data DB2 Data
WarehouseWarehouse
RDBMS RDBMS
MetadataMetadata
OLAP MetadataOLAP Metadata
OLAP MetadataOLAP Metadata
Model & ETL tool metadata
OLAP MetadataOLAP Metadata meta datameta data
bridgebridge
BI tool metadata
meta datameta data
bridgebridge
DATADATADML DML
DDLDDL
OLAP MetadataOLAP Metadata
OLAP OLAP MetadataMetadata
OLAP MetadataOLAP Metadata
OLAP OLAP MetadataMetadata
OLAP MetadataOLAP Metadata
Hyperion
BUSINESS OBJECTS
QMF for Windows
OLAP OLAP MetadataMetadata
OLAP MetadataOLAP Metadata
MITI
DB2 Alphablox
QlikTech
ArcPlan
OLAP Metadata Interchange

IBM Software Group
8
� Platform for Customized Analytic Applications and Inline Analytics
� Pre-built components (Blox) for analytic functionality
� Allows you to create customized analytic components that are embedded into existing business processes and web applications
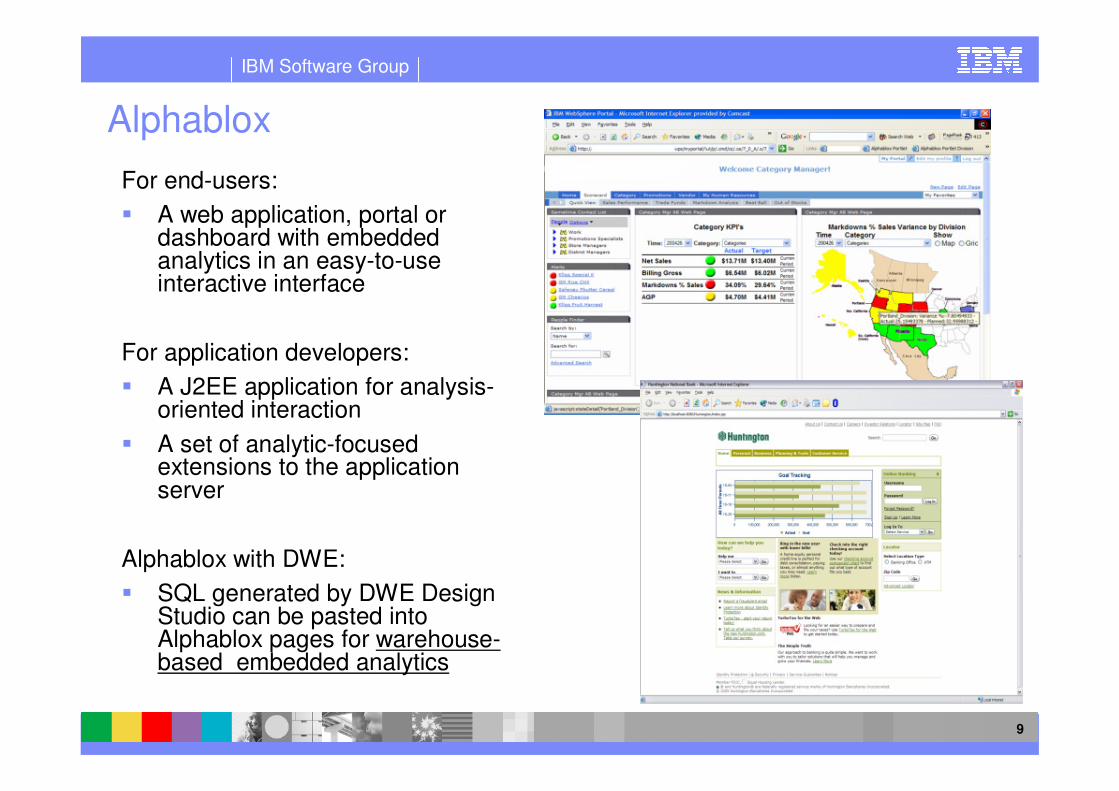
Alphablox
IBM Software Group
9
For end-users:
� A web application, portal or dashboard with embedded analytics in an easy-to-use interactive interface
For application developers:
� A J2EE application for analysis-oriented interaction
� A set of analytic-focused extensions to the application server
Alphablox with DWE:
� SQL generated by DWE Design Studio can be pasted into Alphablox pages for warehouse-based embedded analytics
Alphablox
IBM Software Group
10
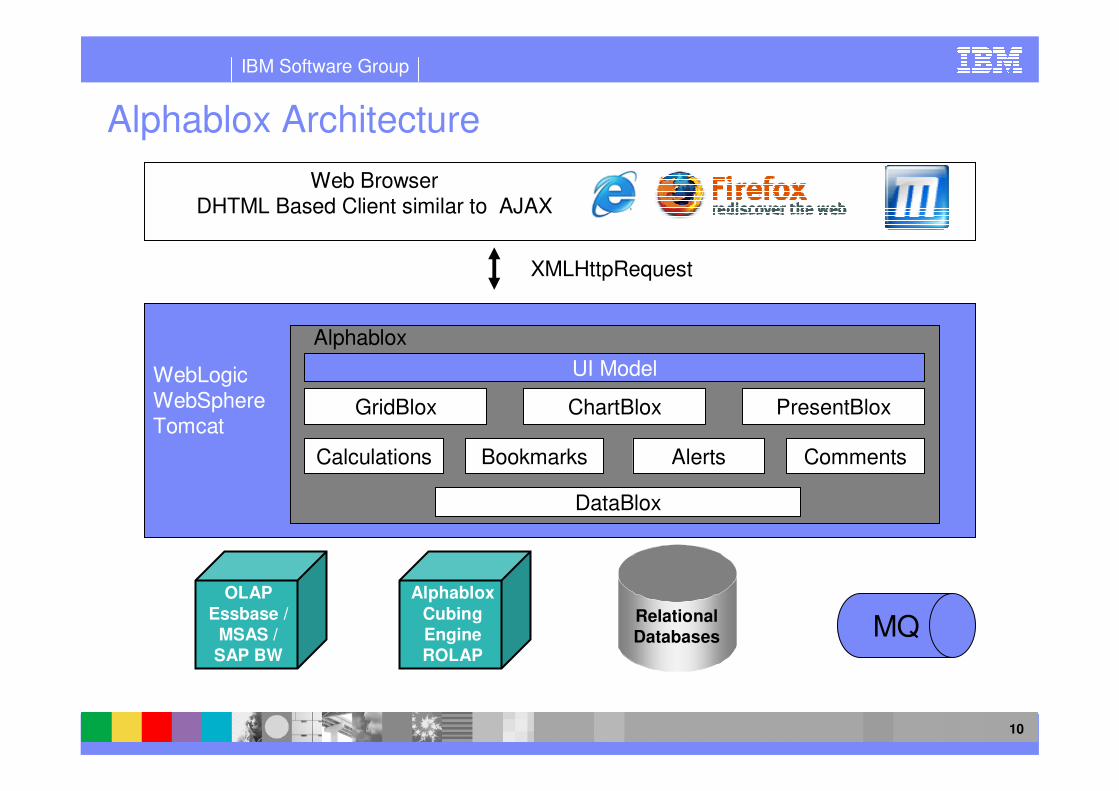
Alphablox Architecture
Relational
Databases
Alphablox
Cubing
Engine
ROLAP
OLAP
Essbase /
MSAS /
SAP BW
MQ
XMLHttpRequest
Web BrowserDHTML Based Client similar to AJAX
DataBlox
Calculations Bookmarks Alerts Comments
GridBlox ChartBlox PresentBlox
UI Model
Alphablox
WebLogicWebSphereTomcat

IBM Software Group
11
Relational Cubing Engine & OLAP Optimization
Application Server Tier Database Server Tier
Customer Tier
Fact Data Retrieval
Dimension Data Retrieval
Relational Cubing Engine
Relational Cube
DB2 Alphablox Server
“cubelets” Cube Definition
DB2 Alphablox Application
Data Blox
Present Blox Grid Blox Chart Blox
OLAP MetadataOLAP Metadata
Metadata Import
DB2 Cube Views Star SchemaDB2 MQTs
HTTP Server
MDX MDX

IBM Software Group
12
Versatile Architecture Support
Mart
BI Applications and Tools
EDW
ExternalMarts
InternalMarts
VirtualMarts
� DB2 Warehouse
supports versatile
analytics
architectures
� Analytics directed
against
�External Mart
�Internal Mart
�Virtual Mart

IBM Software Group
13
IBM DB2 Warehouse Software
Mo
de
ling
an
d d
esig
n
Ad
min
istr
atio
n a
nd
co
ntr
ol
Data movement and transformation
Database management
Performance optimization
Workloadcontrol
Data partitioning
Deepcompression
Embedded analytics
In-line analytics
IBM DB2 Warehouse
Data mining and visualization

IBM Software Group
14
DWE Easy Mining – Mining without a Statistician
Realize the benefits of mining by enabling
analysts, rather than relying on statisticians,
for your data mining needs
Reporting Tool
DB2 DataWarehouse
Edition

IBM Software Group
15
Two Types of Data Mining – Discovery & Predictive
� Predictive
� Specific question
� Probability associated with outcomes
� Directed analysis
� Iterative process
� Train
� Test
� Apply
� Apply model in database at customer touch points
� Discovery
� Automatically find trends and patterns
� Answer unasked questions
� Relatively undirected analysis
� Tool reports on findings
� In a word – “Easier”
� Useful for non-statisticians

IBM Software Group
16
Discovery Methods… finding useful patterns and relationships
� Associations
� Which item affinities (“rules”) are in my data?
� [Beer => Diapers] … single transaction
� Sequences
� Which sequential patterns are in my data?
� [Love] => [Marriage] => [Baby Products] … sequential
� Clustering
� Which interesting groups are in my data?
� …customer profiles, store profiles
Predictive Methods… predicting values
� Classification
� How to predict categorical values in my data?
� …will the patient be cured, harmed, unaffected by treatment?
� Regression
� How to predict numerical values in my data?
� …how likely a customer will respond to the promotion
� …how much will each customer spend this year?
� Score data directly in DB2, scalable and real time
DWE Easy Mining Algorithms
Select Transform Mine Assimilate
Extracted Information
Assimilated Information
Selected Data
Data Warehouse
Statistician & Data Mining Workbench
DWE
Enterprise Data
Warehouse
BusinessAnalyst
DWE
Partner
IBM Software Group
17
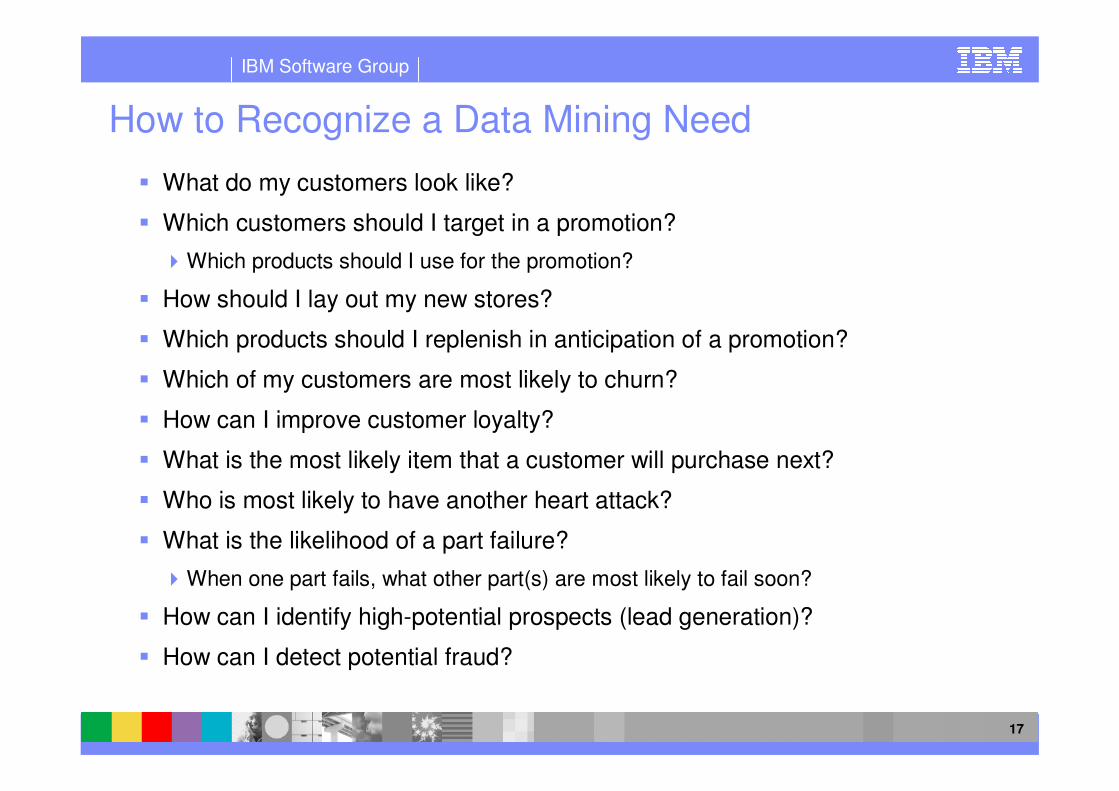
How to Recognize a Data Mining Need
� What do my customers look like?
� Which customers should I target in a promotion?
�Which products should I use for the promotion?
� How should I lay out my new stores?
� Which products should I replenish in anticipation of a promotion?
� Which of my customers are most likely to churn?
� How can I improve customer loyalty?
� What is the most likely item that a customer will purchase next?
� Who is most likely to have another heart attack?
� What is the likelihood of a part failure?
�When one part fails, what other part(s) are most likely to fail soon?
� How can I identify high-potential prospects (lead generation)?
� How can I detect potential fraud?
IBM Software Group
18
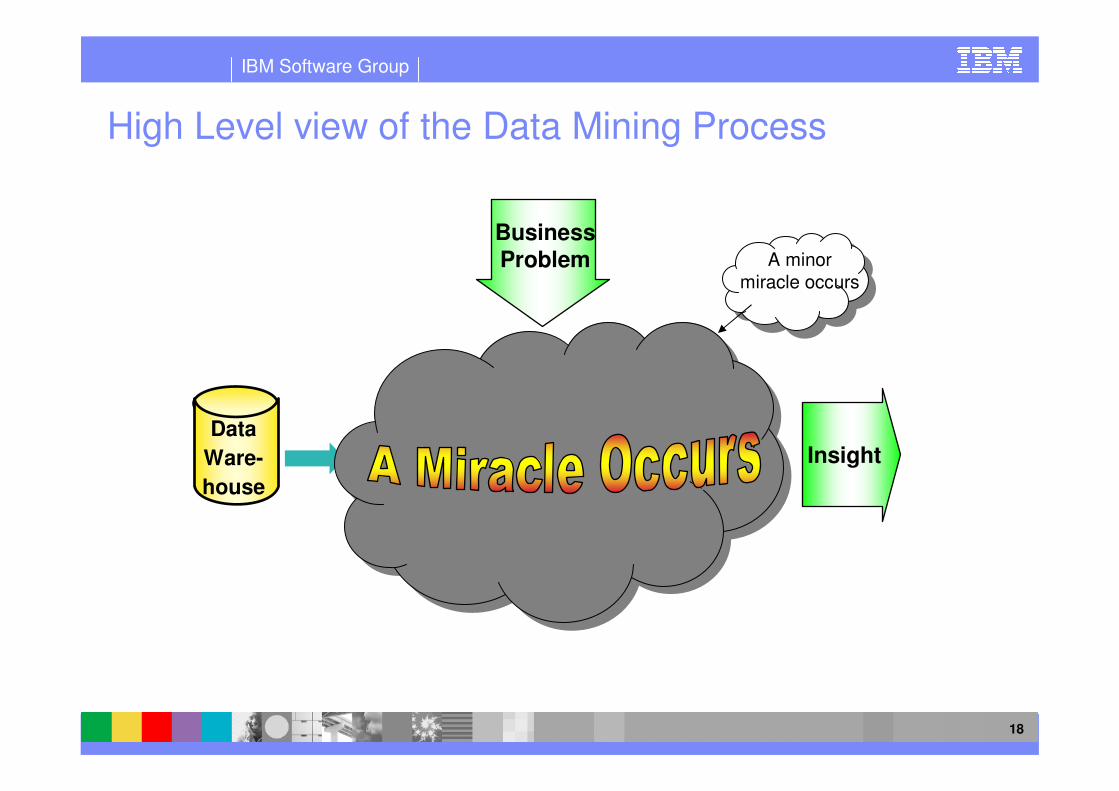
High Level view of the Data Mining Process
Data
Ware-
house
Business Problem
Insight
Extract & Transform data
Build Model
Deploy
Validate, Refine
A minor
miracle occurs

IBM Software Group
19
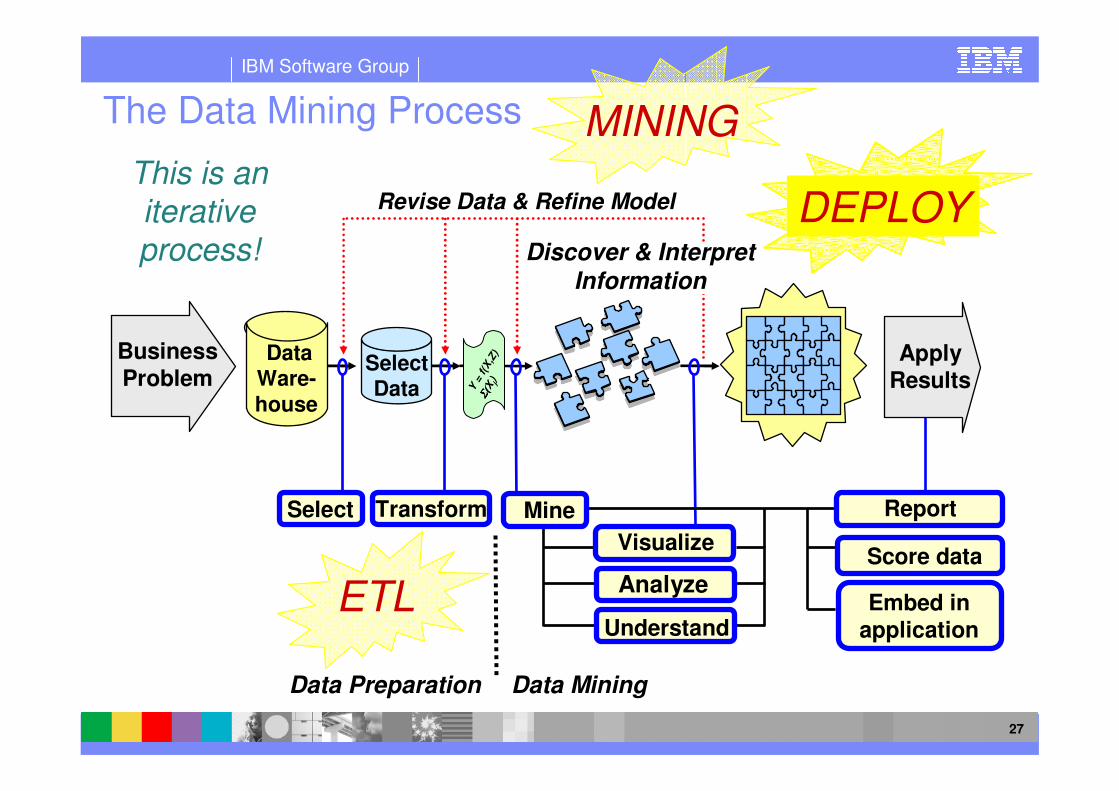
The Data Mining Process
Select Transform
Select Data
Data Ware-
house
Business Problem
Mine
Apply Results
Revise Data & Refine Model
Visualize
Understand
Analyze
Data Preparation Data Mining
Report
Score data
Embed in application
Y =
f(X
,Z)
Σ(
Σ(
Σ(Σ
(Xj)
Discover & Interpret
Information
ETL
MINING
DEPLOYThis is an
iterative
process!
MINING
IBM Software Group
20
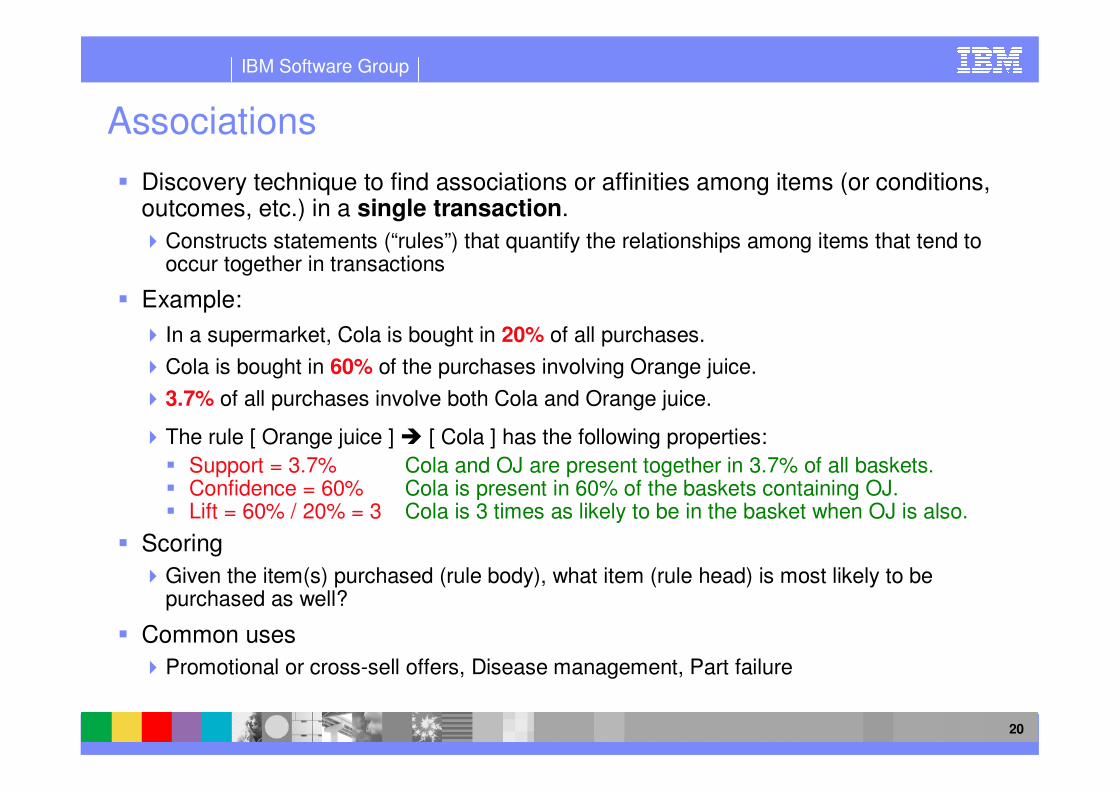
Associations
� Discovery technique to find associations or affinities among items (or conditions, outcomes, etc.) in a single transaction.
�Constructs statements (“rules”) that quantify the relationships among items that tend to occur together in transactions
� Example:
� In a supermarket, Cola is bought in 20% of all purchases.
�Cola is bought in 60% of the purchases involving Orange juice.
�3.7% of all purchases involve both Cola and Orange juice.
�The rule [ Orange juice ] � [ Cola ] has the following properties:
� Support = 3.7% Cola and OJ are present together in 3.7% of all baskets.� Confidence = 60% Cola is present in 60% of the baskets containing OJ.� Lift = 60% / 20% = 3 Cola is 3 times as likely to be in the basket when OJ is also.
� Scoring
�Given the item(s) purchased (rule body), what item (rule head) is most likely to be purchased as well?
� Common uses
�Promotional or cross-sell offers, Disease management, Part failure
IBM Software Group
21
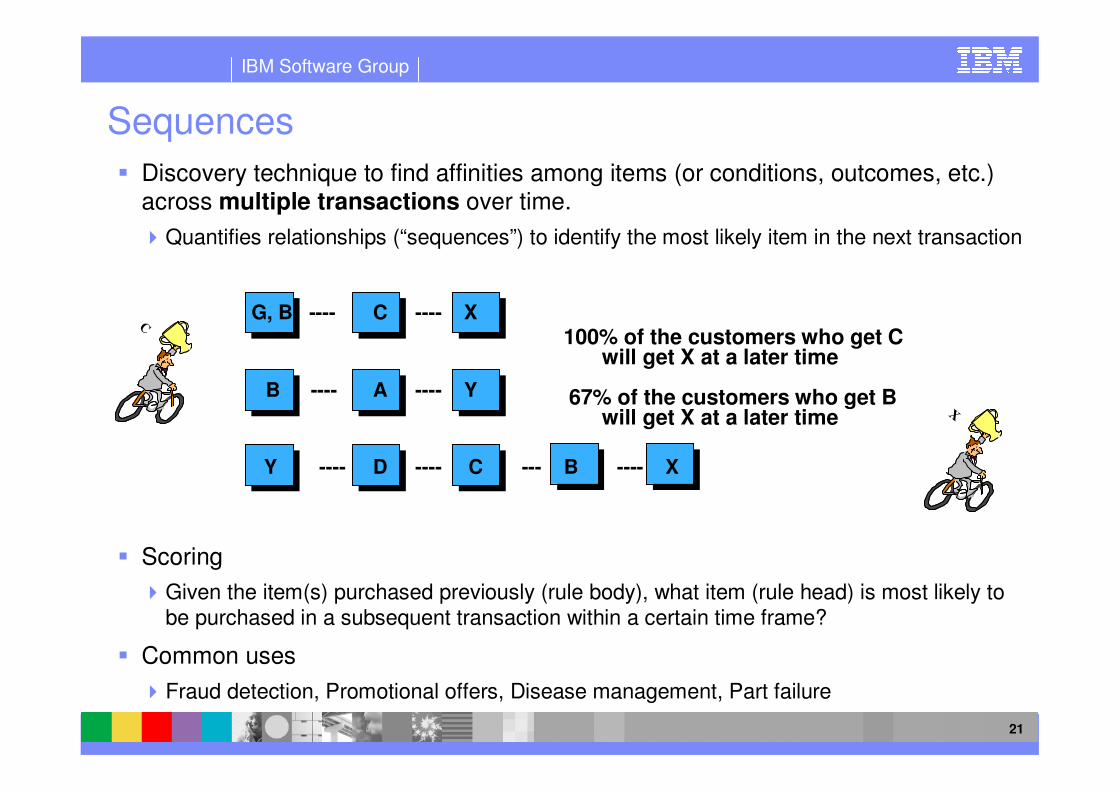
Sequences
� Discovery technique to find affinities among items (or conditions, outcomes, etc.) across multiple transactions over time.
�Quantifies relationships (“sequences”) to identify the most likely item in the next transaction
� Scoring
�Given the item(s) purchased previously (rule body), what item (rule head) is most likely to be purchased in a subsequent transaction within a certain time frame?
� Common uses
�Fraud detection, Promotional offers, Disease management, Part failure
G, B ---- C ---- X
B ---- A ---- Y
Y ---- D ---- C --- B ---- X
100% of the customers who get Cwill get X at a later time
67% of the customers who get Bwill get X at a later time X
C
IBM Software Group
22
Clustering
� Discovery technique to find clusters having distinct behaviors and
characteristics
�Gain insights to customers, stores, insurance claims, etc.
�Generate distinct behavioral/demographic profiles
�Understand the most important attributes of each cluster
� Create a model to assign individuals to best-fit clusters
�Apply model to assign new individuals or re-assign existing individuals
�Design business actions tailored to different characteristic profiles
� Scoring
�Apply model to assign each record to its best-fit cluster
�Apply appropriate business action for each record based on its assigned
cluster
� Common uses
�Customer segmentation, store profiling, deviation detection
IBM Software Group
23
Classification
� Prediction technique to classify individuals by outcome
�Classify by a categorical class variable (e.g., YES-NO-MAYBE response)
�Understand the most important factors (predictors) leading to each outcome
� Modeling
�Create a model to classify individuals according to expected outcome
�Design business action based on most important predictors
� Scoring
�Apply model to predict the outcome for each individual
� New prospects (expected behavior)
� Existing individuals (changes in behavior)
�Identify target individuals for business action
� Common uses
�Customer attrition (churn), Part failure

IBM Software Group
24
Regression� Set of predictive techniques to predict a dependent variable
�Predict continuous value or binary numeric value
� Continuous: e.g., revenue (prediction represents amount of revenue)
� Binary: e.g., 0=No, 1=Yes (prediction represents probability of Yes)
�Understand the most important predictors of the dependent variable
�Transform regression, linear regression, polynomial regression
� Modeling
�Create a model to predict the dependent variable
�Design business action (e.g., predict likelihood of default for a loan application, in real time)
� Scoring
�Apply model to generate a prediction for each individual (e.g., probability of part failure)
�Identify target individuals for business action
� Common uses
�Predict revenue/cost/profitability, Predict risk of loan default

IBM Software Group
25
The Data Mining Process
Select Transform
Select Data
Data Ware-
house
Business Problem
Mine
Apply Results
Revise Data & Refine Model
Visualize
Understand
Analyze
Data Preparation Data Mining
Report
Score data
Embed in application
Y =
f(X
,Z)
Σ(
Σ(
Σ(Σ
(Xj)
Discover & Interpret
Information
ETL
MINING
DEPLOYThis is an
iterative
process!
ETL

IBM Software Group
26
Data exploration
� DWE enables you to explore the data.
�Check data quality (prior to performing ETL for data preparation) and gain a general understanding of the data
� Design Studio provides four tools to inspect data:
�Table sampling
�Univariate distributions
�Bivariate distributions
�Multivariate distributions
� All these tools are accessible by right-clicking on a table/view/alias/nicknamein the database explorer:
�-> Data for table sampling/editing
�-> Value Distributions for multivariate/univariate/bivariate distributions
IBM Software Group
27
The Data Mining Process
Select Transform
Select Data
Data Ware-
house
Business Problem
Mine
Apply Results
Revise Data & Refine Model
Visualize
Understand
Analyze
Data Preparation Data Mining
Report
Score data
Embed in application
Y =
f(X
,Z)
Σ(
Σ(
Σ(Σ
(Xj)
Discover & Interpret
Information
ETL
MINING
DEPLOYThis is an
iterative
process!
DEPLOY
IBM Software Group
28
Leveraging Mining and Alphablox: DWE Miningblox
� Create web applications that provide access to DWE Data Mining
� Extends the DB2 Alphablox API with mining specific functionality.
� With Miningblox, you can perform the following tasks:
�Selecting input data
�Processing input data
�Displaying mining results graphically in a Web browser, for example, the
characteristics of a customer segment
�Administering or managing mining runs
� Typically a web application using MiningBlox tags might be integrated in a
business application or an intranet portal.

IBM Software Group
29
Why use Miningblox ?
� Provide access to Data Mining for a group of business analysts.
� Create a Miningblox web application that provides access to mining functionality
through the Web browser, no need to install software on the Client‘s machines
� Analysts can execute mining runs and view results in a customized web
application without extensive knowledge about mining software.
� With the Miningblox Application wizard in the DWE Design Studio, you can easily
create Web applications by selecting sample templates or you can extend Alphablox applications with mining functionality.
IBM Software Group
30
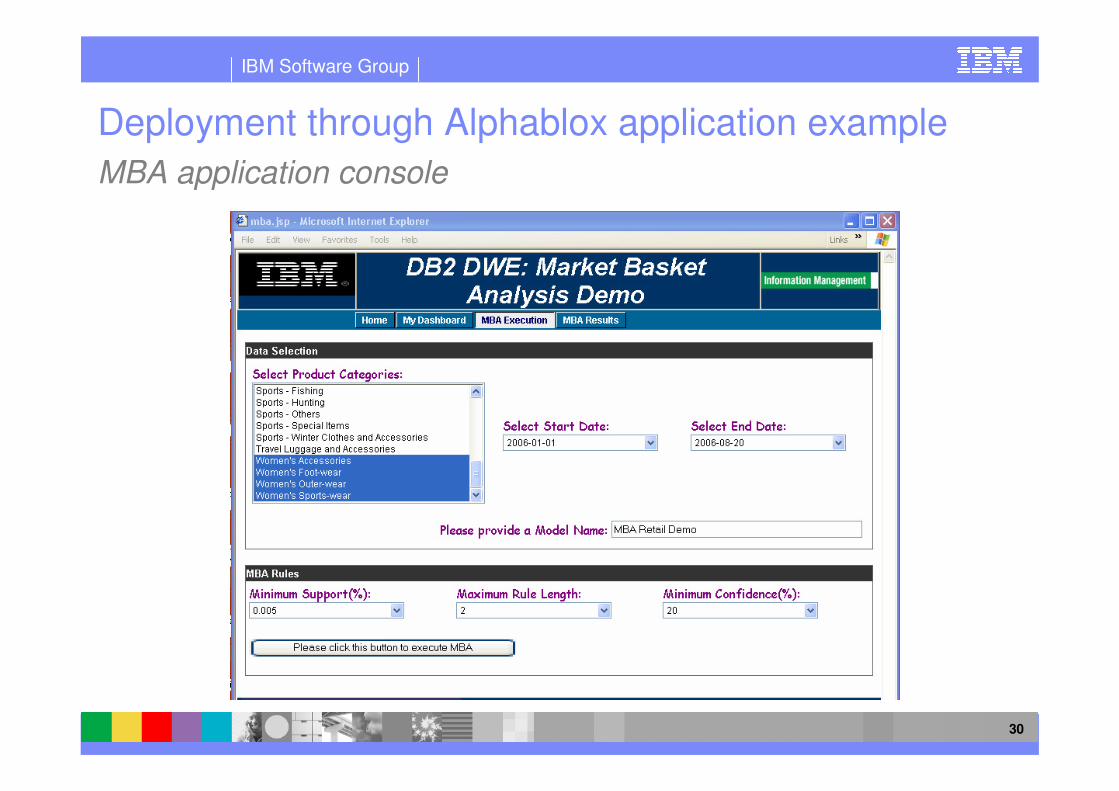
Deployment through Alphablox application example
MBA application console

IBM Software Group
31
Deployment through Alphablox application example
MBA execution

IBM Software Group
32
Deployment through Alphablox application example
MBA completion
IBM Software Group
33
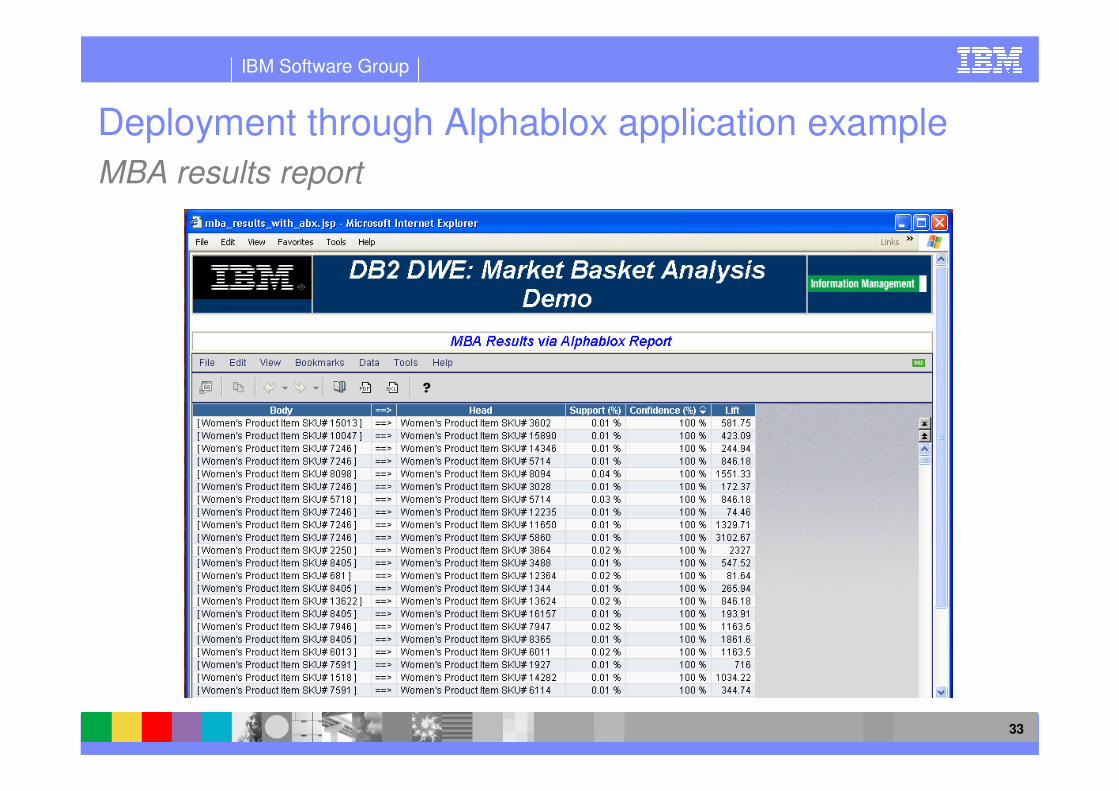
Deployment through Alphablox application example
MBA results report

®
IBM Software Group
© 2007 IBM Corporation
Case Study: Retail Department Store
Analytics with Data Mining and Alphablox
David Cope
EDW Architect – Asia Pacific
IBM Software Group
35
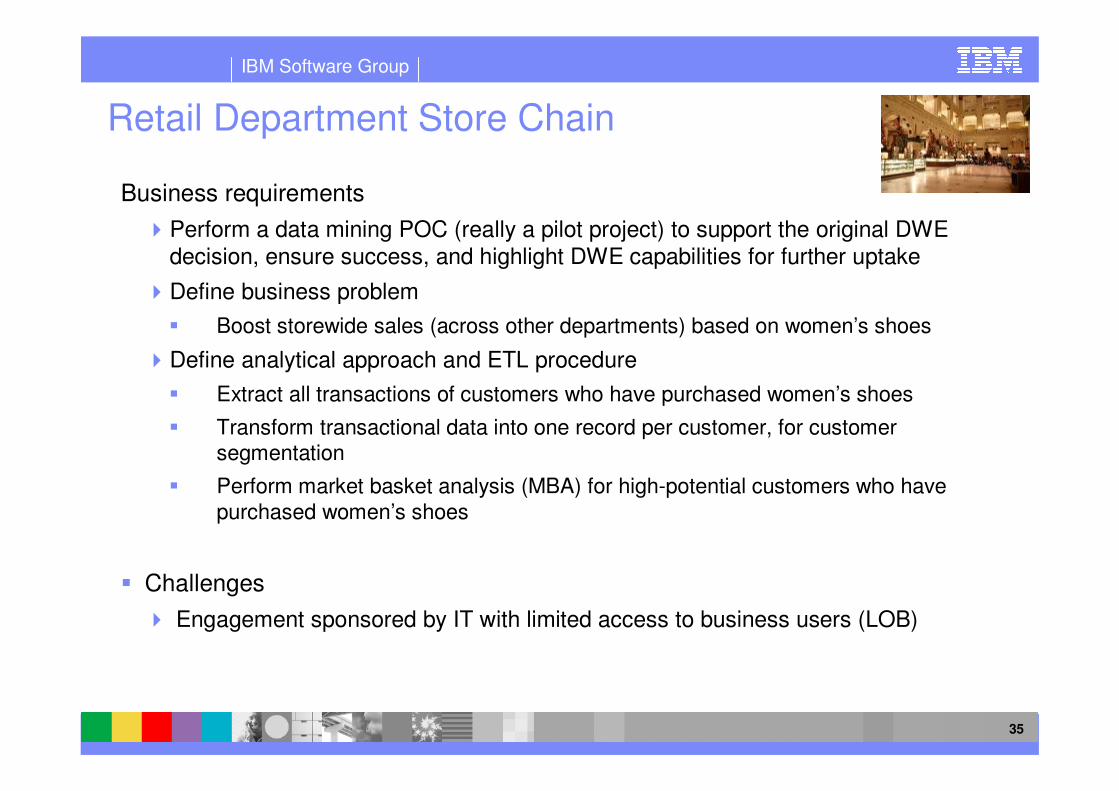
Retail Department Store Chain
Business requirements
�Perform a data mining POC (really a pilot project) to support the original DWE decision, ensure success, and highlight DWE capabilities for further uptake
�Define business problem
� Boost storewide sales (across other departments) based on women’s shoes
�Define analytical approach and ETL procedure
� Extract all transactions of customers who have purchased women’s shoes
� Transform transactional data into one record per customer, for customer segmentation
� Perform market basket analysis (MBA) for high-potential customers who have
purchased women’s shoes
� Challenges
� Engagement sponsored by IT with limited access to business users (LOB)
IBM Software Group
36
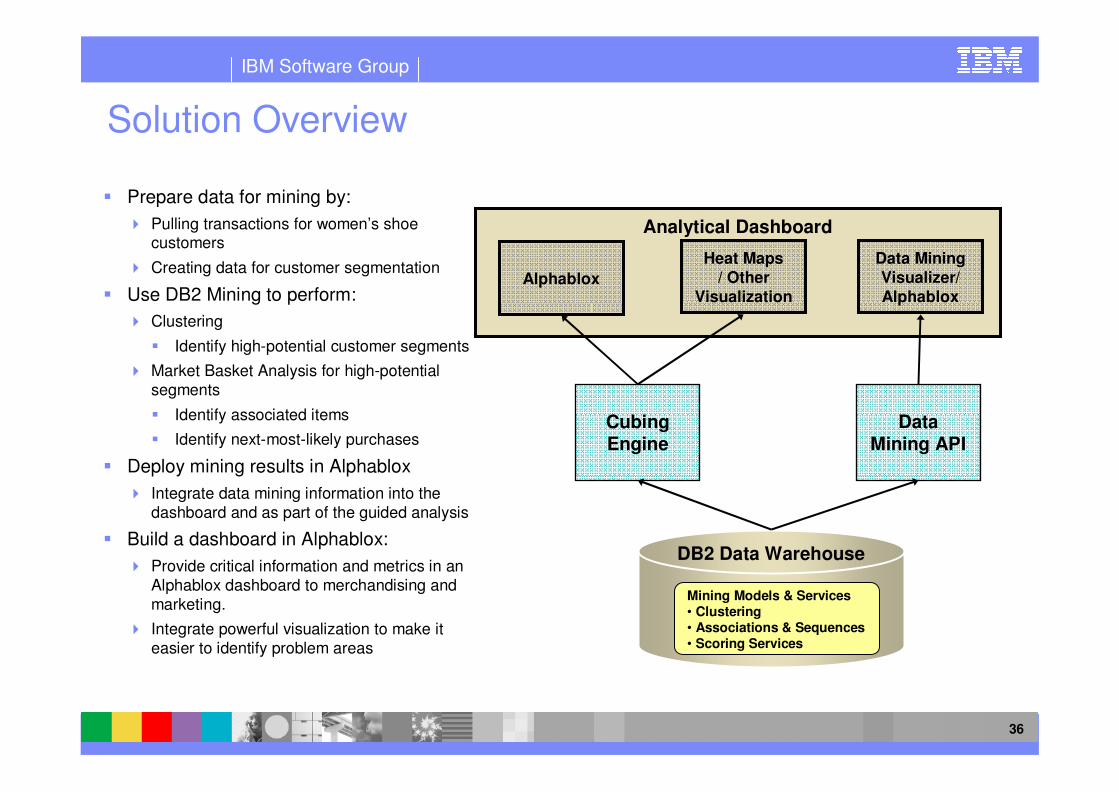
Solution Overview
DB2 Data Warehouse
Analytical Dashboard
Alphablox
Data Mining
Visualizer/Alphablox
Heat Maps
/ Other Visualization
Cubing Engine
Data Mining API
� Prepare data for mining by:
� Pulling transactions for women’s shoe customers
� Creating data for customer segmentation
� Use DB2 Mining to perform:
� Clustering
� Identify high-potential customer segments
� Market Basket Analysis for high-potential segments
� Identify associated items
� Identify next-most-likely purchases
� Deploy mining results in Alphablox
� Integrate data mining information into the dashboard and as part of the guided analysis
� Build a dashboard in Alphablox:
� Provide critical information and metrics in an Alphablox dashboard to merchandising and
marketing.
� Integrate powerful visualization to make it
easier to identify problem areas
Mining Models & Services• Clustering• Associations & Sequences• Scoring Services

IBM Software Group
37
Business Scenario for Mining
� Business requirements for POC
�Focus on customers who have purchased women’s shoes in the past 12 months
�Boost storewide sales (across other departments) based on women’s shoes
�Increase “wallet share” from high-potential customers
� Business questions to be answered
�What do my women’s shoes customers look like?
�Which of these customers should I target in a promotion?
�Which products should I use for the promotion?
�Which products should I replenish in anticipation of a promotion?
�How can I improve customer loyalty?
�What is the most likely item that a women’s shoes customer will purchase next?
IBM Software Group
38
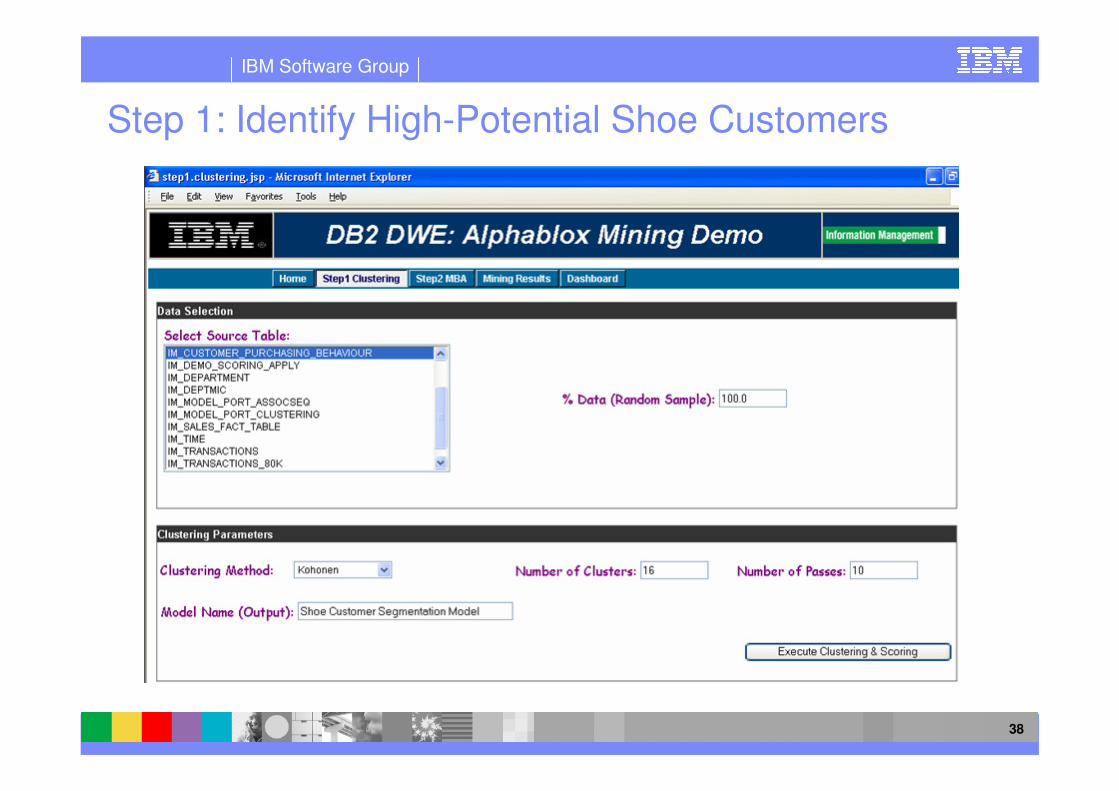
Step 1: Identify High-Potential Shoe Customers
IBM Software Group
39
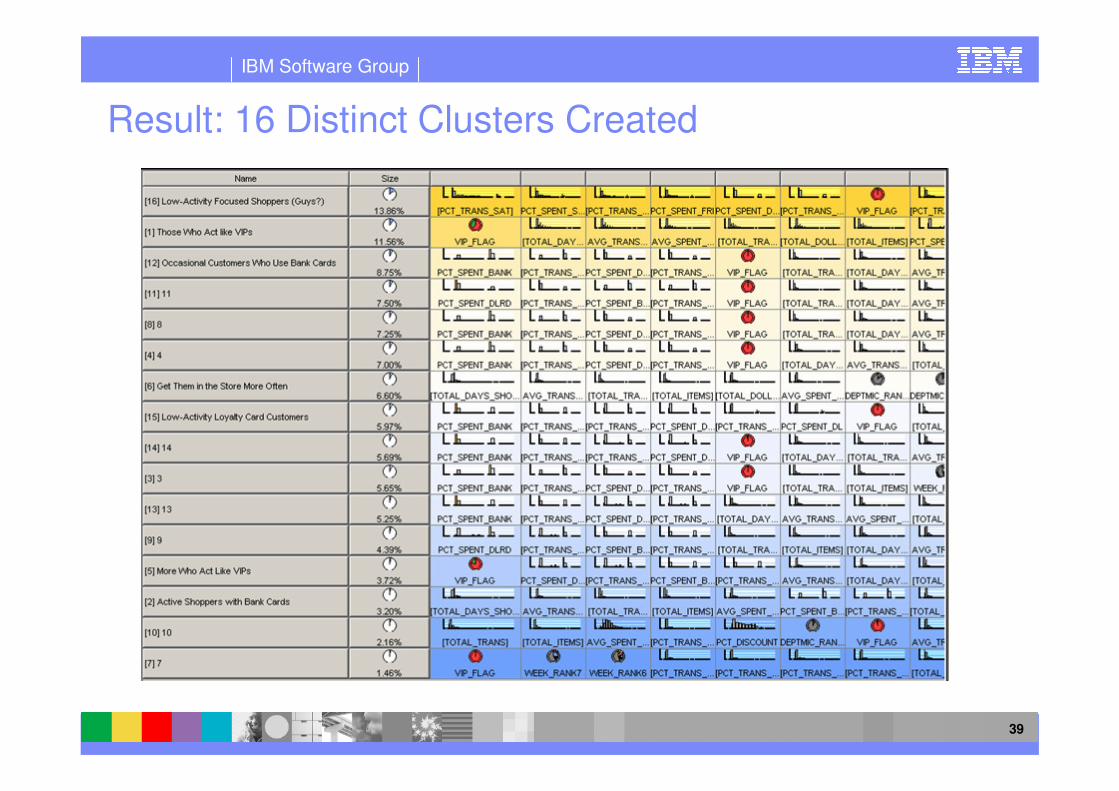
Result: 16 Distinct Clusters Created

IBM Software Group
40
Cluster 1: Those who Act Like VIP’s
VIP’s
Frequent
Shoppers
Big
Spenders
Active
Shoppers
Respond to
Discounts High Returns
High Potential Customers!

IBM Software Group
41
Cluster 6: Frequent Good Shoppers
Shop Here 30
days/yrAbove-Avg
Purchases
Above-Avg
Spending
Respond to
DiscountsAverage
Returns
High Potential Customers!
IBM Software Group
42
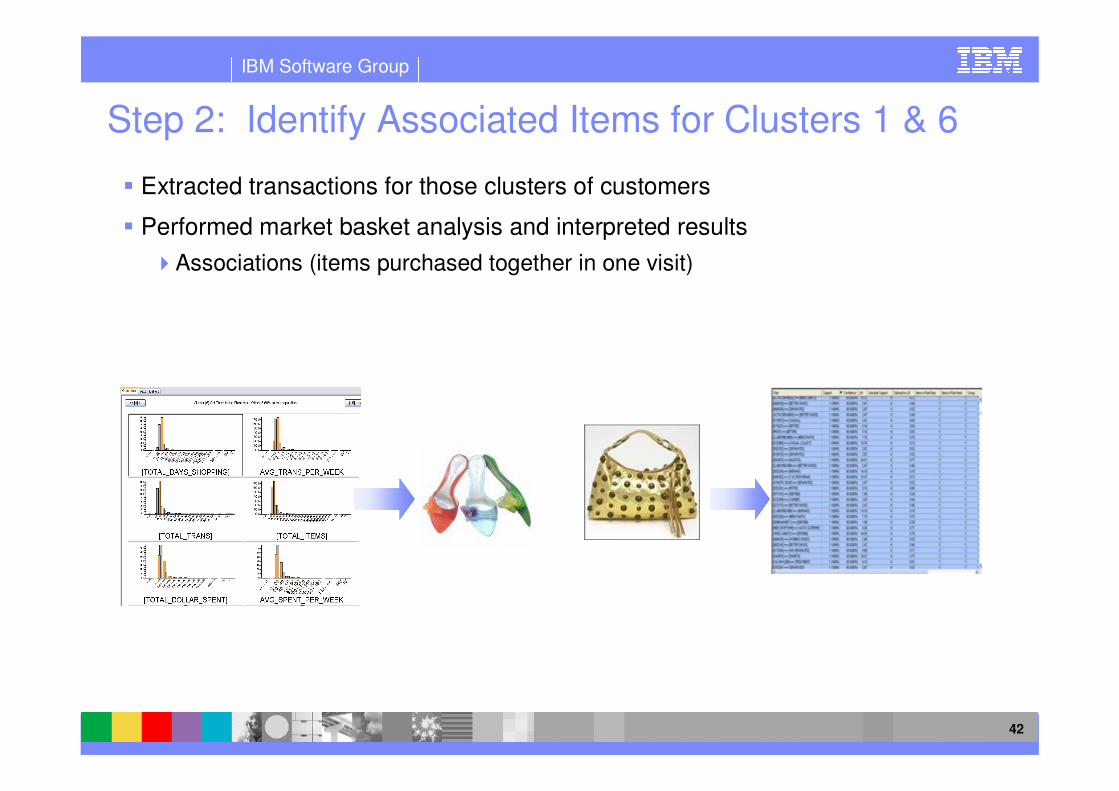
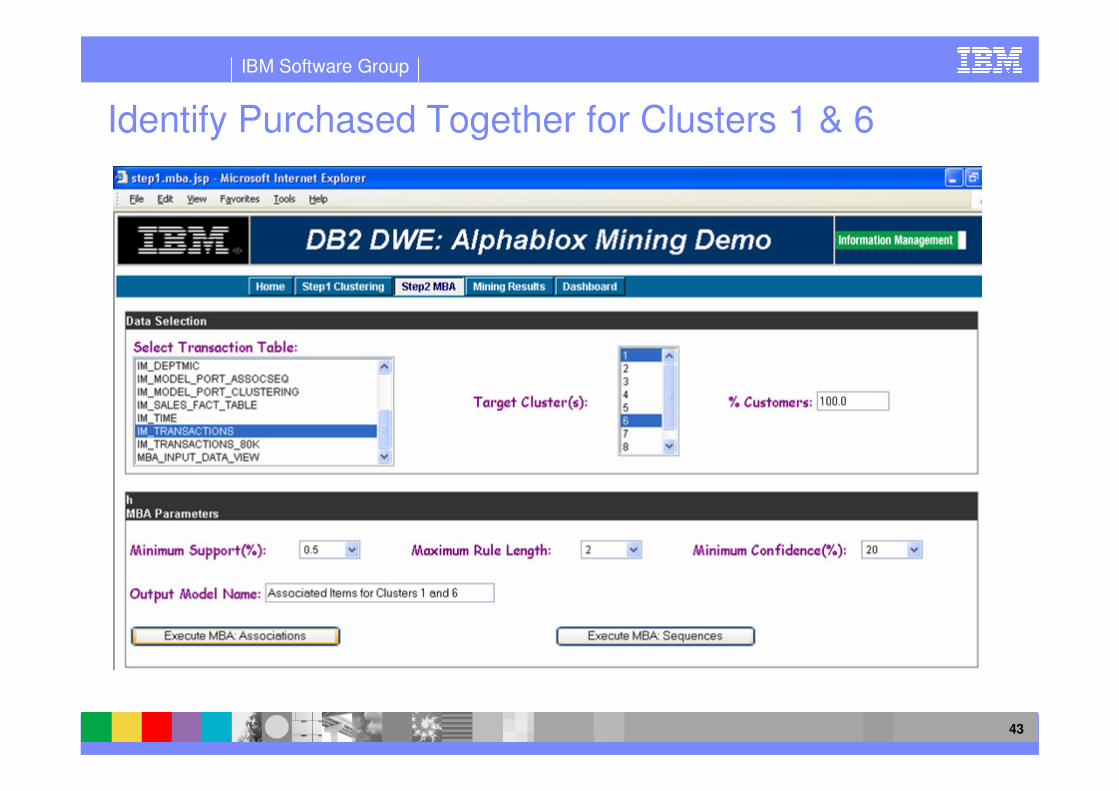
Step 2: Identify Associated Items for Clusters 1 & 6
� Extracted transactions for those clusters of customers
� Performed market basket analysis and interpreted results
�Associations (items purchased together in one visit)
+
IBM Software Group
43
Identify Purchased Together for Clusters 1 & 6

IBM Software Group
44
Results: Associations for Clusters 1 & 6

IBM Software Group
45
Step 3: Identify Next Likely Purchase for Clusters 1 & 6
� Extracted transactions for those cluster of customers
� Performed market basket analysis and interpreted results
�Sequences (next most likely purchase in a future visit)

IBM Software Group
46
Identify Next Likely Purchases for Clusters 1 & 6

IBM Software Group
47
Results: Sequences for Customers in Clusters 1 & 6

IBM Software Group
48
Results and Future Ideas
� Deployment of customer segmentation and MBA
�End-user application with Alphablox
� Create & refresh mining models
� Identify high-potential customer segments
� Refresh assignment of each customer to best-fit cluster
�Target selected customer segments for promotions
� Batch scoring to identify best offer(s) for each customer/segment
�Merchandising now has a view of their customers, not just products
� Future ideas
�Score a customer at checkout register in real time
� MBA scoring (associations, sequences)
� Focused MBA scoring for known customers, based on best-fit cluster
� Make an offer to induce customers to visit other departments before leaving the store
IBM Software Group
49


