
WP/06/99
Determinants of Public-Private Partnerships in Infrastructure
Mona Hammami, Jean-Francois Ruhashyankiko,
and Etienne B. Yehoue

© 2006 International Monetary Fund WP/06/99
IMF Working Paper
IMF Institute
Determinants of Public-Private Partnerships in Infrastructure
Prepared by Mona Hammami, Jean-Francois Ruhashyankiko, and Etienne B. Yehoue1
Authorized for distribution by Roland Daumont
April 2006
Abstract
This Working Paper should not be reported as representing the views of the IMF. The views expressed in this Working Paper are those of the author(s) and do not necessarily represent those of the IMF or IMF policy. Working Papers describe research in progress by the author(s) and are published to elicit comments and to further debate.
This paper presents an empirical analysis of the cross-country and cross-industry determinants of public-private partnership (PPP) arrangements. We find that PPPs tend to be more common in countries where governments suffer from heavy debt burdens and where aggregate demand and market size are large. Our findings also suggest that macroeconomic stability is essential for PPPs. We provide evidence on the importance of institutional quality,where less corruption and effective rule of law are associated with more PPP projects. PPPs are also more prevalent in countries with previous PPP experiences. At the industry level, we find that PPP determinants vary across industries depending on the nature of public infrastructure, capital intensity, and technology required. We also find that private participation in PPP projects depends on the expected marketability, the technology required, and the degree of “impurity” of the goods or services. JEL Classification Numbers: H49, H54, G31, G38 Keywords: Public-Private Partnerships, Infrastructures, Capital Budgeting,
Investment Policy Author(s) E-Mail Address: [email protected];
[email protected]; and [email protected]
1 Mona Hammami is a Ph.D. candidate at Oxford University. Jean-Francois Ruhashyankiko and Etienne Yehoue are Economists at the IMF. This paper was initiated while Mona Hammami was a summer intern at the IMF Institute. We thank Andrew Feltenstein, Senior Advisor, IMF Institute, for comments.

- 2 -
Content Page
I. Introduction ............................................................................................................................3
II. Theoretical Background ........................................................................................................5
III. Specifications and Empirical Methodology.........................................................................9
IV. Data Description ................................................................................................................11 A. Key Features of PPI Database.................................................................................11 B. Variables Capturing Each Channel .........................................................................12
V. Estimation Results and Discussions....................................................................................14 A. Number of PPP Projects..........................................................................................14 B. Investments in PPPs ................................................................................................15 C. Number of PPP Projects in the Energy Sector ........................................................16 D. Number of PPP Projects in the Telecommunication Sector ...................................17 E. Number of PPP Projects in the Transportation Sector ............................................17 F. Number of PPP Projects in the Water Sector ..........................................................18 G. Extent of Private Participation in PPP Arrangements.............................................18
VI. Concluding Remarks .........................................................................................................19 References................................................................................................................................36 Figures 1. Number of Projects by Types of Contract ...................................................................24 2. Number of Projects Supported by Development Agencies .........................................25 Tables 1. Characteristics of Main Types of PPPs and Index of Private Participation.................22 2. Number of Projects by Industry Sector and Mode of Entry ........................................23 3. Channels, Hypotheses and Explanatory Variables, and Data Sources ........................26 4. Correlation Matrix .......................................................................................................28 5. Determinants of the Number of PPP Projects in Infrastructure...................................29 6. Determinants of Investments in PPPs..........................................................................30 7. Determinants of the Number of PPP Projects in Energy Infrastructure ......................31 8. Determinants of the Number of PPP Projects in Telecommunication Infrastructure..32 9. Determinants of the Number of PPP Projects in Transportation Infrastructure ..........33 10. Determinants of the Number of PPP Projects in Water Infrastructure ........................34 11. Determinants of the Extent of Private Participation ....................................................35
- 3 -
I. INTRODUCTION
Why are public-private partnerships (PPPs) increasingly widespread? Why are some countries able to attract more investments in the form of public-private partnerships than others? Why are certain types of PPPs found in some industries but not in others? What determines the extent of private sector participation in such ventures with the public sector? This paper addresses these questions using panel data on PPPs in infrastructure projects for the period 1990 to 2003. Our analysis is motivated by the fact that in the last 10 years many countries have witnessed an increasing provision of public goods by private—for-profit and not-for-profit—firms. Their involvement in PPP arrangements can vary from designing schools, hospitals, roads, or sanitation facilities, to structuring their financing, and including construction, operation, maintenance, management, and ownership. The World Bank estimates that the private sector financed about 20 percent of infrastructure investments—amounting to about US$ 850 billion—in developing countries during the 1990s.2 Several industrial countries (e.g., Australia, Canada, Ireland, and the Netherlands) have recently adopted PPP arrangements to provide education, health, water and waste management, and other social services.3 The contribution of infrastructure to economic growth is well recognized both in academic and policy debates.4 For example, two recent influential studies—Sachs and others (2004) and the United Nations Economic Commission for Africa (2005)—identify significant infrastructure expenditure needs in sub-Saharan Africa. Their estimate of annual needs range from 9 to 13 percent of GDP for at least the next 10 years. However, given the stringent budget constraints that many developing countries have faced in recent decades, very few can afford to allocate the necessary resources to infrastructure. Why are infrastructure requirements increasingly important? Infrastructure built in the 1960s in most developing countries, albeit insufficient to meet residential demand, did support economic growth for a while. Hence, the lack of infrastructure was not a major economic policy concern. But after the oil shocks of the 1970s, growth prospects and macroeconomic 2 See World Bank (2002, Chapter 8).
3 Examples abound in the United States, which has a long tradition with partnerships, many recorded by the National Council for Public-Private Partnerships (www.ncppp.org). In the United Kingdom since 1992, most public-private projects have been funded through the government’s Private Finance Initiative (PFI); as of April 2003, over 570 projects were signed for a combined capital value of about £36 billion (Allen, 2003). A well-known international example of PPP is the 75 percent funding (US$750 million) of the Global Alliance for Vaccines and Immunization by the Bill and Melinda Gates Foundation.
4 For example, Estache, Speciale and Veredas (2005) find that infrastructure explains between 8 and 20 percent of the total variance across sectors and countries, after accounting for the contribution of human and physical capital in an augmented Solow growth model.
- 4 -
conditions deteriorated in many developing countries, especially in low-income countries. These countries, with the help of such international institutions as the World Bank and the IMF, reacted to this challenge by formulating polices or other economic agreements aimed at increasing regional market size and promoting regional trade. These policies, combined with demographic pressures and increasing urbanization, led to a mismatch between limited supply and increasing demand for infrastructure in many regions of the developing world. This mismatch was worsened by recurrent fiscal crises resulting partly from poor economic performance in many developing countries. Policy responses to these fiscal crises led to cuts in public expenditure, under-maintenance of infrastructure, and under-investment in new infrastructure in many sectors, including social sectors. Since long-term economic growth requires investments in infrastructure, governments face a growing need to find alternative ways to finance infrastructure. To meet this need in the face of scarce financial resources, governments may find it optimal to focus on formulating public policies rather than building the needed infrastructure. Indeed, the evidence clearly shows that governments have been largely unsuccessful in providing independently the much-needed infrastructure and public goods to support economic growth. At the same time, private firms cannot be relied upon to build and deliver these public infrastructures independently. For these reasons, mutually beneficial partnerships between public and private sectors can be important. The provision of public goods or services through partnerships is based on two different motives. Private firms care about making money by building public goods and delivering services, while governments are concerned with saving money through private participation. Impressionistic evidence suggests that successful and effective partnerships are those in which the partners share the same goal of quality, efficiency, and accountability in building public goods and delivering public services. But a formal analysis of what determines such partnerships has been lacking to date. To our knowledge, this paper constitutes the first empirical attempt to analyze the determinants of PPPs in infrastructure projects using the World Bank’s Private Participation in Infrastructure (PPI) database on projects for developing countries during 1990–2003. We divide the determinants of PPPs into seven channels, taking into account different incentives and constraints in both the public and private sectors. These channels are government constraints, political environment, market conditions, macroeconomic stability, institutional quality, the legal system, and past experience with PPPs. Across countries, our findings show that PPPs tend to be more common in countries whose governments suffer from heavy debt burdens, where aggregate demand is sizable, and where markets are large enough to allow for cost recovery. Macroeconomic stability is essential for PPPs because partnerships are more common in countries with low inflation. The paper provides evidence to support the importance of institutional quality in attracting PPPs; a larger number of PPP projects are found in countries with less corruption and effective rule of law. Moreover, PPPs are found to be more prevalent in countries with previous PPP experiences.
- 5 -
At the industry level, we find that PPP determinants vary across industries depending on the nature of public infrastructures, capital intensity, and technology required. We also investigate the extent of private participation in such projects. We find that private sector decisions to commit resources are a function of the expected marketability of the goods and services, the technology required, and the degree of “impurity” of the goods or services (i.e., the fact that these goods and services are neither purely public nor private, but somewhere in between). The paper is organized as follows: Section II reviews some theoretical considerations that form the basis of our empirical investigation and highlight our hypotheses. In Section III, we present our estimation techniques and empirical methodology. Section IV describes the data sets used. In Section V, we present our results on the determinants of PPP arrangements across countries and industries. We also discuss what determines the degree of private participation in such arrangements. Section VI concludes the paper.
II. THEORETICAL BACKGROUND
The theoretical underpinning of the concept of the public-private partnership can be traced to the theory of x-efficiency developed by Leibenstein (1966). His idea was that public institutions or enterprises cannot fail as long as official financial and monetary policies are expansionary enough to bail them out or to limit their probability of failure. Inefficiencies in public institutions or enterprises result from both distortionary government interventions as well as states’ organizational structures, which are typically highly bureaucratic. Hence, according to this theory, public-private partnerships are necessary to reduce the sources of x-efficiency in public organizations and to allow them to respond to market forces and become more competitive. These inefficiencies of public organizations led in the early 1980s to the emergence of the so-called New Public Management in the United Kingdom (under Margaret Thatcher) and in others countries, mostly ones with Anglo-Saxon traditions. The main goal of this innovation was to introduce implicitly in public administrations the functioning principles of private firms. The new management aimed at reinventing the institutional structure, modernizing the state, and improving the management of public enterprises. Its emergence was inspired by the need to reduce public spending and inefficiency and to overcome the lack of managerial skills in public organizations. In retrospect, this innovation was arguably one of the key reforms that made PPPs more popular. Over the years, governments have increasingly come to view PPPs as alternative or complementary ways to finance and manage complex infrastructure projects.
A. Government Constraints
PPP arrangements also allow the public sector to consider otherwise unaffordable projects. In this respect, PPPs help fill the so-called infrastructure gap between what the government can afford and what people need. PPPs thus allow the public sector to leverage more financial resources by using the private sector as an intermediary (Kopp, 1997). This has enabled the
- 6 -
public sector to allocate limited public financial resources to worthy—albeit less commercially viable—projects (Williams, 1992). The theory suggests that countries lacking external sources of revenue (e.g., aid, oil rents, income from natural resources) have experienced severe fiscal crises, followed by the emergence of parliamentary majorities that tend to be more open to foreign private investment. By contrast, countries with greater exogenous or external resources have had milder economic crises and have been less inclined to adopt market-oriented policies (Glasser, 2001). This argument leads one to think that rentier countries that are receiving a large amount of exogenous rent can cushion fiscal shocks and thus be less likely to reform, liberalize, and engage in PPP arrangements. From these arguments, we derive the following hypotheses under the “government constraints” channel: H1: Governments with large deficits and a heavy debt burden are more likely to have PPPs. H2: Rentier countries with large sources of exogenous revenue have soft budget constraints and are therefore less motivated to engage in PPP projects.
B. Political Environment
In a related vein, ethnically divided countries require a larger number of infrastructure projects or public goods and services. These are usually needed to respond to different individual preferences, which prevent the pooling of resources for common public projects (Alesina, Baqir, and Easterly, 1999). Hence, with a certain level of government accountability, various projects satisfy each group separately and reduce the likelihood of conflicts over common resources or public goods and services. But the larger number of infrastructure projects typically puts added financial pressure on the public sector and requires private financing. As indicated above, one would expect governments friendly to market-oriented policies to be relatively more open to private involvement in public infrastructure projects. From these arguments, we derive the following hypotheses under the “political environment” channel: H3: PPP arrangements are likely to be positively correlated with ethnic fractionalization. H4: Governments friendly to market-oriented policies are more likely to engage in PPPs. H5: PPPs are more prevalent in politically stable countries with accountable governments.
C. Market Conditions and Macroeconomic Policies
We now turn to the incentives for the private sector to engage in PPP arrangements. While governments try to leverage their limited resources through private participation in PPPs,
- 7 -
private firms are guided by profit motives. Hence, the profitability of PPP projects is crucial for attracting private sector partners. Infrastructure projects generally have high upfront costs and often need time to generate revenues. This means that the commercial risk of such projects is quite high. One would thus expect market conditions to affect the incentives of private firms to participate in any PPP in infrastructure projects. This implies that demand for the services to be provided and the size of the market are important determinants of the private sector participation in PPPs. Infrastructure services provided to a large number of consumers paying market prices would generally be more profitable and allow a faster recovery of sunk costs. Moreover, the level of income—or purchasing power—of potential customers is also important as it indicates their ability to pay market prices for the services. As with any investment, aggregate demand may not prove sufficiently robust at prevailing market prices to ensure long-run profitability, or it may be subject to macroeconomic shocks. These risks are particularly severe in cases where there has not previously been any infrastructure provider, where potential demand is unknown, or where tariffs on public services were formerly subsidized and collection poor. In some PPP arrangements, the government accepts responsibility for tariff collection or agrees to buy the infrastructure services from the PPP projects at a predetermined price. While this reduces the risks for private investors, it also often requires renegotiations, especially in periods of crisis when the government can no longer afford its contingent liabilities or private investors cannot meet the terms of the contract (Ehrhardt and Irwin, 2004; and Thomsen, 2005). A standard argument for attracting private investment is to establish stable macroeconomic conditions, adequate tariff regimes, a track record of honoring commitments, and reasonable economic policies. Governments that manage to strike the right balance—as reflected, for instance, in sovereign debt ratings given by various rating agencies—are better able to attract private investors and efficient infrastructure service providers. As country ratings and macroeconomic conditions improve, governments are able to attract better providers and more financing (Dailami and Klein, 1997). Another variable that affects private sector incentives to engage in PPP arrangements is exchange-rate risk. Indeed, most infrastructure projects in developing countries are financed with significant amounts of foreign capital through equities or loans. Thus, investors are not only affected by country risks but also by currency risks. Debt repayments, as well as dividend payments, require foreign currencies while revenues and incomes usually accrue in local currency. As a result, unexpected devaluations can substantially alter the profitability of a project. This was the case for many PPPs in the 1990s, notably in Latin America and Southeast Asia. We then derive the following hypotheses under the “market conditions” and “macroeconomic stability” channels: H6: PPPs tend to be more common in larger markets where demand and purchasing power are greater.

- 8 -
H7: PPPs are more prevalent in countries with credible, predictable, and stable macroeconomic conditions. In particular, countries with lower inflation and stable exchange rates are more attractive candidates for PPPs.
D. Institutional Quality and Legal System
Beyond macroeconomic stability, institutional quality matters for investors through its direct influence on country risk. PPP arrangements are contractual arrangements by definition. As such, their sustainability depends critically on the regulatory environment, which in turn is shaped by the quality of institutions. Weak institutions create uncertainties about the quality of regulations and therefore increase country risk. High country risk decreases the incentives for investors to join in PPPs. Strong institutions and effective rule of law are thus important for securing PPP arrangements. Pistor, Raiser, and Gelfer (2000) argue that the effectiveness of legal institutions has a much stronger impact on the availability of external finance than do laws on the books. These arguments lead us to the following hypotheses under the “institutional quality” and “legal system” determinants: H8: Countries with weak institutions and low-quality bureaucracies are more likely to display high country risk and are therefore less likely to foster PPPs. H9: PPPs will be more common in countries with strong and effective legal institutions. H10: PPPs will be more prevalent in environments where the legal code (laws on books) better protects investors’ rights.
E. Past Experience with PPPs
Also affecting PPPs is a government’s reputation and the private sector’s experience in PPP infrastructure projects. Owing to the particular nature of infrastructure investments, past experience in running these projects is a critical predictor of successful future arrangements. Hence, a government’s reputation for honoring past PPPs is important for attracting future PPPs. From this argument, we derive the following additional hypothesis under the “past experience” channel: H11: PPP arrangements are likely to be higher in countries with previous PPP experiences.
F. Private Participation in PPPs
We have so far focused on finding the determinants of PPPs. However, it is equally important to understand the motivations for the different types of PPP contractual agreements. An examination of the World Bank database on PPP arrangements reveals that PPP types vary across industries and that some are more frequent than others. Table 1
- 9 -
summarizes some of the main types of PPP arrangements and describes their most salient characteristics. All types involve private operation and management and most have private investments as well. The main distinguishing characteristics lie in the mode of entry, ultimate ownership, risk sharing from a normative standpoint, and duration of the partnership. This raises the question of what motivates different types of PPP arrangements or what determines the degree of private participation in such arrangements. Theoretical works by Besley and Ghatak (2001), and Francesconi and Muthoo (2004) suggest that the extent of private participation in terms of resource commitments to PPP arrangements depends on the impurity of the goods or services provided. Besley and Ghatak (2001) examine the optimal ownership of pure public goods whose benefits are nonrival and nonexcludable. They show that ownership should be given to the party that values relatively more the benefits generated by the public goods. As most public goods are impure, Francesconi and Muthoo (2004) explore the optimal ownership of such goods. They show that optimal ownership depends the technology structure and on the parties’ valuations, where the valuations depend on the degree to which the goods are impure (i.e., rival and/or excludable). In particular, joint ownership is optimal when the productivities of the parties’ investments are sufficiently similar and the differences in their valuations are sufficiently large. From these arguments, we derive the following hypothesis: H12: The extent of private participation in PPP arrangements is likely to be positively correlated with the degree of impurity of the goods or services to be provided and the technology structure required to provide them.
III. SPECIFICATIONS AND EMPIRICAL METHODOLOGY
The previous section presented 12 hypotheses about possible determinants of the extent of PPPs in infrastructure. Each determinant derives from the theoretical literature and none can simply be ignored. The empirical link between these determinants and the observed prevalence of PPPs in the data, however, depend on how the dependent variable is measured. We consider three different ways of capturing the prevalence of PPPs. First, we take the number of PPP projects, which simply counts the occurrence of PPP arrangements irrespective of the dollar value of each project. Second, we explicitly consider the dollar value of each investment in PPPs, expressed as a percent of GDP. Finally, we consider the extent of private participation that distinguishes different types of PPP arrangements, from simple management contracts to fully fledged privatization via build-own-operate (BOO) and build-own-transfer (BOT). First, in regressions where the dependent variable is the number of PPP projects (i.e., discrete count dependent variable), our basic methodology obviously rests on Poisson or Negative Binomial regression models. To assess the adequacy of Poisson specifications, we look at basic descriptive statistics for event count data. If count mean and variance are very different—equivalent in a Poisson distribution—then the model is likely to be over-dispersed. In our case, over-dispersion occurs because of a large number of zeros. Indeed,
- 10 -
when a country does not have any PPP projects in a given year, the dependent variable is zero. A zero may indicate, however, the absence of any demand for infrastructure projects even if there is no other inherent reason for not having a PPP according to our determinants. In order to address this issue, we also use zero-inflated Poisson (ZIP) specifications, where appropriate. As such, zero values in the ZIP regression model can be interpreted as having two parts: one part comes from the over-dispersion and captures the lack of demand for infrastructure projects, and the other part comes from the prediction of the determinants identified.5 Second, in regressions where the dependent variable is the nonnegative dollar value of investments in PPP projects (i.e., a continuous nonnegative dependent variable), our methodology rests on the Tobit regression model. Indeed, this accounts for the truncation that might otherwise create biases in ordinary least squares (OLS) and generalized least squares (GLS) estimators, both of which are presented throughout as indicative benchmarks. Finally, in regressions where the dependent variable is the extent of private participation in PPP arrangements, we need to consider the ordinal nature of the dependent variable. Indeed, the latter is recorded in an ordinal fashion and is such that the higher the private sector resource commitment, the higher the index, on a scale from 1 to 12 (Table 1). The key econometric issue—as in the earlier case of discrete count dependent variable—is a potential loss of efficiency with the use of OLS. Here, the interpretation of results is more difficult because there is some subjectivity in our assessment of private participation across such broad types of PPPs and therefore in our ranking of the index, which is likely to vary on a case-by-case basis in practice. Moreover, one cannot necessarily rely on the implicit assumption that the ladders on the scale are equally spaced, which is a common problem in construction of indices. Hence, we use both ordered Probit and Logit regression models and interpret the results with caution.6
5 Vuong (1989) proposed a test of the Poisson model versus a ZIP model. The test statistic has a standard normal distribution with large positive values favoring the ZIP model and large negative values favoring the Poisson model. When applied to our case, the z value supports the ZIP model. Notwithstanding this, the results tables display Negative Binomial, Poisson, and ZIP side by side for comparability purposes. These various specifications do not appear to alter the main regression results.
6 The difference between a Probit and a Logit model is essentially the underlying cumulative distribution function, which is assumed to follow a normal distribution for the Probit version and a logistic distribution for the Logit version.
- 11 -
IV. DATA DESCRIPTION
We use the World Bank’s Private Participation in Infrastructure (PPI) database.7 While PPPs are arguably somewhat different from PPIs, the two concepts are often used interchangeably (Thomsen, 2005). The PPI database classifies infrastructure projects into four sectors: energy,8 telecommunications,9 transportation,10 and water.11 The PPI database provides the number of projects in each of these industry sectors as well as the amounts invested in each project after 1983. It constitutes the largest multisector panel data set with standardized information for developing countries. Our analysis is therefore restricted to these industry sectors, and covers the period 1990 to 2003.12
A. Key Features of PPI Database
A brief look at the data reveals that most of the PPP projects in low- and middle-income countries are in Latin America and the Caribbean (47 percent), followed by East Asia and the Pacific (24 percent), and Eastern Europe and Central Asia (15 percent). South Asia, sub-Saharan Africa as well as the Middle East, and North Africa lag well behind with about 4–5 percent each. Clearly, some regions attract more PPPs than others. Intuitively, this observation can be explained partly by the fact that countries in Latin America and East Asia liberalized their economies earlier in the 1990s. Likewise, the breakdown of socialism in Eastern Europe and Central Asia led not only to a complete overhaul of political and economic structures but also to a collapse of socialist infrastructures. This, coupled with the bankruptcy of the public sector, costly social transfer programs, and resulting high debts, may well have forced governments to privatize or engage in PPPs (Von Hirschhausen, 1999).
7 The database covers infrastructure projects that meet three criteria: (i) they are owned or managed by private companies in low- and middle-income countries; (ii) they directly or indirectly serve the public; and (iii) they reached financial closure after 1983 (the database coverage currently extends to 2004 and is updated annually).
8 Energy comprises electricity generation, transmission, and distribution; and natural gas transmission and distribution.
9 Telecommunications includes fixed or mobile local telephony, domestic long-distance telephony, and international long-distance telephony.
10 Transportation covers airport runways and terminals; railway fixed assets, freight, and intercity and local passenger service; toll roads, bridges, highways, and tunnels; and seaport channel dredging and terminals.
11 Water consists of potable water generation and distribution, as well as sewage collection and treatment.
12 Starting only in 1990 reduces the likelihood of biases induced by the large number of zeros in the early period of PPP expansion in the developing world.
- 12 -
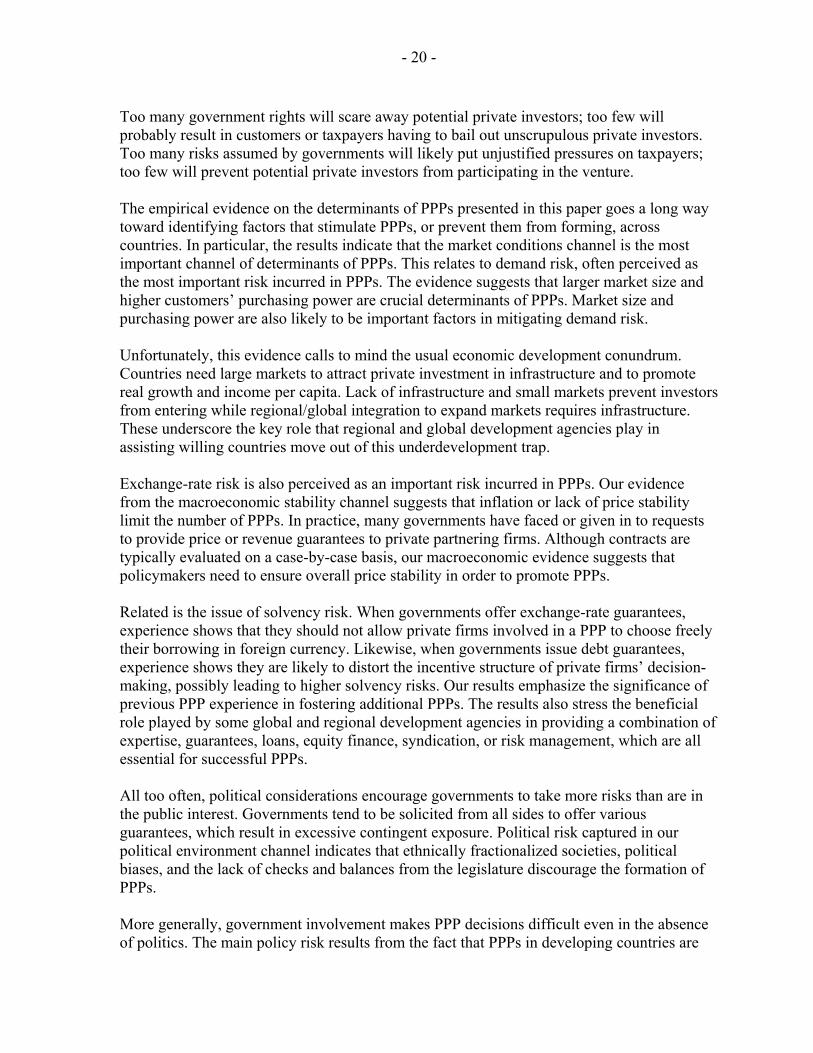
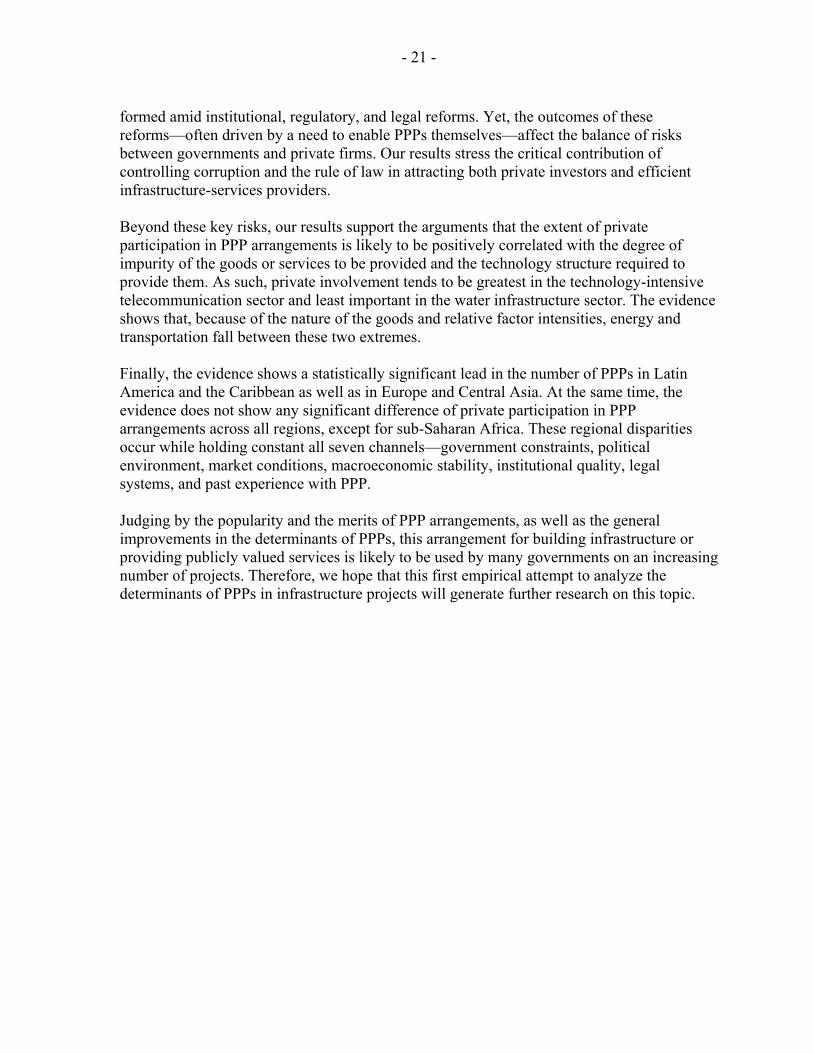
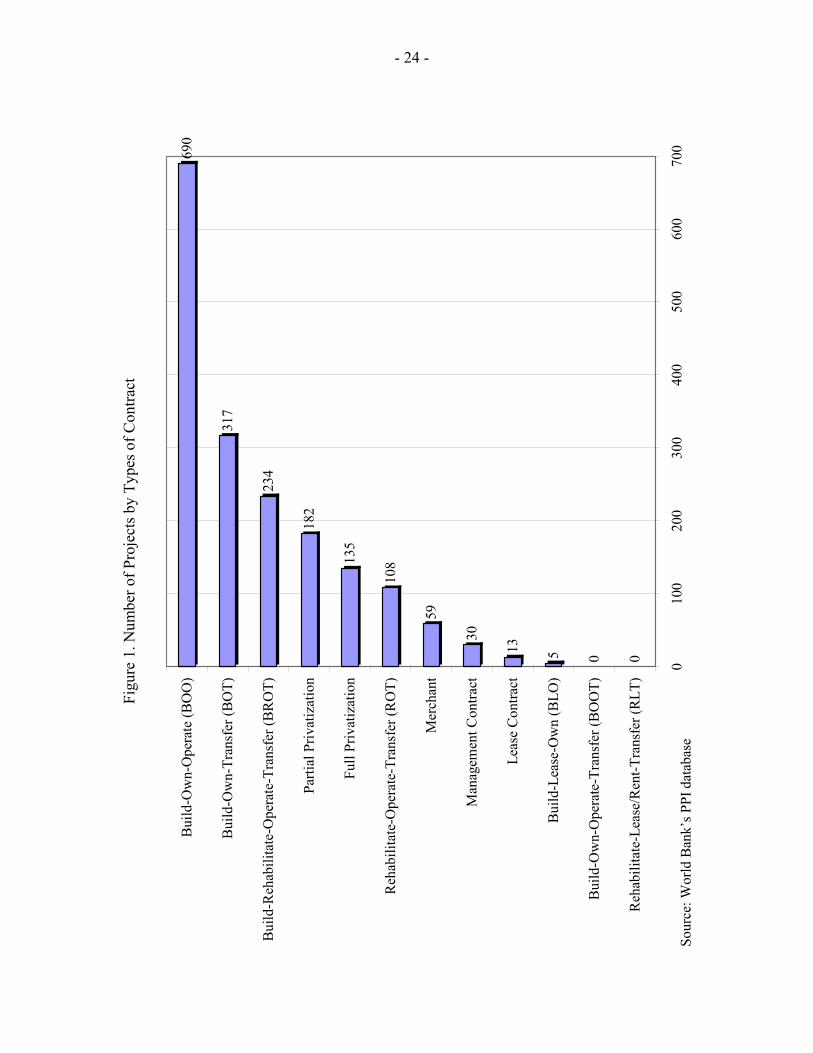
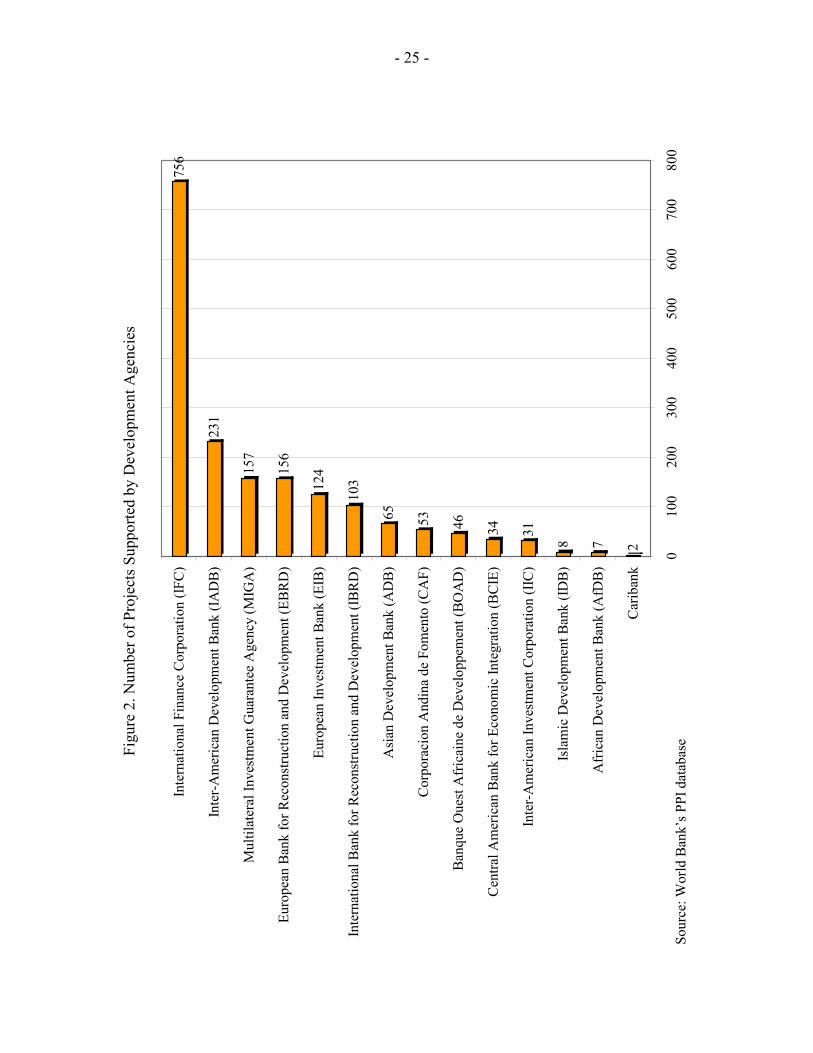
The data also show that investment flows in PPPs increased over time to reach a peak in 1997 of more than US$100 billion. Investment flows in PPPs receded after 1997, to about US$55 billion in 2003, about the same level as in 1995–96. Interestingly, this pattern is similar to that of total private capital investment flows, which also peaked at about US$275 billion in 1997 and declined thereafter. This suggests that PPPs, like private capital investment flows, may react to global shocks such as the Asian, Russian, Turkish, and Argentinean crises, as well as the September 11 events in the United States. Table 2 shows that PPP projects are traditionally more important in energy (1,116 projects in the PPI database) and transportation (735 projects), followed by the telecommunications (600 projects) and water (261 projects). Perhaps more interesting is that the most common mode of entry into the energy and telecommunication sectors is through Greenfield investments, while the most common mode of entry in transportation and water sectors is through concessions.13 Figure 1 shows the range of contract types used in PPPs. The most common for PPPs appears to be build-own-operate (38.9 percent of all projects), followed by build-own-transfer (17.9 percent) and build-rehabilitate-operate-transfer (13.2 percent). These three represent 70 percent of all projects. Finally, a common feature of PPP projects in developing and emerging market economies is their tendency to be supported by multilateral development agencies, mainly the International Finance Corporation (IFC) (see Figure 2). The World Bank is also involved through the Multilateral Investment Guarantee Agency (MIGA), and the International Bank for Reconstruction and Development (IBRD). The most active regional organization is the Inter-American Development Bank (IADB), which supports 231 projects, followed by the European Bank for Reconstruction and Development (EBRD) and the European Investment Bank (EIB) with 156 and 124 projects, respectively, and the Asian Development Bank (ADB), which supports 65 projects. Other organizations trail behind. These organizations get involved by providing a combination of expertise, guarantees, loans, equity finance, syndication, or risk management, all of which are essential for successful PPPs.
B. Variables Capturing Each Channel
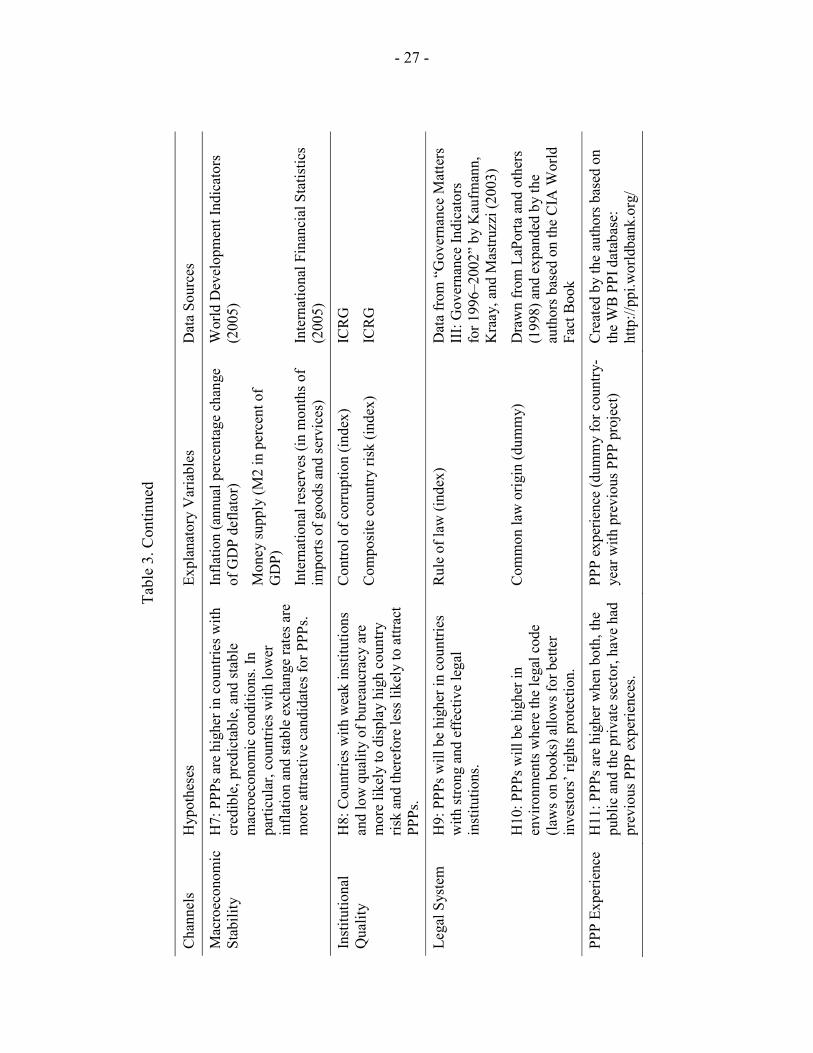
We now describe the data used as explanatory variables to test our 12 hypotheses. We use the same explanatory variables with the three methodologies in an attempt to capture the extent of PPPs (i.e., the number of PPP projects, investment in PPPs, and the extent of private participation in PPPs). Table 3 summarizes the channels, hypotheses, and explanatory variables, as well as the data sources.
13 PPP investments in energy and telecommunications sectors contrast with foreign direct investment (FDI) flows, which are overwhelmingly driven by mergers and acquisitions rather than Greenfield ventures.
- 13 -
For the government constraints channel, we use general government balance and total debt ratios to capture the fiscal constraints per se; the former is expressed as a percent of GDP and the latter as a percent of exports. These flows and stocks capture different facets of the hard budget constraint faced by most governments. On the other hand, few variables can depict the extent of exogenous revenues, or the sources of the soft budget constraint. We choose two of the most important sources for developing countries: the amount of foreign aid per capita, and the extent of revenues from oil exports. Non-oil natural resources could have been another candidate but one that could potentially affect different industries or countries in a less predictable manner. Both aid and oil revenues—contrary to government deficits and debt—typically soften beneficiary governments’ subsequent budget constraints and are therefore likely to reduce reliance on PPPs. Data for the political environment channel consists of ethnic fractionalization from Alesina and others (2003), the political orientation of the chief executive’s party (i.e., left, center, right) from Beck and others (2000), and the number of opposition parties in the legislature also from Beck and others (2000). Ethnic fractionalization measures the heterogeneity of preferences in the overall population. It captures the various demands for public goods and services, as well as the potential tensions, resulting from political endeavors to satisfy these conflicting demands. We expect countries with more fractionalization to have more PPP projects, implicitly considering that demand drives supply. Everything else constant, we expect executives friendly to market oriented policies to respond to those various demands by using PPPs. In order to capture the degree of accountability, or checks and balances, over the executive by the legislature, we use the number of opposition parties in the legislature. An increase in the number of opposition parties means that government policies will tend to be less opportunistic; therefore, political risks may be better controlled. As proxies for the market conditions channel, we use total population for market size and real GDP per capita for purchasing power. These variables are readily available from most development databases. To avoid scaling issues, total population is set in logarithm. Constraints imposed by market conditions are paramount in practice. The private sector will frequently require guarantees and other contractual and/or financial provisions to limit the commercial risks associated with infrastructure projects (Ehrhardt and Irwin, 2004). The credibility of the public sector’s economic policymaking often correlates with the extent of macroeconomic stability, which is broadly seen as a prerequisite for economic development. We choose two key targets and/or outcomes of the nexus of fiscal, monetary, and exchange-rate policies: inflation and international reserves. Lower inflation, controlled money supply, and higher reserves are conducive to greater macroeconomic stability, which we expect will lead to more PPPs. Inflation is simply the annual percentage change in the GDP deflator, M2 is expressed as a percent of GDP, and international reserves are measured in months of imports. Again, these variables are readily available. The variables for the institutional quality and legal system channels come from abundant recent work on governance and legal traditions. Together, better institutions, lower corruption, better rule of law, and better protection of investors are likely to promote PPPs. For measures of institutional quality, we rely on the International Country Risk Guide
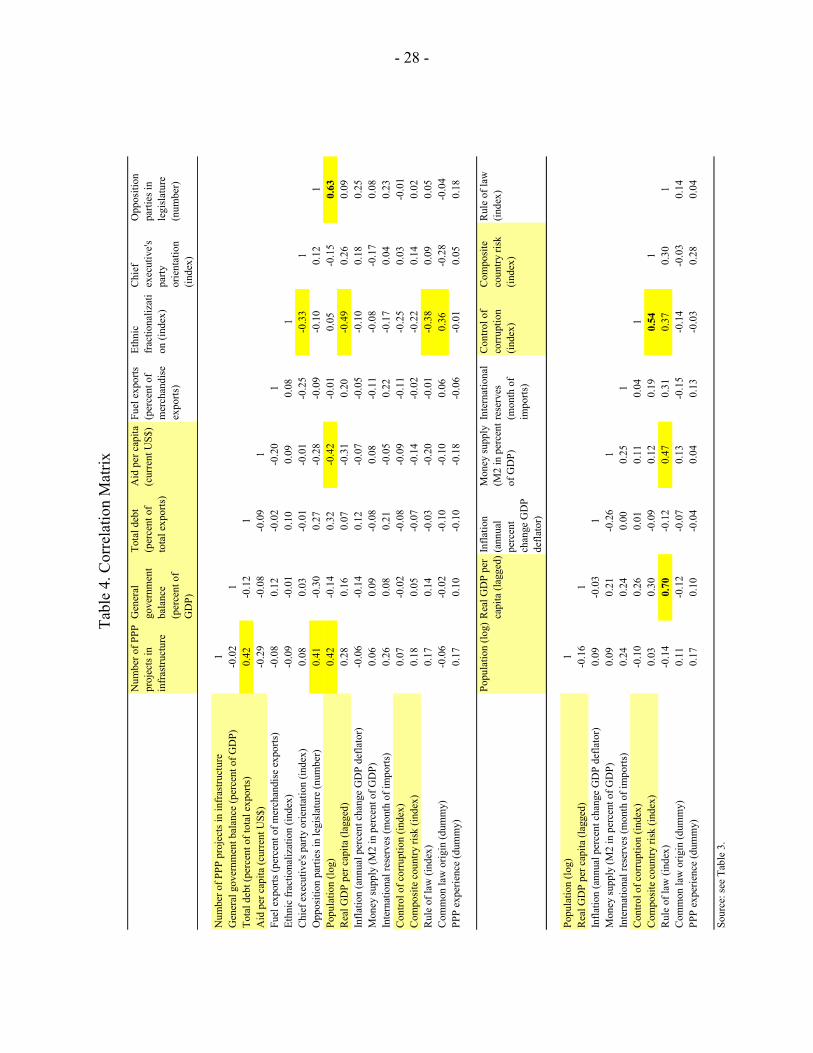
- 14 -
(ICRG), which provides consistent and comparable data on corruption, governance, and country risks for a large cross-section of developing countries over more than two decades from the mid-1980s. The composite index of country risk is a weighted average of political risk (50 percent), financial risk (25 percent), and economic risk (25 percent).14 Furthermore, we choose specific indicators to capture the wealth of these channels without burdening the regressions with multicollinearity (Table 4 presents the correlation matrix across all variables). The rule of law index comes from Kaufmann and others (2003), while investors’ protection laws stem from the common law origin in the tradition of the work of LaPorta and others (1997, 1998). Owing to the high correlation between the rule of law index and real GDP per capita as well as the potential endogeneity induced by the latter, we lag real GDP per capita by one year. Table 4 shows that the 0.70 partial correlation between the rule of law index and lagged real GDP per capita remains high. Similarly, the high partial correlation between the number of opposition parties and the population (0.63), and between control of corruption and country risk (0.54), should be viewed with particular caution. Finally, we construct a dummy of whether a PPP project was undertaken in previous years in a particular country in order to capture the experience channel or determinant as simply as possible. Such experience could provide a proxy for government reputation in attracting private partners. This proxy, however, is agnostic on the success of such previous partnerships. Although, the World Bank’s PPI database provides an indicator of the number of cancelled projects, it does not provide the date or reasons for such cancellations. While such information may be gathered for individual projects, it is not available on a wide cross-sectional basis. All regressions include time dummies intended to capture time-specific global shocks or systemic risks and regional dummies that capture potential regional-specific omitted variables, as well as the support—or sometimes the lack of support—from regional development organizations.
V. ESTIMATION RESULTS AND DISCUSSIONS
We present the regression results of the determinants of PPPs in Tables 5–11. As indicated earlier, we use the same explanatory variables, with all three methodologies based on the number of PPP projects, the investments in PPPs, and the extent of private participation in PPP arrangements, respectively.
A. Number of PPP Projects
Table 5 presents the regressions on the number of PPP projects. Each column displays a different specification from a benchmark OLS to the favored zero-inflated Poisson, or ZIP.
14 Notice that the higher the composite index, the lower the level of country risk.
- 15 -
Note the close similarity of qualitative results between a pooled OLS and a GLS, which explicitly considers the panel nature of the data. We favor pooling data and the zero-inflated version of the Poisson model after failing to reject the Poisson goodness of fit test and performing the Vuong (1989) test described earlier. Results across countries show strong support for market size, purchasing power, and inflation, as well as support for debt, control of corruption, rule of law, and previous PPP experience. These results indicate that the market conditions channel is an important determinant of the number of PPP projects. Actually, there is evidence in favor of all seven channels except the political environment channel. As far as regional dummies are concerned, the results show significant differences relative to the omitted region, Latin America and the Caribbean. The results indicate that all regions except Europe and Central Asia significantly lag Latin America and the Caribbean. Time dummies are included throughout and they confirm the importance of time-specific global shocks that appear as systemic drivers of investment performance, in periods of both boom and crisis. The main insights can be summarized as follows. Countries with large markets and high demand for infrastructure tend to have more PPPs. Governments burdened by high debts tend to choose the PPP option more frequently for building infrastructures. Macroeconomic stability by way of stable inflation matters for attracting PPPs. The role played by institutions that control corruption and provide for the rule of law cannot be neglected because low corruption and strong rule of law provide stable institutional and legal frameworks required for PPP arrangements. Finally, countries with past experience with PPPs tend to have a larger number of PPP projects.
B. Investments in PPPs
Table 6 considers the same determinants, but this time, regressed against the dollar value of investments in PPP expressed as a percent of GDP. Here again OLS and GLS are presented as a benchmark for the relevant Tobit specification. The likelihood ratio test rejects the random effect version of the Tobit specification.15 These results indicate that market conditions, government constraints, institutional quality, and legal system are the most relevant channels for the determination of investments in PPPs. More specifically, countries with large markets, debt-burdened governments, stable inflation, and strong rule of law attract more investments in PPPs. In addition, past experience with
15 The likelihood ratio (LR) test displayed is testing whether the estimated variance of the within-panel variance component is different from zero. The p-value of the LR test—adjusting for the appropriate degrees of freedom—is close to one. This indicates that the estimated variance of the within-panel variance component is not significantly different from zero. This, in turn, supports the pooled Tobit model without random effects.

- 16 -
PPPs affects not only the number of PPP projects but also the level of investment in these projects. Interestingly, the number of opposition parties in the legislature in particular, and the political environment channel in general, do not seem to affect significantly the number of PPP projects but do seem to affect the level of investments in PPP. Hence, there appears to be qualified evidence for each of the seven channels considered but the inference does depend on whether the number of projects or the level of investments is considered. We will now turn to the number of projects but disaggregate multisector data into sector-by-sector data in order to refine the understanding of the determinants of PPPs.
C. Number of PPP Projects in the Energy Sector
Table 7 compares most readily to Table 5, which considers all four industry sectors taken together. The energy sector is most prevalent in the database, with more than 40 percent of all PPP projects in energy infrastructure. Focusing on the similarities, we confirm that limited inflation, controlled corruption, and strong market demand—or customers’ purchasing power—are all important determinants of PPP projects. This gives credence to the macroeconomic stability, market conditions, and institutional quality channels of determinants. In addition, there is strong evidence that governments with large resources from fuel exports have less PPPs in energy infrastructure. Presumably, this is because fuel producers and exporters may have already built their energy infrastructure prior to the beginning of our sample period of 1990. Conversely, governments without such exogenous resources tend to resort to PPPs in order to build their infrastructure in the energy sector. Hence, the government constraints channel appears to be relevant and consistent with the theory suggested by Glasser (2001). There are some indications that the political environment channel may matter for energy- infrastructure PPPs. The significant variable in this channel indicates that center-right governments tend to engage more in PPPs in the energy sector. Again, this supports the contention that countries lacking exogenous revenues face the prospect of more severe fiscal crises, which induce them to reform further and resort to more PPPs. Contrary to the multisector results for all four industry sectors taken together (Table 5), the results from PPPs in energy infrastructure do not support the legal system and PPP experience channels. In addition, country risk comes significantly with the wrong sign, indicating that high-risk countries attract more PPPs in the energy sector.16
16 This could be attributable to the composite nature of the country risk index—a weighted average of political, financial, and economic risks—which may have nontrivial impact on
(continued)
- 17 -
Finally, there appears to be a greater homogeneity across regions, with only the Middle East and Africa lagging behind relative to the Latin America and Caribbean region, which is the omitted region in the regression.
D. Number of PPP Projects in the Telecommunication Sector
Table 8 is comparable with Table 7 but for the telecommunication sector. The striking feature is that few of the identified determinants matter in explaining the number of PPP projects in the telecommunication sector. Indeed, results show macroeconomic stability, institutional quality, legal system, and past PPP experience to be statistically insignificant in explaining the large number of PPP projects in telecommunication. Telecommunications PPP projects represent 22 percent of all infrastructure projects. These findings may be attributable to these projects’ high profitability, which outweighs some policy-induced distortions. However, as expected from such a networked industry, market size appears to be a relatively strong determinant of telecommunications PPP projects. Countries with high debt burdens and with market-friendly governments tend to engage more in telecommunication PPPs. Moreover, PPP projects in telecommunication infrastructure appear to be widespread across all regions, as evidenced by the nonsignificance of all regional dummies—except Europe and Central Asia, which appear to have a significant lead in this industry sector. These findings are consistent with the relative success of telecommunication PPP projects in developing countries.
E. Number of PPP Projects in the Transportation Sector
Table 9 follows the same format as the previous tables with the exclusion of the zero-inflated Poisson specification. This is justified by the outcome of the Poisson goodness of fit test, which suggests the Negative Binomial as an appropriate alternative specification.17 Comparable to multisector results as well as results from the other sectors, the market conditions channel is highly significant. Transportation infrastructure depends on both market size and market demand as captured by population and real GDP per capita. In addition, the legal system channel—and specifically the rule of law—appears particularly important for the prevalence of transportation PPPs. On the regional dummies, Latin America and the Caribbean is significantly ahead of all other regions in terms of the number of transport PPP projects. PPPs. Among many other possible explanations, the existence of guarantees provided by international institutions such as MIGA could mitigate the impact of country risk.
17 The p-value = 0.35 suggests a failure to reject that Poisson is not the appropriate specification.

- 18 -
Slightly unusual is the significance of ethnic fractionalization and the negative sign on the government political orientation in the political environment channel. Thus, ethnically fractionalized societies with center-left governments tend to have more transportation PPPs. This gives credence to Alesina, Baqir, and Easterly (1999), who argue that ethnically divided countries require a larger number of infrastructure projects or public goods and services. The results show that this may well be the case in the transportation sector and that center-left governments are more likely to respond to various pressures from ethically divided constituencies.
F. Number of PPP Projects in the Water Sector
Table 10 compares with Table 9 but applies to the water sector.18 Again, the market conditions channel is highly significant and appears to be the most important channel. Together with strong rule of law, market size and market demand determine the prevalence of PPPs in the water sector. As in the case of the energy sector (Table 7), country risk comes significantly with the wrong sign in the water sector. This is in marked contrast with multisector results for all four industry sectors taken together (Table 6), which indicate that high country risk reduces the dollar value of investment expressed as a percent of GDP. Hence, another possible rationale for this negative sign is the possibility that country risk—possibly with multilateral guarantees—does not actually deter PPP projects in the water sector but leads to smaller investments. On the regional dummies, it appears that the Middle East and North Africa and South Asia are significantly lagging in water infrastructure projects.
G. Extent of Private Participation in PPP Arrangements
In Table 11, the dependent variable is the index of the extent of private participation. The higher the index, the higher the private sector participation in PPP arrangements. As indicated earlier, we use both ordered Probit and Logit specifications but find that the qualitative results are not sensitive to the choice of specification. The empirical evidence shows that countries with better control of corruption and a common law legal origin tend to have PPPs with more private sector involvement. According to LaPorta and others (1997, 1998), as well as many followers, common law systems tend to secure investors’ rights and better protect the private sector. Similarly, strong control over corruption protects investors from possible opportunistic behavior associated with corrupt government officials, which could endanger the PPP venture. Hence, common law and controlled corruption undoubtedly facilitate long-term relationships with the government.
18 Here again the p-value = 0.99 suggests a failure to reject that Poisson is not the appropriate specification.
- 19 -
Results for sector dummies show that PPP projects in the water industry sector tend to have less private sector involvement while those in the telecommunication sector tend to have marginally more private participation.19 This gives credence to the theoretical work of Besley and Ghatak (2001), and Francesconi and Muthoo (2004), who suggest that the extent of private participation in terms of resource commitment in PPP arrangements depends on the impurity of the goods or services provided and the level of technology required. On the one hand, water infrastructure projects generate goods and services that are intrinsically more public in nature—less rival and excludable than in other sectors—with substantially lower technology content. The telecommunication sector, on the other hand, is highly dependent on advanced technologies. The high level of innovation typically requires considerable participation of the private sector, which tends to be the optimal owner and provider of such technology (Francesconi and Muthoo, 2004). The energy and transportation sectors tend to be more capital intensive and fall between these two extremes. The energy industry sector is more public—like water—and relatively technology intensive, although arguably not as innovative as telecommunication. The transportation industry sector probably allows a greater divisibility of assets and private ownership—like telecommunication—but no longer, or not necessarily, involves advanced technologies and sustained innovation. On the regional dummies, the evidence does not show any significant difference of private sector participation in PPP arrangements across all regions, except in sub-Saharan Africa. This region significantly trails the rest of the world in attracting private participation in PPP ventures. With the possible exception of the Banque Ouest Africaine de Développement (BOAD) in West Africa, sub-Saharan African countries receive the weakest support their regional development agencies (Figure 2).
VI. CONCLUDING REMARKS
PPPs are at the heart of governments’ attempts to revive infrastructure investments in advanced as well as developing and emerging market economies. However, as many have emphasized, this strategy does not come without considerable risks (e.g., Ehrhardt and Irwin, 2004). From an economic development perspective, these risks are generally worth taking, or at least considering. Neither governments nor private firms alone are likely to have the resources to build essential infrastructure and bear all of the risks. Hence, the scope for mutually beneficial partnerships between public and private sectors should involve an allocation of rights between partners as well as a corresponding allocation of risks.
19 The telecommunication dummy is significant at the 90 percent level of confidence.
- 20 -
Too many government rights will scare away potential private investors; too few will probably result in customers or taxpayers having to bail out unscrupulous private investors. Too many risks assumed by governments will likely put unjustified pressures on taxpayers; too few will prevent potential private investors from participating in the venture. The empirical evidence on the determinants of PPPs presented in this paper goes a long way toward identifying factors that stimulate PPPs, or prevent them from forming, across countries. In particular, the results indicate that the market conditions channel is the most important channel of determinants of PPPs. This relates to demand risk, often perceived as the most important risk incurred in PPPs. The evidence suggests that larger market size and higher customers’ purchasing power are crucial determinants of PPPs. Market size and purchasing power are also likely to be important factors in mitigating demand risk. Unfortunately, this evidence calls to mind the usual economic development conundrum. Countries need large markets to attract private investment in infrastructure and to promote real growth and income per capita. Lack of infrastructure and small markets prevent investors from entering while regional/global integration to expand markets requires infrastructure. These underscore the key role that regional and global development agencies play in assisting willing countries move out of this underdevelopment trap. Exchange-rate risk is also perceived as an important risk incurred in PPPs. Our evidence from the macroeconomic stability channel suggests that inflation or lack of price stability limit the number of PPPs. In practice, many governments have faced or given in to requests to provide price or revenue guarantees to private partnering firms. Although contracts are typically evaluated on a case-by-case basis, our macroeconomic evidence suggests that policymakers need to ensure overall price stability in order to promote PPPs. Related is the issue of solvency risk. When governments offer exchange-rate guarantees, experience shows that they should not allow private firms involved in a PPP to choose freely their borrowing in foreign currency. Likewise, when governments issue debt guarantees, experience shows they are likely to distort the incentive structure of private firms’ decision-making, possibly leading to higher solvency risks. Our results emphasize the significance of previous PPP experience in fostering additional PPPs. The results also stress the beneficial role played by some global and regional development agencies in providing a combination of expertise, guarantees, loans, equity finance, syndication, or risk management, which are all essential for successful PPPs. All too often, political considerations encourage governments to take more risks than are in the public interest. Governments tend to be solicited from all sides to offer various guarantees, which result in excessive contingent exposure. Political risk captured in our political environment channel indicates that ethnically fractionalized societies, political biases, and the lack of checks and balances from the legislature discourage the formation of PPPs. More generally, government involvement makes PPP decisions difficult even in the absence of politics. The main policy risk results from the fact that PPPs in developing countries are
- 21 -
formed amid institutional, regulatory, and legal reforms. Yet, the outcomes of these reforms—often driven by a need to enable PPPs themselves—affect the balance of risks between governments and private firms. Our results stress the critical contribution of controlling corruption and the rule of law in attracting both private investors and efficient infrastructure-services providers. Beyond these key risks, our results support the arguments that the extent of private participation in PPP arrangements is likely to be positively correlated with the degree of impurity of the goods or services to be provided and the technology structure required to provide them. As such, private involvement tends to be greatest in the technology-intensive telecommunication sector and least important in the water infrastructure sector. The evidence shows that, because of the nature of the goods and relative factor intensities, energy and transportation fall between these two extremes. Finally, the evidence shows a statistically significant lead in the number of PPPs in Latin America and the Caribbean as well as in Europe and Central Asia. At the same time, the evidence does not show any significant difference of private participation in PPP arrangements across all regions, except for sub-Saharan Africa. These regional disparities occur while holding constant all seven channels—government constraints, political environment, market conditions, macroeconomic stability, institutional quality, legal systems, and past experience with PPP. Judging by the popularity and the merits of PPP arrangements, as well as the general improvements in the determinants of PPPs, this arrangement for building infrastructure or providing publicly valued services is likely to be used by many governments on an increasing number of projects. Therefore, we hope that this first empirical attempt to analyze the determinants of PPPs in infrastructure projects will generate further research on this topic.

- 22 -
Tab
le 1
. Cha
ract
eris
tics o
f Mai
n Ty
pes o
f PPP
s and
Inde
x of
Priv
ate
Parti
cipa
tion
Inde
xTy
pes o
f PPP
sA
cron
ymM
ode
of E
ntry
Ope
ratio
n an
d M
aint
enan
ceIn
vest
men
tU
ltim
ate
Ow
ners
hip
Mar
ket R
isk
Dur
atio
n (y
ears
)
1M
anag
emen
t con
tract
Con
tract
Priv
ate
Publ
icPu
blic
Publ
ic3-
52
Leas
ing
Con
tract
Priv
ate
Publ
icPu
blic
Sem
i-priv
ate
8-15
3R
ehab
ilita
te, O
pera
te a
nd T
rans
fer
RO
TC
once
ssio
nPr
ivat
ePr
ivat
ePu
blic
Sem
i-priv
ate
20-3
04
Reh
abili
tate
, Lea
se/R
ent a
nd T
rans
fer
RLR
TC
once
ssio
nPr
ivat
ePr
ivat
ePu
blic
Mor
e-pr
ivat
e20
-30
5M
erch
ant
Gre
enfie
ldPr
ivat
ePr
ivat
ePu
blic
Mor
e-pr
ivat
e20
-30
6B
uild
, Reh
abili
tate
, Ope
rate
and
Tra
nsfe
rB
RO
TC
once
ssio
nPr
ivat
ePr
ivat
ePu
blic
Priv
ate
20-3
07
Bui
ld, O
wn
and
Tran
sfer
BO
TG
reen
field
Priv
ate
Priv
ate
Sem
i-priv
ate
Priv
ate
20-3
08
Bui
ld, O
wn,
Ope
rate
and
Tra
nsfe
rB
OO
TG
reen
field
Priv
ate
Priv
ate
Sem
i-priv
ate
Priv
ate
30+
9B
uild
, Lea
se a
nd O
wn
BLO
Gre
enfie
ldPr
ivat
ePr
ivat
ePr
ivat
ePr
ivat
e30
+10
Bui
ld, O
wn
and
Ope
rate
BO
OG
reen
field
Priv
ate
Priv
ate
Priv
ate
Priv
ate
30+
11Pa
rtial
Priv
atiz
atio
nD
ives
ture
Priv
ate
Priv
ate
Priv
ate
Priv
ate
30+
12Fu
ll Pr
ivat
izat
ion
Div
estu
rePr
ivat
ePr
ivat
ePr
ivat
ePr
ivat
eIn
defin
ite
Sour
ce: T
hom
sen
(200
5), O
ECD
Sec
reta
riat,
Wor
ld B
ank’
s PPI
dat
abas
e, a
nd a
utho
rs' a
sses
smen
ts.

- 23 -
Table 2. Number of Projects by Industry Sector and Mode of Entry
Industry sector Total number of projects Concession Divestiture Greenfield Other mode
Energy 1,116 45 428 626 17Telecommunications 600 8 113 477 2Transportation 735 406 58 226 45Water 261 110 20 81 50
2,712
Source: World Bank’s PPI database
- 24 -
Fig
ure
1. N
umbe
r of P
roje
cts b
y Ty
pes o
f Con
tract
00513
30
59
10813
5
182
234
317
690
010
020
030
040
050
060
070
0
Reh
abili
tate
-Lea
se/R
ent-T
rans
fer (
RLT
)
Bui
ld-O
wn-
Ope
rate
-Tra
nsfe
r (B
OO
T)
Bui
ld-L
ease
-Ow
n (B
LO)
Leas
e C
ontra
ct
Man
agem
ent C
ontra
ct
Mer
chan
t
Reh
abili
tate
-Ope
rate
-Tra
nsfe
r (R
OT)
Full
Priv
atiz
atio
n
Parti
al P
rivat
izat
ion
Bui
ld-R
ehab
ilita
te-O
pera
te-T
rans
fer (
BR
OT)
Bui
ld-O
wn-
Tran
sfer
(BO
T)
Bui
ld-O
wn-
Ope
rate
(BO
O)
Sour
ce: W
orld
Ban
k’s P
PI d
atab
ase
- 25 -
Fig
ure
2. N
umbe
r of P
roje
cts S
uppo
rted
by D
evel
opm
ent A
genc
ies
278
3134465365
10312
4156
157
231
756
010
020
030
040
050
060
070
080
0
Car
iban
k
Afr
ican
Dev
elop
men
t Ban
k (A
fDB
)
Isla
mic
Dev
elop
men
t Ban
k (ID
B)
Inte
r-A
mer
ican
Inve
stm
ent C
orpo
ratio
n (II
C)
Cen
tral A
mer
ican
Ban
k fo
r Eco
nom
ic In
tegr
atio
n (B
CIE
)
Ban
que
Oue
st A
fric
aine
de
Dev
elop
pem
ent (
BO
AD
)
Cor
pora
cion
And
ina
de F
omen
to (C
AF)
Asi
an D
evel
opm
ent B
ank
(AD
B)
Inte
rnat
iona
l Ban
k fo
r Rec
onst
ruct
ion
and
Dev
elop
men
t (IB
RD
)
Euro
pean
Inve
stm
ent B
ank
(EIB
)
Euro
pean
Ban
k fo
r Rec
onst
ruct
ion
and
Dev
elop
men
t (EB
RD
)
Mul
tilat
eral
Inve
stm
ent G
uara
ntee
Age
ncy
(MIG
A)
Inte
r-A
mer
ican
Dev
elop
men
t Ban
k (IA
DB
)
Inte
rnat
iona
l Fin
ance
Cor
pora
tion
(IFC
)
Sour
ce: W
orld
Ban
k’s P
PI d
atab
ase

- 26 -
Tab
le 3
. Cha
nnel
s, H
ypot
hese
s and
Exp
lana
tory
Var
iabl
es, a
nd D
ata
Sour
ces
C
hann
els
Hyp
othe
ses
Expl
anat
ory
Var
iabl
es
Dat
a So
urce
s
Gen
eral
gov
ernm
ent b
alan
ce (a
s a
perc
enta
ge o
f GD
P)
Wor
ld E
cono
mic
Out
look
(200
5)
H1:
Gov
ernm
ents
runn
ing
larg
e de
ficits
and
hig
h de
bt b
urde
n ar
e m
ore
likel
y to
eng
age
in P
PPs.
To
tal d
ebt (
as a
per
cent
age
of to
tal
expo
rts o
f goo
ds a
nd se
rvic
es)
Wor
ld D
evel
opm
ent I
ndic
ator
s (2
005)
Aid
per
cap
ita (c
urre
nt U
S$)
Gov
ernm
ent
Con
stra
ints
H2:
Ren
tier c
ount
ries w
ith la
rge
sour
ces o
f rev
enue
hav
e so
ft bu
dget
co
nstra
ints
and
are
ther
efor
e le
ss
mot
ivat
ed to
eng
age
in P
PP p
roje
cts.
Fuel
exp
orts
(as p
erce
ntag
e of
tota
l m
erch
andi
se e
xpor
ts)
Wor
ld D
evel
opm
ent I
ndic
ator
s (2
005)
H3:
PPP
arr
ange
men
ts a
re li
kely
to b
e po
sitiv
ely
corr
elat
ed w
ith e
thni
c fr
actio
naliz
atio
n.
Ethn
ic fr
actio
naliz
atio
n (in
dex)
D
atas
et fr
om “
Frac
tiona
lizat
ion”
by
Ale
sina
and
oth
ers (
2003
)
H4:
Rig
ht w
ing
gove
rnm
ents
are
mor
e lik
ely
to e
ngag
e in
PPP
s. C
hief
exe
cutiv
e pa
rty’s
orie
ntat
ion
(inde
xed
as 1
=lef
t; 2=
cent
er;
3=rig
ht)
Polit
ical
En
viro
nmen
t
H5:
PPP
s are
hig
her i
n po
litic
ally
st
able
cou
ntrie
s with
acc
ount
able
go
vern
men
ts.
Opp
ositi
on p
artie
s in
the
legi
slat
ure
(num
ber)
Dat
abas
e of
Pol
itica
l Ins
titut
ions
fr
om “
New
Too
ls a
nd N
ew T
ests
in
Com
para
tive
Polit
ical
Ec
onom
y: T
he D
atab
ase
of
Polit
ical
Inst
itutio
ns”
by B
eck
and
othe
rs (2
000)
Popu
latio
n (lo
g)
Mar
ket
Con
ditio
ns
H6:
PPP
s ten
d to
be
high
er in
larg
er
mar
kets
whe
re d
eman
d an
d pu
rcha
sing
pow
er a
re h
ighe
r. R
eal G
DP
per c
apita
(lag
ged
2000
U
S$, p
urch
asin
g po
wer
par
ity)
Wor
ld D
evel
opm
ent I
ndic
ator
s (2
005)
- 27 -
Ta
ble
3. C
ontin
ued
C
hann
els
Hyp
othe
ses
Expl
anat
ory
Var
iabl
es
Dat
a So
urce
s
Infla
tion
(ann
ual p
erce
ntag
e ch
ange
of
GD
P de
flato
r)
Mon
ey su
pply
(M2
in p
erce
nt o
f G
DP)
Wor
ld D
evel
opm
ent I
ndic
ator
s (2
005)
M
acro
econ
omic
St
abili
ty
H7:
PPP
s are
hig
her i
n co
untri
es w
ith
cred
ible
, pre
dict
able
, and
stab
le
mac
roec
onom
ic c
ondi
tions
. In
parti
cula
r, co
untri
es w
ith lo
wer
in
flatio
n an
d st
able
exc
hang
e ra
tes a
re
mor
e at
tract
ive
cand
idat
es fo
r PPP
s. In
tern
atio
nal r
eser
ves (
in m
onth
s of
impo
rts o
f goo
ds a
nd se
rvic
es)
Inte
rnat
iona
l Fin
anci
al S
tatis
tics
(200
5)
Con
trol o
f cor
rupt
ion
(inde
x)
ICR
G
Inst
itutio
nal
Qua
lity
H8:
Cou
ntrie
s with
wea
k in
stitu
tions
an
d lo
w q
ualit
y of
bur
eauc
racy
are
m
ore
likel
y to
dis
play
hig
h co
untry
ris
k an
d th
eref
ore
less
like
ly to
attr
act
PPPs
.
Com
posi
te c
ount
ry ri
sk (i
ndex
) IC
RG
H9:
PPP
s will
be
high
er in
cou
ntrie
s w
ith st
rong
and
eff
ectiv
e le
gal
inst
itutio
ns.
Rul
e of
law
(ind
ex)
Dat
a fr
om “
Gov
erna
nce
Mat
ters
II
I: G
over
nanc
e In
dica
tors
fo
r 199
6–20
02”
by K
aufm
ann,
K
raay
, and
Mas
truzz
i (20
03)
Lega
l Sys
tem
H10
: PPP
s will
be
high
er in
en
viro
nmen
ts w
here
the
lega
l cod
e (la
ws o
n bo
oks)
allo
ws f
or b
ette
r in
vest
ors’
righ
ts p
rote
ctio
n.
Com
mon
law
orig
in (d
umm
y)
Dra
wn
from
LaP
orta
and
oth
ers
(199
8) a
nd e
xpan
ded
by th
e au
thor
s bas
ed o
n th
e C
IA W
orld
Fa
ct B
ook
PPP
Expe
rienc
e H
11: P
PPs a
re h
ighe
r whe
n bo
th, t
he
publ
ic a
nd th
e pr
ivat
e se
ctor
, hav
e ha
d pr
evio
us P
PP e
xper
ienc
es.
PPP
expe
rienc
e (d
umm
y fo
r cou
ntry
-ye
ar w
ith p
revi
ous P
PP p
roje
ct)
Cre
ated
by
the
auth
ors b
ased
on
the
WB
PPI
dat
abas
e:
http
://pp
i.wor
ldba
nk.o
rg/
- 28 -
T
able
4. C
orre
latio
n M
atrix
Num
ber o
f PPP
pr
ojec
ts in
in
fras
truct
ure
Gen
eral
go
vern
men
t ba
lanc
e (p
erce
nt o
f G
DP)
Tota
l deb
t (p
erce
nt o
f to
tal e
xpor
ts)
Aid
per
cap
ita
(cur
rent
US$
)Fu
el e
xpor
ts
(per
cent
of
mer
chan
dise
ex
ports
)
Ethn
ic
frac
tiona
lizat
ion
(ind
ex)
Chi
ef
exec
utiv
e's
party
or
ient
atio
n (in
dex)
Opp
ositi
on
parti
es in
le
gisl
atur
e (n
umbe
r)
Num
ber o
f PPP
pro
ject
s in
infr
astru
ctur
e1
Gen
eral
gov
ernm
ent b
alan
ce (p
erce
nt o
f GD
P)-0
.02
1To
tal d
ebt (
perc
ent o
f tot
al e
xpor
ts)
0.42
-0.1
21
Aid
per
cap
ita (c
urre
nt U
S$)
-0.2
9-0
.08
-0.0
91
Fuel
exp
orts
(per
cent
of m
erch
andi
se e
xpor
ts)
-0.0
80.
12-0
.02
-0.2
01
Ethn
ic fr
actio
naliz
atio
n (in
dex)
-0.0
9-0
.01
0.10
0.09
0.08
1C
hief
exe
cutiv
e's p
arty
orie
ntat
ion
(inde
x)0.
080.
03-0
.01
-0.0
1-0
.25
-0.3
31
Opp
ositi
on p
artie
s in
legi
slat
ure
(num
ber)
0.41
-0.3
00.
27-0
.28
-0.0
9-0
.10
0.12
1Po
pula
tion
(log)
0.42
-0.1
40.
32-0
.42
-0.0
10.
05-0
.15
0.63
Rea
l GD
P pe
r cap
ita (l
agge
d)0.
280.
160.
07-0
.31
0.20
-0.4
90.
260.
09In
flatio
n (a
nnua
l per
cent
cha
nge
GD
P de
flato
r)-0
.06
-0.1
40.
12-0
.07
-0.0
5-0
.10
0.18
0.25
Mon
ey su
pply
(M2
in p
erce
nt o
f GD
P)0.
060.
09-0
.08
0.08
-0.1
1-0
.08
-0.1
70.
08In
tern
atio
nal r
eser
ves (
mon
th o
f im
ports
)0.
260.
080.
21-0
.05
0.22
-0.1
70.
040.
23C
ontro
l of c
orru
ptio
n (in
dex)
0.07
-0.0
2-0
.08
-0.0
9-0
.11
-0.2
50.
03-0
.01
Com
posi
te c
ount
ry ri
sk (i
ndex
)0.
180.
05-0
.07
-0.1
4-0
.02
-0.2
20.
140.
02R
ule
of la
w (i
ndex
)0.
170.
14-0
.03
-0.2
0-0
.01
-0.3
80.
090.
05C
omm
on la
w o
rigin
(dum
my)
-0.0
6-0
.02
-0.1
0-0
.10
0.06
0.36
-0.2
8-0
.04
PPP
expe
rienc
e (d
umm
y)0.
170.
10-0
.10
-0.1
8-0
.06
-0.0
10.
050.
18
Popu
latio
n (lo
g)R
eal G
DP
per
capi
ta (l
agge
d)In
flatio
n (a
nnua
l pe
rcen
t ch
ange
GD
P de
flato
r)
Mon
ey su
pply
(M
2 in
per
cent
of
GD
P)
Inte
rnat
iona
l re
serv
es
(mon
th o
f im
ports
)
Con
trol o
f co
rrupt
ion
(inde
x)
Com
posi
te
coun
try ri
sk
(inde
x)
Rul
e of
law
(in
dex)
Popu
latio
n (lo
g)1
Rea
l GD
P pe
r cap
ita (l
agge
d)-0
.16
1In
flatio
n (a
nnua
l per
cent
cha
nge
GD
P de
flato
r)0.
09-0
.03
1M
oney
supp
ly (M
2 in
per
cent
of G
DP)
0.09
0.21
-0.2
61
Inte
rnat
iona
l res
erve
s (m
onth
of i
mpo
rts)
0.24
0.24
0.00
0.25
1C
ontro
l of c
orru
ptio
n (in
dex)
-0.1
00.
260.
010.
110.
041
Com
posi
te c
ount
ry ri
sk (i
ndex
)0.
030.
30-0
.09
0.12
0.19
0.54
1R
ule
of la
w (i
ndex
)-0
.14
0.70
-0.1
20.
470.
310.
370.
301
Com
mon
law
orig
in (d
umm
y)0.
11-0
.12
-0.0
70.
13-0
.15
-0.1
4-0
.03
0.14
PPP
expe
rienc
e (d
umm
y)0.
170.
10-0
.04
0.04
0.13
-0.0
30.
280.
04
Sour
ce: s
ee T
able
3.

- 29 -
Table 5. Determinants of the Number of PPP Projects in Infrastructure
Dependent variable: Number of PPP projects OLS GLS Poisson Negative Binomial
Zero-Inflated Poisson
General government balance (percent of GDP) -6.952 -6.093 -0.605 1.707 -0.185(1.03) (0.85) (0.29) (0.85) (0.07)
Total debt (percent of total exports) 0.117 0.108 0.006 0.005 0.009(2.15)* (4.81)** (1.38) (1.06) (2.17)*
Aid per capita (current US$) 0.008 0.003 0.000 0.002 -0.002(0.98) (0.30) (0.03) (0.50) (0.44)
Fuel exports (percent of merchandise exports) -0.037 -0.045 -0.006 -0.006 0.001(2.78)** (3.41)** (1.48) (1.61) (0.32)
Ethnic fractionalization (index) 1.811 2.004 1.088 0.936 0.681(1.67) (1.53) (3.03)** (2.72)** (1.65)
Chief executive's party orientation (index) -0.200 -0.311 0.040 0.008 0.067(1.04) (1.44) (0.81) (0.16) (1.37)
Opposition parties in legislature (number) 0.013 0.016 0.000 0.001 0.000(1.86) (3.41)** (0.40) (0.82) (0.25)
Population (log) 1.582 1.382 0.732 0.643 0.617(4.85)** (4.04)** (6.72)** (7.01)** (5.18)**
Real GDP per capita (lagged) 0.001 0.001 0.000 0.000 0.000(4.06)** (4.43)** (3.51)** (3.33)** (2.19)*
Inflation (annual percent change GDP deflator) -0.066 -0.059 -0.015 -0.012 -0.015(4.05)** (4.37)** (4.96)** (3.60)** (5.05)**
Money supply (M2 in percent of GDP) -0.035 -0.038 0.000 0.000 0.003(2.43)* (2.42)* (0.02) (0.00) (0.66)
International reserves (month of imports) 0.150 0.148 -0.004 0.018 0.000(1.24) (1.16) (0.10) (0.46) (0.01)
Control of corruption (index) 0.140 0.149 0.170 0.061 0.212(0.60) (0.55) (2.04)* (0.84) (2.53)*
Composite country risk (index) 0.002 0.031 -0.005 0.006 -0.013(0.07) (1.16) (0.60) (0.80) (1.45)
Rule of law (index) 0.833 0.367 0.511 0.500 0.400(1.33) (0.51) (2.92)** (2.94)** (2.10)*
Common law origin (dummy) 0.026 -0.003 -0.139 -0.331 -0.055(0.05) 0.00 (0.69) (1.59) (0.24)
PPP experience (dummy) -0.372 0.518 0.227 -0.090 0.619(0.63) (0.77) (0.87) (0.38) (2.15)*
East-Asia and Pacific dummy -0.401 -0.125 -0.734 -0.382 -0.831(0.38) (0.11) (2.49)* (1.32) (2.77)**
Europe and Central Asia dummy -2.381 -2.569 -0.350 -0.393 -0.364(3.13)** (3.56)** (1.68) (2.06)* (1.89)
Sub-Saharan Africa dummy -2.605 -2.299 -1.410 -1.114 -1.398(3.25)** (2.53)* (4.51)** (3.91)** (4.48)**
Middle East and North Africa dummy -3.519 -2.785 -1.732 -1.637 -1.484(4.29)** (2.58)** (4.93)** (5.37)** (4.19)**
South Asia dummy -3.942 -3.944 -1.493 -0.981 -1.486(2.15)* (2.47)* (3.28)** (2.18)* (3.14)**
Time dummies Jointly Not Jointly Jointly JointlySignificant Included Significant Significant Significant
Constant -2.841 -6.615 -3.456 -3.545 -2.772(1.57) (3.34)** (5.88)** (6.25)** (4.61)**
Observations 457 457 457 457 457 R-squared 0.500 Number of id Not Panel 70 Not Panel Not Panel Not PanelPseudo R2 0.55 0.21 Poisson Goodness of Fit Chi-Square Not Valid Not Valid 870.0 Not Valid Not ValidVuong Test: Poisson versus ZIP Not Valid Not Valid Not Valid Not Valid Z=3.77
Robust t statistics in parentheses: * significant at 5 percent; ** significant at 1 percent.
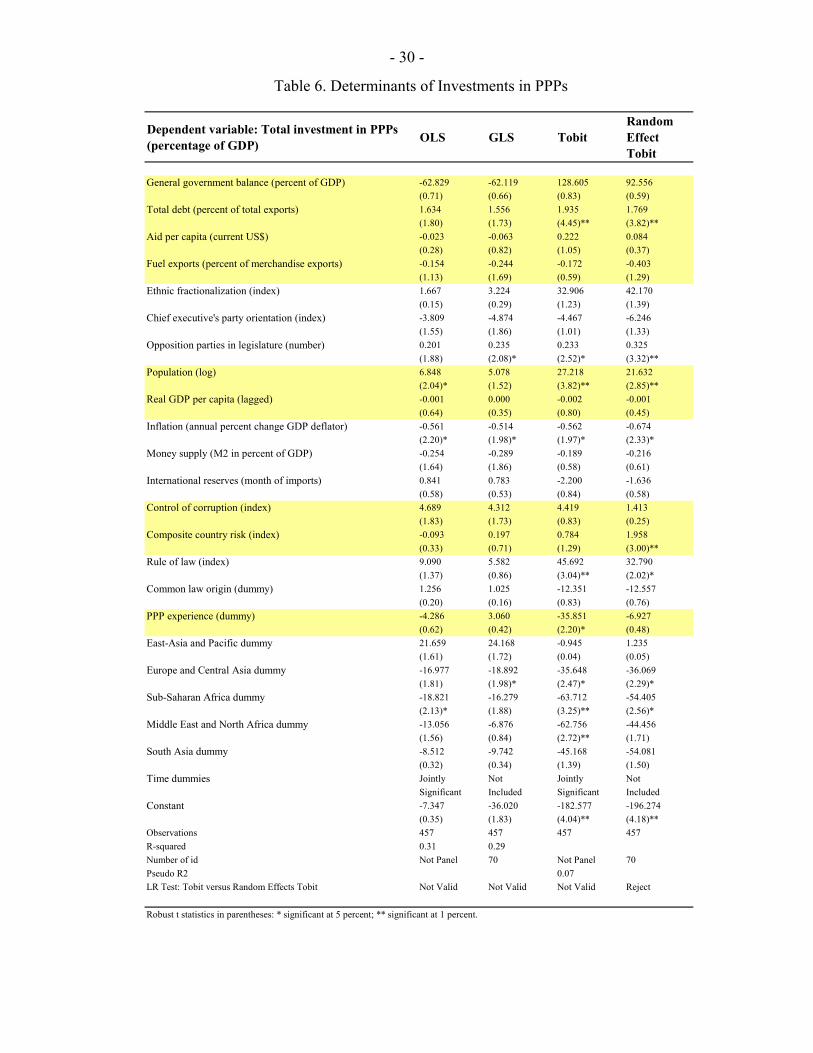
- 30 -
Table 6. Determinants of Investments in PPPs
Dependent variable: Total investment in PPPs (percentage of GDP) OLS GLS Tobit
Random Effect Tobit
General government balance (percent of GDP) -62.829 -62.119 128.605 92.556(0.71) (0.66) (0.83) (0.59)
Total debt (percent of total exports) 1.634 1.556 1.935 1.769(1.80) (1.73) (4.45)** (3.82)**
Aid per capita (current US$) -0.023 -0.063 0.222 0.084(0.28) (0.82) (1.05) (0.37)
Fuel exports (percent of merchandise exports) -0.154 -0.244 -0.172 -0.403(1.13) (1.69) (0.59) (1.29)
Ethnic fractionalization (index) 1.667 3.224 32.906 42.170(0.15) (0.29) (1.23) (1.39)
Chief executive's party orientation (index) -3.809 -4.874 -4.467 -6.246(1.55) (1.86) (1.01) (1.33)
Opposition parties in legislature (number) 0.201 0.235 0.233 0.325(1.88) (2.08)* (2.52)* (3.32)**
Population (log) 6.848 5.078 27.218 21.632(2.04)* (1.52) (3.82)** (2.85)**
Real GDP per capita (lagged) -0.001 0.000 -0.002 -0.001(0.64) (0.35) (0.80) (0.45)
Inflation (annual percent change GDP deflator) -0.561 -0.514 -0.562 -0.674(2.20)* (1.98)* (1.97)* (2.33)*
Money supply (M2 in percent of GDP) -0.254 -0.289 -0.189 -0.216(1.64) (1.86) (0.58) (0.61)
International reserves (month of imports) 0.841 0.783 -2.200 -1.636(0.58) (0.53) (0.84) (0.58)
Control of corruption (index) 4.689 4.312 4.419 1.413(1.83) (1.73) (0.83) (0.25)
Composite country risk (index) -0.093 0.197 0.784 1.958(0.33) (0.71) (1.29) (3.00)**
Rule of law (index) 9.090 5.582 45.692 32.790(1.37) (0.86) (3.04)** (2.02)*
Common law origin (dummy) 1.256 1.025 -12.351 -12.557(0.20) (0.16) (0.83) (0.76)
PPP experience (dummy) -4.286 3.060 -35.851 -6.927(0.62) (0.42) (2.20)* (0.48)
East-Asia and Pacific dummy 21.659 24.168 -0.945 1.235(1.61) (1.72) (0.04) (0.05)
Europe and Central Asia dummy -16.977 -18.892 -35.648 -36.069(1.81) (1.98)* (2.47)* (2.29)*
Sub-Saharan Africa dummy -18.821 -16.279 -63.712 -54.405(2.13)* (1.88) (3.25)** (2.56)*
Middle East and North Africa dummy -13.056 -6.876 -62.756 -44.456(1.56) (0.84) (2.72)** (1.71)
South Asia dummy -8.512 -9.742 -45.168 -54.081(0.32) (0.34) (1.39) (1.50)
Time dummies Jointly Not Jointly NotSignificant Included Significant Included
Constant -7.347 -36.020 -182.577 -196.274(0.35) (1.83) (4.04)** (4.18)**
Observations 457 457 457 457 R-squared 0.31 0.29 Number of id Not Panel 70 Not Panel 70 Pseudo R2 0.07 LR Test: Tobit versus Random Effects Tobit Not Valid Not Valid Not Valid Reject
Robust t statistics in parentheses: * significant at 5 percent; ** significant at 1 percent.
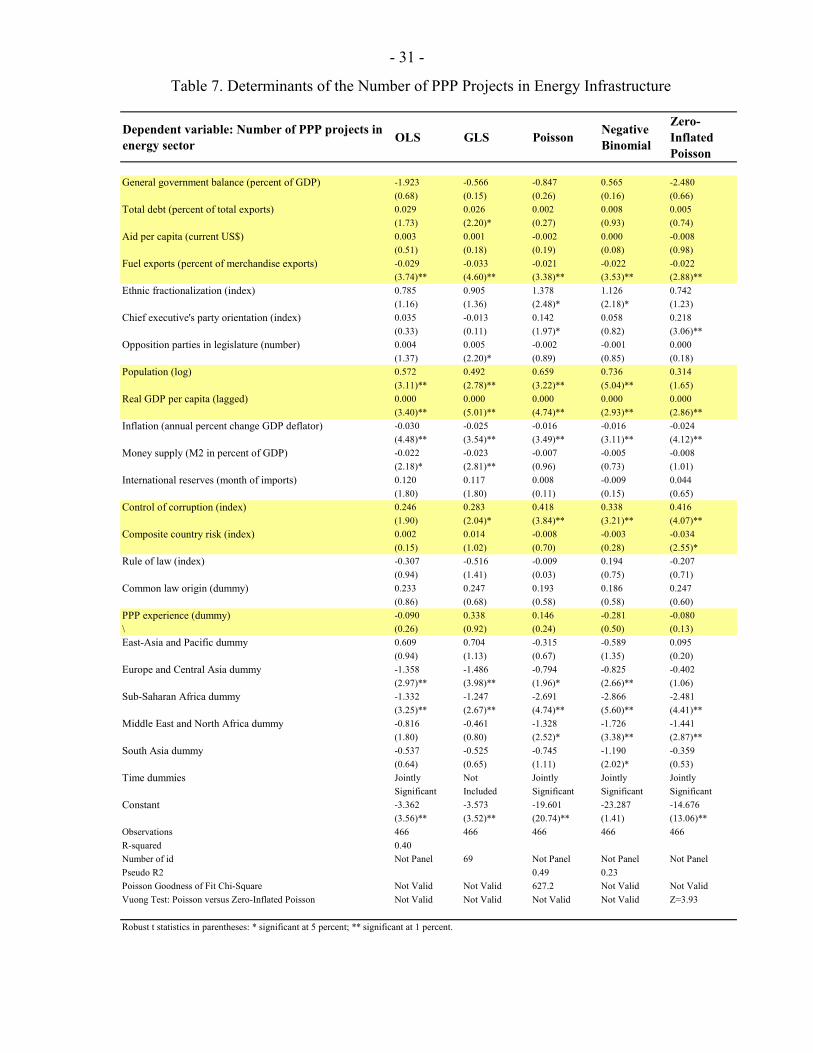
- 31 -
Table 7. Determinants of the Number of PPP Projects in Energy Infrastructure
Dependent variable: Number of PPP projects in energy sector OLS GLS Poisson Negative
Binomial
Zero-Inflated Poisson
General government balance (percent of GDP) -1.923 -0.566 -0.847 0.565 -2.480(0.68) (0.15) (0.26) (0.16) (0.66)
Total debt (percent of total exports) 0.029 0.026 0.002 0.008 0.005(1.73) (2.20)* (0.27) (0.93) (0.74)
Aid per capita (current US$) 0.003 0.001 -0.002 0.000 -0.008(0.51) (0.18) (0.19) (0.08) (0.98)
Fuel exports (percent of merchandise exports) -0.029 -0.033 -0.021 -0.022 -0.022(3.74)** (4.60)** (3.38)** (3.53)** (2.88)**
Ethnic fractionalization (index) 0.785 0.905 1.378 1.126 0.742(1.16) (1.36) (2.48)* (2.18)* (1.23)
Chief executive's party orientation (index) 0.035 -0.013 0.142 0.058 0.218(0.33) (0.11) (1.97)* (0.82) (3.06)**
Opposition parties in legislature (number) 0.004 0.005 -0.002 -0.001 0.000(1.37) (2.20)* (0.89) (0.85) (0.18)
Population (log) 0.572 0.492 0.659 0.736 0.314(3.11)** (2.78)** (3.22)** (5.04)** (1.65)
Real GDP per capita (lagged) 0.000 0.000 0.000 0.000 0.000(3.40)** (5.01)** (4.74)** (2.93)** (2.86)**
Inflation (annual percent change GDP deflator) -0.030 -0.025 -0.016 -0.016 -0.024(4.48)** (3.54)** (3.49)** (3.11)** (4.12)**
Money supply (M2 in percent of GDP) -0.022 -0.023 -0.007 -0.005 -0.008(2.18)* (2.81)** (0.96) (0.73) (1.01)
International reserves (month of imports) 0.120 0.117 0.008 -0.009 0.044(1.80) (1.80) (0.11) (0.15) (0.65)
Control of corruption (index) 0.246 0.283 0.418 0.338 0.416(1.90) (2.04)* (3.84)** (3.21)** (4.07)**
Composite country risk (index) 0.002 0.014 -0.008 -0.003 -0.034(0.15) (1.02) (0.70) (0.28) (2.55)*
Rule of law (index) -0.307 -0.516 -0.009 0.194 -0.207(0.94) (1.41) (0.03) (0.75) (0.71)
Common law origin (dummy) 0.233 0.247 0.193 0.186 0.247(0.86) (0.68) (0.58) (0.58) (0.60)
PPP experience (dummy) -0.090 0.338 0.146 -0.281 -0.080\ (0.26) (0.92) (0.24) (0.50) (0.13)East-Asia and Pacific dummy 0.609 0.704 -0.315 -0.589 0.095
(0.94) (1.13) (0.67) (1.35) (0.20)Europe and Central Asia dummy -1.358 -1.486 -0.794 -0.825 -0.402
(2.97)** (3.98)** (1.96)* (2.66)** (1.06)Sub-Saharan Africa dummy -1.332 -1.247 -2.691 -2.866 -2.481
(3.25)** (2.67)** (4.74)** (5.60)** (4.41)**Middle East and North Africa dummy -0.816 -0.461 -1.328 -1.726 -1.441
(1.80) (0.80) (2.52)* (3.38)** (2.87)**South Asia dummy -0.537 -0.525 -0.745 -1.190 -0.359
(0.64) (0.65) (1.11) (2.02)* (0.53)Time dummies Jointly Not Jointly Jointly Jointly
Significant Included Significant Significant SignificantConstant -3.362 -3.573 -19.601 -23.287 -14.676
(3.56)** (3.52)** (20.74)** (1.41) (13.06)**Observations 466 466 466 466 466 R-squared 0.40 Number of id Not Panel 69 Not Panel Not Panel Not PanelPseudo R2 0.49 0.23 Poisson Goodness of Fit Chi-Square Not Valid Not Valid 627.2 Not Valid Not ValidVuong Test: Poisson versus Zero-Inflated Poisson Not Valid Not Valid Not Valid Not Valid Z=3.93
Robust t statistics in parentheses: * significant at 5 percent; ** significant at 1 percent.

- 32 -
Table 8. Determinants of the Number of PPP Projects in Telecommunication Infrastructure
Dependent variable: Number of PPP projects in telecommunication sector OLS GLS Poisson Negative
Binomial
Zero-Inflated Poisson
General government balance (percent of GDP) -1.016 -0.965 -0.049 5.292 -4.625(0.35) (0.39) (0.01) (1.43) (0.89)
Total debt (percent of total exports) 0.011 0.009 0.022 0.009 0.033(0.60) (1.12) (2.12)* (0.90) (3.43)**
Aid per capita (current US$) 0.004 0.003 0.005 0.004 0.014(1.39) (0.76) (0.83) (0.72) (1.45)
Fuel exports (percent of merchandise exports) 0.007 0.005 0.014 0.005 0.023(1.56) (1.04) (2.51)* (0.82) (3.44)**
Ethnic fractionalization (index) -0.032 0.032 0.798 1.219 0.141(0.08) (0.07) (1.04) (1.76) (0.15)
Chief executive's party orientation (index) 0.069 0.055 0.257 0.193 0.366(0.93) (0.71) (2.26)* (1.78) (2.68)**
Opposition parties in legislature (number) 0.004 0.005 0.003 0.004 0.001(2.09)* (2.72)** (1.88) (2.15)* (0.25)
Population (log) 0.284 0.247 0.549 0.429 0.421(1.82) (2.08)* (3.70)** (2.80)** (2.09)*
Real GDP per capita (lagged) 0.000 0.000 0.000 0.000 0.000(0.10) (0.10) (1.14) (0.71) (0.58)
Inflation (annual percent change GDP deflator) -0.010 -0.006 -0.018 -0.012 -0.006(1.89) (1.29) (3.09)** (1.82) (0.91)
Money supply (M2 in percent of GDP) -0.002 -0.004 0.001 -0.001 0.007(0.45) (0.68) (0.13) (0.06) (0.47)
International reserves (month of imports) -0.050 -0.049 -0.052 0.012 -0.046(0.99) (1.13) (0.93) (0.21) (0.68)
Control of corruption (index) -0.087 -0.059 -0.054 -0.036 -0.023(0.85) (0.62) (0.41) (0.28) (0.11)
Composite country risk (index) 0.022 0.026 0.040 0.039 -0.009(2.23)* (2.72)** (2.11)* (2.51)* (0.31)
Rule of law (index) 0.176 0.122 0.577 0.477 0.668(1.08) (0.49) (1.87) (1.50) (1.59)
Common law origin (dummy) -0.063 -0.059 -0.725 -0.572 0.000(0.39) (0.24) (1.60) (1.52) 0.00
PPP experience (dummy) -0.137 -0.108 -0.419 -0.613 0.543(0.80) (0.47) (1.20) (1.78) (1.11)
East-Asia and Pacific dummy -0.126 -0.004 -0.247 0.032 0.738(0.30) (0.01) (0.44) (0.05) (0.98)
Europe and Central Asia dummy 0.514 0.372 1.091 1.035 0.993(1.92) (1.44) (3.59)** (3.31)** (2.94)**
Sub-Saharan Africa dummy -0.051 -0.053 0.052 0.042 -0.079(0.19) (0.16) (0.11) (0.09) (0.14)
Middle East and North Africa dummy -0.293 -0.119 -0.600 -0.521 0.364(1.40) (0.31) (0.91) (0.89) (0.36)
South Asia dummy -0.411 -0.332 -0.393 -0.051 -0.180(0.59) (0.60) (0.50) (0.06) (0.18)
Time dummies Jointly Not Jointly Jointly JointlySignificant Included Significant Significant Significant
Constant -1.810 -1.839 -7.022 -6.860 -4.592(2.71)** (2.65)** (4.64)** (5.78)** (2.37)*
Observations 483 483 483 483 483 R-squared 0.20 Number of id Not Panel 70 Not Panel Not Panel Not PanelPseudo R2 0.34 0.15 Poisson Goodness of Fit Chi-Square Not Valid Not Valid 550.6 Not Valid Not ValidVuong Test: Poisson versus Zero-Inflated Poisson Not Valid Not Valid Not Valid Not Valid Z=3.58
Robust t statistics in parentheses: * significant at 5 percent; ** significant at 1 percent.
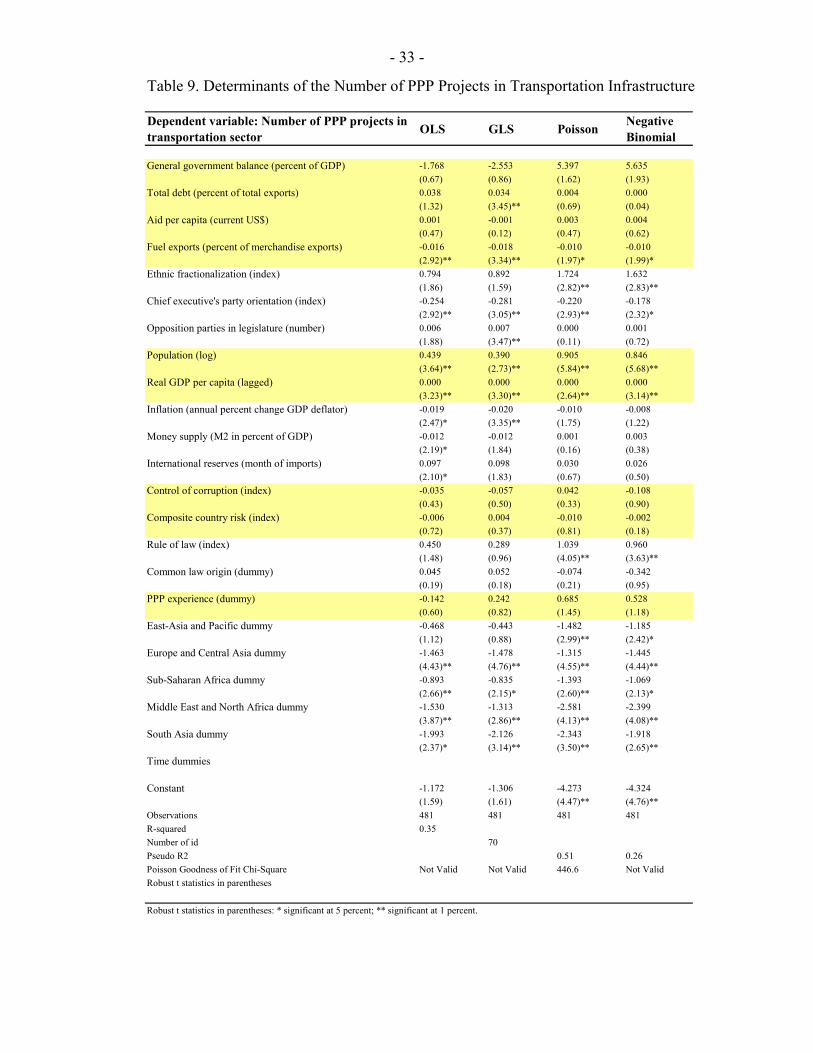
- 33 -
Table 9. Determinants of the Number of PPP Projects in Transportation Infrastructure
Dependent variable: Number of PPP projects in transportation sector OLS GLS Poisson Negative
Binomial
General government balance (percent of GDP) -1.768 -2.553 5.397 5.635(0.67) (0.86) (1.62) (1.93)
Total debt (percent of total exports) 0.038 0.034 0.004 0.000(1.32) (3.45)** (0.69) (0.04)
Aid per capita (current US$) 0.001 -0.001 0.003 0.004(0.47) (0.12) (0.47) (0.62)
Fuel exports (percent of merchandise exports) -0.016 -0.018 -0.010 -0.010(2.92)** (3.34)** (1.97)* (1.99)*
Ethnic fractionalization (index) 0.794 0.892 1.724 1.632(1.86) (1.59) (2.82)** (2.83)**
Chief executive's party orientation (index) -0.254 -0.281 -0.220 -0.178(2.92)** (3.05)** (2.93)** (2.32)*
Opposition parties in legislature (number) 0.006 0.007 0.000 0.001(1.88) (3.47)** (0.11) (0.72)
Population (log) 0.439 0.390 0.905 0.846(3.64)** (2.73)** (5.84)** (5.68)**
Real GDP per capita (lagged) 0.000 0.000 0.000 0.000(3.23)** (3.30)** (2.64)** (3.14)**
Inflation (annual percent change GDP deflator) -0.019 -0.020 -0.010 -0.008(2.47)* (3.35)** (1.75) (1.22)
Money supply (M2 in percent of GDP) -0.012 -0.012 0.001 0.003(2.19)* (1.84) (0.16) (0.38)
International reserves (month of imports) 0.097 0.098 0.030 0.026(2.10)* (1.83) (0.67) (0.50)
Control of corruption (index) -0.035 -0.057 0.042 -0.108(0.43) (0.50) (0.33) (0.90)
Composite country risk (index) -0.006 0.004 -0.010 -0.002(0.72) (0.37) (0.81) (0.18)
Rule of law (index) 0.450 0.289 1.039 0.960(1.48) (0.96) (4.05)** (3.63)**
Common law origin (dummy) 0.045 0.052 -0.074 -0.342(0.19) (0.18) (0.21) (0.95)
PPP experience (dummy) -0.142 0.242 0.685 0.528(0.60) (0.82) (1.45) (1.18)
East-Asia and Pacific dummy -0.468 -0.443 -1.482 -1.185(1.12) (0.88) (2.99)** (2.42)*
Europe and Central Asia dummy -1.463 -1.478 -1.315 -1.445(4.43)** (4.76)** (4.55)** (4.44)**
Sub-Saharan Africa dummy -0.893 -0.835 -1.393 -1.069(2.66)** (2.15)* (2.60)** (2.13)*
Middle East and North Africa dummy -1.530 -1.313 -2.581 -2.399(3.87)** (2.86)** (4.13)** (4.08)**
South Asia dummy -1.993 -2.126 -2.343 -1.918(2.37)* (3.14)** (3.50)** (2.65)**
Time dummies
Constant -1.172 -1.306 -4.273 -4.324(1.59) (1.61) (4.47)** (4.76)**
Observations 481 481 481 481 R-squared 0.35 Number of id 70 Pseudo R2 0.51 0.26 Poisson Goodness of Fit Chi-Square Not Valid Not Valid 446.6 Not ValidRobust t statistics in parentheses
Robust t statistics in parentheses: * significant at 5 percent; ** significant at 1 percent.

- 34 -
Table 10. Determinants of the Number of PPP Projects in Water Infrastructure
Dependent variable: Number of PPP projects in water sector OLS GLS Poisson Negative
Binomial
General government balance (percent of GDP) -1.606 -1.675 -2.839 -2.235(1.55) (1.50) (0.68) (0.47)
Total debt (percent of total exports) 0.012 0.011 0.006 0.006(2.05)* (2.97)** (0.72) (0.75)
Aid per capita (current US$) 0.000 -0.001 0.002 0.003(0.09) (0.42) (0.27) (0.35)
Fuel exports (percent of merchandise exports) -0.006 -0.007 0.003 0.004(2.54)* (3.25)** (0.42) (0.46)
Ethnic fractionalization (index) 0.267 0.281 0.975 0.892(1.24) (1.40) (1.28) (1.02)
Chief executive's party orientation (index) -0.073 -0.090 -0.209 -0.209(1.99)* (2.67)** (1.81) (1.77)
Opposition parties in legislature (number) 0.001 0.001 -0.003 -0.003(0.59) (1.46) (1.33) (1.25)
Population (log) 0.110 0.088 0.946 0.929(2.00)* (1.62) (4.10)** (3.67)**
Real GDP per capita (lagged) 0.000 0.000 0.000 0.000(4.02)** (6.08)** (3.68)** (3.63)**
Inflation (annual percent change GDP deflator) -0.002 -0.003 -0.007 -0.007(0.66) (1.38) (1.00) (0.96)
Money supply (M2 in percent of GDP) 0.001 0.001 0.029 0.028(0.51) (0.61) (2.54)* (2.41)*
International reserves (month of imports) 0.049 0.051 0.114 0.118(2.18)* (2.60)** (1.50) (1.52)
Control of corruption (index) -0.007 -0.024 0.159 0.134(0.18) (0.57) (0.87) (0.61)
Composite country risk (index) -0.005 0.000 -0.034 -0.035(1.49) (0.08) (2.05)* (2.00)*
Rule of law (index) -0.048 -0.130 0.747 0.768(0.41) (1.18) (2.00)* (2.05)*
Common law origin (dummy) -0.117 -0.118 -1.131 -1.168(1.39) (1.07) (1.75) (1.68)
PPP experience (dummy) -0.091 0.059 0.558 0.533(1.25) (0.56) (0.54) (0.53)
East-Asia and Pacific dummy -0.017 -0.025 -1.457 -1.322(0.09) (0.13) (1.81) (1.25)
Europe and Central Asia dummy -0.203 -0.171 -0.113 -0.055(1.16) (1.52) (0.29) (0.12)
Sub-Saharan Africa dummy -0.096 -0.044 -0.696 -0.611(0.66) (0.31) (0.67) (0.53)
Middle East and North Africa dummy -0.413 -0.357 -3.207 -3.172(3.23)** (2.18)* (3.36)** (3.29)**
South Asia dummy -0.495 -0.539 -3.665 -3.496(1.85) (2.17)* (2.71)** (2.20)*
Time dummies
Constant -0.740 -0.806 -21.095 -20.338(2.50)* (2.68)** (19.56)** (14.12)**
Observations 475 475 475 475 R-squared 0.33 Number of id 69 Pseudo R2 0.43 0.30 Poisson Goodness of Fit Chi-Square Not Valid Not Valid 234.2 Not Valid
Robust t statistics in parentheses: * significant at 5 percent; ** significant at 1 percent.

- 35 -
Table 11. Determinants of the Extent of Private Participation
Dependent variable: Index of private sector participation OLS Ordered
ProbitOrdered Logit
General government balance (percent of GDP) -4.751 -7.131 -13.037(0.70) (0.93) (0.70)
Total debt (percent of total exports) -0.017 -0.026 -0.052(1.02) (1.34) (1.23)
Aid per capita (current US$) 0.006 0.008 0.017(1.14) (1.28) (1.20)
Fuel exports (percent of merchandise exports) -0.010 -0.017* -0.025(1.11) (1.68) (0.86)
Ethnic fractionalization (index) 1.144 1.669* 2.804(1.43) (1.86) (1.25)
Chief executive's party orientation (index) 0.082 0.106 0.163(0.51) (0.61) (0.41)
Opposition parties in legislature (number) 0.000 0.000 -0.001(0.05) (0.07) (0.17)
Population (log) 0.152 0.171 0.473(0.58) (0.59) (0.64)
Real GDP per capita (lagged) 0.000 0.000 0.000(0.85) (1.18) (0.87)
Inflation (annual percent change GDP deflator) 0.001 0.003 0.005(0.79) (1.34) (0.96)
Money supply (M2 in percent of GDP) -0.013 -0.022* -0.030(1.16) (1.76) (1.06)
International reserves (month of imports) -0.149 -0.177 -0.317(1.46) (1.57) (1.24)
Control of corruption (index) 0.549** 0.766** 1.264**(2.68) (3.44) (2.11)
Composite country risk (index) 0.118 0.201 0.332(0.86) (1.32) (1.12)
Rule of law (index) -0.451 -0.617 -0.809(0.78) (0.97) (0.63)
Common law origin (dummy) 1.239** 1.636** 2.754**(3.08) (3.86) (2.67)
Energy sector dummy 0.002 0.032 0.073(0.00) (0.06) (0.06)
Telecommunication sector dummy 1.344 1.973* 3.309(1.36) (1.83) (1.44)
Transportation sector dummy -0.225 -0.336 -0.853(0.55) (0.76) (0.75)
Water sector dummy -1.124** -1.574** -3.021**(2.56) (2.98) (2.14)
East-Asia and Pacific dummy -0.452 -0.292 -0.993(0.60) (0.35) (0.51)
Europe and central Asia dummy 0.411 0.471 0.863(0.90) (0.88) (0.72)
Sub-Saharan Africa dummy -2.010** -2.692** -4.863**(3.48) (4.04) (2.99)
Middle east and North Africa dummy 0.937 1.549 1.800(0.93) (1.46) (0.69)
South Asia dummy -0.854 -0.963 -2.091(0.90) (0.91) (0.74)
Constant 5.414**(2.91)
Observations 68 68 68 R-squared 0.72 Pseudo R2 0.36 0.36Robust t statistics in parentheses: * significant at 5 percent; ** significant at 1 percent.
- 36 -
References Alesina, Alberto, Arnaud Devleeschauwer, William Easterly, Sergio Kurlat, and Romain
Wacziarg, 2003, “Fractionalization,” Journal of Economic Growth, Vol. 8, pp. 155−94.
Alesina, Alberto, Reza Baqir, and William Easterly, 1999, “Public Goods and Ethnic
Divisions,” Quarterly Journal of Economics, Vol. 114, No. 4 (November), pp. 1243−84.
Allen, Grahame, 2003, “The Private Finance Initiative (PFI),” Research Paper 03/79
(London: House of Commons Library). Beck, Thorsten, George Clarke, Alberto Groff, Philip Keefer, and Patrick Walsh, 2000,
“New Tools and New Tests in Comparative Political Economy: The Database of Political Institutions,” Policy Research Working Paper, No. 2283 (Washington: World Bank).
Besley, Timothy, and Maitreesh Ghatak, 2001, “Government Versus Private Ownership of
Public Goods,” Quarterly Journal of Economics, Vol. 116, No. 4 (November), pp. 1343−72.
Dailami, Mansoor, and Michael Klein, 1997, “Government Support to Private Infrastructure
Projects in Emerging Markets,” Policy Research Working Paper, No. 1688 (Washington: World Bank).
Economic Commission for Africa, 2005, “Assessing Regional Integration in Africa,” ECA
Policy Research Paper (New York: United Nations). Ehrhardt, David, and Timothy Irwin, 2004, “Avoiding Customer and Taxpayer Bailouts in
Private Infrastructure Projects Policy toward Leverage, Risk Allocation, and Bankruptcy,” Policy Research Working Paper, No. 3274 (Washington: World Bank).
Estache, Antonio, Biagio Speciale, and David Veredas, 2005, “How Much Does
Infrastructure Matter to Growth in Sub-Saharan Africa?” (Washington: World Bank). Francesconi, Marco, and Abhinay Muthoo, 2004, “An Incomplete Contracting Model of
Ownership of Impure Public Goods” (unpublished; Essex, England: University of Essex).
Glasser, Brad, 2001, Economic Development and Political Reform: The Impact of External
Capital on the Middle East (Cheltenham: Edward Elgar Publishing).
- 37 -
Kaufmann, Daniel, Aart Kraay, and Massimo Mastruzzi, 2003, “Governance Matters III: Governance Indicators for 1996−2002,” Policy Research Working Paper, No. 3106 (Washington: World Bank).
Kopp, John Christopher, 1997, “Private Capital for Public Works: Designing the Next-
Generation Franchise for Public-Private Partnerships in Transportation Infrastructure” (Master's Thesis; Boston: Department of Civil Engineering, Northwestern University), May.
LaPorta, Rafael, Florencio Lopez-de-Silanes, Andrei Shleifer, and Robert Vishny, 1997,
“Legal Determinants of External Finance,” Journal of Finance, Vol. 52, pp. 1131−50. ______, 1998, “Law and Finance,” Journal of Political Economy, Vol. 106, pp. 1113−55. Leibenstein, Harlay, 1966, “Allocative Efficiency vs. ‘X-Efficiency’,” American Economic
Review, Vol. 56, No. 3 (June), pp. 392−415. Pistor, Katharina, Martin Raiser, and Stanislaw Gelfer, 2000, “Law and Finance in Transition
Economies,” Economics of Transition, Vol. 8, No. 2, pp. 325−68. Sachs, Jeffrey D., John W. McArthur, Guido Schmidt-Traub, Margaret Kruk, Chandrika.
Bahadur, Michael Faye, and Gordon McCord, 2004, “Ending Africa’s Poverty Trap,” Brookings Papers on Economic Activity, pp. 117−240.
Thomsen, Stephen, 2005, “Encouraging PPP in the Utilities Sector: The Role of
Development Assistance,” NEPAD/OECD Investment Initiative, Investment for African Development: Making it Happen, Background Information in Support of Session 5 Roundtable.
Von Hirschhausen, Christian, 1999, “What Infrastructure Policies for Post-Socialist Eastern
Europe? Lessons from the Public Investment Programmes in the Baltic Countries,” Europe-Asia Studies, Vol. 51, No. 3, pp. 417−32.
Vuong, Quang, 1989, “Likelihood Ratio Tests for Model Selection and Non-Nested
Hypotheses,” Econometrica, Vol. 57, pp. 307−33. Williams, Carl, 1992, “Public-Private Partnerships in Transportation: Lessons Learned by a
Public-Sector Entrepreneur,” Public Works Financing (March), pp. 22−25. World Bank, 2002, “Building Institutions for Markets,” World Development Report 2002
(Washington: World Bank), Chapter 8 on Regulation of Infrastructure, pp. 151−67.


