

Final Report on the
DETERMINATION OF ENTRANCE LOSS COEFFICIENTS FOR
PRE-CAST REINFORCED CONCRETE BOX CULVERTS
Sponsored by the Iowa Department of Transportation
and
The Federal Highway Administration

Disclaimer Notice
The contents of this report reflect the views of the authors, who are responsible for the facts and the
accuracy of the information presented herein. The opinions, findings, and conclusions expressed in this
publication are those of the authors and not necessarily of the sponsors.
The sponsors assume no liability for the contents or use of the information contained in this document.
This report does not constitute a standard, specification, or regulation. The sponsors do not endorse
products or manufacturers. Trademarks or manufacturer’s names appear in this report only because they
are considered essential to the objectives of the document.
Statement of Non-Discrimination
Federal and state laws prohibit employment and/or public accommodation discrimination on the basis
of age, color, creed, disability, gender identity, national origin, pregnancy, race, religion, sex, sexual
orientation or veteran’s status. If you believe you have been discriminated against, please contact the
Iowa Civil Rights Commission at 800-457-4416 or Iowa Department of Transportation's affirmative
action officer. If you need accommodations because of a disability to access the Iowa Department of
Transportation’s services, contact the agency's affirmative action officer at 800-262-0003.
Non-Discrimination Statement
The University of Iowa prohibits discrimination in employment, educational programs, and activities on
the basis of race, national origin, color, creed, religion, sex, age, disability, veteran status, sexual
orientation, gender identity, or associational preference. The University also affirms its commitment to
providing equal opportunities and equal access to University facilities. For additional information
contact the Office of Equal Opportunity and Diversity, (319) 335-0705.
1. Report No.
SPR 90-00-CULV-011
2. Government Accession No.
3. Recipient Catalog No.
4 Title and Subtitle
Determination of entrance loss coefficients for pre-cast reinforced Concrete Box
Culverts
5 Report Date
December 2012
6 Performing Organization Code
7. Author(s)
Marian Musete, Hao-Che Ho
8 Performing Organization Report No.
9 Performing Organization Name and Address
University of Iowa
2 Gilmore Hall
Iowa City, IA 52242-1320
10 Work Unit No. (TRAIS)
11 Contract or Grant No.
RT-1021
12 Sponsoring Organization Name and Address
Iowa Department of Transportation
800 Lincoln Way
Ames, IA 50010
Federal Highway Administration
13 Type of Report and Period Covered
14 Sponsoring Agency Code
90-00-CULV-011
15 Supplementary Notes
16 Abstract
There is an increased interest in constructing Pre-Cast (PC) Twin and Triple Reinforced Concrete Box (RCB) culverts
in Iowa due to the efficiency associated with their production in controlled environment and decrease of the construction
time at the culvert sites. The design of the multi-barrel PC culverts is, however, based on guidelines for single-barrel cast-in-
place (CIP) culverts despite that the PC and CIP culverts have different geometry. There is scarce information for multiple-
barrel RCB culverts in general and even fewer on culverts with straight wingwalls as those designed by Iowa DOT. Overall,
the transition from CIP to PC culverts requires additional information for improving the design specifications currently in
use. Motivated by the need to fill these gaps, an experimental study was undertaken by IIHR-Hydroscience & Engineering.
The goals of the study are to document flow performance curves and head losses at the culvert entrance for a various culvert
geometry, flow conditions, and settings. The tests included single-, double- and triple-barrel PC and CIP culverts with two
span-to-rise ratios set on mild and steep slopes. The tests also included optimization of the culvert geometry entrance by
considering various configurations for the top bevel.
The overall conclusion of the study is that by and large the current Iowa DOT design specifications for CIP culverts can
be used for multi-barrel PC culvert design. For unsubmerged flow conditions the difference in the hydraulic performance
curves and headloss coefficients for PC and CIP culverts are within the experimental uncertainty. Larger differences
(specified by the study) are found for submerged conditions when the flow is increasingly constricted at the entrance in the
culvert. The observed differentiation is less important for multi-barrel culverts as the influence of the wingwalls decreases
with the increase of the number of barrels.
17 Key Words
1) Culvert 2) Concrete Box Culverts 3) Cast-in-Place
Culverts (CIP)
18 Distribution Statement
No restrictions. This document is
available to the public through the
National Technical Information Service,
Springfield, Virginia 22161
19 Security Classification
(of this report)
Unclassified
20 Security Classification
(of this page)
Unclassified
21 No. of pages
60
22 Price
Form DOT F 1700.7 (8-72)

Final Report
SPR 90-00-CULV-011
Determination of Entrance Loss Coefficients for Pre-Cast Reinforced
Concrete Box Culverts
December 27, 2012
Marian Muste (PI)
Research Engineer
Hao-Che Ho
Postdoctoral Scholar
IIHR-Hydroscience & Engineering
University of Iowa College of Engineering
100 C. Maxwell Stanley Hydraulics Laboratory
Iowa City, IA 52242-1585
Tel: 319-335-5237
Fax: 319-335-5238
Email: [email protected]
Sponsored by the Iowa Department of Transportation
and
The Federal Highway Administration

THE UNIVERSITY OF IOWA
ii
Abstract
There is an increased interest in constructing Pre-Cast (PC) Twin and Triple Reinforced
Concrete Box (RCB) culverts in Iowa due to the efficiency associated with their production in
controlled environment and decrease of the construction time at the culvert sites. The design of
the multi-barrel PC culverts is, however, based on guidelines for single-barrel cast-in-place (CIP)
culverts despite that the PC and CIP culverts have different geometry. There is scarce
information for multiple-barrel RCB culverts in general and even fewer on culverts with straight
wingwalls as those designed by Iowa DOT. Overall, the transition from CIP to PC culverts
requires additional information for improving the design specifications currently in use.
Motivated by the need to fill these gaps, an experimental study was undertaken by IIHR-
Hydroscience & Engineering. The goals of the study are to document flow performance curves
and head losses at the culvert entrance for a various culvert geometry, flow conditions, and
settings. The tests included single-, double- and triple-barrel PC and CIP culverts with two span-
to-rise ratios set on mild and steep slopes. The tests also included optimization of the culvert
geometry entrance by considering various configurations for the top bevel.
The overall conclusion of the study is that by and large the current Iowa DOT design
specifications for CIP culverts can be used for multi-barrel PC culvert design. For unsubmerged
flow conditions the difference in the hydraulic performance curves and headloss coefficients for
PC and CIP culverts are within the experimental uncertainty. Larger differences (specified by the
study) are found for submerged conditions when the flow is increasingly constricted at the
entrance in the culvert. The observed differentiation is less important for multi-barrel culverts as
the influence of the wingwalls decreases with the increase of the number of barrels.

THE UNIVERSITY OF IOWA
iii
TABLE OF CONTENTS
Abstract ii
1.Introduction 1
1.1 Background 1
1.2 Problem statement 2
2.Theoretical background and literature review 4
3.Experimental Procedures and setup 17
3.1 Specifications on measurements and culvert model coding 17
3.2 Experimental Facility 21
3.3 Scaling considerations and model validation 27
3.4 Instrumentation 30
3.4.1 Water Flow Rate 31
3.4.2 Manometer and Pressure Sensors 31
3.4.3 Velocities 33
4.Experimental results 35
4.1 Effect of number of barrels 35
4.1.1 PC culverts 36
4.1.2 CIP culverts 39
4.2. The effect of wingwall flare angle 43
4.3 Effect of culvert barrel slope 45
4.4 Effect of span-to-rise ratio 46
4.5 Effect of the top edge geometry 48
4.6. Shear stress at culvert outlet 51
5.Conclusion and Recommendations 55
References 59

THE UNIVERSITY OF IOWA
iv
LIST OF FIGURES
Fig 2-1 Classification of culvert flow ............................................................................................. 5
Fig 2-2 Types of inlet control, (Normann et al. 1985) .................................................................... 8
Fig 2-3 Culvert entrance acts like weir ........................................................................................... 8
Fig 2-4 Culvert entrance acting as a submerged sluice gate, Charbeneau (2006) ........................ 12
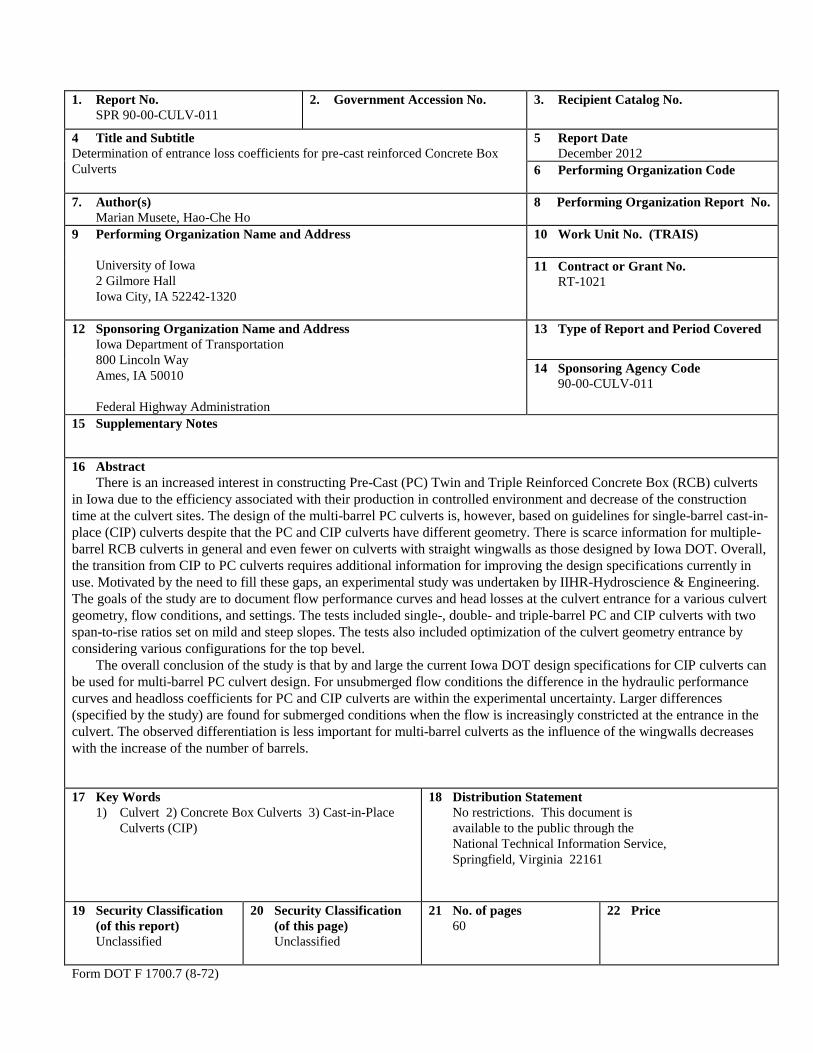
Fig2-5 Types of outlet control, Normann (1985).......................................................................... 15
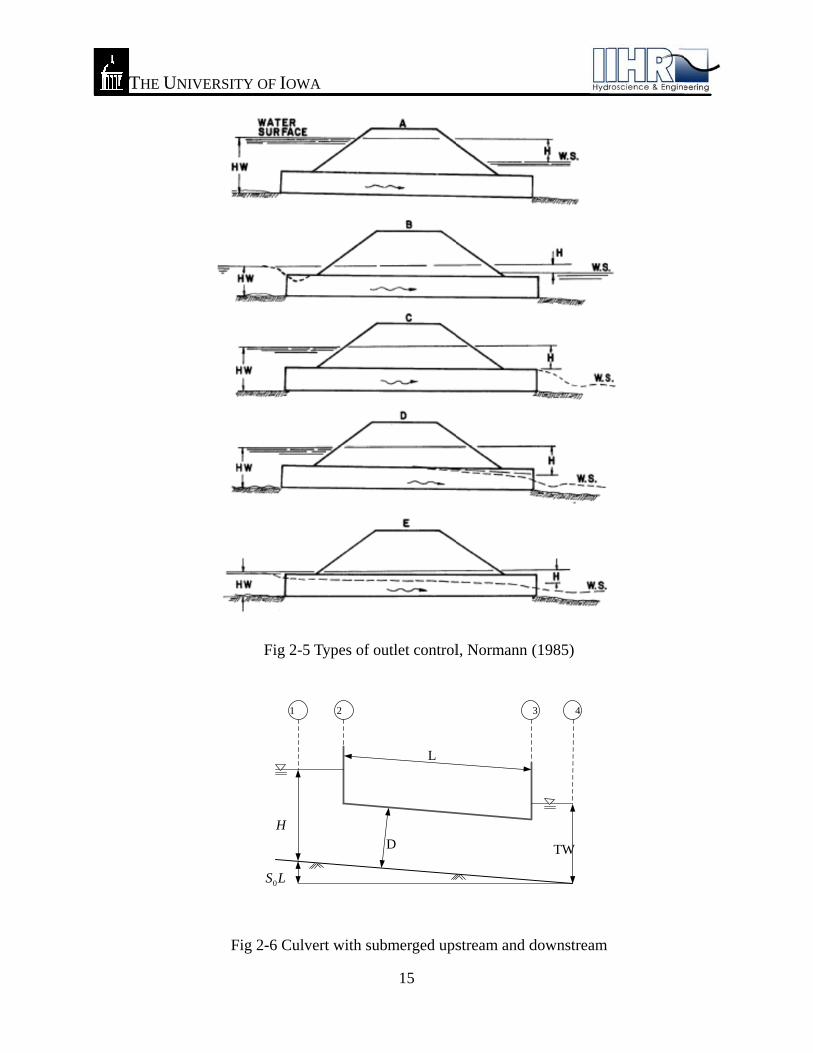
Fig 2-6 Culvert with submerged upstream and downstream ........................................................ 15
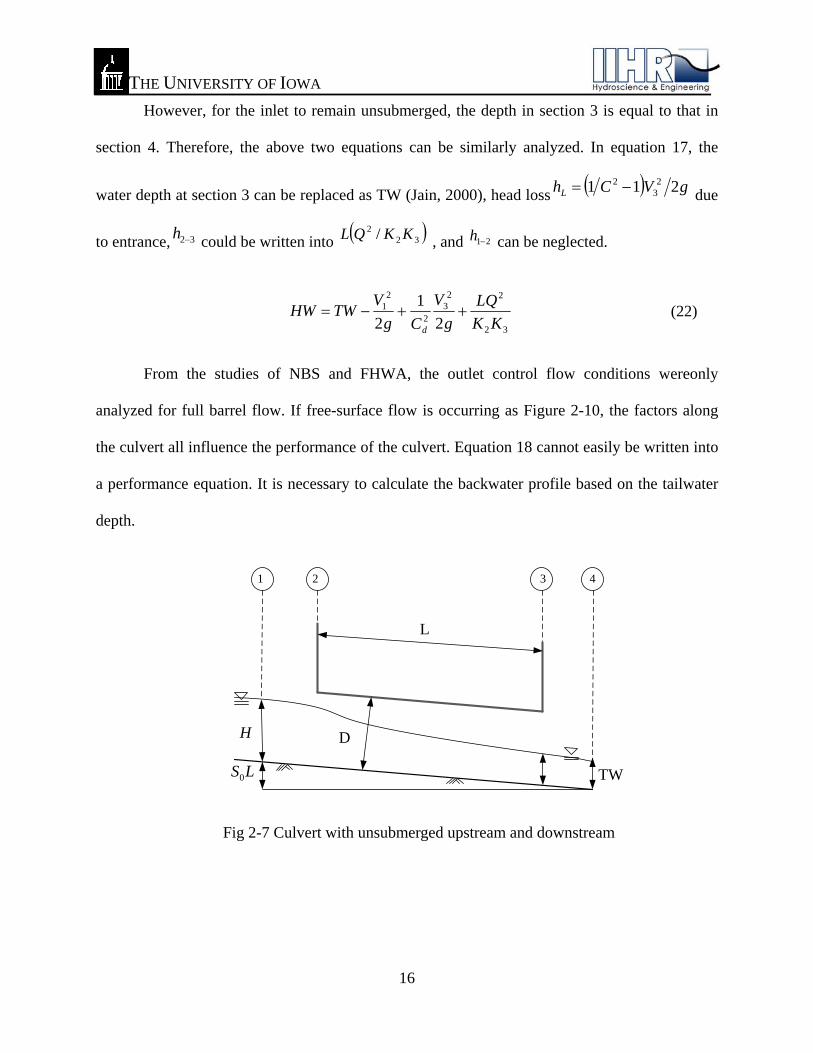
Fig 2-7 Culvert with unsubmerged upstream and downstream .................................................... 16
Fig 3-1. Model layout; a) general view; b) cast inplace culvert model; c) the pre-cast culvert model............................................................................................................................................. 25
Fig 3-2. The pre-cast culvert model under construction: a) culvert entrance; b) culvert outlet; and c) culvert barrel; d) close view of a detachable culvert inlet ........................................................ 26
Fig 3-3 The culvert model with and without embankment protection .......................................... 28
Fig 3-4 Inlet-control performance curves of PC-S12-R12 w and w/o embankments ................... 28
Fig 3-5 Velocity profiles in three barrel with the discharge = 2.447 ft3/s .................................... 29
Fig 3-6 Performance curves of three different culverts compared to FHWA formula ................. 30
Fig 3-7 Intruments for water surface measurement: a) pressure sensor system, b) in-house Labview software, and c) manometer ........................................................................................... 32
Fig 3-8 Measurement Specialties LM Series 0-1 psi pressure sensor .......................................... 33
Fig 3-10 Typical sensor calibration curves .................................................................................. 33
Fig 3-11 The Pitot tube and manometer used for measuring velocity in the flume ..................... 34
Fig 4-1 Inlet-control performance curves of PC-R12-S12 with barrel slope =0.005 ................... 37
Fig 4-2 Inlet-control performance curves of PC-S12-R6 with barrel slope =0.005 ..................... 37
Fig 4-3 Inlet-control performance curves of PC-S12-R12 with barrel slope =0.02 ..................... 38
Fig 4-4 Inlet-control performance curves of PC-S12-R6 with barrel slope =0.02 ....................... 38
Fig 4-5 Inlet-control performance curves of CIP-S12-R12 with barrel slope =0.005 .................. 40
Fig 4-6 Inlet-control performance curves of CIP-S12-R12 with barrel slope =0.02 .................... 40
Fig 4-7 Inlet-control performance curves of CIP-S12-R6 with barrel slope =0.005 .................... 41
Fig 4-8 Inlet-control performance curves of CIP-S12-R6 with barrel slope =0.02 ...................... 41
Fig 4-9 Inlet-control performance curves of all one-box models with slope =0.02 .................... 44

THE UNIVERSITY OF IOWA
v
Fig 4-10 Inlet-control performance curves of all twin-box models with slope =0.02 ................. 44
Fig 4-11 Inlet-control performance curves of PC1-S12-R12 with two barrel slopes ................. 46
Fig 4-12 Inlet-control performance curves of PC1-S12-R12, PC1-S12-R6 with slope =0.02 ..... 47
Fig 4-13 Inlet-control performance curves of CIP1-S12-R12, CIP1-S12-R6 with slope =0.02 .. 47
Fig 4-14 a) top edge condition (FHWA 2006), b) tested 4-in bevel top edge, and c) tested 8-in radius top edge .............................................................................................................................. 49
Fig 4-15 Inlet-control performance curves of PC-S12-R6-op with barrel slope =0.02 ................ 50
Fig 4-16 Inlet-control performance curves of PC-S12-R12-op with barrel slope =0.02 .............. 50
Fig 4-17 Performance curves of PC-S12-R12-op compared to PC-S12-R12 and CIP-S12-R12 . 51
Fig 4-18 Vertical velocity profiles at the left barrel outlet for PC3-S12-R12-M for stream discharges of 3.14 and 4.51 ft3/s ………………………………………………………………...51
Fig 4-19 Vertical velocity profiles at the left barrel outlet for PC3-S12-R12-S for stream discharges of 2.16 and 4.45 ft3/s ………………………………………………………………...53
Fig 4-20 Vertical velocity profiles at the left barrel outlet for CIP3-S12-R12-M for stream discharges of 2.24 and 4.55ft3/s ……………………………………………………………........54

THE UNIVERSITY OF IOWA
vi
LIST OF TABLES
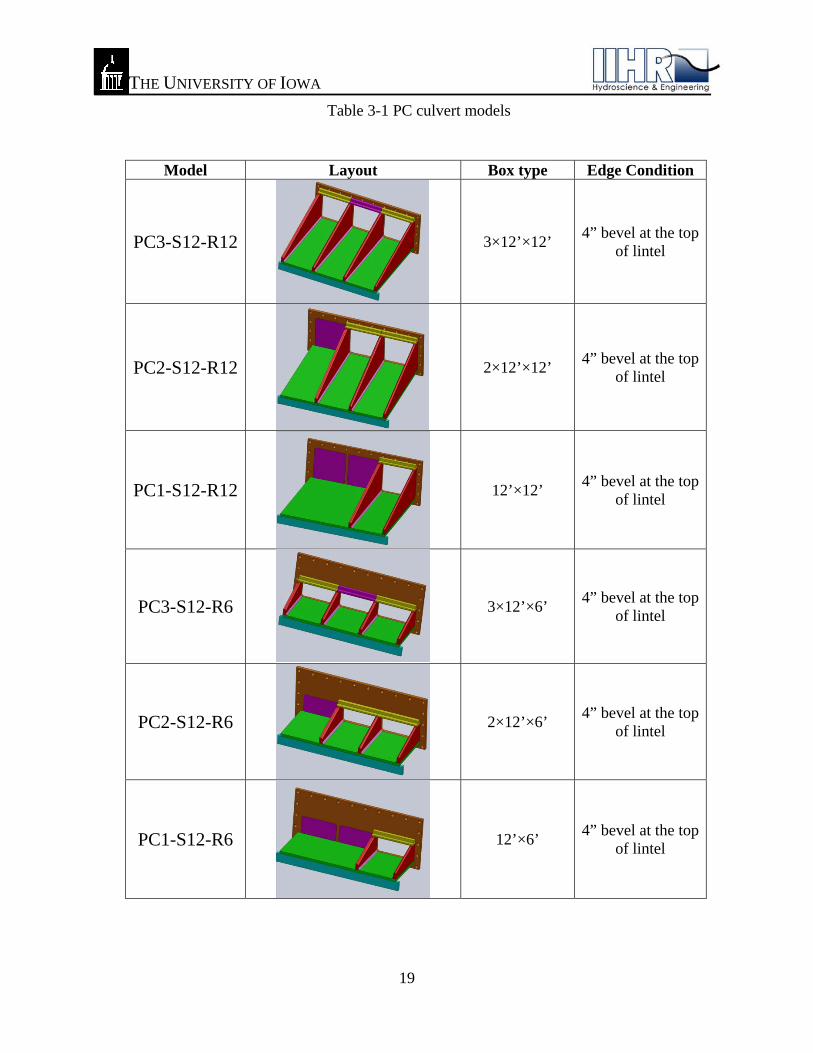
Table 3-1 PC culvert models ......................................................................................................... 19
Table 3-2 PC culvert models ......................................................................................................... 20
Table 3-3 Model similitude criteria for PC and CIP culvert models ............................................ 27
Table 4-1 Regression coefficients for PC culverts ....................................................................... 39
Table 4-2 Regression coefficients for CIP culverts ...................................................................... 42
Table 4-3 Estimation of shear stress for various culvert models .................................................. 54

THE UNIVERSITY OF IOWA
1
1. Introduction
1.1 Background
Culverts are common hydraulic structures that pass streams under roadways in a variety
of flow conditions without producing considerable scour that threatens the stability of the
structure or sedimentation in the vicinity of the culvert. Culverts are ubiquitous for secondary
roads crossing small streams in the state of Iowa as well as in many rural U.S. Midwestern areas.
Currently the Iowa DOT uses Cast-in-Place (CIP) and Pre-cast (PC) reinforced concrete boxes
(RCBs) fit with wingwalls at the entrance and exit sections of the culvert barrels to transition the
streams under the roadway systems. The CIP culvert design guidelines are based on research
conducted 30 years ago and are limited to single box culverts. The Iowa standard design manual
typically recommends 30-degree flared wingwalls for CIP boxes and straight wingwalls for the
PC boxes. For the latter a 4-in bevel on the inside edges of the wingwalls and top slab is
recommended.
There is an increased interest to construct Pre-Cast (PC) Twin and Triple RCB’s in Iowa
due to the efficiency associated with their production in controlled environment and decrease of
the construction time at the culvert site. The design of the PC culvert is, however, based on
guidelines for single barrel box culverts constructed with CIP approaches. The most of widely
recognized manual on culvert hydraulics is the FHWA Hydraulic design Series No. 5 (HD-5)
(FHWA, 1985) and based on research conducted in the 1960s and 1970s (FHWA, 2006). Less
information is available from studies conducted on multiple barrel box culverts and even fewer

THE UNIVERSITY OF IOWA
2
on RCBs with straight wingwalls (e.g., FHWA, 2006). The transition from CIP to PC boxes
requires additional information for substantiating the design specifications currently used.
1.2 Problem statement
Currently, the sizing of multi-barrel box culverts is based on the performance curves of
single boxes multiplied by the number of barrels to attain an appropriate conveyance for the
extreme flows. Wingwalls attached to single-barrel boxes are typically attached at the entrance
and exit of the culverts to conduct the flow directly into the barrel reducing accordingly the
contraction losses. Multiple barrel culverts share a single set of wingwalls hence the interior
barrels produce lower hydraulic losses, Cast-in-place (CIP) culverts are typically provided with
flared wingwalls set at various degrees with respect to the culvert axis. Construction
considerations favor PC culverts with straight wingwalls. The change in orientation for the PC
culverts from the typical oblique to straight wingwalls produces change of inlet geometry with
further implications in the flow transport capacity. Finally, additional gains in the flow capacity
can be obtained by “streamlining” the culvert top edges at the inlet. Estimating the entrance
losses taking into account all the above factors is critical for providing appropriate design,
especially for the newly built PC culverts. Similar studies with the one presented here are the
FHWA(2004) and FHWA (2006). They investigated in partnership with the South Dakota DOT
rectangular shaped culverts with a number of inlet geometry conditions representing inlets that
are currently available for highway culverts in that state.
Our study focuses on single and multi-barrel PC and CIP culverts in various conditions
and configurations using Iowa specific design specifications. The following culvert designs were
provided by IDOT for the present study:

THE UNIVERSITY OF IOWA
3
Cast-In-Place (CIP): RCB-GI-87, TWRCB-GI-87, and TRRCB-GI-01
(http://www.iowadot.gov/bridge/v8eculstd.htm)
Pre-Cast (PC): 1080 (http://www.iowadot.gov/bridge/v8preculstd.htm)
In order to fill the gaps in the information for supporting the current design guidelines,
our study set the following objectives:
Determine the effect of inlet geometry on flow capacity for single and multi-barrel CIP and PC
culverts
Determine the effect to span-to-rise ratio, wingwall-flare angle, and slope on flow capacity for
various culvert geometry
Determine the effect of culvert top edge treatment for the inlet geometry for optimizing the
design of both types of box culverts
The study analyzed the above objectives for both unsubmerged and submerged
conditions corresponding to inlet and outlet control, respectively. Given that the available
guidelines and experimental studies of the entrance losses for culverts are limited to single barrel
culverts, we conduct a series of physical modeling experiments to determine the entrance losses
for PC Twin and Triple RCB’s designs. In addition to determining the inlet losses, we compare
the velocities and shear stresses associated with a straight vs. flared wing wall for a range of flow
conditions. This could determine if a certain configuration provides better dissipation of the
energy to mitigate potential erosion/scour at the inlet or outlet of a box culvert.

THE UNIVERSITY OF IOWA
4
2. Theoretical background and literature review
The chapter reviews the fundamental theoretical consideration for the analysis of data
obtained through this study and the related information available in the literature for setting a
basis for the study. Given that the theoretical background is quite well established and
extensively treated in references, only salient features will be reproduced herein.
Culvert design fundamentally involves the optimal selection of the barrel cross-section
that passes the design discharge, and material that depends on the structural strength, hydraulic
roughness, durability, and corrosion/abrasion resistance. The hydrology and hydraulic analyses
are both required for a design. The hydrologic analysis of the culvert is needed to estimate the
design discharge; on the other hand, the hydraulic analysis is required for the optimal design in
conveying the design discahrge. A complete theoretical analysis of the hydraulics of a particular
culvert is arduous, because of the fact that the flow regime varies from culvert to culvert and
even varies over time for a given culvert.
Bodhaine (1982) classified culvert flow into six types during the peak flow, illustrated in
the Figure 2-4, on the basis of the location of the control section and the relative height of the
headwater and tailwater elevations. Three of these flow types (1, 2, and 3) are for low-head flow
when the ratio of headwater depth and the opening of culvert is less than 1.5. Two are for high-
head flow (5, and 6) when the ratio is larger than or equal to 1.5. The last one is for submerged
flow condition.

THE
N
Highway
analysis
culvert d
control a
research,
former is
types of
concept t
Highway
control h
control h
E UNIVERS
National Bur
y Administra
of culvert hy
design graph
and then de
, the flow co
s pressure fl
flow control
to classify is
y Culverts (N
have supercri
have subcriti
SITY OF IOW
F
reau Standar
ation (FHW
ydraulics un
hs, called no
esign for the
onditions inc
ow and the
l from the pr
s the locatio
Norman, 198
itical flow in
ical flow in b
WA
Fig 2-1 Class
rds (NBS) c
WA), in early
nder various
omographs.
e control wh
clude the cro
other is free
receding res
on of the con
85) and is w
n barrels and
barrels and
5
sification of
omplete a s
y 1950’s. T
flow condit
It is to anal
hich produc
oss-section o
e surface flo
ult of NBS a
ntrol section
widely used i
d the control
the control s
f culvert flow
series of res
These reports
tions. These
lyze a culve
ces the mini
of a culvert f
ow. Normann
and FHWA:
n. It is prese
in the culver
section is ne
section is at
w
search, spon
s provided
results were
ert for vario
imum perfo
flowing fully
n (1985) cla
: inlet and ou
ented in Hyd
rt design. Cu
ear inlet. Cu
t the downst
sored by Fe
a comprehe
e used to dev
ous types of
ormance. In
y and partly
assified two
utlet control
draulic Desi
ulverts with
ulverts with o
tream of culv
ederal
ensive
velop
f flow
their
y. The
basic
l. The
gn of
h inlet
outlet
verts.

THE UNIVERSITY OF IOWA
6
Culverts, with inlet and outlet submerged conditions, perform as a conduit. However, the
hydrodynamic of culvert is regarded as open channel if culverts have either inlet or outlet
unsubmerged condition. Culvert may operate under either inlet or outlet control with a given
flow rate, so the potential operating condition is not easily determined. Instead, the concept of
the culvert minimum performance is used to design a culvert under the peak discharge.
Figure 2-2 illustrates four different examples of inlet control that depends upon the
submergence of inlet and outlet ends of the culvert. In Figure 2-2a, neither the inlet nor the outlet
of the culvert is submerged. The control section just downstream of the entrance and the flow in
the barrel is supercritical. Partly full flow occurs through the barrel, and approaches normal
depth at the outlet. Figure 2-2b shows that the outlet is submerged and inlet is unsubmerged. In
this case, the flow just downstream of the inlet is supercritical and a hydraulic jump occurs in the
barrel. Figure 2-2c is a typical design situation. The inlet is submerged and the outlet flows
freely. The flow in the barrel is supercritical and partly full over its length. Critical depth is
located just downstream of the culvert entrance, and the flow is approaching normal depth at the
downstream end. Figure 2-2d shows an unusual condition illustrating the fact that even
submergence of both the inlet and the outlet ends of the culvert does not have full flow through
the barrel. In this case, a hydraulic jump may form in the barrel; the median inlet provides
ventilation of the culvert barrel.
A culvert under inlet control performs as weir when the inlet is unsubmerged, and as
orifice when it is submerged. If the entrance is unsubmerged, the inlet control section is near the
entrance of the culvert. Application of the energy equation neglecting head loss at control section
of Figure 2-3 shows:

THE UNIVERSITY OF IOWA
7
HWEg
Vy c
cc
2
2
(1)
where cy is critical depth near the entrance of culvert, cV is critical velocity, cE is critical specific
energy, and HW is headwater.
For critical flow in the rectangular box culvert cc Ey 32 , Charbeneau (2006) derived
from equation (1) and assumed )( cbc ByCQV , where Q= barrel discharge, bC = coefficient
expressing effective width contraction associated with the culvert entrance edge conditions, and
B = width (span) of culvert. Therefore, equation (1) can be written as:
32
32
1
2
3
gDA
Q
CD
HW
b
(2)

THE
E UNIVERSSITY OF IOW
Fig 2-2 T
F
WA
Types of inle
ig 2-3 Culve
HW
8
et control, (N
ert entrance
cy
Normann et a
acts like we
al. 1985)
ir

THE UNIVERSITY OF IOWA
9
In equation (2), D=culvert rise (height); and A=full culvert cross section area (A=BD for
a box culvert).
If head loss is considered and the distance between entrance and control section is
substantial, energy equation at control section shows:
SLhEHW Lc' (3)
In equation (3), Lh is head loss, 'L is distance between entrance and control section, and
S is channel slope. For rectangular box culvert, the above equation could be written as:
SD
L
D
h
gDA
Q
CD
HW L
b
'32
32
1
2
3
(4)
Based on studies of NBS, FHWA developed two equations for unsubmerged inlet control
performance which have the similar form of equation (2):
SgDA
QKg
D
E
D
HWM
Mc 5.02/
(5)
M
M
gDA
QKg
D
HW
2/ (6)

THE UNIVERSITY OF IOWA
10
In equation (3) and (4), S is slope of the culvert, K and M are the coefficients based on
the culvert configuration. Equation (3) could be modified for rectangular box culvert
(Charbeneau, 2002):
SgDA
QKg
gDA
Q
D
HWM
M 5.02
3 2/
3/2
(7)
According to the report of Normann (1985), the constant M is 0.667 of equation (4) for
rectangular culvert box:
32
31
gDA
QKg
D
HW (8)
When culvert inlet is submerged, the culvert performs as either an orifice or as a sluice
gate. The culvert performance acts like orifice (Norman, 1985) could be presented by:
)21(22 DHWgBDCghACQ dd
(9)
In equation (9), Cd is a discharge coefficient that must be evaluated for differentinlet conditions,
A is the culvert inlet full area, h is the head on the culvert centroid, and His the upstream
headwater. The discharge coefficient is approximately equal to Cd = 0.6 forsquare-edge entrance
conditions. The equation resulting when the culvert acts as a sluicegate is similar. For a sluice
gate the performance equation is (Henderson, 1966):
)(2 DCHWgBDCQ cc (10)

THE UNIVERSITY OF IOWA
11
In equation (10), Cc is a contraction coefficient. The above equations can be expressed as the
performance equation. Charbeneau (2006) applied energy equation with HW representing the
headwater specific energy shown in Figure 2-7:
DCg
vHW c
en 2
2
(11)
In equation (11), env =velocity within the culvert entrance; and cC =contraction coefficient
associated with flow passing the culvert entrance. Energy losses can be neglected and be
included within coefficients. With the equation (11), the discharge is calculated from:
)(2))(( DCHWgACCvDCBCQ ccbencb (12)
Equation (12) could be written as a performance equation:
ccb
CgDA
Q
CCD
HW
2
2)(2
1 (13)
For submerged inlet conditions, Norman (1985) have been fit the data from experiments
performed by National Bureau of Standards an equation:
SgDA
QcgY
D
HW5.0
2
(14)
In equation (14),Y, c are the constants based on the culvert configuration.

THE
W
the flow
outlet con
Outlet co
opening.
submerge
in calcul
inlet uns
exposed
a degree
This is a
no tailwa
condition
with a lo
(subcritic
8e is ano
The barre
E UNIVERS
Fig 2-4 Cu
When culvert
condition i
ntrol in whic
ontrol occur
Figure 2-5
ed. The barr
lations, but
submerged. F
as the flow c
that the cul
rare conditi
ater. The out
n. The culve
w tailwater.
cal flow) and
other typical
el flows part
SITY OF IOW
ulvert entran
t flows with
in the culve
ch all cases
rs when the
5a represent
rel is in pres
seldom actu
For this cas
contracts int
lvert flows f
on. It requir
tlet velocitie
ert entrance
For this con
d the flow pa
condition, w
tly full over
WA
nce acting as
h outlet contr
ert barrel is
have the con
e barrel is i
ts the classi
sure flow th
ually exists.
se, the headw
to the culver
full through
res an extrem
s are usually
is submerge
ndition, the b
asses throug
with neither t
its entire len
12
s a submerge
rol, critical d
subcritical.
ntrol section
incapable of
ic full flow
hroughout its
Figure 2-5b
water is sha
rt. Figure 2-5
hout its entir
mely high he
y high under
ed by the he
barrel flows
gh critical de
the inlet nor
ngth leading
ed sluice gat
depth do no
Figure 2-5
n at the outle
f conveying
w condition,
s length. Thi
b depicts the
allow enoug
5c shows the
re length wh
eadwater to m
r this conditi
eadwater and
partly full o
epth just ups
r the outlet e
to a subcriti
te, Charbene
otoccur near
illustrates f
et end or furt
g as much f
with both
is condition
e outlet sub
gh so that th
e entrance su
hile the exit
maintain full
ion. Figure 2
d the outlet
over at least
tream of the
end of the cu
ical flow pro
eau (2006)
the entrance
five exampl
ther downstr
flow as the
inlet and o
is often assu
bmerged wit
he inlet crow
ubmerged to
is unsubme
l barrel flow
2-5d is the ty
end flows f
part of its le
e outlet. Figu
ulvert subme
ofile in the b
e and
les of
ream.
inlet
outlet
umed
th the
wn is
o such
erged.
w with
ypical
freely
ength
ure 2-
erged.
barrel.

THE UNIVERSITY OF IOWA
13
Outlet flow condition can be described by the energy equation. Full flow, as depicted in
Figure 2-6, is a typical type of outlet control culverts. The culvert flow full can be computed
between section 1 and 4. Neglecting the velocity head in section 1, and friction loss between 1
and 2, and between 3 and 4, the energy equation shows:
exL hhhg
VTWLSH 32
24
0 2 (15)
In equation 15, H is water depth at section 1 that can be replaced as HW, TW is water
depth at section 4, Lh is loss due to entrance contraction, 32h is friction loss between 2 and 3, and
exh is loss due to sudden expansion between 3 and 4. According to Jain (2000),
gVCh dL 211 23
2 and gVgVhex 22 24
23 , where Cd is discharge coefficient. Based
on Manning discharge formula, 32h could be written into 34
02
32 RLVn . An expression of
equation 15 can be modified as a performance equation:
0
2
2
2
34
0
2
2
1S
D
L
gDA
Q
CgDA
Q
R
Lgn
D
TW
D
HW
d
(16)
In equation 16, 0R is hydraulic radius in the barrel, and n is Manning coefficient.
Comparing to inlet control equations, the HW and discharge relationship under outlet
control would be affected not only entrance geometry of the culvert, but also TW and roughness
in the barrel. Normann (1985) considered the full flow culvert and calculated the outlet control
flow condition with energy equation.

THE UNIVERSITY OF IOWA
14
lossHg
VTW
g
VHW
22
24
21
(17)
neglected the approaching velocity and exit velocity, and obtained:
lossHTWHW (18)
Where lossH is total loss and represented as:
g
V
R
LgnKH eloss 2
21
2
340
2
(19)
In equation 18, eK is a coefficient varying with inlet configuration, and V is velocity in
the barrel.
If upstream and downstream are both unsubmerged, the flow with mild channel slope can
have free-surface flow in the culvert (Figure 2-7). The control section would occur at the outlet
end or further downstream. The flow is partly full in the culvert and can be described by the
energy equation between section 1 and 3 if control section is at section 3 in the Figure 2-7.
3221
23
30
21
22 hhhg
VyLS
g
VH L
(20)
If the control section is at the further downstream, the energy equation should apply
between section 1 and 4:
3221
24
40
21
22 hhhg
VyLS
g
VH L (21)
THE
E UNIVERSSITY OF IOW
Fig 2-5
Fig 2-6 Cul
1
LS0
H
WA
5 Types of o
vert with sub
2
15
outlet control
bmerged ups
D
L
l, Normann (
stream and d
(1985)
downstream
3 4
TW
THE UNIVERSITY OF IOWA
16
However, for the inlet to remain unsubmerged, the depth in section 3 is equal to that in
section 4. Therefore, the above two equations can be similarly analyzed. In equation 17, the
water depth at section 3 can be replaced as TW (Jain, 2000), head loss gVChL 211 23
2 due
to entrance, 32h could be written into 322 / KKQL , and 21h can be neglected.
32
223
2
21
2
1
2 KK
LQ
g
V
Cg
VTWHW
d
(22)
From the studies of NBS and FHWA, the outlet control flow conditions wereonly
analyzed for full barrel flow. If free-surface flow is occurring as Figure 2-10, the factors along
the culvert all influence the performance of the culvert. Equation 18 cannot easily be written into
a performance equation. It is necessary to calculate the backwater profile based on the tailwater
depth.
Fig 2-7 Culvert with unsubmerged upstream and downstream
1 2 3 4
D
L
TW LS0
H

THE UNIVERSITY OF IOWA
17
3. Experimental Procedures and setup
3.1 Specifications on measurements and culvert model coding
The parameters used to build the performance curve equations in unsubmerged and
submerged in this study are based on HDS-5 (Normann 1985):
Unsubmerged condition:
M
M
gDA
QKg
D
HW
2/
(6)
Submerged condition:
SgDA
QcgY
D
HW5.0
2
(14)
In the above equations, HW (measured in the model with pressure sensors) is defined as the
headwater depth above inlet-control section invert. D is interior height of the culvert barrel. Q
measured with calibrated orifice is discharge through the culvert barrel. A is the full cross
sectional area of culvert barrel. S is the barrel slope (0.005 and 0.02 for this study). K, M, c, and
Y are regression constants calculated from the measure data. Performance curves shown in this
study are also assembled using regression curves applied to the experimental data.
The research team in close collaboration with the Technical Advisory Committee for the
project established the test matrix that included 9 geometric configurations and 2 slopes tested in
un-submerged and submerged conditions. The optimization study was tested on single, twin,
triple, PC culverts with consideration of the following changes to the inlet geometry: top edge
with 4” bevel and top edge with 8” radius. A total of approximately 50, tests were conducted in

THE UNIVERSITY OF IOWA
18
the test facility built for the study (see Section 3.2). The culvert models investigated in the study
were labeled using the following specifications:
culvert type: PC or CIP for pre-cast and cast-in-place, respectively
number of barrels, i.e., 1, 2 or 3
span size of barrel, i.e. S12
rise size of the barrel, i.e., R12 or R6
In accordance with the labeling above, a pre-cast three box culvert with 12-ft span and
12-ft rise should be labeled as PC3-S12-R12. The flume slope is indicated by an additional label.
For instance, the above model installed into the mild slope will be labeled as PC3-S12-R12-M. A
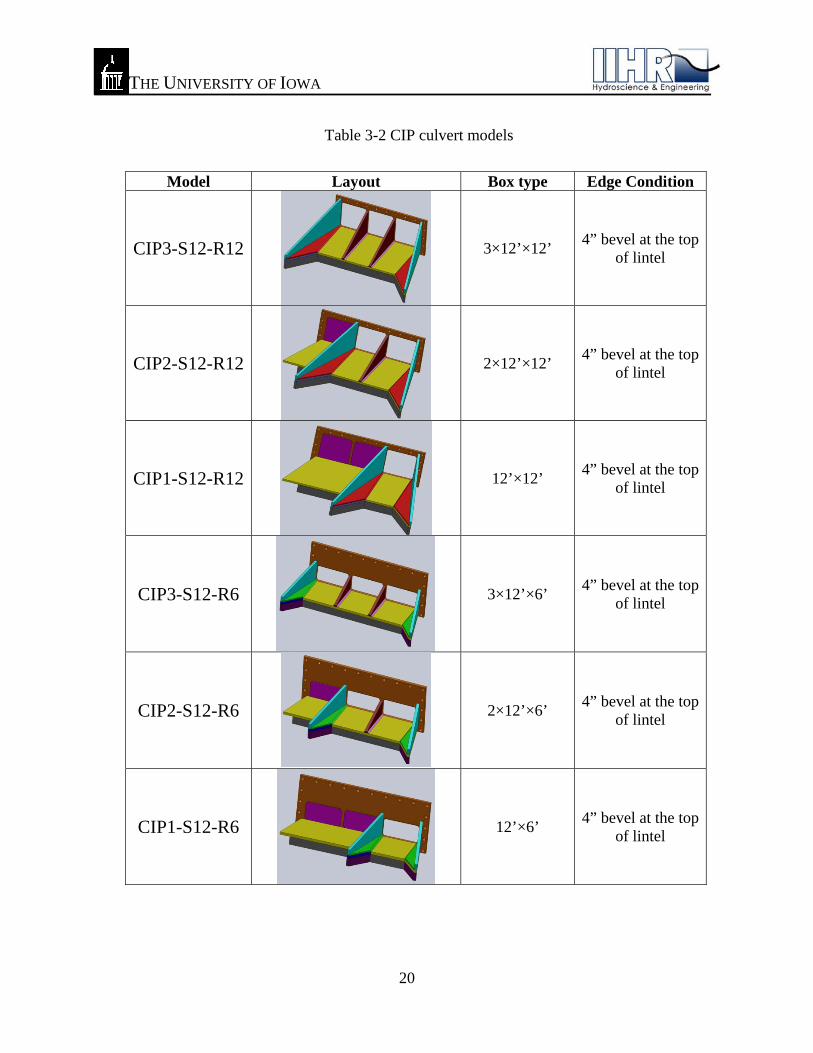
total of 12 configurations for two slopes were sequentially tested to obtain their performance
curves. The culvert model configuration and specifications studied here are summarized in
Tables 3-1 and 3-2. The outcomes of the present study are performance curves and entrance loss
coefficients for one, two, and three-box culverts of various configurations.
THE UNIVERSITY OF IOWA
19
Table 3-1 PC culvert models
Model Layout Box type Edge Condition
PC3-S12-R12 3×12’×12’ 4” bevel at the top
of lintel
PC2-S12-R12 2×12’×12’ 4” bevel at the top
of lintel
PC1-S12-R12 12’×12’ 4” bevel at the top
of lintel
PC3-S12-R6 3×12’×6’ 4” bevel at the top
of lintel
PC2-S12-R6 2×12’×6’ 4” bevel at the top
of lintel
PC1-S12-R6 12’×6’ 4” bevel at the top
of lintel
THE UNIVERSITY OF IOWA
20
Table 3-2 CIP culvert models
Model Layout Box type Edge Condition
CIP3-S12-R12 3×12’×12’ 4” bevel at the top
of lintel
CIP2-S12-R12 2×12’×12’ 4” bevel at the top
of lintel
CIP1-S12-R12 12’×12’ 4” bevel at the top
of lintel
CIP3-S12-R6 3×12’×6’ 4” bevel at the top
of lintel
CIP2-S12-R6 2×12’×6’ 4” bevel at the top
of lintel
CIP1-S12-R6 12’×6’ 4” bevel at the top
of lintel

THE UNIVERSITY OF IOWA
21
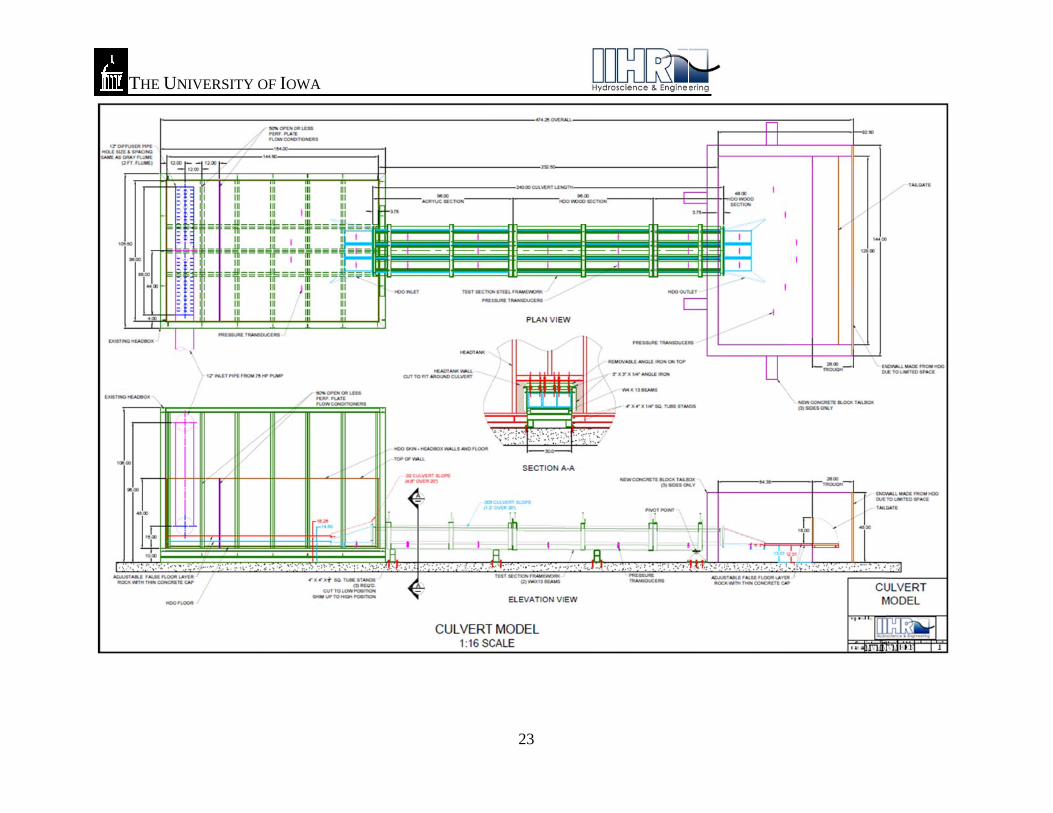
3.2 Experimental Facility
The laboratory studies were conducted in a model built at IIHR – Hydroscience &
Engineering, The University of Iowa. The model included headbox, tailbox, and tunnel barrels
(the actual body of the culvert). The culvert barrel was built using a modular concept that
enabled the change from a configuration to another with minimum changes. The culvert
structure entailed a basic fixed frame for the culvert barrel spanning the width of 3 culvert
widths. The barrel consisted of a metallic frame walled with plexiglass sheets. The dividing walls
between barrels and the ceiling were designed to allow for changing the height of the culvert and
the thickness of the wall in order to accommodate the two constructive approaches: CIP and PC.
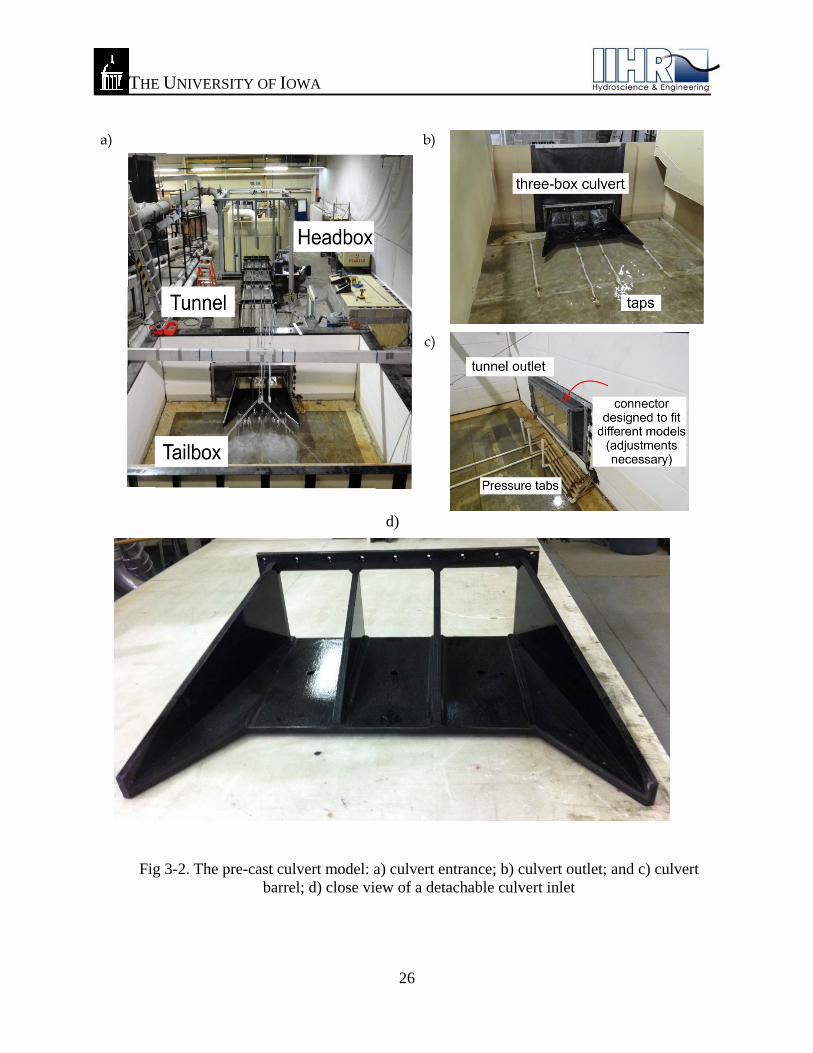
The culvert ends were separately constructed and attached sequentially to the culvert
barrel (see Fig 3-2c and Section 3.1). Different culvert geometries were sequentially placed at
the two ends of the culvert barrel in the headbox and tailbox. The slope of the culvert barrel was
adjusted by rotating the entire culvert body around a joint at the downstream end of the model at
the junction with the tailbox. The headbox is 13-ft long, 8.75-ft wide, and 8.75-ft deep (see Fig
3-2a). The tailbox consisted of a 7.7-ft long, 12-ft wide, and 4-ft deep basin located at the end of
the culvert barrel. The tailbox was fit with an adjustable tailgate for water depth control. Fig 3-2b
illustrates the model in the present configuration.
The flow rate in the facility was controlled by butterfly valves in the supply lines and
variable frequency drive (VFD) controllers on the pumps. All culvert model ends (inlet and
outlet) used for the tests were made of machine-milled plywood covered by water-resistant paint
(see Fig 3-2). As can be noted from Tables 3-1 and 3-2, the 1, 2 and 3 box-culverts were set in

THE UNIVERSITY OF IOWA
22
the same constructive mounting. In order to provide equivalent approaching flow conditions for
all tests, for each culvert type the walls of the headbox were adjusted to center the flow in the
axis of the culvert model, irrespective of the number of barrels in the model. The inserts used to
center the flow on the culvert were handled with a small crane set on the structure of the
headbox.
The flow distribution in the headbox is a critical parameter for ensuring that the modeling
results are accurate. A non-uniform approaching flow will affect the hydraulic losses at the
culvert entrance with adverse consequences on the obtained results. The flow entering the tailbox
from a perforated distribution pipe was further conditioned by several flow controllers set in the
headbox next to the diffuser to uniformly distribute the flow approaching the culvert inlet. In
order to check the quality of the flow, several pressure taps were set on the bottom of the
headbox, culvert barrel, and in the tail box. They read the water level measurement at each
location by connecting the pressure taps to a manometer panel. The flow pattern at the entrance
of the culvert model was verified by acquiring velocity profiles in dense verticals distributed
across the headbox width.
THE UNIVVERSITY OF IOOWA
23

THE UNIVVERSITY OF IOOWA
24
THE UNIVERSITY OF IOWA
25
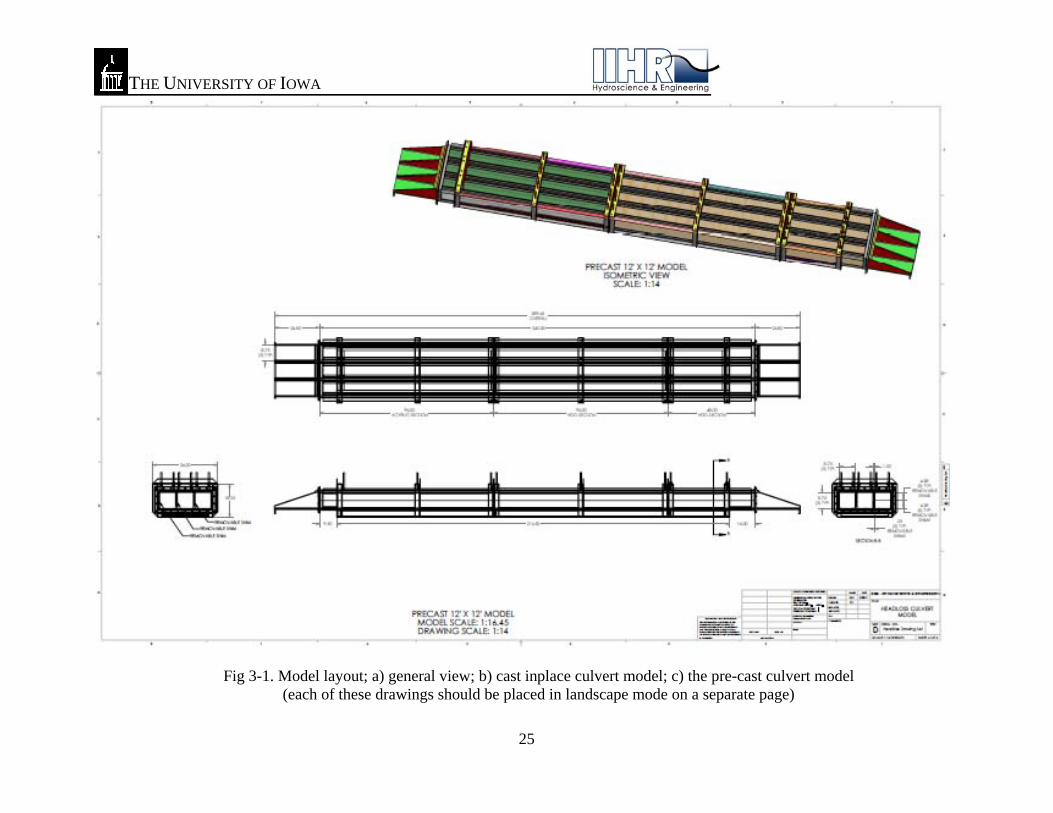
Fig 3-1. Model layout; a) general view; b) cast inplace culvert model; c) the pre-cast culvert model (each of these drawings should be placed in landscape mode on a separate page)
THE UNIVERSITY OF IOWA
26
a) b)
c)
d)
Fig 3-2. The pre-cast culvert model: a) culvert entrance; b) culvert outlet; and c) culvert barrel; d) close view of a detachable culvert inlet

THE UNIVERSITY OF IOWA
27
3.3 Scaling considerations and model validation
The scale of the culvert models were based on a Froude number similarity. The
corresponding geometrical scales are 1:16.45 for PC and 1:16 for CIP. The slight difference,
non-essential for the results of the study, was generated from constructive considerations. More
specifically, a common base was used for both types of culverts in the model as explained in the
previous section. The layout of the PC and CIP culvert models fitted in the above flume are
illustrated in Figure 3-2b. Froude scaling relationships were applied to calculate expressions
relating model and prototype values. These expressions are summarized in Table 3-3.
Table 3-3 Model similitude criteria for PC and CIP culvert models
Variable Relationship PC models CIP models
Length Lr 0.0608 0.0625
Slope Sr = Lr/Lr 1.0000 1.0000
Velocity Vr = Lr1/2 0.2466 0.2500
Time Tr = Lr1/2 0.2466 0.2500
Acceleration Ar = Vr/Tr 1.0000 1.0000
Discharge Qr = Vr*Ar =Lr5/2 0.0009 0.0010
Force F = Lr3 0.0002 0.0002
Pressure Pr = Lr 0.0608 0.0625
Reynolds number Rer = Lr3/2 0.0150 0.0156
The roadway embankment protection is a common for the culvert structure. Tests were
conducted to compare the difference between the culvert model with and without embankment
protection (Figure 3-3). The performance curves in Figure 3-4 show that embankment protection

THE UNIVERSITY OF IOWA
28
does not have essential (systematic) effect on the performance curves. When flow condition was
unsubmerged the embankment slight enhanced the culvert capacity. For submerge condition the
embankment barely affected the culvert. Given the lack of significant influence on the obtained
results, the experiments in this study are conducted without embankment installed in models.
The culvert model with embankment protection
The culvert model without embankment protection
Fig 3-3 The culvert model with and without embankment protection
Fig 3-4 Inlet-control performance curves of PC-S12-R12 w and w/o embankments
0.0
0.2
0.4
0.6
0.8
1.0
1.2
1.4
1.6
1.8
2.0
2.2
0.0 1.0 2.0 3.0 4.0 5.0 6.0
HW
/D
Q/AD0.5
PC3-S12-R12-S
PC2-S12-R12-S
PC1-S12-R12-S
PC3-S12-R12-S-n
PC2-S12-R12-S-n
PC1-S12-R12-S-n

THE UNIVERSITY OF IOWA
29
The velocity profiles were measured with Pitot tubes placed in the culvert model headbox
and tailbox as well as along the tunnel. Figure 3-5 shows the velocity distributions on the side
barrels were symmetry for the submerged flow condition. The symmetry of the velocity
distribution in the side barrels demonstrates that the conditioning of the flow in the headbox was
good leading to a uniform and symmetric flow in the culvert model.
Fig 3-5 Velocity profiles in three barrel with the discharge = 2.447 ft3/s
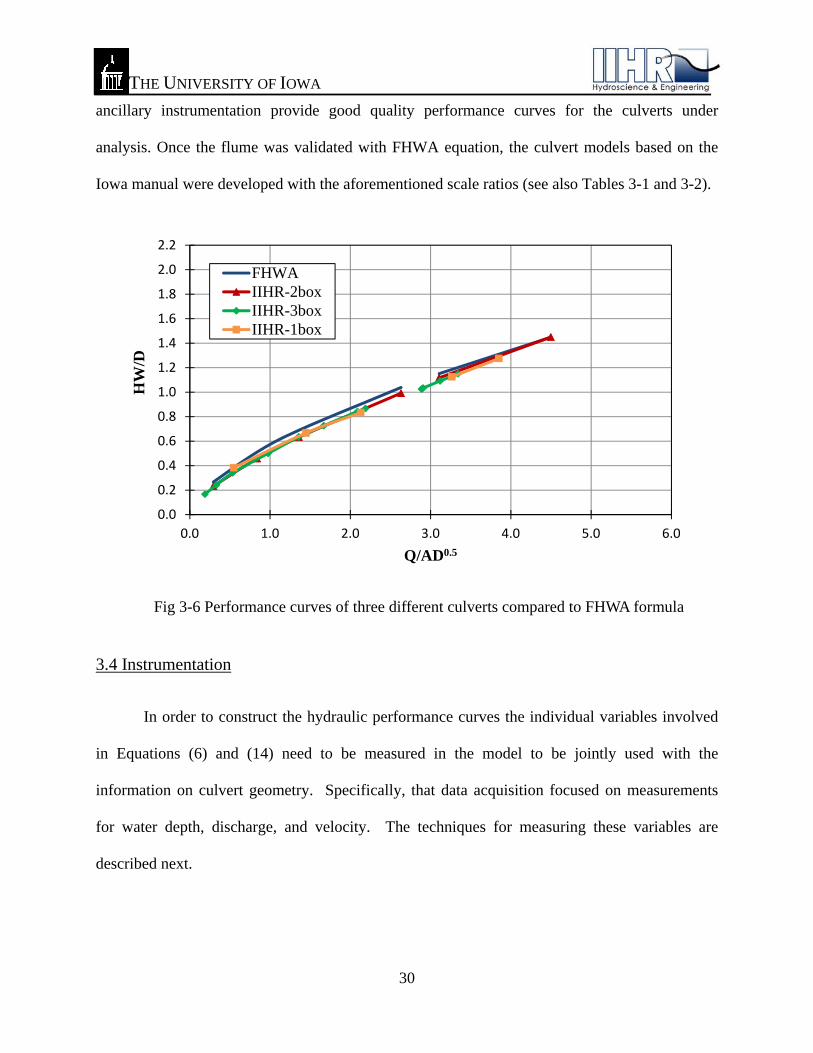
To validate the performance of our designed culvert models, three CIP models were
selected and compared to FHWA inlet control equation (Equation 6 and 14). Figure 3-6 shows
that the performance curves measured from IIHR models were close to the calculated curve. The
small differences in the performance curves are associated with experimental uncertainty. The
results obtained through these preliminary tests lead to the conclusion that the flume and
0.0
0.1
0.2
0.3
0.4
0.5
0.6
0.7
0.8
0.9
0.00 0.50 1.00 1.50 2.00 2.50 3.00 3.50 4.00 4.50
y/H
u (ft/s)
Left-barrel
Center-barrel
Right-barrel
THE UNIVERSITY OF IOWA
30
ancillary instrumentation provide good quality performance curves for the culverts under
analysis. Once the flume was validated with FHWA equation, the culvert models based on the
Iowa manual were developed with the aforementioned scale ratios (see also Tables 3-1 and 3-2).
Fig 3-6 Performance curves of three different culverts compared to FHWA formula
3.4 Instrumentation
In order to construct the hydraulic performance curves the individual variables involved
in Equations (6) and (14) need to be measured in the model to be jointly used with the
information on culvert geometry. Specifically, that data acquisition focused on measurements
for water depth, discharge, and velocity. The techniques for measuring these variables are
described next.
0.0
0.2
0.4
0.6
0.8
1.0
1.2
1.4
1.6
1.8
2.0
2.2
0.0 1.0 2.0 3.0 4.0 5.0 6.0
HW
/D
Q/AD0.5
FHWAIIHR-2boxIIHR-3boxIIHR-1box

THE UNIVERSITY OF IOWA
31
3.4.1 Water Flow Rate
The water flow in the system was supplied by two pumps connected to a 125,000 gallon
underground reservoir. The model can be separately or jointly connected to a 70 HP pump and a
60 HP pump for the necessary designed flow rates. Precise flow rate control is provided by
butterfly valves in the supply lines and variable frequency drive (VFD) controllers on the pumps.
Flows were measured with weigh-tank calibrated orifice and elbow style flow meters accurate to
+/-2% of the total flow.
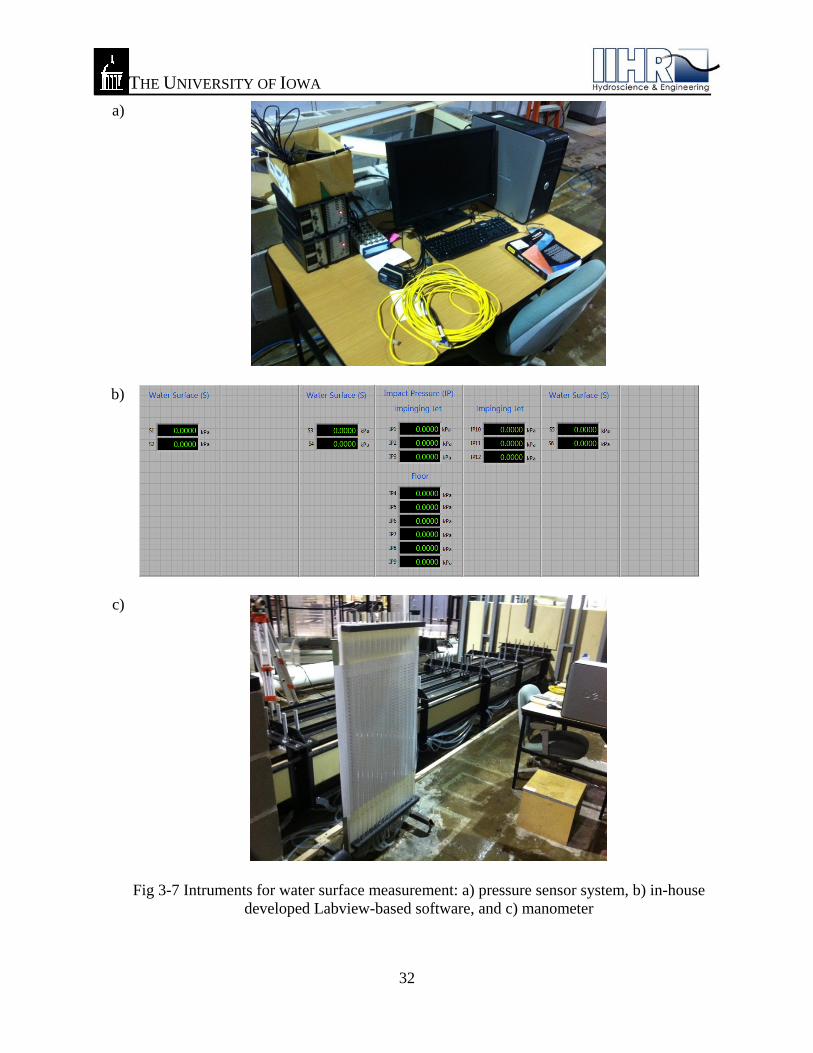
3.4.2 Manometers and Pressure Sensors
Water surface levels in the vicinity of the culvert model and hydraulic grade line (HGL)
along culvert channel were measured directly either with manometer or with pressure sensor (see
Figure 3-7). The manometer equipped with a vernier scale accurate to +/- 0.0005 ft. Water
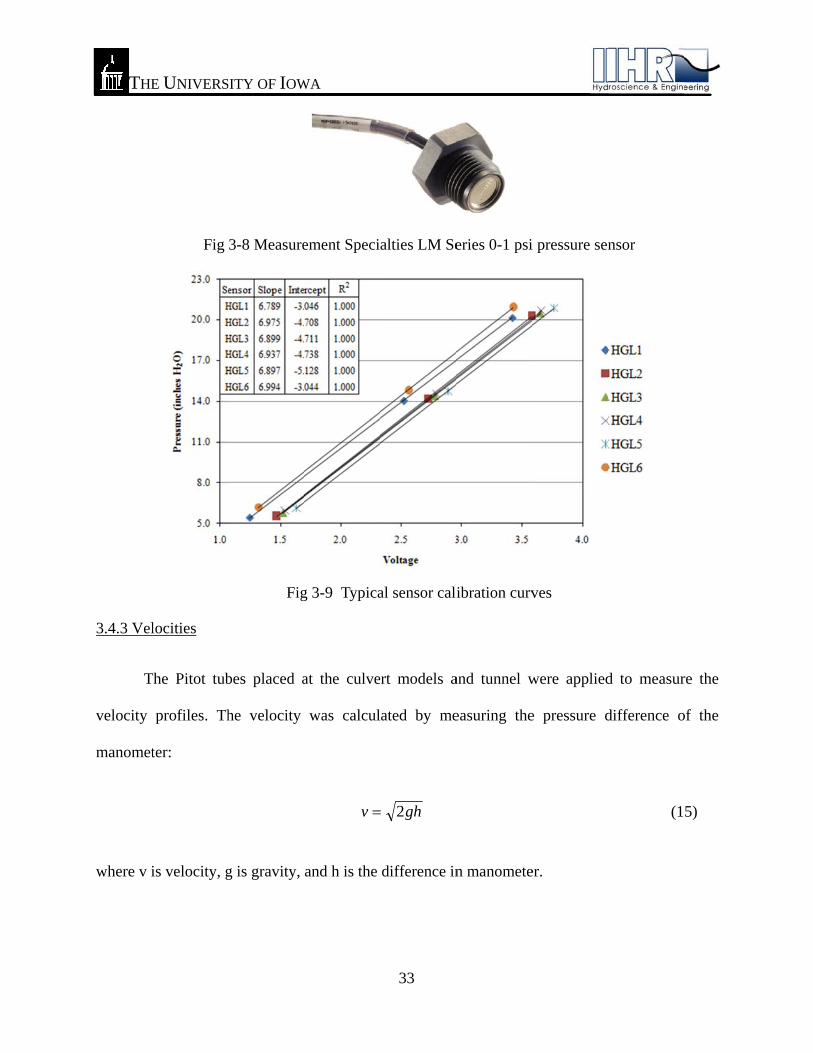
pressure, if needed, was measured with Measurement Specialties LM Series 0-1 psi pressure
sensors. The manufacturer specifies accuracies of +/- 7% of full scale output. The sensors feature
1/2-inch NPT male fittings for simplified installation in the bottom of the inlet and tunnel. An
image of the pressure sensor is shown in Figure 3-8.
The calibration of the Measurement Specialties LM Series 0-1 psi pressure sensors
deployed in the vicinity of culvert model was done by our research team. Figure 3-9 illustrates
the calibration plot for the sensors which converts voltage into pressure (inches of water column)
from our recent research project. The initial calibration was repeatedly checked during the tests
for shifting and zeroing biases.
THE UNIVERSITY OF IOWA
32
a)
b)
c)
Fig 3-7 Intruments for water surface measurement: a) pressure sensor system, b) in-house developed Labview-based software, and c) manometer
THE
3.4.3 Vel
T
velocity
manomet
where v i
E UNIVERS
Fig
locities
The Pitot tub
profiles. Th
ter:
is velocity, g
SITY OF IOW
3-8 Measure
Fig
bes placed a
he velocity
g is gravity,
WA
ement Speci
g 3-9 Typica
at the culve
was calcul
v
and h is the
33
alties LM Se
al sensor cali
ert models a
ated by me
gh2
difference in
eries 0-1 psi
ibration curv
and tunnel w
easuring the
n manomete
i pressure sen
ves
were applied
e pressure d
er.
nsor
d to measur
difference o
(1
re the
of the
5)

THE UNIVERSITY OF IOWA
34
Fig 3-10 The Pitot tube and manometer used for measuring velocity in the flume (photography downloaded from: http://www.jfccivilengineer.com)

THE UNIVERSITY OF IOWA
35
4. Experimental results
The series of experiments were conducted to substantiate the pertinent information a form
suitable for supporting the culvert design specifications that account for the effect of multiple
barrels, span-to-rise ratio, channel slope on the performance curve, as well as for detecting the
optimum geometry for the inlet. The latter results were obtained from tests that isolated the
effects of the change of the wingwall edge geometry.
4.1 Effect of number of barrels
Single box culverts are the common means of roadway crossings for smaller streams.
While this culvert design provides an economical solution to the crossing, the adverse effects of
conveying the stream through a single opening can ultimately be very costly due to scouring of
the bed in the vicinity of the structure. Consequently, the multiple boxes culverts are
recommended for conveying larger discharge. The available culvert design manuals for multiple
culverts are not adequately addressing the following issues:
a) the impact of applying the single barrel coefficient for multiple culverts,
b) the quantitative specification of the hydraulic coefficients associated with the flow
conveyance equations for PC multi-barrel culverts for various geometry and settings
and over a range of flow conditions. Note that PC culverts are geometrically different
than the CIP culverts.

THE UNIVERSITY OF IOWA
36
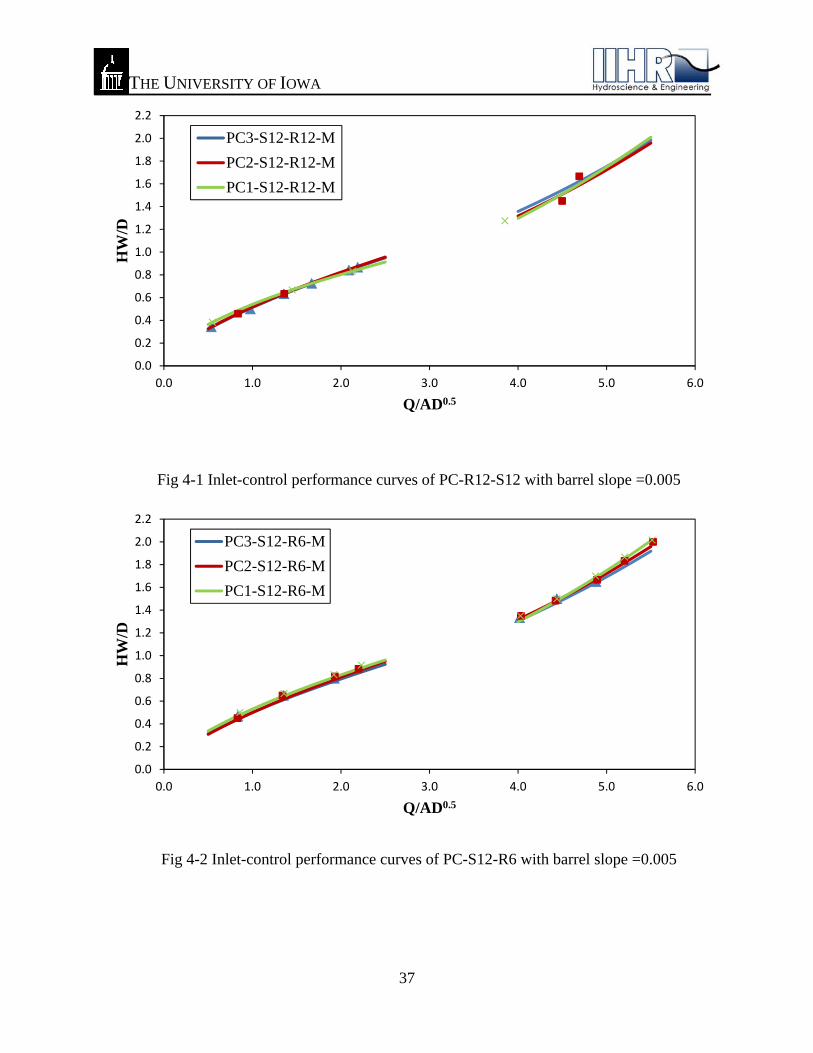
4.1.1 PC culverts
For PC culvert model tests, the results show that there is almost no difference in the
performance of multiple barrels and single barrel culverts for unsubmerged flow conditions
(Figure 4-1 to 4-4). For the submerged flow conditions, Figures 4-3 and 4-4 show the presence
of a considerable difference for multiple barrel culverts when compared to the single barrel
model especially for high flows with steep barrel slopes (i.e., 0.02). The difference is not
substantial for the same configuration culverts set on mild slopes (0.005). These results support
the practice of using the single barrel coefficients for multiple barrel design in unsubmerged
conditions and use of differentiated coefficients when operated in submerged conditions.
The flow conveyance coefficients derived from the experimental tests plotted in Figures
4-1 to 4-4 are summarized in table 4-1. For inlet control equation when flow is under
unsubmerged condition the coefficients (K, M) are similar for single and multiple barrel culverts.
The coefficients (c, Y) for submerged flow conditions show that twin and triple barrels are
different compared to single barrel. There is no essential difference between twin and triple
barrel culverts. The obtained results are in good agreement with the laboratory results reported in
FHWA (2006) for mild slopes. The differentiation is more pronounced for culvert barrels set at
steeper slopes as the dynamic head is commensurately increased for higher slopes.
THE UNIVERSITY OF IOWA
37
Fig 4-1 Inlet-control performance curves of PC-R12-S12 with barrel slope =0.005
Fig 4-2 Inlet-control performance curves of PC-S12-R6 with barrel slope =0.005
0.0
0.2
0.4
0.6
0.8
1.0
1.2
1.4
1.6
1.8
2.0
2.2
0.0 1.0 2.0 3.0 4.0 5.0 6.0
HW
/D
Q/AD0.5
PC3-S12-R12-M
PC2-S12-R12-M
PC1-S12-R12-M
0.0
0.2
0.4
0.6
0.8
1.0
1.2
1.4
1.6
1.8
2.0
2.2
0.0 1.0 2.0 3.0 4.0 5.0 6.0
HW
/D
Q/AD0.5
PC3-S12-R6-M
PC2-S12-R6-M
PC1-S12-R6-M

THE UNIVERSITY OF IOWA
38
Fig 4-3 Inlet-control performance curves of PC-S12-R12 with barrel slope =0.02
Fig 4-4 Inlet-control performance curves of PC-S12-R6 with barrel slope =0.02
0.0
0.2
0.4
0.6
0.8
1.0
1.2
1.4
1.6
1.8
2.0
2.2
0.0 1.0 2.0 3.0 4.0 5.0 6.0
HW
/D
Q/AD0.5
PC3-S12-R12-S
PC2-S12-R12-S
PC1-S12-R12-S
0.0
0.2
0.4
0.6
0.8
1.0
1.2
1.4
1.6
1.8
2.0
2.2
0.0 1.0 2.0 3.0 4.0 5.0 6.0
HW
/D
Q/AD0.5
PC3-S12-R6-S
PC2-S12-R6-S
PC1-S12-R6-S
THE UNIVERSITY OF IOWA
39
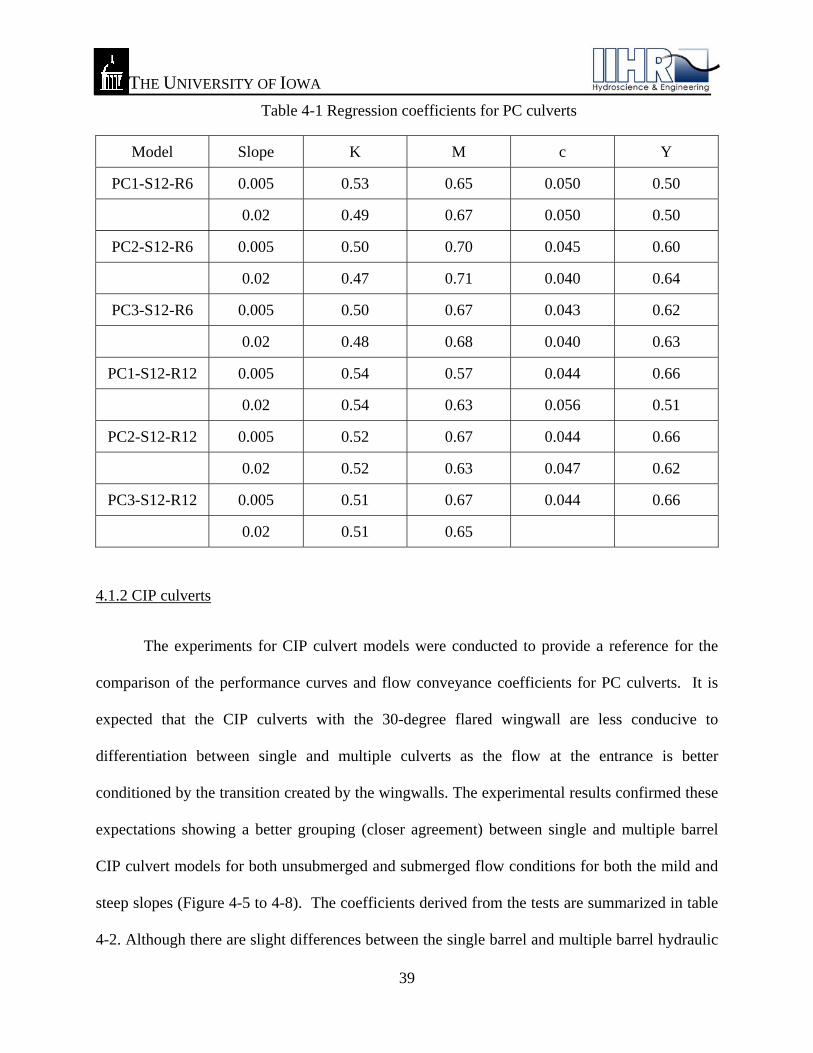
Table 4-1 Regression coefficients for PC culverts
Model Slope K M c Y
PC1-S12-R6 0.005 0.53 0.65 0.050 0.50
0.02 0.49 0.67 0.050 0.50
PC2-S12-R6 0.005 0.50 0.70 0.045 0.60
0.02 0.47 0.71 0.040 0.64
PC3-S12-R6 0.005 0.50 0.67 0.043 0.62
0.02 0.48 0.68 0.040 0.63
PC1-S12-R12 0.005 0.54 0.57 0.044 0.66
0.02 0.54 0.63 0.056 0.51
PC2-S12-R12 0.005 0.52 0.67 0.044 0.66
0.02 0.52 0.63 0.047 0.62
PC3-S12-R12 0.005 0.51 0.67 0.044 0.66
0.02 0.51 0.65
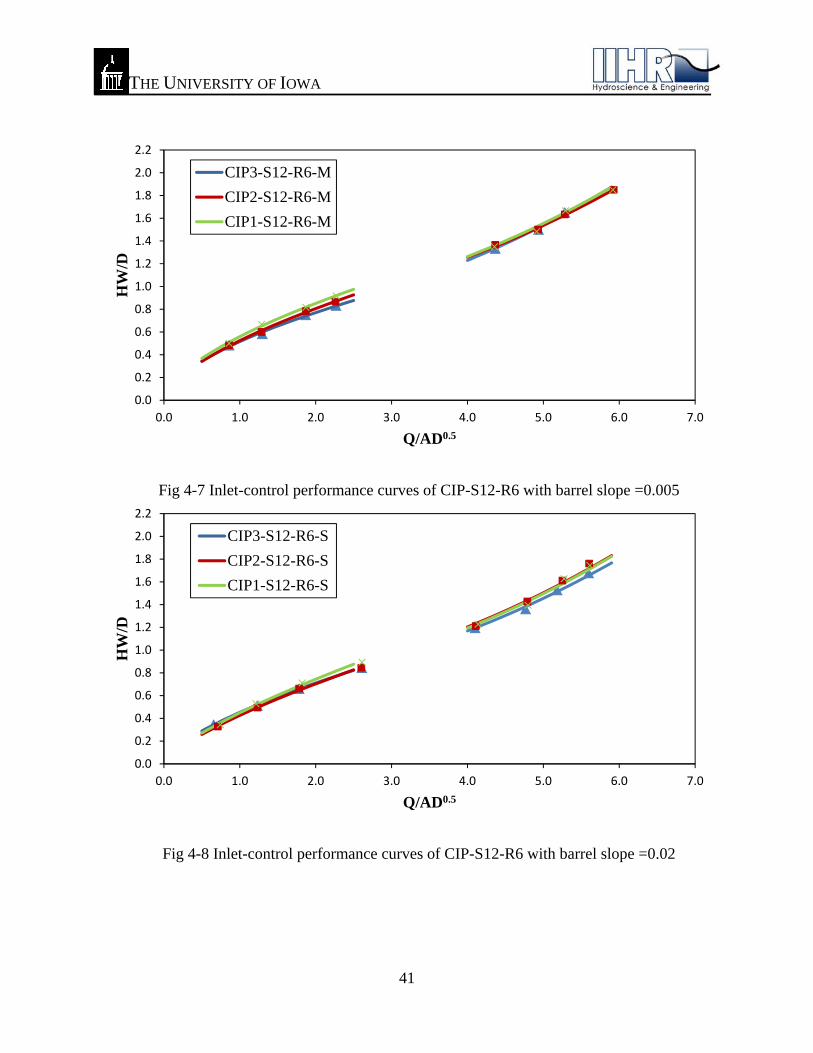
4.1.2 CIP culverts
The experiments for CIP culvert models were conducted to provide a reference for the
comparison of the performance curves and flow conveyance coefficients for PC culverts. It is
expected that the CIP culverts with the 30-degree flared wingwall are less conducive to
differentiation between single and multiple culverts as the flow at the entrance is better
conditioned by the transition created by the wingwalls. The experimental results confirmed these
expectations showing a better grouping (closer agreement) between single and multiple barrel
CIP culvert models for both unsubmerged and submerged flow conditions for both the mild and
steep slopes (Figure 4-5 to 4-8). The coefficients derived from the tests are summarized in table
4-2. Although there are slight differences between the single barrel and multiple barrel hydraulic

THE UNIVERSITY OF IOWA
40
performance, it is reasonable to estimate the performance curves of multiple barrel culverts with
the coefficients derived from the single barrel culvert.
Fig 4-5 Inlet-control performance curves of CIP-S12-R12 with barrel slope =0.005
Fig 4-6 Inlet-control performance curves of CIP-S12-R12 with barrel slope =0.02
0.0
0.2
0.4
0.6
0.8
1.0
1.2
1.4
1.6
1.8
2.0
2.2
0.0 1.0 2.0 3.0 4.0 5.0 6.0
HW
/D
Q/AD0.5
CIP3-S12-R12-M
CIP2-S12-R12-M
CIP1-S12-R12-M
0.0
0.2
0.4
0.6
0.8
1.0
1.2
1.4
1.6
1.8
2.0
2.2
0.0 1.0 2.0 3.0 4.0 5.0 6.0
HW
/D
Q/AD0.5
CIP3-S12-R12-S
CIP2-S12-R12-S
CIP1-S12-R12-S
THE UNIVERSITY OF IOWA
41
Fig 4-7 Inlet-control performance curves of CIP-S12-R6 with barrel slope =0.005
Fig 4-8 Inlet-control performance curves of CIP-S12-R6 with barrel slope =0.02
0.0
0.2
0.4
0.6
0.8
1.0
1.2
1.4
1.6
1.8
2.0
2.2
0.0 1.0 2.0 3.0 4.0 5.0 6.0 7.0
HW
/D
Q/AD0.5
CIP3-S12-R6-M
CIP2-S12-R6-M
CIP1-S12-R6-M
0.0
0.2
0.4
0.6
0.8
1.0
1.2
1.4
1.6
1.8
2.0
2.2
0.0 1.0 2.0 3.0 4.0 5.0 6.0 7.0
HW
/D
Q/AD0.5
CIP3-S12-R6-S
CIP2-S12-R6-S
CIP1-S12-R6-S
THE UNIVERSITY OF IOWA
42
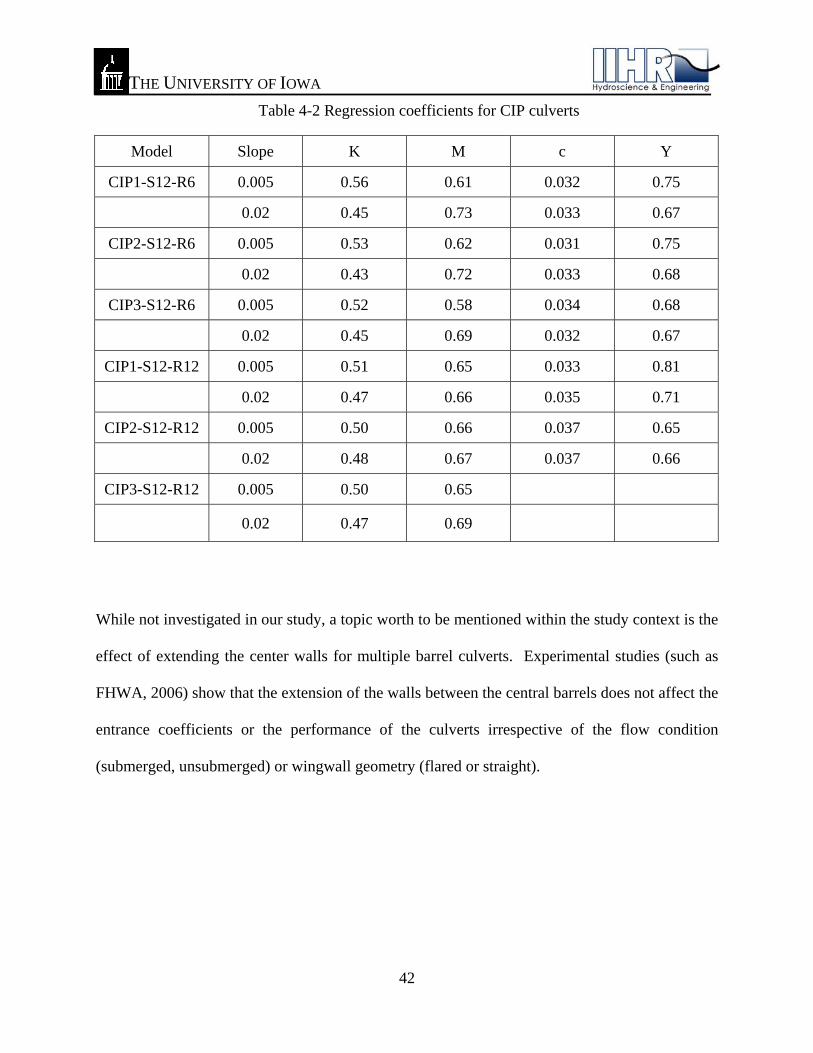
Table 4-2 Regression coefficients for CIP culverts
Model Slope K M c Y
CIP1-S12-R6 0.005 0.56 0.61 0.032 0.75
0.02 0.45 0.73 0.033 0.67
CIP2-S12-R6 0.005 0.53 0.62 0.031 0.75
0.02 0.43 0.72 0.033 0.68
CIP3-S12-R6 0.005 0.52 0.58 0.034 0.68
0.02 0.45 0.69 0.032 0.67
CIP1-S12-R12 0.005 0.51 0.65 0.033 0.81
0.02 0.47 0.66 0.035 0.71
CIP2-S12-R12 0.005 0.50 0.66 0.037 0.65
0.02 0.48 0.67 0.037 0.66
CIP3-S12-R12 0.005 0.50 0.65
0.02 0.47 0.69
While not investigated in our study, a topic worth to be mentioned within the study context is the
effect of extending the center walls for multiple barrel culverts. Experimental studies (such as
FHWA, 2006) show that the extension of the walls between the central barrels does not affect the
entrance coefficients or the performance of the culverts irrespective of the flow condition
(submerged, unsubmerged) or wingwall geometry (flared or straight).

THE UNIVERSITY OF IOWA
43
4.2. The effect of wingwall flare angle
The role of the wingwalls is to guide the approaching channel flow entering the culvert
barrel. For CIP culverts the wingwalls are usually flared. Angles of 15, 30, and 45 degrees are
the most common angles. For PC culvert the wingwalls are straight and practically of the same
size as those used for CIP culverts. The experimental data collected through this study enable to
compare the effect of the wingwall flare angle on PC and CIP operations. In general the use of
flared wingwalls is more beneficial as their layout produce a better streamlining of the flow at
the culvert entrance hence reducing the entrance hydraulic losses.
The hydraulic advantage of the flared wingwall over the straight ones can be observed in
Figure 4-9 and 4-10, where the CIP culvert fit with flared wingwalls performed better than the
PC culvert models, especially at high discharges. The findings are consistent with those in the
FHWA (2006) study for South Dakota DOT culvert geometries. Furthermore the FHWA study
found slight changes in the culvert performance irrespective of their type with the increase in
span-to-rise ratio as the cross sections for these cases are not so much affected by the contraction
of the flow upstream the culvert. The hydraulic advantage of the flared wingwall is materialized
through lower headlosses at the culvert as can be observed in table 4-2.

THE
(ex
(ex
0.0
0.2
0.4
0.6
0.8
1.0
1.2
1.4
1.6
1.8
2.0
2.2H
W/D
0.0
0.2
0.4
0.6
0.8
1.0
1.2
1.4
1.6
1.8
2.0
2.2
HW
/D
E UNIVERS
Fig 4-9 Inlxperimental p
Fig 4-10 Inlxperimental p
0.0
0.0
SITY OF IOW
let-control pepoints were
let-control ppoints were
1.0
PC1-S12-R
CIP1-S12-R
CIP1-S12-R
PC1-S12-R
1.0
WA
erformance removed to
performance removed to
2.0
R6
R12
R6
R12
2.0
44
curves of allbetter substa
curves of allbetter substa
3.0
Q/AD0.5
3.0
Q/AD0.5
l one-box mantiate the d
l twin-box mantiate the d
4.0
5
4.0
odels with sdifferences be
models with differences be
5.
5.
lope =0.02 etween curv
slope =0.02etween curv
0
0
ves)
ves)
6.0
6.0

THE UNIVERSITY OF IOWA
45
Overall, it can be stated that the flared wingwalls induce less losses of the flow energy at
the culvert entrance. This observation is more pertinent to single barrel culverts, as in the case of
multi-barrel culverts a smaller percentage of the flow is influenced by the presence of the
wingwalls. The observation is confirmed by the performance curve plots whereby it can be
observed that the curves for both submerged and unsubmerged regimes become closer as the
number of barrel increases. Recent studies (Ho, 2010) show that fitting the culvert with flared
wingwalls requires an increase of the cross section of the stream in the immediate vicinity of the
culvert. This expansion immediately upstream the culvert creates an area prone to sedimentation
with negative impacts on the culvert operation. Specifically, the sediment deposits stabilized by
the growth of vegetation lead in time to considerable obstruction of the flow and associated
increase of energy losses.
4.3 Effect of culvert barrel slope
The effect of the culvert barrel slope is shown in Figure 4-11 for PC single barrel culvert
model. The differentiation is not very pronounced for unsubmerged flow conditions. The
differentiation is more substantial for high flows as the dynamic head is commensurately
increased due to the increased grade line of the bed. In design, distinction should be made for
flow conveyance coefficients only when the culverts operate in submerged flow conditions.

THE UNIVERSITY OF IOWA
46
Fig 4-11 Inlet-control performance curves of PC1-S12-R12 with two barrel slopes (experimental points were removed to better substantiate the differences between curves)
4.4 Effect of span-to-rise ratio
For unsubmerged flow situations it is not expected that the flow conveyance is
significantly affected by the span-to-rise ration up to the point of full-section flow (submerged
condition). This expectation holds for both PC and CIP single and multi-barrel culverts. The
expectation is confirmed by the experimental results shown in Figure 4-12 for the single PC
culvert model operated under inlet control. A slight loss in performance might occur as the span-
to-rise ratio increases for submerged flow. Figure 4-13 shows similar results for CIP culvert
models. Taking into account the experimental scatter, one may conclude that there is no
difference between the performances of the culverts for unsubmerged flow conditions. The
performance slightly decrease when span-to-rise ratio increases for both types of culvert models.
0.0
0.2
0.4
0.6
0.8
1.0
1.2
1.4
1.6
1.8
2.0
2.2
0.0 1.0 2.0 3.0 4.0 5.0 6.0
HW
/D
Q/AD0.5
PC1-S12-R12-S
PC1-S12-R12-M

THE UNIVERSITY OF IOWA
47
Fig 4-12 Inlet-control performance curves of PC1-S12-R12, PC1-S12-R6 with slope =0.02 (experimental points were removed to better substantiate the differences between curves)
Fig 4-13 Inlet-control performance curves of CIP1-S12-R12, CIP1-S12-R6 with slope =0.02 (experimental points were removed to better substantiate the differences between curves)
0.0
0.2
0.4
0.6
0.8
1.0
1.2
1.4
1.6
1.8
2.0
2.2
0.0 1.0 2.0 3.0 4.0 5.0 6.0
HW
/D
Q/AD0.5
PC1-S12-R6PC1-S12-R12
0.0
0.2
0.4
0.6
0.8
1.0
1.2
1.4
1.6
1.8
2.0
2.2
0.0 1.0 2.0 3.0 4.0 5.0 6.0
HW
/D
Q/AD0.5
CIP1-S12-R6CIP1-S12-R12

THE UNIVERSITY OF IOWA
48
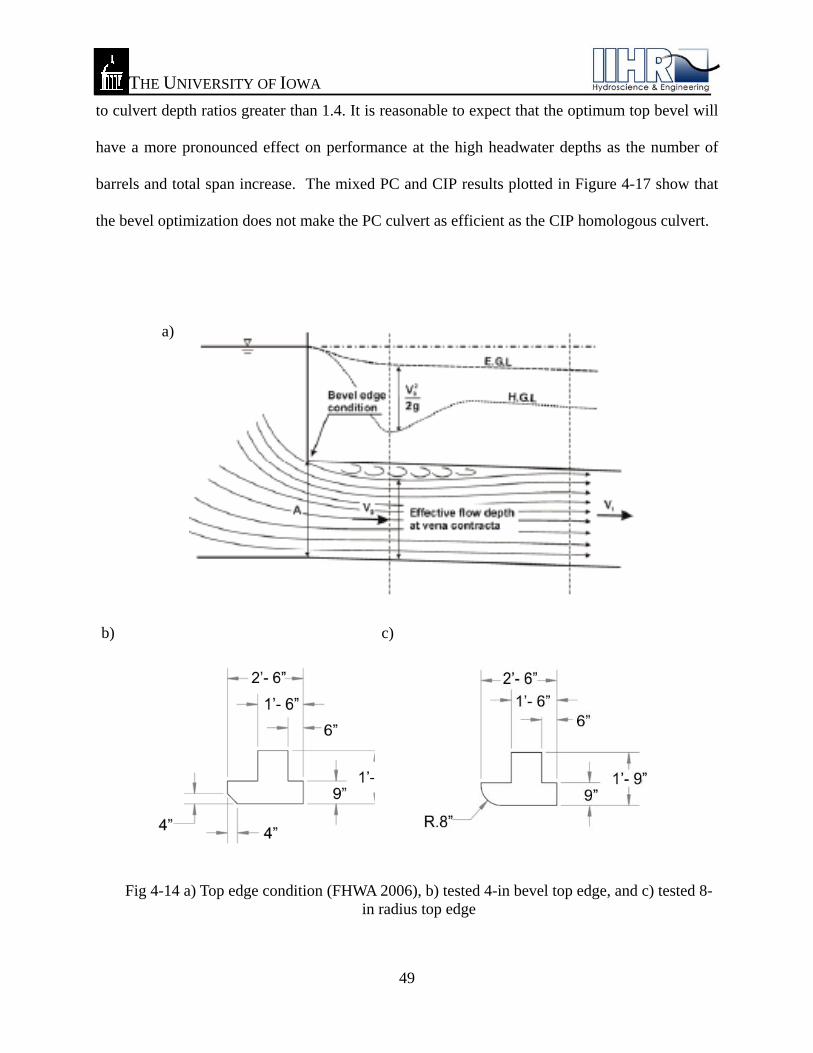
4.5 Effect of the top edge geometry
While the geometry of the edges of the entrance cross section is fixed for bottom and the
side walls, the top edge can be further conditioned to diminish the losses associated with the flow
conveyance. Consequently, an additional set of tests focused on quantitatively characterize the
effect of the top edge from several alternate shapes that were suggested. This effect is only
relevant for the submerged flow situations when the flow is in contact with the culvert ceiling.
For flow levels higher than the culvert ceiling a contraction develops at the culvert entrance that
further increases the total head losses, as indicated in Figure 4-14a (FHWA, 2006). Tests were
conducted with 8-in radius top edge (labeled with the suffix “–op” in the plots) and 4-in bevel
top edge (reference condition) as illustrated in Figures 4-14b and c. The effect of the edge shape
was tested on PC culvert models. FHWA (2004) investigated the effect of the wingwall top edge
for submerged flow conditions. The results indicate that the performance curves were practically
unchanged indicating that the shape of the wingwall top edge investigated in their study is not
affecting the operation or the hydraulic losses of the culverts. The same conclusion was drawn by
the FHWA (2004) study about the effect of the corner fillets set along the corners of the
rectangular culvert cross section.
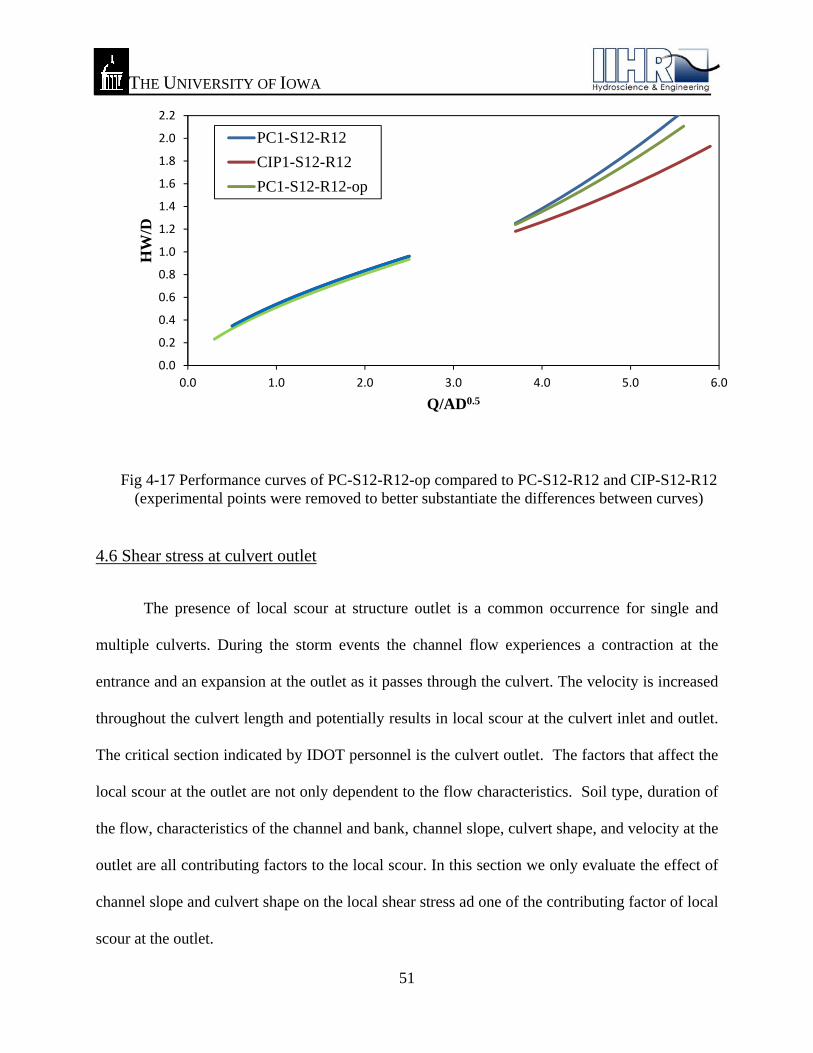
The optimal top bevel conducted in this test is 8-in radius top edge. The PC culvert
models with the optimal bevel were labeled as PC-S12-R12-op and PC-S12-R6-op. Figures 4-15
and 4-16 show the performance curves for each PC culvert model with optimal top bevel. One of
the results displayed by the plots show that the multiple barrel culverts perform hydraulically
better than the single-barrel ones. Compared to CIP culvert model, the PC culvert model with
the optimum curved top bevel showed closer agreement with the CIP culvert model at headwater
THE UNIVERSITY OF IOWA
49
to culvert depth ratios greater than 1.4. It is reasonable to expect that the optimum top bevel will
have a more pronounced effect on performance at the high headwater depths as the number of
barrels and total span increase. The mixed PC and CIP results plotted in Figure 4-17 show that
the bevel optimization does not make the PC culvert as efficient as the CIP homologous culvert.
a)
b) c)
Fig 4-14 a) Top edge condition (FHWA 2006), b) tested 4-in bevel top edge, and c) tested 8-in radius top edge

THE UNIVERSITY OF IOWA
50
Fig 4-15 Inlet-control performance curves of PC-S12-R6-op with barrel slope =0.02
Fig 4-16 Inlet-control performance curves of PC-S12-R12-op with barrel slope =0.02
0.0
0.2
0.4
0.6
0.8
1.0
1.2
1.4
1.6
1.8
2.0
2.2
0.0 1.0 2.0 3.0 4.0 5.0 6.0
HW
/D
Q/AD0.5
PC3-S12-R6-S-op
PC2-S12-R6-S-op
PC1-S12-R6-S-op
0.0
0.2
0.4
0.6
0.8
1.0
1.2
1.4
1.6
1.8
2.0
2.2
0.0 1.0 2.0 3.0 4.0 5.0 6.0
HW
/D
Q/AD0.5
PC3-S12-R12-S-op
PC2-S12-R12-S-op
PC1-S12-R12-S-op
THE UNIVERSITY OF IOWA
51
Fig 4-17 Performance curves of PC-S12-R12-op compared to PC-S12-R12 and CIP-S12-R12 (experimental points were removed to better substantiate the differences between curves)
4.6 Shear stress at culvert outlet
The presence of local scour at structure outlet is a common occurrence for single and
multiple culverts. During the storm events the channel flow experiences a contraction at the
entrance and an expansion at the outlet as it passes through the culvert. The velocity is increased
throughout the culvert length and potentially results in local scour at the culvert inlet and outlet.
The critical section indicated by IDOT personnel is the culvert outlet. The factors that affect the
local scour at the outlet are not only dependent to the flow characteristics. Soil type, duration of
the flow, characteristics of the channel and bank, channel slope, culvert shape, and velocity at the
outlet are all contributing factors to the local scour. In this section we only evaluate the effect of
channel slope and culvert shape on the local shear stress ad one of the contributing factor of local
scour at the outlet.
0.0
0.2
0.4
0.6
0.8
1.0
1.2
1.4
1.6
1.8
2.0
2.2
0.0 1.0 2.0 3.0 4.0 5.0 6.0
HW
/D
Q/AD0.5
PC1-S12-R12
CIP1-S12-R12
PC1-S12-R12-op

THE UNIVERSITY OF IOWA
52
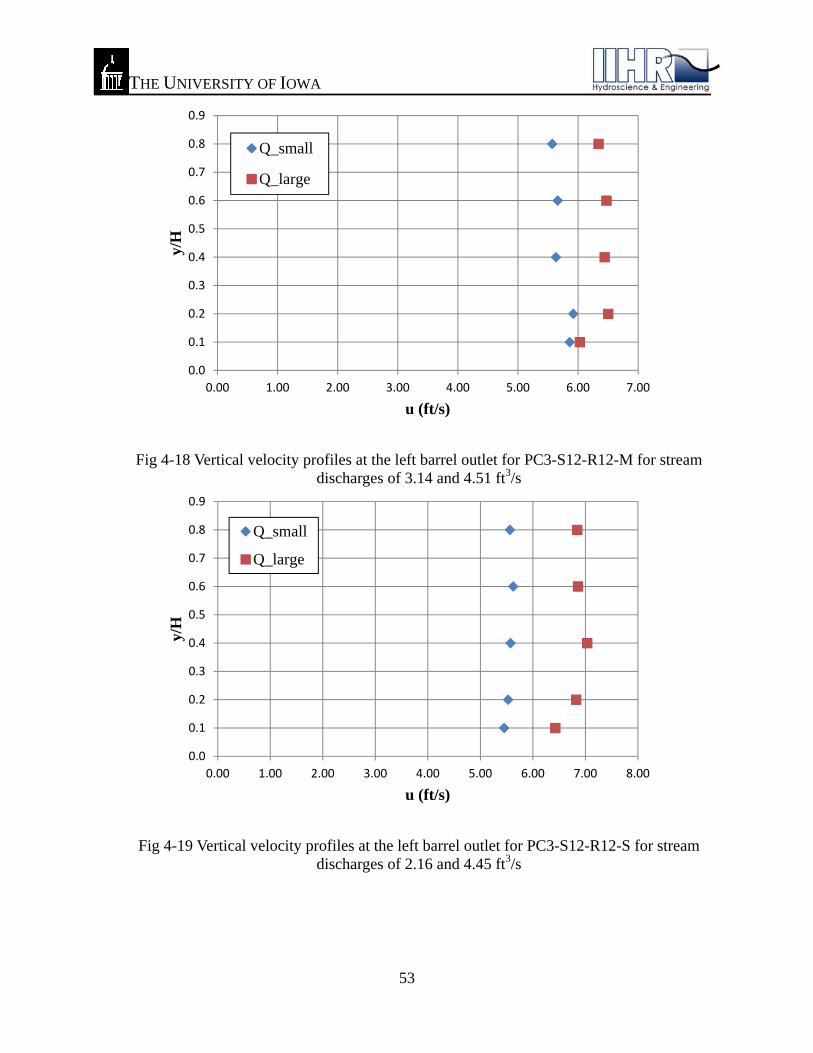
For this purpose, velocity profiles were measured with the Pitot tubes in side barrels of
triple culverts where the velocity is larger than in the central barrel. The tests were conducted for
three culvert models: PC3-S12-R12-M, PC3-S12-R12-S and CIP3-S12-R12-M. The evaluated
shear stress and its variation with channel slope and culvert shape effects are shown in Figures 4-
18 to 4-20). The shear stress as the indicator of the scour at the outlet was estimated from the
measured velocity profiles in conjunction with regression lines constrained to the law of the wall
method. We assumed that the velocity profile in the lower portion of an open channel flow has a
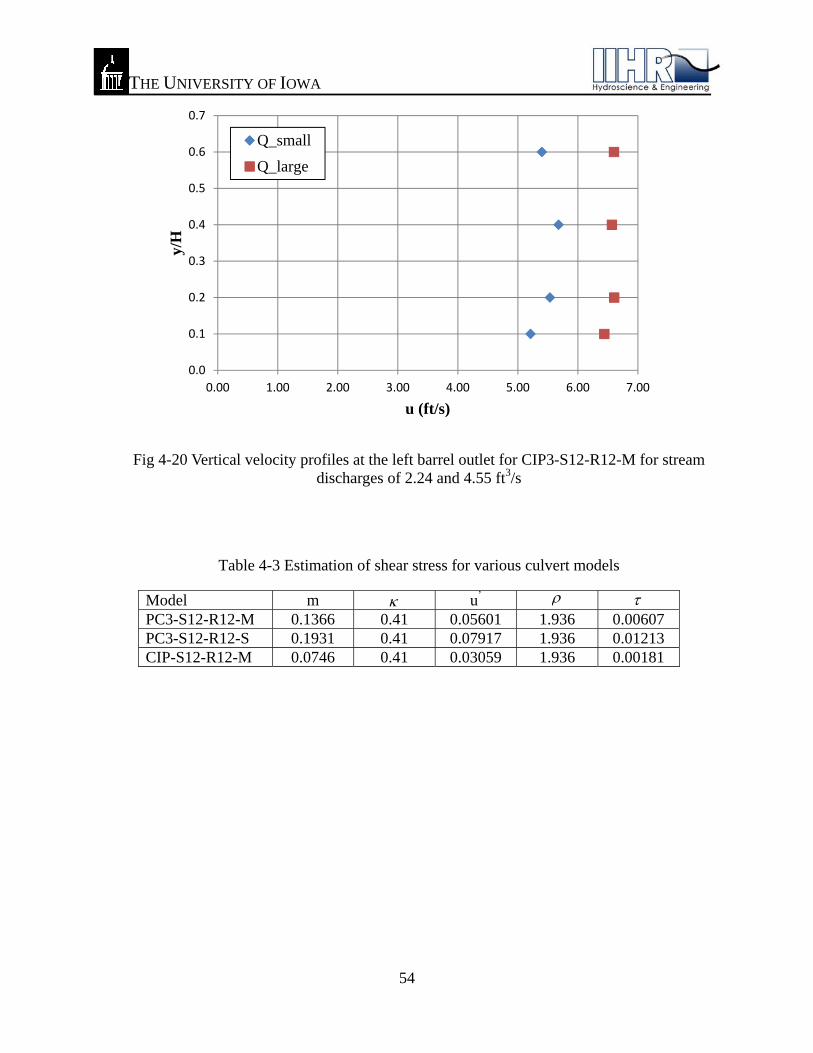
logarithmic structure, hence the law of the wall can be applied for this region:
bymy
yuu
lnln
0
'
(23)
where u = mean velocity, u’ = shear velocity, = von Karman’s constant, y = distance above
bed, and m is slope of the regression line = u’/ .
After the slope of the regression line was calculated, the shear stress was estimated based on:
2'u (24)
The results of the shear stress at the outlet of each culvert model are presented in Table 4-3. It
can be noticed that the shear stress increases with the channel slope. The plots also suggest that
the CIP culvert model displays less shear stress at the outlet compared to the PC culvert model
which is also expected by the spread of the flow facilitated by the oblique wingwalls. Although
the prediction of scour hole at outlet is difficult, the present results indicate that more protection
against scour is needed for PC culvert outlets in comparison with CIP culverts.
THE UNIVERSITY OF IOWA
53
Fig 4-18 Vertical velocity profiles at the left barrel outlet for PC3-S12-R12-M for stream discharges of 3.14 and 4.51 ft3/s
Fig 4-19 Vertical velocity profiles at the left barrel outlet for PC3-S12-R12-S for stream discharges of 2.16 and 4.45 ft3/s
0.0
0.1
0.2
0.3
0.4
0.5
0.6
0.7
0.8
0.9
0.00 1.00 2.00 3.00 4.00 5.00 6.00 7.00
y/H
u (ft/s)
Q_small
Q_large
0.0
0.1
0.2
0.3
0.4
0.5
0.6
0.7
0.8
0.9
0.00 1.00 2.00 3.00 4.00 5.00 6.00 7.00 8.00
y/H
u (ft/s)
Q_small
Q_large
THE UNIVERSITY OF IOWA
54
Fig 4-20 Vertical velocity profiles at the left barrel outlet for CIP3-S12-R12-M for stream discharges of 2.24 and 4.55 ft3/s
Table 4-3 Estimation of shear stress for various culvert models
Model m u’ PC3-S12-R12-M 0.1366 0.41 0.05601 1.936 0.00607 PC3-S12-R12-S 0.1931 0.41 0.07917 1.936 0.01213 CIP-S12-R12-M 0.0746 0.41 0.03059 1.936 0.00181
0.0
0.1
0.2
0.3
0.4
0.5
0.6
0.7
0.00 1.00 2.00 3.00 4.00 5.00 6.00 7.00
y/H
u (ft/s)
Q_small
Q_large

THE UNIVERSITY OF IOWA
55
5. Conclusion and Recommendations
The increased number of single and multi-barrel PC culverts constructed by Iowa DOT
rather than the conventional CIP culverts emphasizes the need to conduct additional research for
documenting specifications on the hydraulic aspects of the PC culvert operations. Of special
interest for this purpose are the evaluation of the entrance loss coefficients and the construction
of the hydraulic performance curves for culverts of various configurations operating in a variety
of flow conditions and topographic settings. These hydraulic specifications are further used in
conjunction with software programs used to design culverts. The results of the study are
expressed in non-dimensional form such as they are unit-system independent and can be readily
used in specialized culvert design software.
Following the experimental study, there are a set of conclusions that are emerging from the
analyses of the results:
- Multiple barrel CIP culverts have little effect on the performance curves for single CIP
culverts when operating in unsubmerged and submerged conditions (see Figures 4-5 to 4-8).
The single-, twin-, and triple-barrel culverts can reasonably be combined as a single
performance curve without much loss in accuracy for any type of CIP culvert. This
conclusion stands for mild and steep slopes. This conclusion endorses the current practice of
using single-barrel design coefficients for multi-barrel culverts.
- The presence of multiple barrels has a more pronounced effect on the performance curves for
PC culverts (see Figures 4-3 and 4-4). For mild slopes the differences are not essentials for
both unsubmerged and submerged flow conditions (see Figures 4-1 and 4-2). For steeper

THE UNIVERSITY OF IOWA
56
slopes the difference in the performance curves for single-, double-, and triple-barrel culverts
is noticeable, especially for the unsubmerged flow condition. As a consequence, distinct
coefficients for entrance losses and performance curves need to be used for high flows that
fill in the cross section when the culvert is set on steep slopes.
- The presence of flared wingwalls (such as those associated with CIP culverts) better
“streamline” the flow at the culvert entrance making the culvert more advantageous from the
hydraulic performance perspective in comparison with the straight wingwall culverts (such as
those associated with the PC culverts), as illustrated in Figures 4-9 and 4-10. A direct
consequence of this finding is that the CIP culverts are more efficient hydraulically then the
PC ones. The differentiation between the culvert performances is more substantial for
culverts operating with inlet control at high discharges. These observations are more evident
for single barrel culverts, as for multiple barrels a smaller percentage of the flow is
influenced by the wingwalls. It should mentioned at this point that the decision to choose a
CIP or PC culvert design does is not only driven by the hydraulic performance of the culverts
but also by the other considerations such as construction price and associated operational
problems such as sedimentation. An on-going study conducted by the authors (Ho, 2010)
showed that the presence of flared wingwalls create additional problems in operation due to
the sedimentation that is easily developed in the expansion area at the entrance of the
culverts.
- The effect of the culvert barrel slope (shown in Figure 4-11) is not of considerable
importance for unsubmerged flow conditions (low discharges). The differentiation is more
substantial for high flows where both the performance curves and the flow conveyance
coefficients need to be chosen commensurate with the magnitude of the slope.

THE UNIVERSITY OF IOWA
57
- The change in span-to-rise ratio was found to not affect the hydraulic performance of the
culvert in the unsubmerged conditions. Slight decrease in performance is noted with the
span-to-rise ration increases for submerged flow conditions. PC culverts are most sensitive to
this parameter then the CIP culverts. The trends mentioned above are less important as the
number of barrels increases.
- The top edge shape of the culverts impact the flow conveyance efficiency only when the
culverts operate in high flows that fill the culvert cross section leading to a pipe flow
situation. The two geometries for the top edge investigated in the study show little difference
with the change in edge shape. However, as expected from theoretical considerations and
proven with detailed experiments by FHWA (2006), the 8-in radius top edge suggested by
IDOT should have a more positive impact on the head losses than our result indicate, hence it
is recommended for implementation.
Overall it can be concluded that the study on the hydraulic performance of the CIP and
PC culverts suggests that the implementation of the Iowa DOT design for PC culverts is feasible
for implementation for most of the cases investigated. For unsubmerged flow conditions the
difference in the performance curves and headloss coefficients are minor, practically within the
uncertainty of the experimental data. Differentiations as noted above are more substantial for
high flows when the flow is increasingly constricted at the entrance in the culvert. The
differentiation due to various factors is less important for multi-barrel culverts as the influence of
the wingwalls decreases with the increase of the number of barrels. Accounting for their reduced
cost, efficiency in construction, and (potentially) the better performance with respect to the
conveyance of sediment, the transition from CIP to PC culverts seems to be in general headed in
the right direction. Corrections to the performance curves and entrance loss coefficients should

THE UNIVERSITY OF IOWA
58
be applied for high flows creating submerged conditions and certainly for single-barrel culverts.
The regression curves produced for the performance curves accounting for various changes
investigated in the present study (i.e., culvert geometry, culvert slope, span-to-rise ratio, number
of barrels, wingwall flare angle, and top edge geometry) can be conveniently used for designing
various culvert configurations, settings, and flows.

THE UNIVERSITY OF IOWA
59
References
Bodhaine, G.L., (1982) “Measurement of Peak Discharge at Culvert by Indirect Method.”
Techniques of Water-Resource Investigations of the United States Geological Survey,
Chapter A3
Charbeneau, R. J., Henderson A. D., and Sherman L. C., (2006) “Hydraulic Performance Curve
for Highway Culverts.” J. Hydraulic Engineering, Vol. 132, No. 5.
Charbeneau, R. J., Henderson A. D., Murdock R. C., Sherman L. C., (2002) “Hydraulics of
Channel Expansions Leading to Low-Head Culverts” Research Rep. 2109-1, Center
for Transportation Research, Univ. of Texas at Austin, Austin, Tex
Claydon J.F. (No date) “Lab experiments” Available: http://www.jfccivilengineer.com
[Accessed 10 December 2012]
FHWA (1985). “Hydraulic Design of Highway Culverts,” Federal Highway Administration
Hydraulic Design Series No. 5 (HDS-5), Report Number FHWA-IP-85-15, McLean,
VA.
FHWA (2004) “Effects of Inlet Geometry on Hydraulic Performance of Box Culverts,”
Laboratory Report, Publication No. FHWA-RD-04-138, Research, Development, and
Technology Turner-Fairbank Highway Researh Center, McLean, VA.
FHWA (2006) “Effects of Inlet Geometry on Hydraulic Performance of Box Culverts,”
Publication No. FHWA-HRT-06-138, Research, Development, and Technology
Turner-Fairbank Highway Researh Center, McLean, VA.
Henderson, F.M. (1966) “Open Channel Flow” Collier–Macmillan Publishing Company,
London.
Ho, H-C. (2010). Investigation of Unsteady and Non-uniform flow and Sediment Transport
Characteristics at Culvert Sites. PhD thesis, The University of Iowa, Iowa City, IA.

THE UNIVERSITY OF IOWA
60
Iowa Department of Transportation Highway division (2010) “Precast Culvert Standard.”
Available: http://www.iowadot.gov/bridge/v8preculstd.htm [Accessed 13 April 2011]
Iowa Department of Transportation Highway division (2010) “Reinforced Concrete Box Culvert
Standard.” Available: http:// http://www.iowadot.gov/bridge/v8eculstd.htm [Accessed
13 April 2011]
Jain, S.C. (2001) “Open-Channel Flow”, John Wiley & Sons. INC., New York
Normann, J. M., Houghtalen, R. J., and Johnson, W. J., (1985) “Hydraulic Design of Highway
Culverts.” Hydraulic Design Series No. 5, 2nd Ed., Federal Highway Administration,
Washington, D.C.


