

Determining the Location and Cause of Faults In Power Distribution System With an Arc Voltage Evaluation Method
Mario Tremblay ResearcherHydro-Quebec (IREQ)[email protected]

Plan of the Presentation
1. Introduction to the Techniques2. Use Case Examples3. Feeder Maintenance Use Example

Introduction to the Techniques
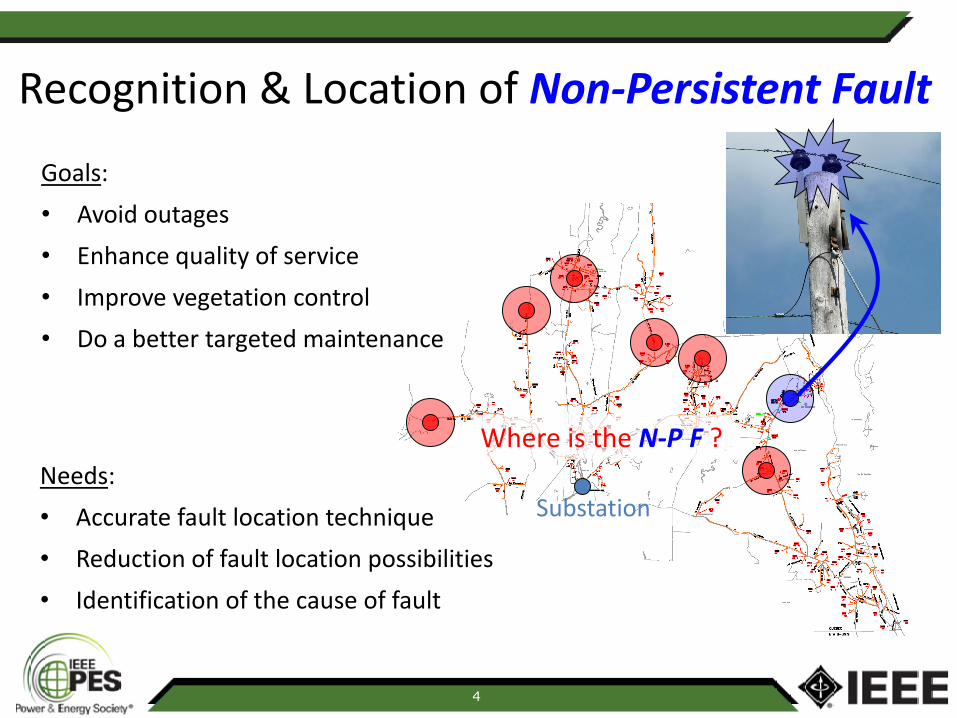
Recognition & Location of Non-Persistent Fault
Goals:• Avoid outages• Enhance quality of service• Improve vegetation control• Do a better targeted maintenance
Needs:• Accurate fault location technique• Reduction of fault location possibilities• Identification of the cause of fault
4
Substation
Where is the N-P F ?
Z1
Vr(012)
Vi(012)
Z1 Id
ME1
ME3
ME2
Z2
Z3
× VdVd
Id
V1
V2
V3
Z2 Id
Z3 Id
Substation
3-phase symmetrical component
phasors(0,1,2)
Z1
Vr(012)
Vi(012)
Z1 Id
ME1
ME3
ME2
Z2
Z3
×× VdVd
Id
V1
V2
V3
Z2 Id
Z3 Id
Substation
3-phase symmetrical component
phasors(0,1,2)
5
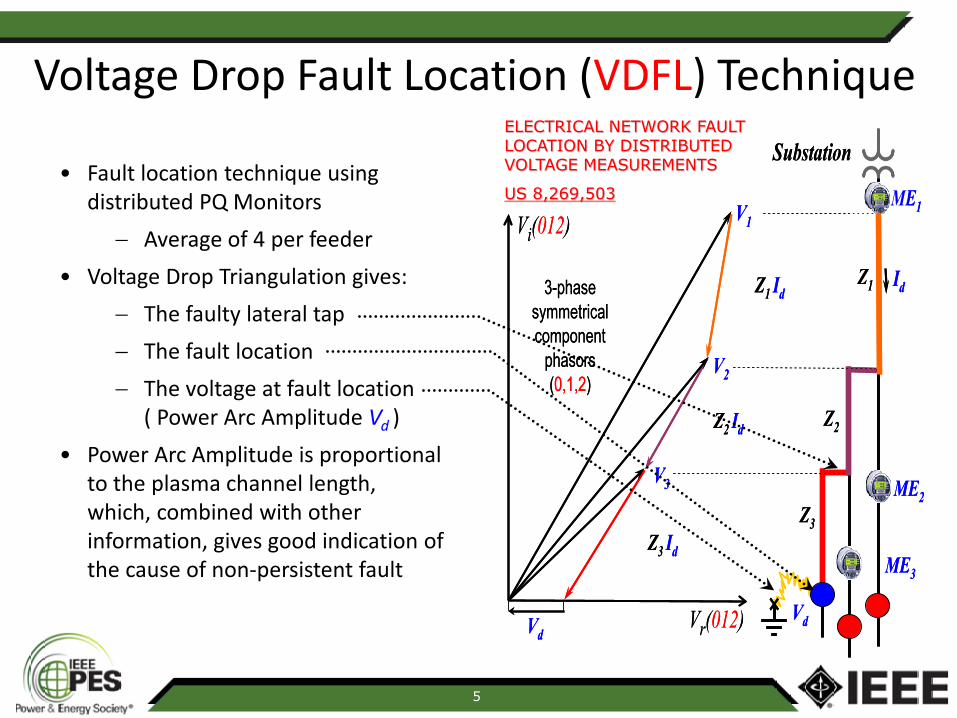
• Fault location technique using distributed PQ Monitors
− Average of 4 per feeder• Voltage Drop Triangulation gives:
− The faulty lateral tap − The fault location− The voltage at fault location
( Power Arc Amplitude Vd ) • Power Arc Amplitude is proportional
to the plasma channel length, which, combined with other information, gives good indication of the cause of non-persistent fault
Voltage Drop Fault Location (VDFL) TechniqueELECTRICAL NETWORK FAULT LOCATION BY DISTRIBUTED VOLTAGE MEASUREMENTS
US 8,269,503
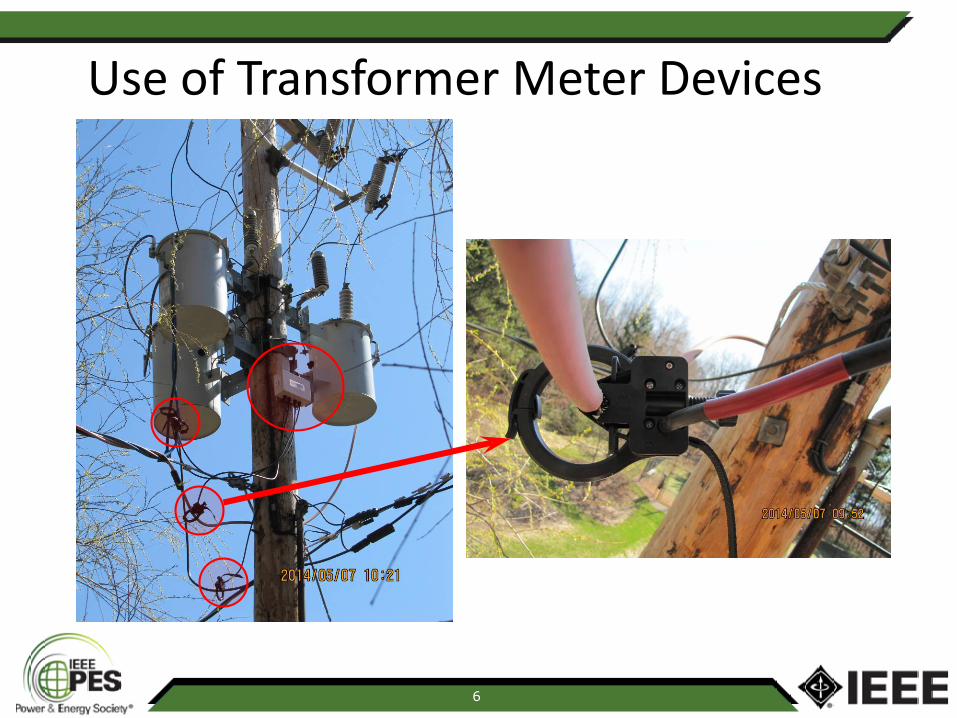
Use of Transformer Meter Devices
6
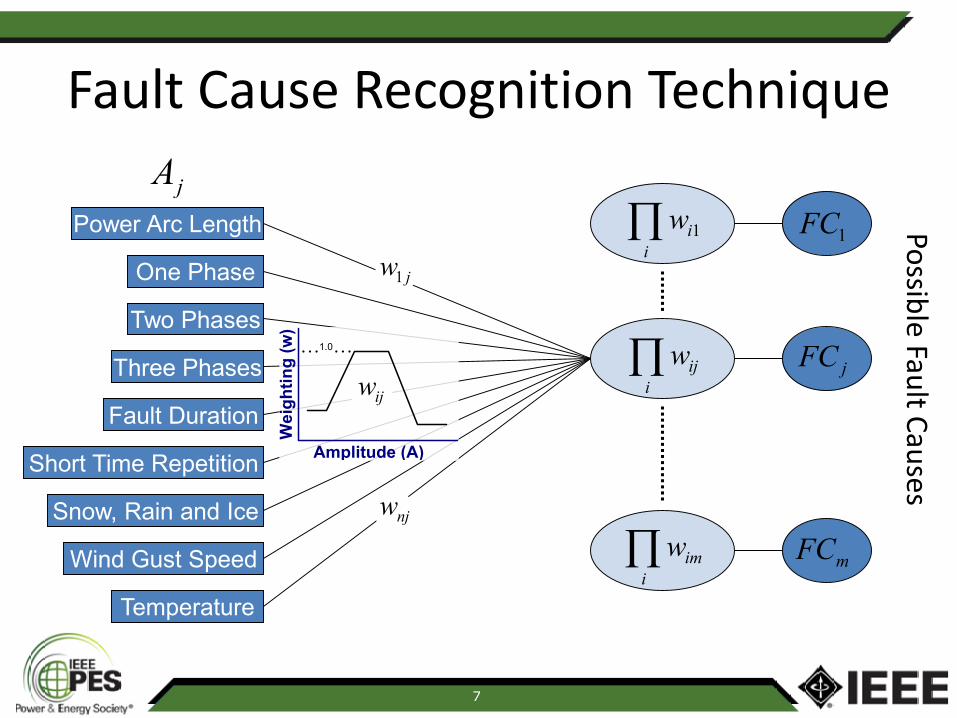
Fault Cause Recognition TechniquejA
Power Arc Length
Short Time Repetition
Snow, Rain and Ice
One Phase
Wind Gust Speed
Fault Duration
Temperature
jw1
Two Phases
Three Phases
njw
jFC
Wei
ghtin
g (w
)
Amplitude (A)
1.0
1FC
mFC
∏i
ijw
∏i
iw 1
∏i
imw
7
Possible Fault Causes
ijw

Use Case Examples
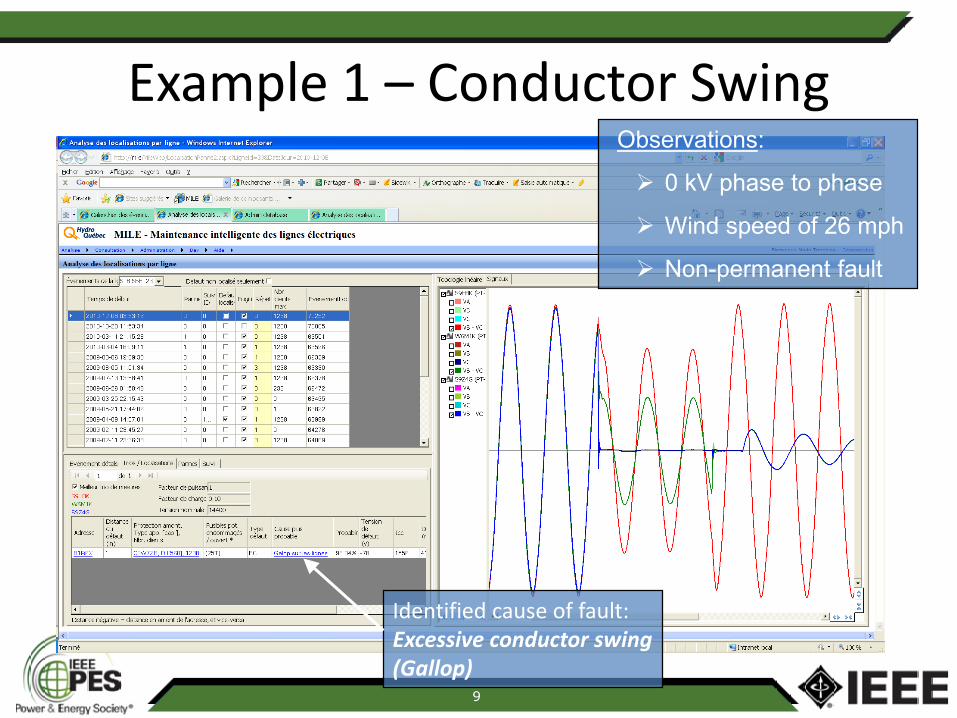
Example 1 – Conductor Swing
9
Observations:
0 kV phase to phase
Wind speed of 26 mph
Non-permanent fault
Identified cause of fault: Excessive conductor swing (Gallop)

VDFL fault location at 9 miles from substation
Substation
Google Earth EC View of the Fault
10
11
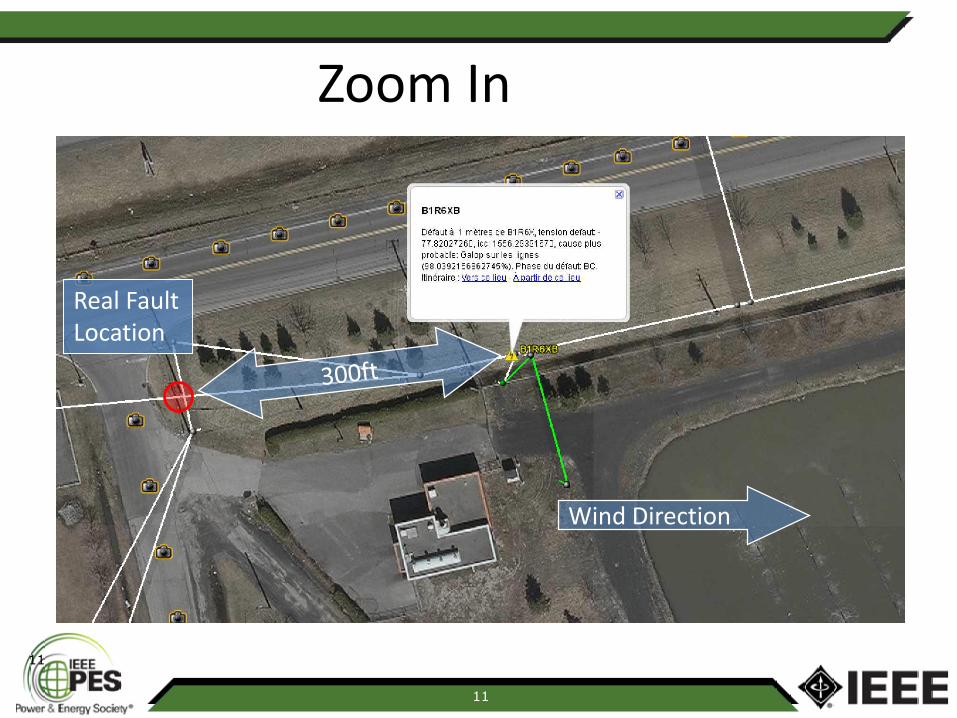
Wind Direction
Zoom In
Real Fault Location
11
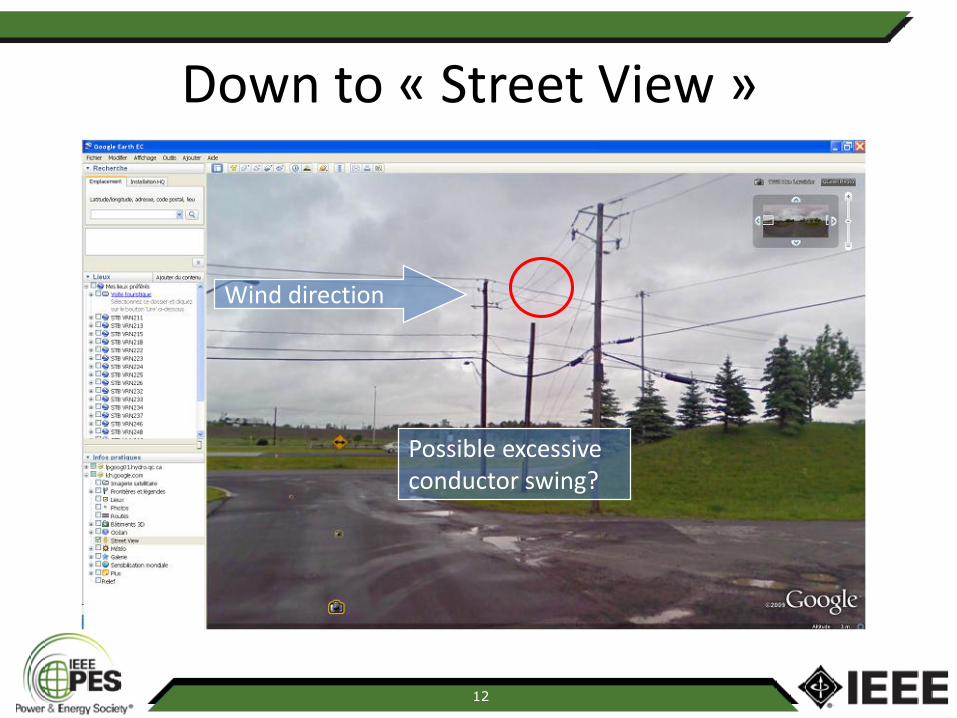
Down to « Street View »
Wind direction
Possible excessiveconductor swing?
12
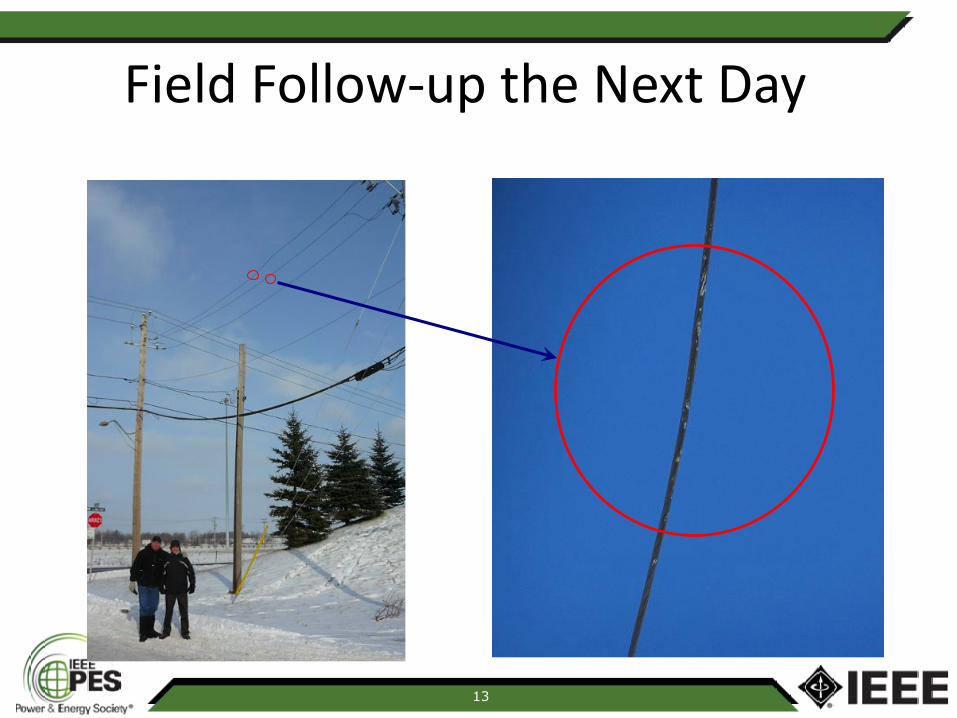
Field Follow-up the Next Day
13
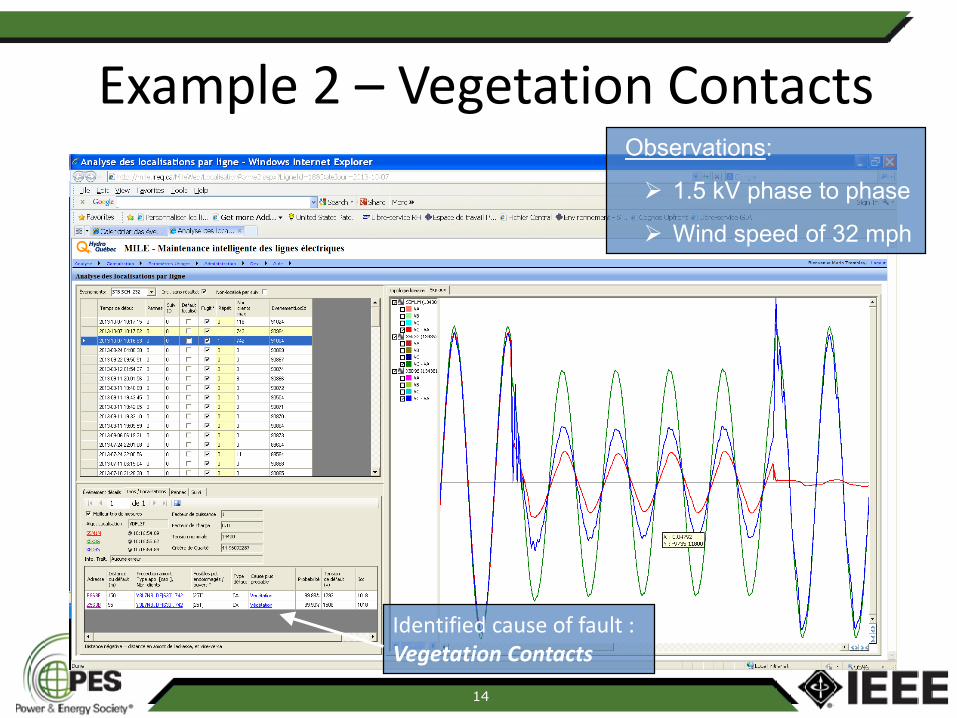
Example 2 – Vegetation ContactsObservations:
1.5 kV phase to phase
Wind speed of 32 mph
14
Identified cause of fault : Vegetation Contacts

Fault Location
VDFL fault location at 13.4 miles
Measurements
15

Zoom In
VDFL locations
Real Fault Location
Wind Direction
16
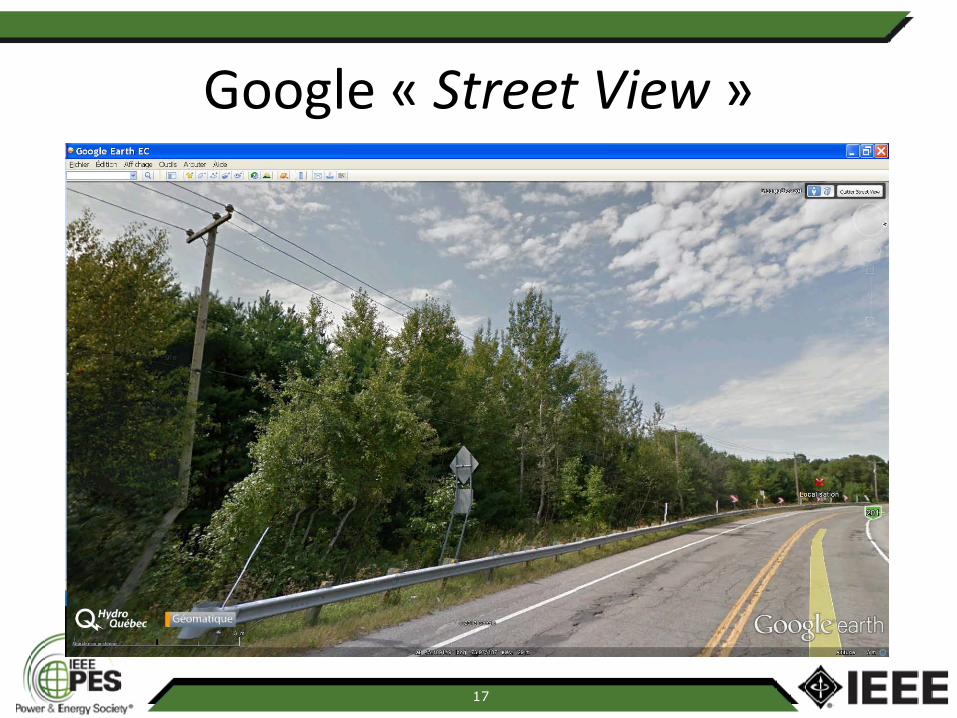
Google « Street View »
17

Picture of Fault Location
Vegetation Contacts
18
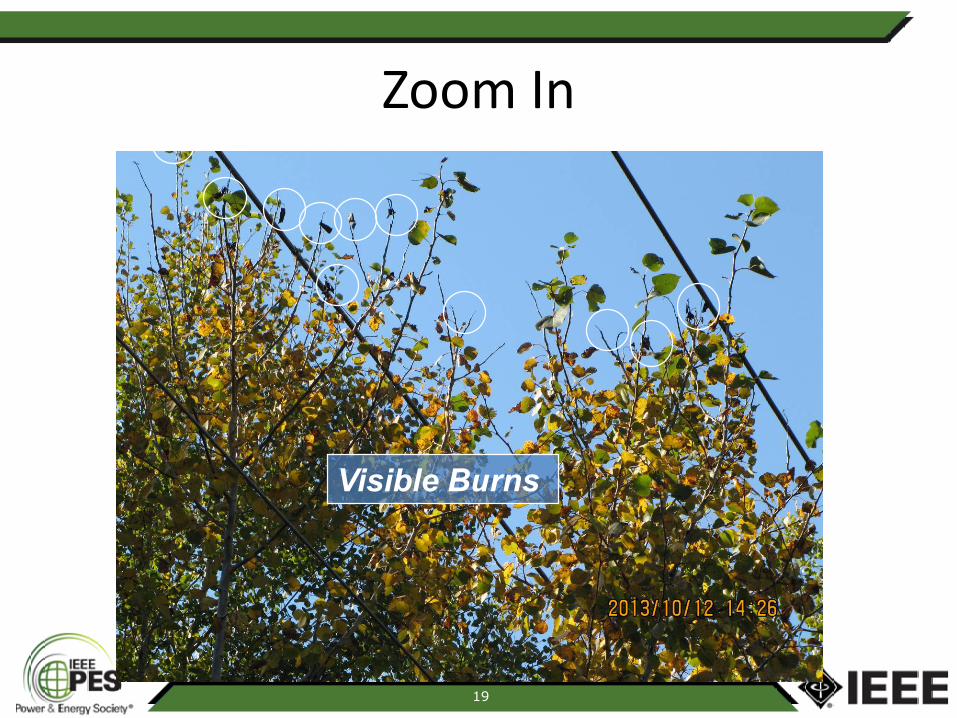
Zoom In
Visible Burns
19

Central Conductor View
20

Field Side Conductor View
21

Feeder Maintenance Use Example

HTD 236 Experience
Ranked among the worst feeders of 2006 and 2007Average of 180 outages annually
Outage frequency reduced by 51%
SAIDI index reduced by 61%
Outages of unknown causesreduced by 92%
1M$ of unnecessary investment avoided
23

Questions?


