
������������ �����
����������� ������������������

FATWIRE CORPORATION PROVIDES THIS PUBLICATION “AS IS” WITHOUT WARRANTY OF ANY KIND, EITHER EXPRESSED OR IMPLIED, INCLUDING BUT NOT LIMITED TO THE IMPLIED WARRANTIES OF MERCHANTABILITY OR FITNESS FOR A PARTICULAR PURPOSE. In no event shall FatWire be liable for any loss of profits, loss of business, loss of use of data, interruption of business, or for indirect, special, incidental, or consequential damages of any kind, even if FatWire has been advised of the possibility of such damages arising from this publication. FatWire may revise this publication from time to time without notice. Some states or jurisdictions do not allow disclaimer of express or implied warranties in certain transactions; therefore, this statement may not apply to you.
Copyright © 2009 FatWire Corporation. All rights reserved.
This product may be covered under one or more of the following U.S. patents: 4477698, 4540855, 4720853, 4742538, 4742539, 4782510, 4797911, 4894857, 5070525, RE36416, 5309505, 5511112, 5581602, 5594791, 5675637, 5708780, 5715314, 5724424, 5812776, 5828731, 5909492, 5924090, 5963635, 6012071, 6049785, 6055522, 6118763, 6195649, 6199051, 6205437, 6212634, 6279112 and 6314089. Additional patents pending.
FatWire, Content Server, Content Server Bridge Enterprise, Content Server Bridge XML, Content Server COM Interfaces, Content Server Desktop, Content Server Direct, Content Server Direct Advantage, Content Server DocLink, Content Server Engage, Content Server InSite Editor, Content Server Satellite, and Transact are trademarks or registered trademarks of FatWire Corporation in the United States and other countries.
iPlanet, Java, J2EE, Solaris, Sun, and other Sun products referenced herein are trademarks or registered trademarks of Sun Microsystems, Inc. AIX, IBM, WebSphere, and other IBM products referenced herein are trademarks or registered trademarks of IBM Corporation. WebLogic is a registered trademark of BEA Systems, Inc. Microsoft, Windows and other Microsoft products referenced herein are trademarks or registered trademarks of Microsoft Corporation. UNIX is a registered trademark of The Open Group. Any other trademarks and product names used herein may be the trademarks of their respective owners.
This product includes software developed by the Apache Software Foundation (http://www.apache.org/) and software developed by Sun Microsystems, Inc. This product contains encryption technology from Phaos Technology Corporation.
You may not download or otherwise export or reexport this Program, its Documentation, or any underlying information or technology except in full compliance with all United States and other applicable laws and regulations, including without limitations the United States Export Administration Act, the Trading with the Enemy Act, the International Emergency Economic Powers Act and any regulations thereunder. Any transfer of technical data outside the United States by any means, including the Internet, is an export control requirement under U.S. law. In particular, but without limitation, none of the Program, its Documentation, or underlying information of technology may be downloaded or otherwise exported or reexported (i) into (or to a national or resident, wherever located, of) Cuba, Libya, North Korea, Iran, Iraq, Sudan, Syria, or any other country to which the U.S. prohibits exports of goods or technical data; or (ii) to anyone on the U.S. Treasury Department’s Specially Designated Nationals List or the Table of Denial Orders issued by the Department of Commerce. By downloading or using the Program or its Documentation, you are agreeing to the foregoing and you are representing and warranting that you are not located in, under the control of, or a national or resident of any such country or on any such list or table. In addition, if the Program or Documentation is identified as Domestic Only or Not-for-Export (for example, on the box, media, in the installation process, during the download process, or in the Documentation), then except for export to Canada for use in Canada by Canadian citizens, the Program, Documentation, and any underlying information or technology may not be exported outside the United States or to any foreign entity or “foreign person” as defined by U.S. Government regulations, including without limitation, anyone who is not a citizen, national, or lawful permanent resident of the United States. By using this Program and Documentation, you are agreeing to the foregoing and you are representing and warranting that you are not a “foreign person” or under the control of a “foreign person.”
FatWire Analytics Developer’s TutorialDocument Revision Date: Jun. 26, 2009Product Version: 2.5
FatWire Technical Supportwww.fatwire.com/Support
FatWire HeadquartersFatWire Corporation330 Old Country RoadSuite 207Mineola, NY 11501www.fatwire.com
3
Table of
Contents
Introduction . . . . . . . . . . . . . . . . . . . . . . . . . . . . . . . . . . . . . . . . . . . . . . . . . . . . 5About This Tutorial . . . . . . . . . . . . . . . . . . . . . . . . . . . . . . . . . . . . . . . . . . . . . . . . . . . . . . 6
The ‘NewBrowsers’ Report . . . . . . . . . . . . . . . . . . . . . . . . . . . . . . . . . . . . . . . . . . . . . 6Prerequisites. . . . . . . . . . . . . . . . . . . . . . . . . . . . . . . . . . . . . . . . . . . . . . . . . . . . . . . . . . . . . 7Quick Reference . . . . . . . . . . . . . . . . . . . . . . . . . . . . . . . . . . . . . . . . . . . . . . . . . . . . . . . . . 8
Exercise 1: Adding a New Parameter . . . . . . . . . . . . . . . . . . . . . . . . . . . . . . . . . . . . . . 8Exercise 2: Developing a New Analytics Job . . . . . . . . . . . . . . . . . . . . . . . . . . . . . . . 9Exercise 3: Creating and Configuring a Report . . . . . . . . . . . . . . . . . . . . . . . . . . . . . . 9
1 Adding a New Parameter. . . . . . . . . . . . . . . . . . . . . . . . . . . . . . . . . . . . . . . . . 11Overview . . . . . . . . . . . . . . . . . . . . . . . . . . . . . . . . . . . . . . . . . . . . . . . . . . . . . . . . . . . . . 12Adding the New Parameter to the Image Tag and Its JSP. . . . . . . . . . . . . . . . . . . . . . . . . 12Next Steps . . . . . . . . . . . . . . . . . . . . . . . . . . . . . . . . . . . . . . . . . . . . . . . . . . . . . . . . . . . . . 16
2 Developing a New Analytics Job . . . . . . . . . . . . . . . . . . . . . . . . . . . . . . . . . . 17Overview for Creating an Analytics Job . . . . . . . . . . . . . . . . . . . . . . . . . . . . . . . . . . . . . 18
Example for Developing a New Analytics Job . . . . . . . . . . . . . . . . . . . . . . . . . . . . . 20Developing an Analytics Job for the ‘NewBrowsers’ Report. . . . . . . . . . . . . . . . . . . 21Configuring Database Injection . . . . . . . . . . . . . . . . . . . . . . . . . . . . . . . . . . . . . . . . . 29Integrating the New Analytics Job with the Existing Hadoop-Jobs Component . . . . 31
Next Steps. . . . . . . . . . . . . . . . . . . . . . . . . . . . . . . . . . . . . . . . . . . . . . . . . . . . . . . . . . . . . 31
3 Creating and Configuring a Report . . . . . . . . . . . . . . . . . . . . . . . . . . . . . . . . 33Report Design . . . . . . . . . . . . . . . . . . . . . . . . . . . . . . . . . . . . . . . . . . . . . . . . . . . . . . . . . . 34
‘NewBrowsers’ Report Code . . . . . . . . . . . . . . . . . . . . . . . . . . . . . . . . . . . . . . . . . . . 36Creating the ‘NewBrowsers’ Report . . . . . . . . . . . . . . . . . . . . . . . . . . . . . . . . . . . . . . . . 40
Creating and Registering the Report File . . . . . . . . . . . . . . . . . . . . . . . . . . . . . . . . . . 40Adding a Table . . . . . . . . . . . . . . . . . . . . . . . . . . . . . . . . . . . . . . . . . . . . . . . . . . . . . . 45Adding a Time Period Selector . . . . . . . . . . . . . . . . . . . . . . . . . . . . . . . . . . . . . . . . . 50Adding a Filter . . . . . . . . . . . . . . . . . . . . . . . . . . . . . . . . . . . . . . . . . . . . . . . . . . . . . . 53
FatWire Analytics 2.5 Developer’s Tutorial

Table of Contents4
Adding a Chart . . . . . . . . . . . . . . . . . . . . . . . . . . . . . . . . . . . . . . . . . . . . . . . . . . . . . . 57Testing the Completed ‘NewBrowsers’ Report . . . . . . . . . . . . . . . . . . . . . . . . . . . . . 61
FatWire Analytics 2.5 Developer’s Tutorial
5
Introduction
This chapter contains the following sections:
• About This Tutorial
• Prerequisites
• Quick Reference
FatWire Analytics 2.5 Developer’s Tutorial
Introduction
About This Tutorial6
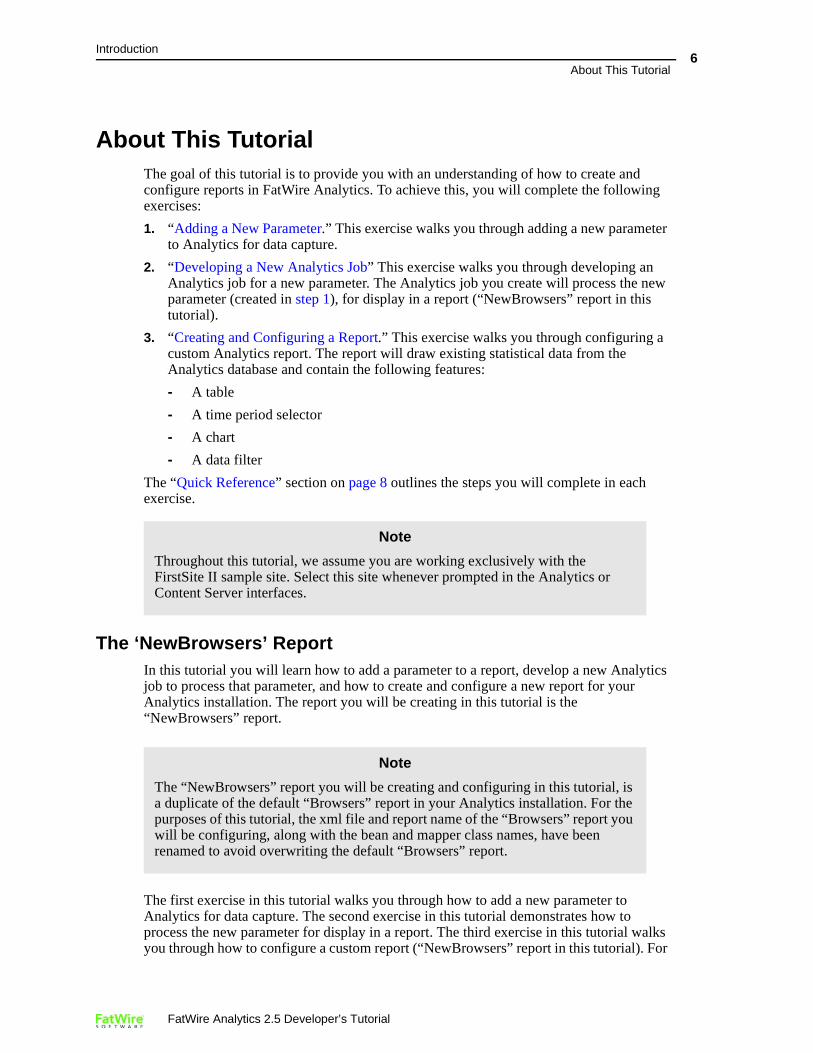
About This TutorialThe goal of this tutorial is to provide you with an understanding of how to create and configure reports in FatWire Analytics. To achieve this, you will complete the following exercises:
1. “Adding a New Parameter.” This exercise walks you through adding a new parameter to Analytics for data capture.
2. “Developing a New Analytics Job” This exercise walks you through developing an Analytics job for a new parameter. The Analytics job you create will process the new parameter (created in step 1), for display in a report (“NewBrowsers” report in this tutorial).
3. “Creating and Configuring a Report.” This exercise walks you through configuring a custom Analytics report. The report will draw existing statistical data from the Analytics database and contain the following features:
- A table
- A time period selector
- A chart
- A data filter
The “Quick Reference” section on page 8 outlines the steps you will complete in each exercise.
The ‘NewBrowsers’ ReportIn this tutorial you will learn how to add a parameter to a report, develop a new Analytics job to process that parameter, and how to create and configure a new report for your Analytics installation. The report you will be creating in this tutorial is the “NewBrowsers” report.
The first exercise in this tutorial walks you through how to add a new parameter to Analytics for data capture. The second exercise in this tutorial demonstrates how to process the new parameter for display in a report. The third exercise in this tutorial walks you through how to configure a custom report (“NewBrowsers” report in this tutorial). For
Note
Throughout this tutorial, we assume you are working exclusively with the FirstSite II sample site. Select this site whenever prompted in the Analytics or Content Server interfaces.
Note
The “NewBrowsers” report you will be creating and configuring in this tutorial, is a duplicate of the default “Browsers” report in your Analytics installation. For the purposes of this tutorial, the xml file and report name of the “Browsers” report you will be configuring, along with the bean and mapper class names, have been renamed to avoid overwriting the default “Browsers” report.
FatWire Analytics 2.5 Developer’s Tutorial
Introduction
Prerequisites7
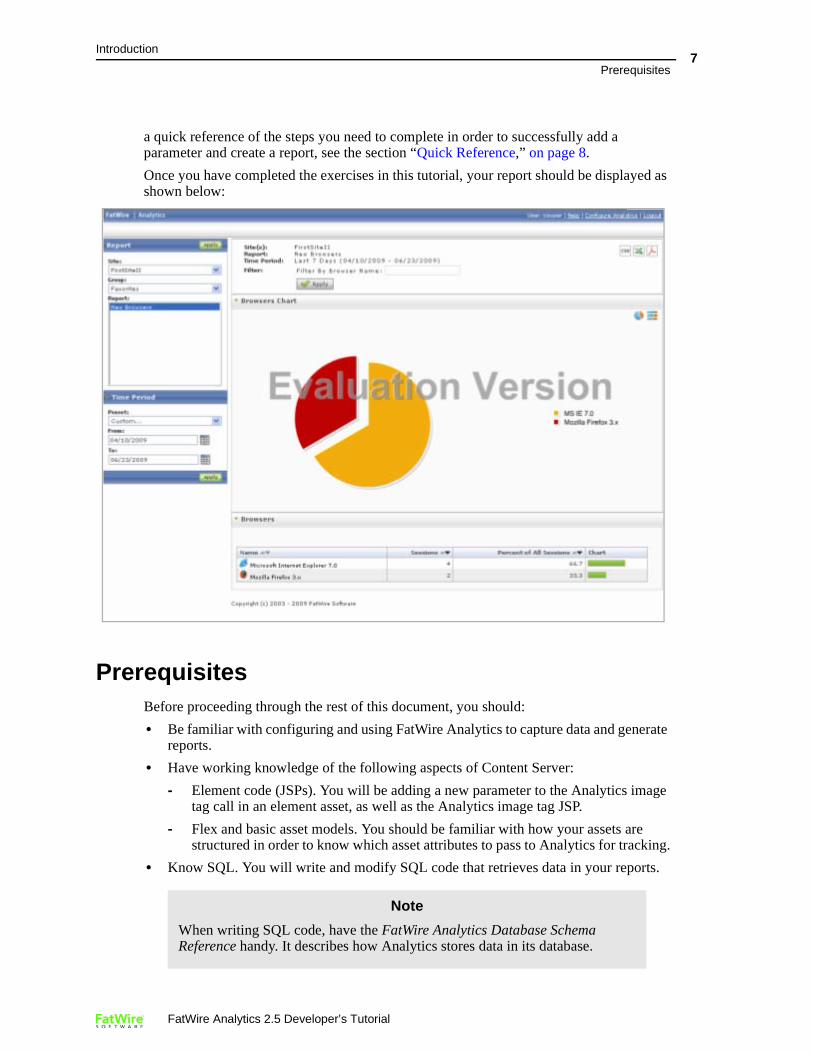
a quick reference of the steps you need to complete in order to successfully add a parameter and create a report, see the section “Quick Reference,” on page 8.
Once you have completed the exercises in this tutorial, your report should be displayed as shown below:
PrerequisitesBefore proceeding through the rest of this document, you should:
• Be familiar with configuring and using FatWire Analytics to capture data and generate reports.
• Have working knowledge of the following aspects of Content Server:
- Element code (JSPs). You will be adding a new parameter to the Analytics image tag call in an element asset, as well as the Analytics image tag JSP.
- Flex and basic asset models. You should be familiar with how your assets are structured in order to know which asset attributes to pass to Analytics for tracking.
• Know SQL. You will write and modify SQL code that retrieves data in your reports.
Note
When writing SQL code, have the FatWire Analytics Database Schema Reference handy. It describes how Analytics stores data in its database.
FatWire Analytics 2.5 Developer’s Tutorial
Introduction
Quick Reference8
• Know XML. Analytics reports are built with XML tags that define report features.
• Have the following documentation handy in case you need to refer to it when completing the exercises:
- Installing and Configuring Analytics
- FatWire Analytics User’s Guide
• Be familiar with the basics of the Hadoop Distributed File System and how to create Hadoop Map/Reduce jobs.
Quick ReferenceFor your reference, the steps you will follow in each exercise are outlined below.
Exercise 1: Adding a New ParameterIn Exercise 1, “Adding a New Parameter,” you will add a new parameter to Analytics so Analytics can start capturing data on that parameter. The steps are:
1. Modify the Analytics image tag and its JSP to trigger data capture for the new parameter, as explained in “Adding the New Parameter to the Image Tag and Its JSP,” on page 12.
2. The next step in this tutorial is to develop a new Analytics job. Before you start the next exercise, click around in your FSII site to create data for the new Analytics job (you will be developing) to process. Make sure that your Analytics sensor, Hadoop, and HDFS Agent are running before you proceed to Exercise 2: Developing a New Analytics Job.
Note
When writing report code, have the FatWire Analytics Tag Reference handy. It contains descriptions of the XML tags you will use when coding your reports, as well as the parameters they take.
Note
For more information about Hadoop Distributed File Systems and how to cre-ate Map/Reduce jobs, refer to the following website:
http://hadoop.apache.org/core/docs/current/mapred_tutorial.html
FatWire Analytics 2.5 Developer’s Tutorial
Introduction
Quick Reference9
Exercise 2: Developing a New Analytics JobIn Exercise 2, “Developing a New Analytics Job, you will be developing an analytics job to process the raw data that the new parameter captures. The steps are:
1. Develop a new Analytics job. In this example we use the “NewBrowsers” report (which you will create in Exercise 3: Creating and Configuring a Report). The new job enables Analytics to process raw data captured from the given site. The processed data will then be inserted into the database. For instructions, see “Developing an Analytics Job for the ‘NewBrowsers’ Report,” on page 21. The steps are outlined below:
a. Select the location that will be used as the input data for the report. For instructions, see “1. Select the Input Location,” on page 21.
b. Add a new L3 table to store the processed data. For instructions, see “2. Extend the Schema,” on page 21.
c. Create a new bean class which will store the output data. For instructions, see “3. Create the Beans,” on page 21.
d. Create a new mapper class which will encapsulate the business logic to process the input data for the report. For instructions, see “4. Create the Mapper Classes,” on page 25.
e. Configure the processor to integrate the bean and mapper classes. For instructions, see “5. Adding Beans and Mappers to the Processor Definitions,” on page 26.
2. Create and configure the “NewBrowsers” report, which will include the new parameter you create in this exercise. For instructions, see Exercise 3, “Creating and Configuring a Report”.
Exercise 3: Creating and Configuring a ReportIn Exercise 3, “Creating and Configuring a Report,” you will create, from scratch, a “NewBrowsers” report, by completing the following steps:
1. Create a new report file and register it with Analytics as explained in “Creating and Registering the Report File,” on page 40” and outlined below:
a. Create the XML file that will contain the report code. For instructions, see “A. Create the XML File,” on page 41.
b. Place the file in the Analytics reports directory so that Analytics can access the file. For instructions, see “B. Place the XML File in the Analytics Reports Directory,” on page 41.
c. Label the report components, such as module captions, column heads, and so on by defining them in a property file and registering the file with Analytics, as explained in “C. Label the Report Components,” on page 41.
Note
The “NewBrowsers” report you will be creating in this tutorial, is a duplicate of the default “Browsers” report in your Analytics installation. For the purposes of this tutorial, the xml file and report name of the “Browsers” report you will be configuring, along with the bean and mapper class names, have been renamed to avoid overwriting the default report.
FatWire Analytics 2.5 Developer’s Tutorial
Introduction
Quick Reference10
d. Make the report available to Analytics users, as explained in “D. Make the Report Available to Analytics Users,” on page 42.
e. Test the report, as explained in “E. Test the New Report,” on page 44 to make sure it has been coded correctly.
2. Add a table, as explained in “Adding a Table,” on page 45. A table is the primary method of presenting statistical data in an Analytics report.
3. Add a time period selector, as explained in “Adding a Time Period Selector,” on page 50. The selector allows users to restrict the statistical data displayed in the report to a specific time period.
4. Add a data filter, as explained in “Adding a Filter,” on page 53. Filters allow users to restrict the statistical data displayed in the report to specific parameter values. A separate filter is required for each parameter against which you want to filter data.
5. Add a chart, as explained in “Adding a Chart,” on page 57. Charts allow you to visually present statistical data in a report.
6. Test your completed “Visitor Detail” report. At this point, you should have a complete, functional report, as shown in “Testing the Completed ‘NewBrowsers’ Report,” on page 61.
FatWire Analytics 2.5 Developer’s Tutorial
11
Exercise 1
Adding a New Parameter
This exercise shows you how to add a new parameter to Analytics for data capture.
This exercise contains the following sections:
• Overview
• Adding the New Parameter to the Image Tag and Its JSP
• Next Steps
FatWire Analytics 2.5 Developer’s Tutorial
Exercise 1. Adding a New Parameter
Overview12
OverviewIn this exercise, based on the FirstSite II sample site, you will configure Analytics to start capturing data on a new parameter, agent. Once you add the new agent parameter to Analytics, proceed to the next exercise (“Developing a New Analytics Job”) in order to process the new parameter for display in a report (“NewBrowsers” report in this tutorial). The processed agent parameter will be displayed as a table column in the “NewBrowsers” report.
The new agent parameter is used for capturing raw data about the browsers used by visitors of your site. This raw data is then processed, and the processed data is then displayed in the “NewBrowsers” report (which you will be creating in Exercise 3, “Creating and Configuring a Report").
Adding the New Parameter to the Image Tag and Its JSP
The first step is to make Analytics aware of the new parameter so that it starts capturing data on that parameter. In our example, you will do so by adding the parameter to the Analytics image tag inside the FSIIWrapper element and to AddAnalyticsImgTag JSP. When you complete the steps below, the sensor servlet will start capturing the parameter values and storing them as raw data.
1. Add the new parameter to the Analytics image tag call in the FSIIWrapper element:
a. Log in to the Advanced interface on your Content Server system as an administrator or another user who has the permissions to edit “CSElement” assets.
b. When prompted, select the FirstSite II sample site.
c. In the button bar, click Search.
d. In the list of asset types, click Find CSElement.
e. In the “Search” form, enter FSIIWrapper into the search field and click Search.
f. In the list of results, click the Edit (pencil) icon next to the FSIIWrapper asset.
Content Server displays the “FSIIWrapper” asset in the “Edit” form.
g. In the section selector at the top of the form, click Element.
Content Server displays the “Element” section of the “Edit” form.
h. To make editing the element code easier, select all of the text in the Element Logic field, then copy and paste it into a text editor of your choice. Save the code to a temporary file.
Note
Throughout this exercise, we assume you are working exclusively with the FirstSite II sample site. Select this site whenever prompted in the Analytics or Content Server interfaces.
FatWire Analytics 2.5 Developer’s Tutorial
Exercise 1. Adding a New Parameter
Adding the New Parameter to the Image Tag and Its JSP13
1) In the element code, locate the call to the Analytics image tag, shown below:
2) Insert the following statement at the end of the Analytics image tag call, but before the closing </render:callelement> tag:
The modified Analytics image tag call should look as follows:
3) Save and close the file.
2. Add the new parameter to the Analytics image tag JSP.
a. Start Content Server Explorer.
b. In the Content Server Explorer screen, select File > Open Content Server to display the “Content Server Login” dialog box.
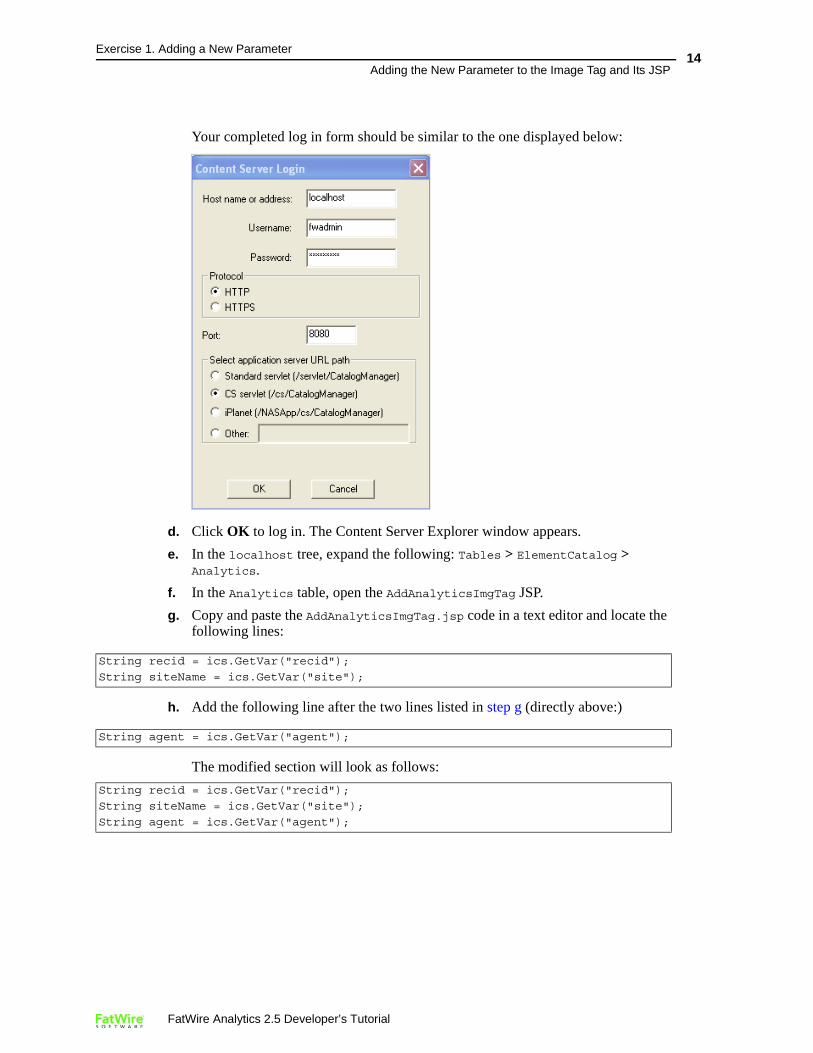
c. Enter the following values:
- Host name or address – The host name or IP address. You must not leave this blank.
- Username – Your Content Server user name.
- Password – Your Content Server password.
- Port – The port number (the default is 8080).
- Protocol – Typically, this is HTTP. (You may select HTTPS if the web server is running SSL).
- Application server URL path – Select the CS servlet (/cs/CatalogManager) option.
<render:callelement elementname="Analytics/AddAnalyticsImgTag">
<render:argument name="c" value=’<%=ics.GetVar("c")%>’/>
<render:argument name="cid" value=’<%=ics.GetVar("cid")%>’/>
<render:argument name="site" value=’<%=ics.GetVar("site")%>’/>
<render:argument name="pagename" value=’<%=ics.GetVar("childpagename")%>’/>
<render:argument name="recid" value=’<%=ics.GetVar("recid")%>’/>
</render:callelement>
<render:argument name="agent" value=’<%= request.getHeader("User-Agent")%>’/>
Note
The agent variable must be set before the Analytics image tag is called.
<render:callelement elementname="Analytics/AddAnalyticsImgTag">
<render:argument name="c" value=’<%=ics.GetVar("c")%>’/>
<render:argument name="cid" value=’<%=ics.GetVar("cid")%>’/>
<render:argument name="site" value=’<%=ics.GetVar("site")%>’/>
<render:argument name="pagename" value=’<%=ics.GetVar("childpagename")%>’/>
<render:argument name="recid" value=’<%=ics.GetVar("recid")%>’/>
<render:argument name="agent" value=’<%= request.getHeader( "User-Agent" )
%>’/>
</render:callelement>
FatWire Analytics 2.5 Developer’s Tutorial
Exercise 1. Adding a New Parameter
Adding the New Parameter to the Image Tag and Its JSP14
Your completed log in form should be similar to the one displayed below:
d. Click OK to log in. The Content Server Explorer window appears.
e. In the localhost tree, expand the following: Tables > ElementCatalog > Analytics.
f. In the Analytics table, open the AddAnalyticsImgTag JSP.
g. Copy and paste the AddAnalyticsImgTag.jsp code in a text editor and locate the following lines:
h. Add the following line after the two lines listed in step g (directly above:)
The modified section will look as follows:
String recid = ics.GetVar("recid");
String siteName = ics.GetVar("site");
String agent = ics.GetVar("agent");
String recid = ics.GetVar("recid");
String siteName = ics.GetVar("site");
String agent = ics.GetVar("agent");
FatWire Analytics 2.5 Developer’s Tutorial
Exercise 1. Adding a New Parameter
Adding the New Parameter to the Image Tag and Its JSP15
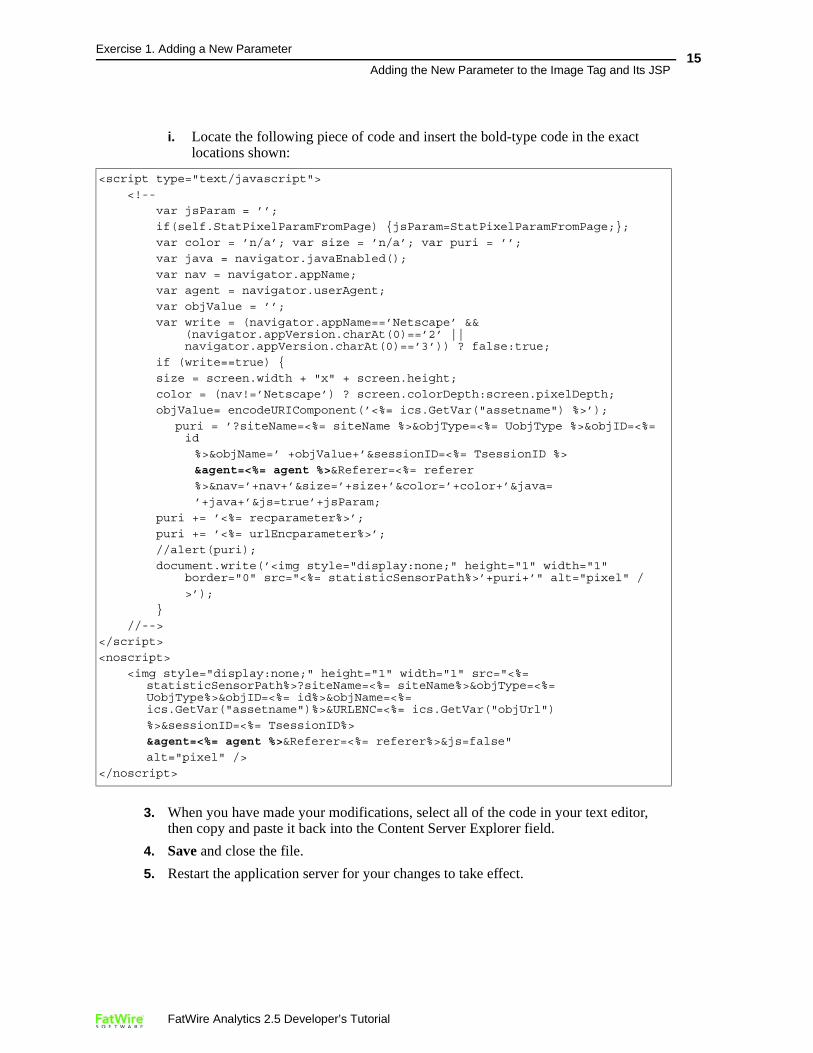
i. Locate the following piece of code and insert the bold-type code in the exact locations shown:
3. When you have made your modifications, select all of the code in your text editor, then copy and paste it back into the Content Server Explorer field.
4. Save and close the file.
5. Restart the application server for your changes to take effect.
<script type="text/javascript">
<!--
var jsParam = ’’;
if(self.StatPixelParamFromPage) {jsParam=StatPixelParamFromPage;};
var color = ’n/a’; var size = ’n/a’; var puri = ’’;
var java = navigator.javaEnabled();
var nav = navigator.appName;
var agent = navigator.userAgent;
var objValue = ’’;
var write = (navigator.appName==’Netscape’ && (navigator.appVersion.charAt(0)==’2’ || navigator.appVersion.charAt(0)==’3’)) ? false:true;
if (write==true) {
size = screen.width + "x" + screen.height;
color = (nav!=’Netscape’) ? screen.colorDepth:screen.pixelDepth;
objValue= encodeURIComponent(’<%= ics.GetVar("assetname") %>’);
puri = ’?siteName=<%= siteName %>&objType=<%= UobjType %>&objID=<%= id
%>&objName=’ +objValue+’&sessionID=<%= TsessionID %>
&agent=<%= agent %>&Referer=<%= referer
%>&nav=’+nav+’&size=’+size+’&color=’+color+’&java=
’+java+’&js=true’+jsParam;
puri += ’<%= recparameter%>’;
puri += ’<%= urlEncparameter%>’;
//alert(puri);
document.write(’<img style="display:none;" height="1" width="1" border="0" src="<%= statisticSensorPath%>’+puri+’" alt="pixel" /
>’);
}
//-->
</script>
<noscript>
<img style="display:none;" height="1" width="1" src="<%= statisticSensorPath%>?siteName=<%= siteName%>&objType=<%= UobjType%>&objID=<%= id%>&objName=<%= ics.GetVar("assetname")%>&URLENC=<%= ics.GetVar("objUrl")
%>&sessionID=<%= TsessionID%>
&agent=<%= agent %>&Referer=<%= referer%>&js=false"
alt="pixel" />
</noscript>
FatWire Analytics 2.5 Developer’s Tutorial
Exercise 1. Adding a New Parameter
Next Steps16
Next StepsIn Exercise 2, “Developing a New Analytics Job", you will create a new analytics job to process the raw data that is captured by the new agent parameter you added in this exercise. The new analytics job will process the agent parameter for display in a report (“NewBrowsers” report in this tutorial). The processed agent parameter will be displayed as a table column in the “NewBrowsers” report.
Before you develop a new Analytics job, keep in mind that:
In order for the new parameter to start capturing data for Analytics, the following components must be installed and running:
• Analytics Sensor
• Hadoop
• HDFS Agent
Note
Before developing a new Analytics job, click around in your FSII site. This ensures that there will be data for the new Analytics job (you will be developing in the next exercise) to process.
FatWire Analytics 2.5 Developer’s Tutorial
17
Exercise 2
Developing a New Analytics Job
In order for Analytics to process raw data for a custom report, you must develop a new Analytics job to process that data. The processed data will be inserted into the database.
This exercise contains the following sections:
• Overview for Creating an Analytics Job
• Next Steps
Note
This exercise walks you through how to develop a new Analytics job, for the parameter you added (in Exercise 1) to your Analytics installation. The Analytics job you will be developing is a duplicate of the default Analytics job in your Analytics installation. For the purposes of this tutorial, all bean and mapper class names, used to develop the Analytics job in this exercise have been renamed to avoid overwriting the default Analytics job.
FatWire Analytics 2.5 Developer’s Tutorial
Exercise 2. Developing a New Analytics Job
Overview for Creating an Analytics Job18
Overview for Creating an Analytics JobThe following is a brief description of the steps that are required for developing an Analytics job.
1. Select the most appropriate location as the input:
Select a location from the folders within the analytics directory, which must be used by the analytics job as input data for the report. The criteria for choosing a particular location as an input depends primarily on the data required for a particular report. In most instances, the following locations are sufficient for satisfying the data requirements for your report.
- Sesdata: This location stores the data for all sessions, along with the details of the visitor, object impressions, and other relevant information associated with a session.
2. Extend the schema:
To store the processed data, you will add a new L3 table to the Analytics database.
3. Create a new bean class:
The main purpose of the bean class is to store the output data. The framework will use the bean class to store the final output of the job. The database injection processors will take the data stored within each bean class and insert the data into the L3 table (created in the previous step).
The new bean class extends the pre-defined classes provided by the framework. Implementation details are explained on the following pages: page 20 (“Example for Developing a New Analytics Job”) and page 21 (“Developing an Analytics Job for the ‘NewBrowsers’ Report”)
4. Create a new Mapper class:
The Mapper class will encapsulate the business logic to process the input data. For every input bean, the Mapper class will create a new instance of the bean class (created in step 3), and then store the processed data in the newly created instance. The output of the Mapper class will be collected by the Analytics framework and further processed before it is finally written to the designated output location.
The new Mapper class will extend the pre-defined classes provided by the framework. The implementation details will be explained in the next section.
Note
When creating a custom report, do not use the injected folders (such as oiinjected, sesinjected, or visinjected) as your input location(s), because the data stored within these locations is used by the database injection processor to store into the database.
For more information about locations and processors, and which type of data is stored in each location, see the Locations & Processors section of the Installing and Configuring Analytics guide.
FatWire Analytics 2.5 Developer’s Tutorial
Exercise 2. Developing a New Analytics Job
Overview for Creating an Analytics Job19
5. Configuring the processor
To integrate your newly coded beans and Mapper classes with the Analytics framework, you need to add them to the existing processor configuration file (.xml file).
Figure 1 depicts the job execution flow with the custom mapper integrated into the Analytics-Hadoop job framework.
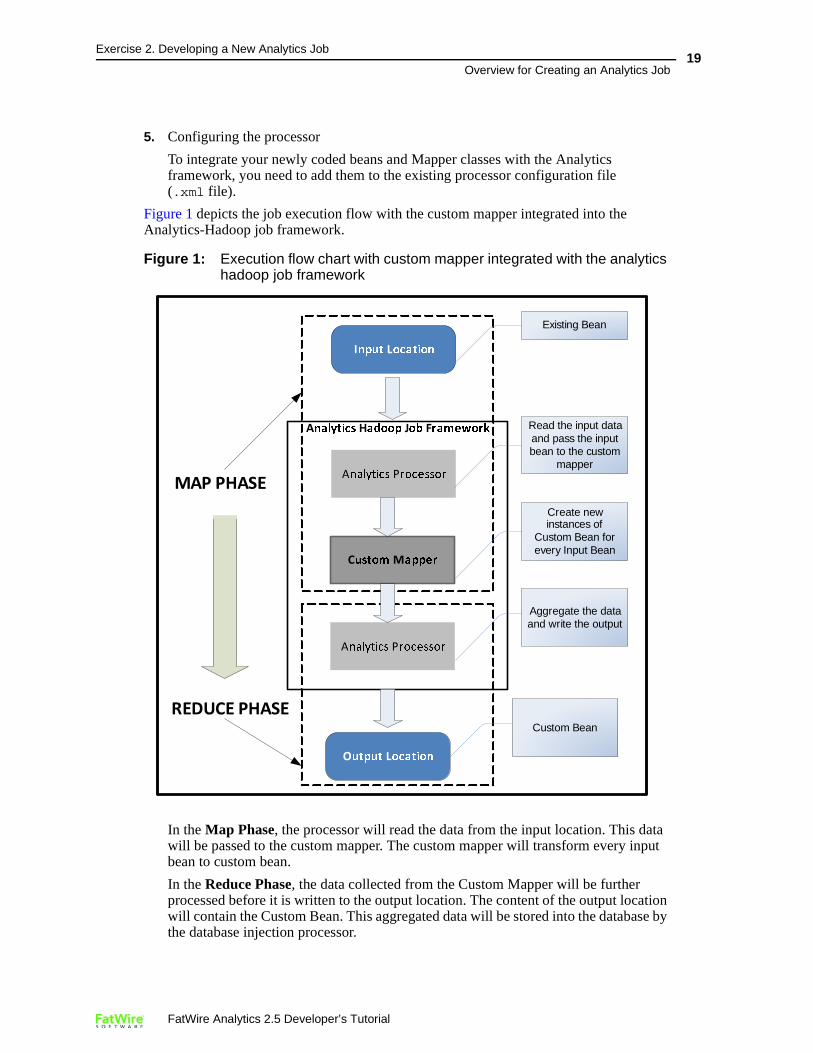
Figure 1: Execution flow chart with custom mapper integrated with the analytics hadoop job framework
In the Map Phase, the processor will read the data from the input location. This data will be passed to the custom mapper. The custom mapper will transform every input bean to custom bean.
In the Reduce Phase, the data collected from the Custom Mapper will be further processed before it is written to the output location. The content of the output location will contain the Custom Bean. This aggregated data will be stored into the database by the database injection processor.
� ��
� ��
� ��
� ��
� ��
� � � ��
� ��� ����
�������
Existing Bean
Read the input data and pass the input bean to the custom
mapper
Create new instances of
Custom Bean for every Input Bean
Aggregate the data and write the output
Custom Bean
FatWire Analytics 2.5 Developer’s Tutorial
Exercise 2. Developing a New Analytics Job
Overview for Creating an Analytics Job20
Example for Developing a New Analytics Job• Designing the ‘NewBrowsers’ Report
• Developing an Analytics Job for the ‘NewBrowsers’ Report
• Configuring Database Injection
• Integrating the New Analytics Job with the Existing Hadoop-Jobs Component
Designing the ‘NewBrowsers’ ReportThe “NewBrowsers” report identifies the browsers that visitors used to access a given site’s page view within the reported time period.
Counting browsers is simply counting the sessions for each browser. We simply sum up the aggregated values on sessions. Aggregating sums for all possible time ranges that users can select results in too many aggregated values, so we concentrate on daily sums.
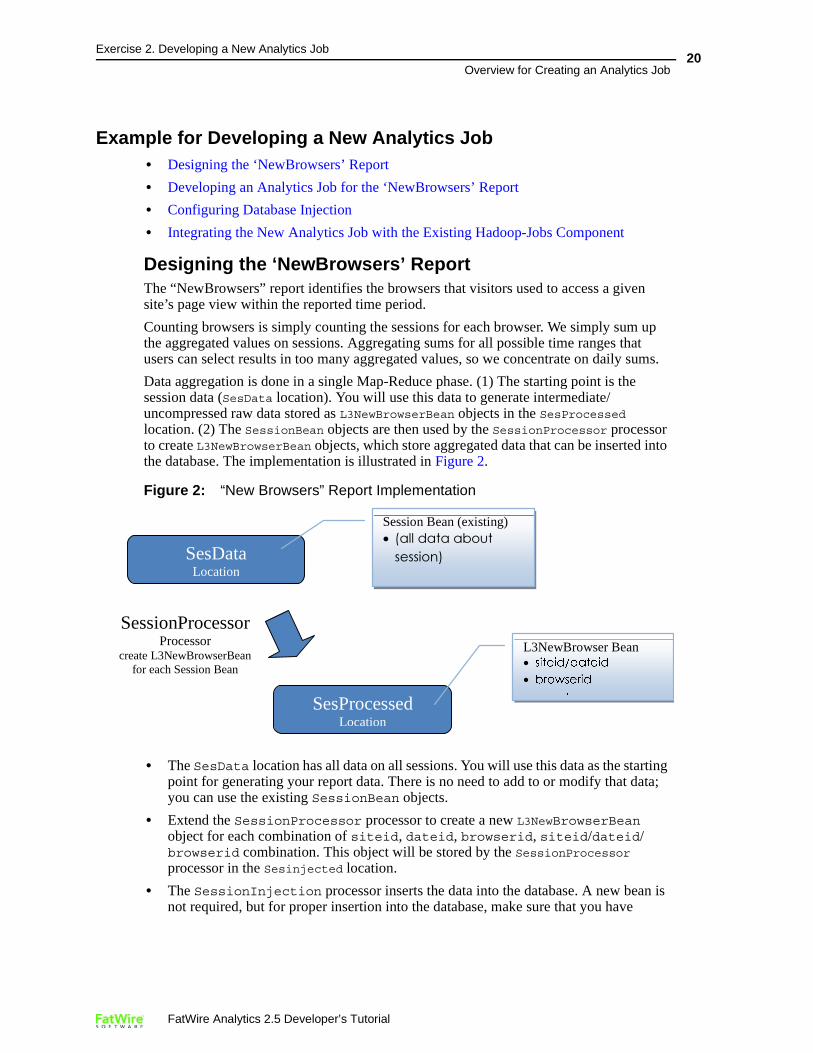
Data aggregation is done in a single Map-Reduce phase. (1) The starting point is the session data (SesData location). You will use this data to generate intermediate/uncompressed raw data stored as L3NewBrowserBean objects in the SesProcessed location. (2) The SessionBean objects are then used by the SessionProcessor processor to create L3NewBrowserBean objects, which store aggregated data that can be inserted into the database. The implementation is illustrated in Figure 2.
Figure 2: “New Browsers” Report Implementation
• The SesData location has all data on all sessions. You will use this data as the starting point for generating your report data. There is no need to add to or modify that data; you can use the existing SessionBean objects.
• Extend the SessionProcessor processor to create a new L3NewBrowserBean object for each combination of siteid, dateid, browserid, siteid/dateid/browserid combination. This object will be stored by the SessionProcessor processor in the Sesinjected location.
• The SessionInjection processor inserts the data into the database. A new bean is not required, but for proper insertion into the database, make sure that you have
SessionProcessor Processor
create L3NewBrowserBean for each Session Bean
SesData Location
Session Bean (existing) • ������������������ ���
SesProcessed Location
L3NewBrowser Bean • ��������������• �������
�
FatWire Analytics 2.5 Developer’s Tutorial
Exercise 2. Developing a New Analytics Job
Overview for Creating an Analytics Job21
properly annotated the fields of the L3 Bean (created in the SessionProcessor) with the Aggregator.
Developing an Analytics Job for the ‘NewBrowsers’ ReportFollow the general steps, as described in the above section, for developing an Analytics Job.
1. Select the Input Location
2. Extend the Schema
3. Create the Beans
4. Create the Mapper Classes
5. Adding Beans and Mappers to the Processor Definitions
1. Select the Input LocationIn the “NewBrowsers” report you are aggregating data on a session, so the input location should be the sesdata location.
2. Extend the SchemaTo store the data, you will need to add a new table to store the pre-aggregated L3 data. Execute the following SQL statement as the analytics user:
CREATE TABLE L3_DATEXSITEXNEWBROWSERXCOUNT ( DATEID NUMBER NOT NULL , SITEID NUMBER(6) , BROWSERID NUMBER , COUNT NUMBER);commit;
3. Create the BeansFor this report, one bean is required:
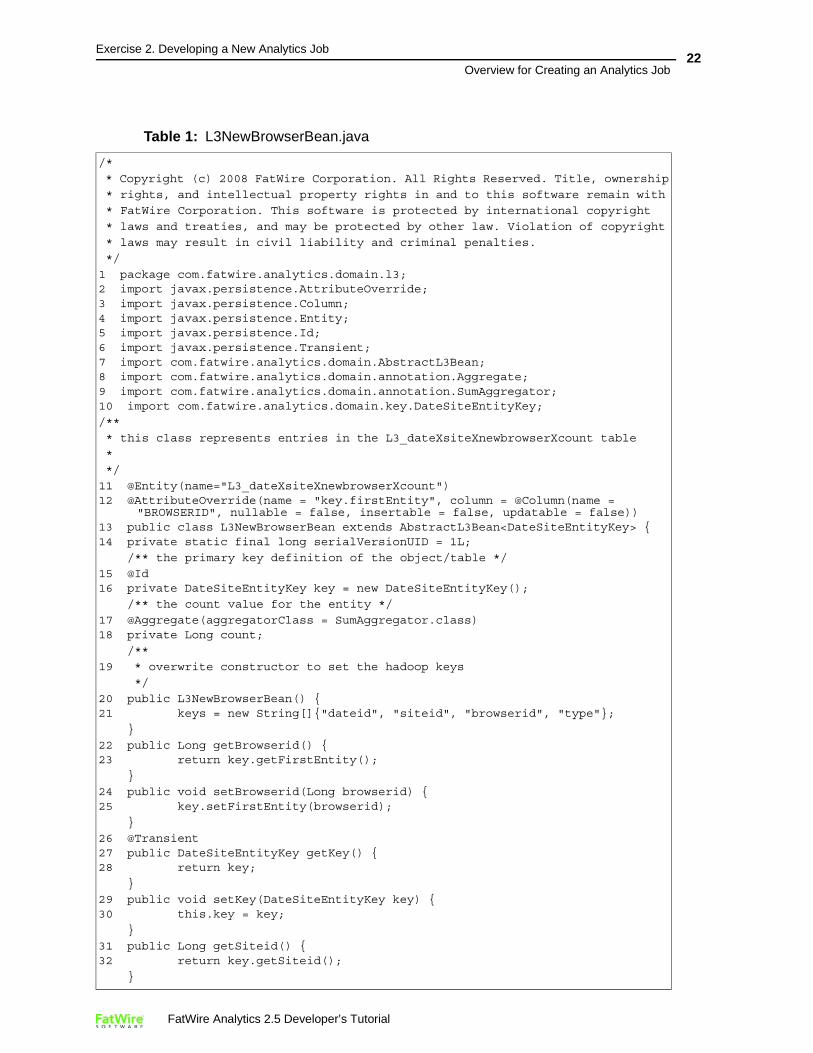
L3NewBrowserBean - This class is mapped to the L3 table in the database. The L3NewBrowserBean is used to store the aggregated count of browser visits. The content of this bean will be injected into the L3_DATEXSITEXNEWBROWSERXCOUNT table.
Create the L3NewBrowserBean bean class. For sample code, see Table 1, “L3NewBrowserBean.java”.
Note
The Aggregator is a java annotation used to tag fields of a bean that can be aggregated. If you wish to use an Aggregator other than SumAggregator, then you can use any of the following Aggregators listed:
• AvgAggregator
• CountAggregator
• DistinctCountAggregator
• MaxAggregator
• NullAggregator
• MinAggregator
FatWire Analytics 2.5 Developer’s Tutorial
Exercise 2. Developing a New Analytics Job
Overview for Creating an Analytics Job22
Table 1: L3NewBrowserBean.java
/*
* Copyright (c) 2008 FatWire Corporation. All Rights Reserved. Title, ownership
* rights, and intellectual property rights in and to this software remain with
* FatWire Corporation. This software is protected by international copyright
* laws and treaties, and may be protected by other law. Violation of copyright
* laws may result in civil liability and criminal penalties.
*/
1 package com.fatwire.analytics.domain.l3;2 import javax.persistence.AttributeOverride;3 import javax.persistence.Column;4 import javax.persistence.Entity;5 import javax.persistence.Id;6 import javax.persistence.Transient;7 import com.fatwire.analytics.domain.AbstractL3Bean;8 import com.fatwire.analytics.domain.annotation.Aggregate;9 import com.fatwire.analytics.domain.annotation.SumAggregator;10 import com.fatwire.analytics.domain.key.DateSiteEntityKey;
/**
* this class represents entries in the L3_dateXsiteXnewbrowserXcount table
*
*/
11 @Entity(name="L3_dateXsiteXnewbrowserXcount")12 @AttributeOverride(name = "key.firstEntity", column = @Column(name =
"BROWSERID", nullable = false, insertable = false, updatable = false))13 public class L3NewBrowserBean extends AbstractL3Bean<DateSiteEntityKey> {14 private static final long serialVersionUID = 1L;
/** the primary key definition of the object/table */
15 @Id16 private DateSiteEntityKey key = new DateSiteEntityKey();
/** the count value for the entity */
17 @Aggregate(aggregatorClass = SumAggregator.class)18 private Long count;
/**
19 * overwrite constructor to set the hadoop keys
*/
20 public L3NewBrowserBean() {21 keys = new String[]{"dateid", "siteid", "browserid", "type"};
}
22 public Long getBrowserid() {23 return key.getFirstEntity();
}
24 public void setBrowserid(Long browserid) {25 key.setFirstEntity(browserid);
}
26 @Transient27 public DateSiteEntityKey getKey() {28 return key;
}
29 public void setKey(DateSiteEntityKey key) {30 this.key = key;
}
31 public Long getSiteid() {32 return key.getSiteid();
}
FatWire Analytics 2.5 Developer’s Tutorial
Exercise 2. Developing a New Analytics Job
Overview for Creating an Analytics Job23
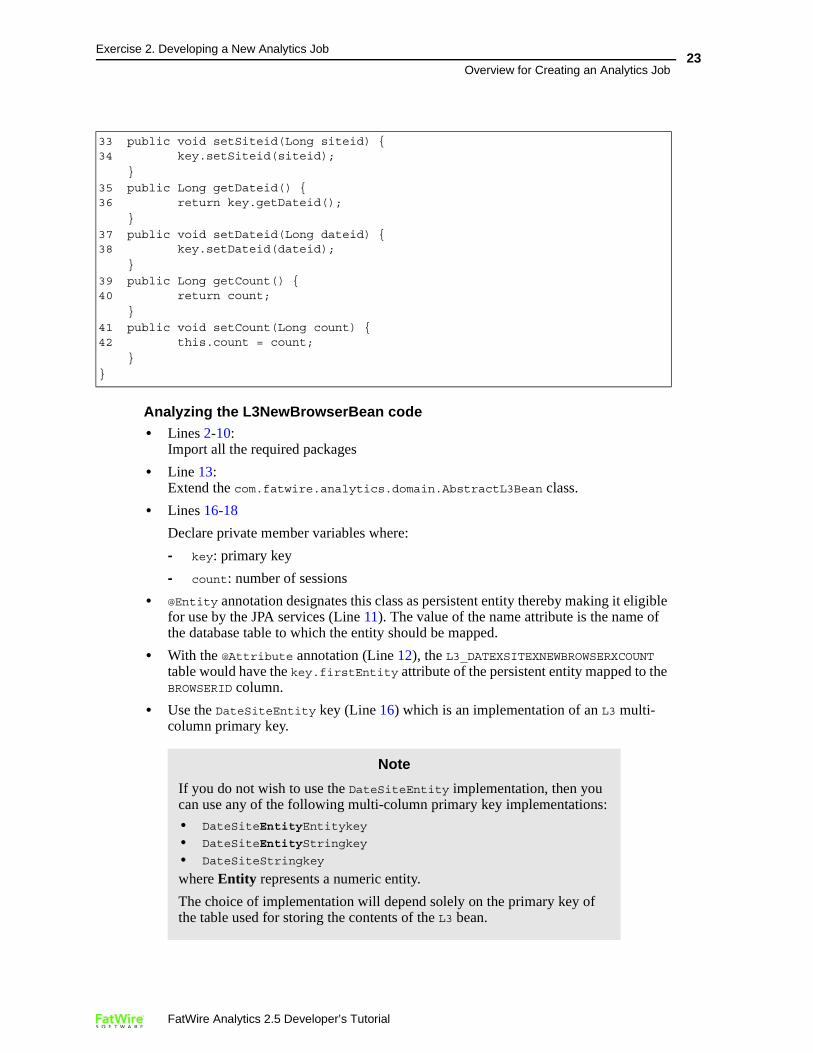
Analyzing the L3NewBrowserBean code• Lines 2-10:
Import all the required packages
• Line 13: Extend the com.fatwire.analytics.domain.AbstractL3Bean class.
• Lines 16-18
Declare private member variables where:
- key: primary key
- count: number of sessions
• @Entity annotation designates this class as persistent entity thereby making it eligible for use by the JPA services (Line 11). The value of the name attribute is the name of the database table to which the entity should be mapped.
• With the @Attribute annotation (Line 12), the L3_DATEXSITEXNEWBROWSERXCOUNT table would have the key.firstEntity attribute of the persistent entity mapped to the BROWSERID column.
• Use the DateSiteEntity key (Line 16) which is an implementation of an L3 multi-column primary key.
33 public void setSiteid(Long siteid) {34 key.setSiteid(siteid);
}
35 public Long getDateid() {36 return key.getDateid();
}
37 public void setDateid(Long dateid) {38 key.setDateid(dateid);
}
39 public Long getCount() {40 return count;
}
41 public void setCount(Long count) {42 this.count = count;
}
}
Note
If you do not wish to use the DateSiteEntity implementation, then you can use any of the following multi-column primary key implementations:
• DateSiteEntityEntitykey
• DateSiteEntityStringkey
• DateSiteStringkey
where Entity represents a numeric entity.
The choice of implementation will depend solely on the primary key of the table used for storing the contents of the L3 bean.
FatWire Analytics 2.5 Developer’s Tutorial
Exercise 2. Developing a New Analytics Job
Overview for Creating an Analytics Job24
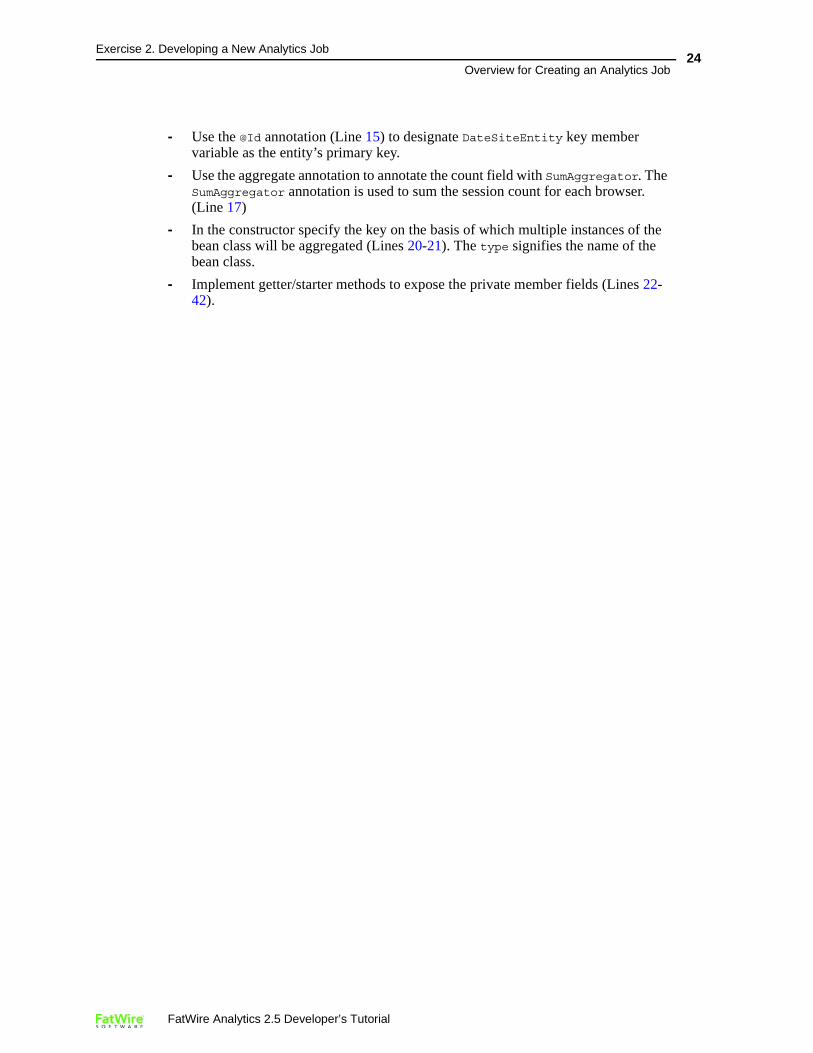
- Use the @Id annotation (Line 15) to designate DateSiteEntity key member variable as the entity’s primary key.
- Use the aggregate annotation to annotate the count field with SumAggregator. The SumAggregator annotation is used to sum the session count for each browser. (Line 17)
- In the constructor specify the key on the basis of which multiple instances of the bean class will be aggregated (Lines 20-21). The type signifies the name of the bean class.
- Implement getter/starter methods to expose the private member fields (Lines 22-42).
FatWire Analytics 2.5 Developer’s Tutorial
Exercise 2. Developing a New Analytics Job
Overview for Creating an Analytics Job25
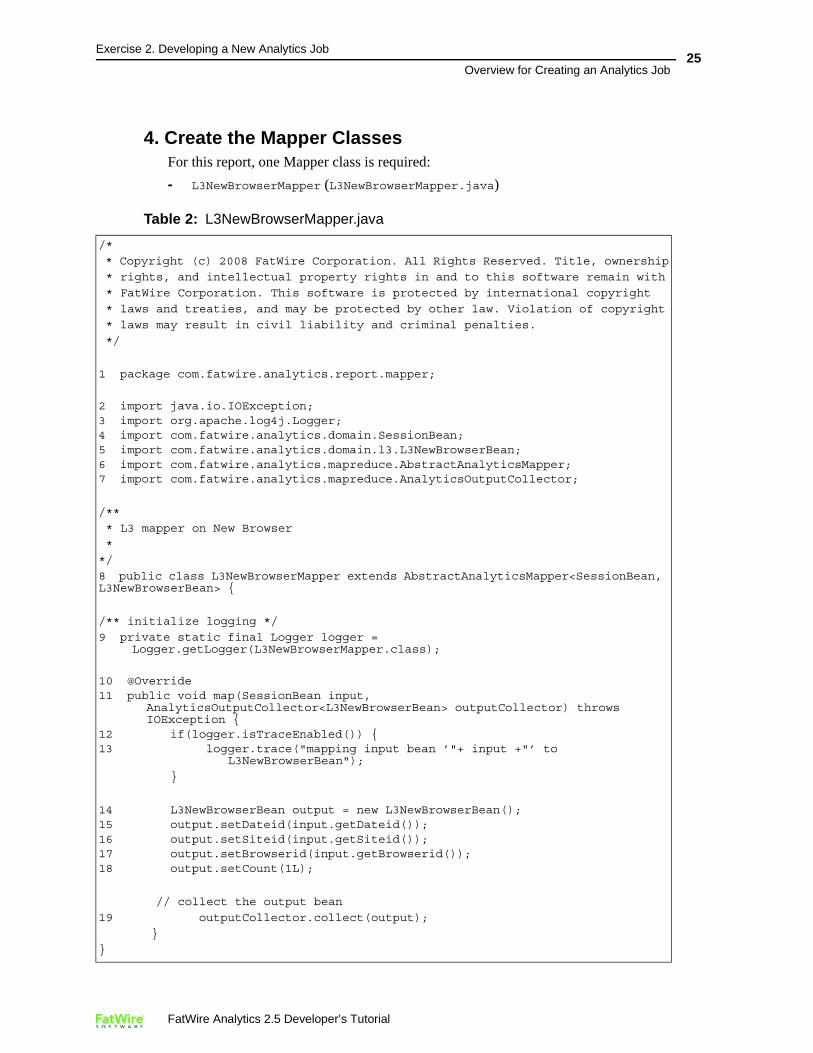
4. Create the Mapper ClassesFor this report, one Mapper class is required:
- L3NewBrowserMapper (L3NewBrowserMapper.java)
Table 2: L3NewBrowserMapper.java
/*
* Copyright (c) 2008 FatWire Corporation. All Rights Reserved. Title, ownership
* rights, and intellectual property rights in and to this software remain with
* FatWire Corporation. This software is protected by international copyright
* laws and treaties, and may be protected by other law. Violation of copyright
* laws may result in civil liability and criminal penalties.
*/
1 package com.fatwire.analytics.report.mapper;
2 import java.io.IOException;3 import org.apache.log4j.Logger;4 import com.fatwire.analytics.domain.SessionBean;5 import com.fatwire.analytics.domain.l3.L3NewBrowserBean;6 import com.fatwire.analytics.mapreduce.AbstractAnalyticsMapper;7 import com.fatwire.analytics.mapreduce.AnalyticsOutputCollector;
/**
* L3 mapper on New Browser
*
*/
8 public class L3NewBrowserMapper extends AbstractAnalyticsMapper<SessionBean, L3NewBrowserBean> {
/** initialize logging */
9 private static final Logger logger = Logger.getLogger(L3NewBrowserMapper.class);
10 @Override11 public void map(SessionBean input,
AnalyticsOutputCollector<L3NewBrowserBean> outputCollector) throws IOException {
12 if(logger.isTraceEnabled()) {13 logger.trace("mapping input bean ’"+ input +"’ to
L3NewBrowserBean");
}
14 L3NewBrowserBean output = new L3NewBrowserBean();15 output.setDateid(input.getDateid());16 output.setSiteid(input.getSiteid());17 output.setBrowserid(input.getBrowserid());18 output.setCount(1L);
// collect the output bean
19 outputCollector.collect(output);
}
}
FatWire Analytics 2.5 Developer’s Tutorial
Exercise 2. Developing a New Analytics Job
Overview for Creating an Analytics Job26
Analyzing the L3NewBrowserMapper class code
• The L3NewBrowserMapper class will extend the AbstractAnalyticsMapper class (Line 8) and override the map method (Lines 10-11).
• In the map method, every input SessionBean is transformed into L3NewBrowserBean by setting the value of L3NewBrowserBean from the SessionBean (Lines 13-17).
• The count property of the L3NewBrowserBean is set to 1L for every input bean (Line 18).
• Every L3NewBrowserBean created will be collected by the output collector (AnalyticsOutputCollector) (Line 19).
• Add debugging statements (Line 13).
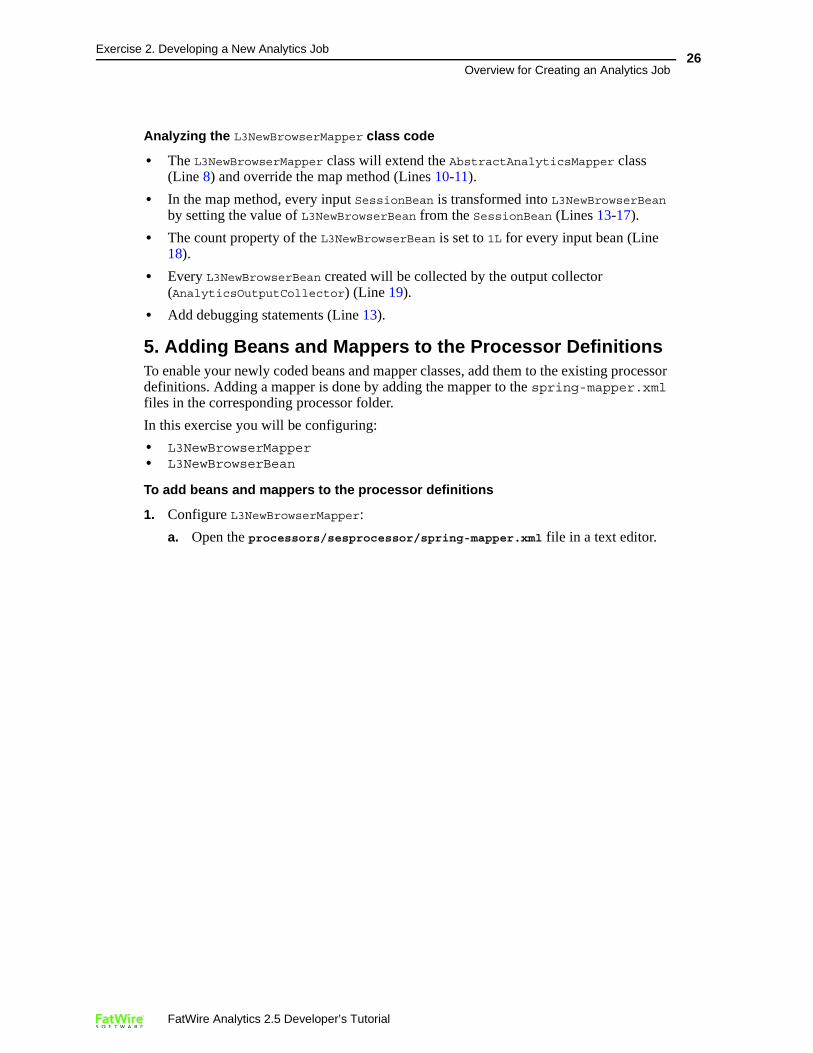
5. Adding Beans and Mappers to the Processor Definitions To enable your newly coded beans and mapper classes, add them to the existing processor definitions. Adding a mapper is done by adding the mapper to the spring-mapper.xml files in the corresponding processor folder.
In this exercise you will be configuring:
• L3NewBrowserMapper• L3NewBrowserBean
To add beans and mappers to the processor definitions
1. Configure L3NewBrowserMapper:
a. Open the processors/sesprocessor/spring-mapper.xml file in a text editor.
FatWire Analytics 2.5 Developer’s Tutorial
Exercise 2. Developing a New Analytics Job
Overview for Creating an Analytics Job27
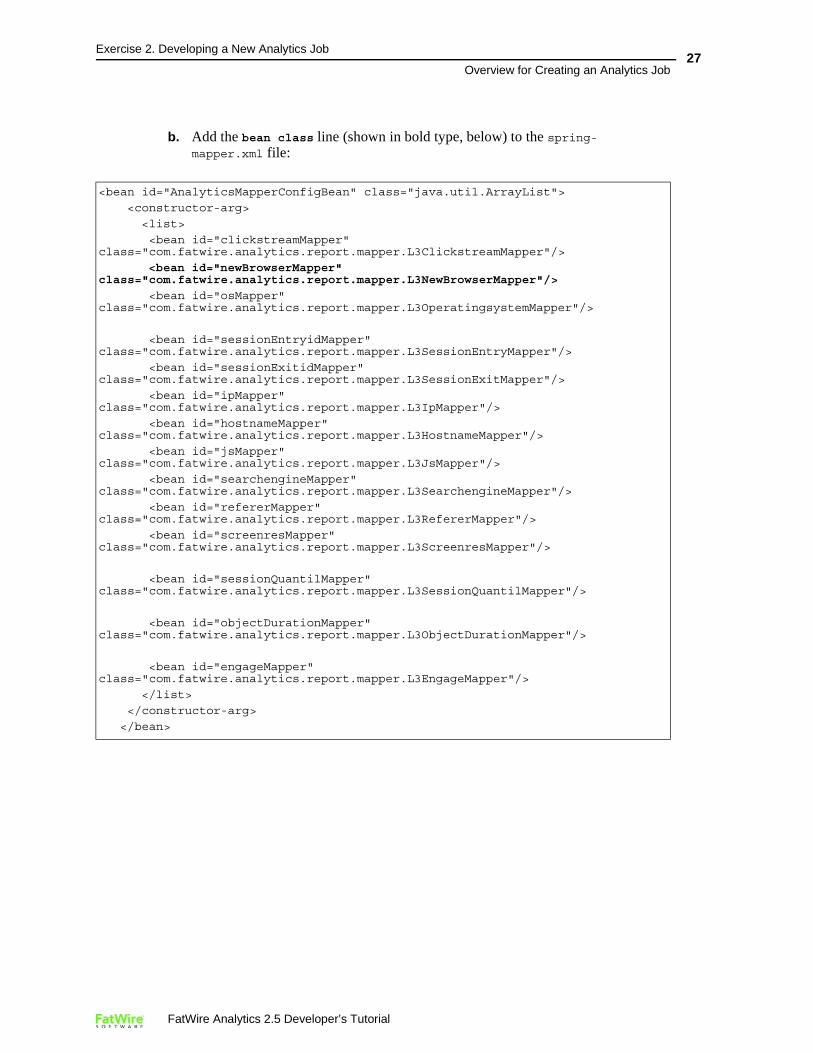
b. Add the bean class line (shown in bold type, below) to the spring- mapper.xml file:
<bean id="AnalyticsMapperConfigBean" class="java.util.ArrayList">
<constructor-arg>
<list>
<bean id="clickstreamMapper" class="com.fatwire.analytics.report.mapper.L3ClickstreamMapper"/>
<bean id="newBrowserMapper" class="com.fatwire.analytics.report.mapper.L3NewBrowserMapper"/>
<bean id="osMapper" class="com.fatwire.analytics.report.mapper.L3OperatingsystemMapper"/>
<bean id="sessionEntryidMapper" class="com.fatwire.analytics.report.mapper.L3SessionEntryMapper"/>
<bean id="sessionExitidMapper" class="com.fatwire.analytics.report.mapper.L3SessionExitMapper"/>
<bean id="ipMapper" class="com.fatwire.analytics.report.mapper.L3IpMapper"/>
<bean id="hostnameMapper" class="com.fatwire.analytics.report.mapper.L3HostnameMapper"/>
<bean id="jsMapper" class="com.fatwire.analytics.report.mapper.L3JsMapper"/>
<bean id="searchengineMapper" class="com.fatwire.analytics.report.mapper.L3SearchengineMapper"/>
<bean id="refererMapper" class="com.fatwire.analytics.report.mapper.L3RefererMapper"/>
<bean id="screenresMapper" class="com.fatwire.analytics.report.mapper.L3ScreenresMapper"/>
<bean id="sessionQuantilMapper" class="com.fatwire.analytics.report.mapper.L3SessionQuantilMapper"/>
<bean id="objectDurationMapper" class="com.fatwire.analytics.report.mapper.L3ObjectDurationMapper"/>
<bean id="engageMapper" class="com.fatwire.analytics.report.mapper.L3EngageMapper"/>
</list>
</constructor-arg>
</bean>
FatWire Analytics 2.5 Developer’s Tutorial
Exercise 2. Developing a New Analytics Job
Overview for Creating an Analytics Job28
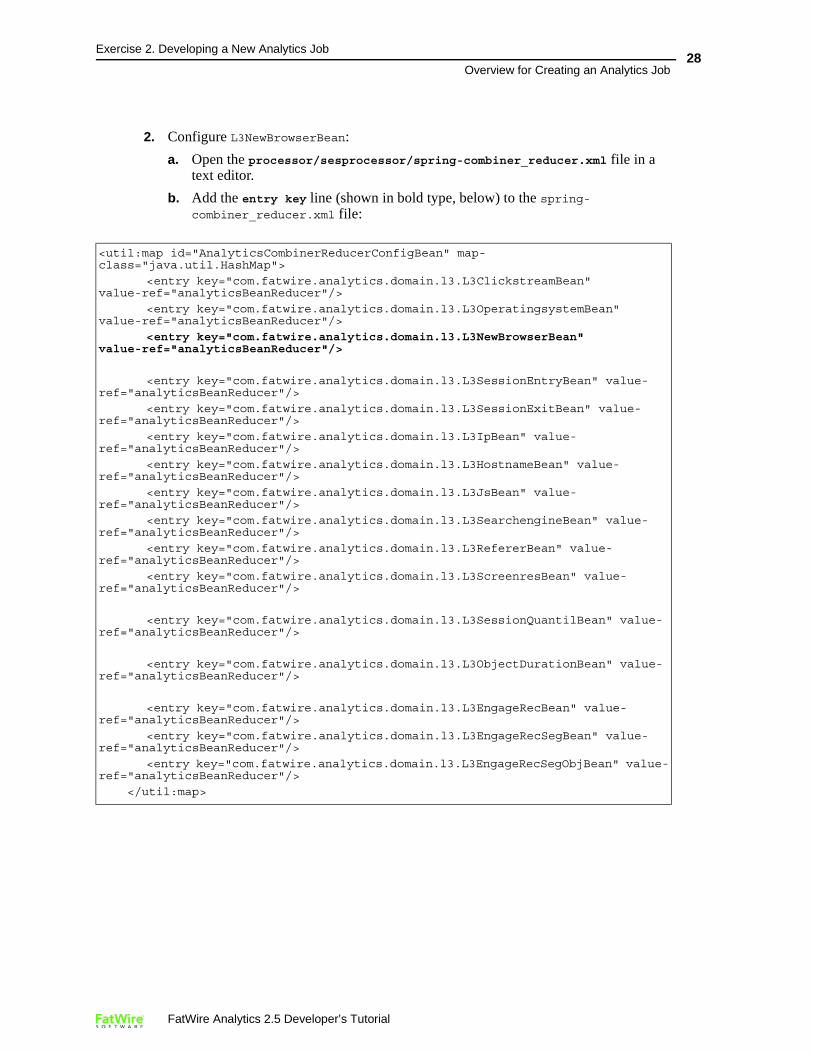
2. Configure L3NewBrowserBean:
a. Open the processor/sesprocessor/spring-combiner_reducer.xml file in a text editor.
b. Add the entry key line (shown in bold type, below) to the spring- combiner_reducer.xml file:
<util:map id="AnalyticsCombinerReducerConfigBean" map-class="java.util.HashMap">
<entry key="com.fatwire.analytics.domain.l3.L3ClickstreamBean" value-ref="analyticsBeanReducer"/>
<entry key="com.fatwire.analytics.domain.l3.L3OperatingsystemBean" value-ref="analyticsBeanReducer"/>
<entry key="com.fatwire.analytics.domain.l3.L3NewBrowserBean" value-ref="analyticsBeanReducer"/>
<entry key="com.fatwire.analytics.domain.l3.L3SessionEntryBean" value-ref="analyticsBeanReducer"/>
<entry key="com.fatwire.analytics.domain.l3.L3SessionExitBean" value-ref="analyticsBeanReducer"/>
<entry key="com.fatwire.analytics.domain.l3.L3IpBean" value-ref="analyticsBeanReducer"/>
<entry key="com.fatwire.analytics.domain.l3.L3HostnameBean" value-ref="analyticsBeanReducer"/>
<entry key="com.fatwire.analytics.domain.l3.L3JsBean" value-ref="analyticsBeanReducer"/>
<entry key="com.fatwire.analytics.domain.l3.L3SearchengineBean" value-ref="analyticsBeanReducer"/>
<entry key="com.fatwire.analytics.domain.l3.L3RefererBean" value-ref="analyticsBeanReducer"/>
<entry key="com.fatwire.analytics.domain.l3.L3ScreenresBean" value-ref="analyticsBeanReducer"/>
<entry key="com.fatwire.analytics.domain.l3.L3SessionQuantilBean" value-ref="analyticsBeanReducer"/>
<entry key="com.fatwire.analytics.domain.l3.L3ObjectDurationBean" value-ref="analyticsBeanReducer"/>
<entry key="com.fatwire.analytics.domain.l3.L3EngageRecBean" value-ref="analyticsBeanReducer"/>
<entry key="com.fatwire.analytics.domain.l3.L3EngageRecSegBean" value-ref="analyticsBeanReducer"/>
<entry key="com.fatwire.analytics.domain.l3.L3EngageRecSegObjBean" value-ref="analyticsBeanReducer"/>
</util:map>
FatWire Analytics 2.5 Developer’s Tutorial
Exercise 2. Developing a New Analytics Job
Overview for Creating an Analytics Job29
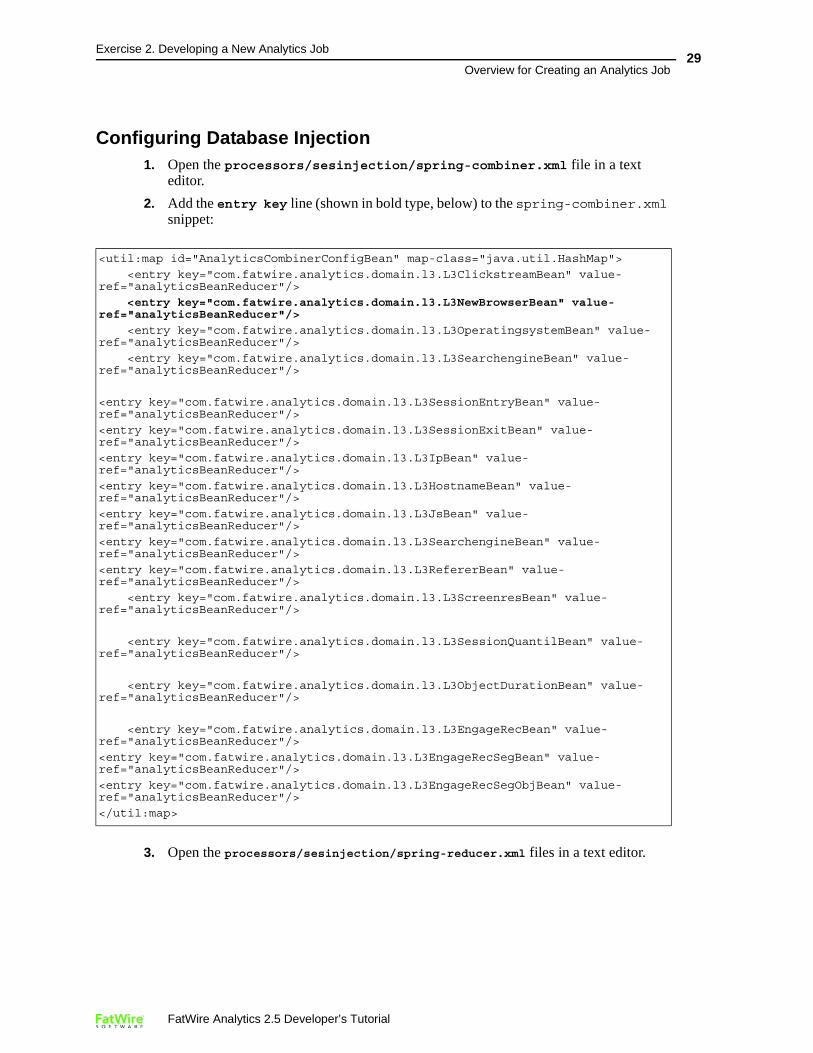
Configuring Database Injection 1. Open the processors/sesinjection/spring-combiner.xml file in a text
editor.
2. Add the entry key line (shown in bold type, below) to the spring-combiner.xml snippet:
3. Open the processors/sesinjection/spring-reducer.xml files in a text editor.
<util:map id="AnalyticsCombinerConfigBean" map-class="java.util.HashMap">
<entry key="com.fatwire.analytics.domain.l3.L3ClickstreamBean" value-ref="analyticsBeanReducer"/>
<entry key="com.fatwire.analytics.domain.l3.L3NewBrowserBean" value-ref="analyticsBeanReducer"/>
<entry key="com.fatwire.analytics.domain.l3.L3OperatingsystemBean" value-ref="analyticsBeanReducer"/>
<entry key="com.fatwire.analytics.domain.l3.L3SearchengineBean" value-ref="analyticsBeanReducer"/>
<entry key="com.fatwire.analytics.domain.l3.L3SessionEntryBean" value-ref="analyticsBeanReducer"/>
<entry key="com.fatwire.analytics.domain.l3.L3SessionExitBean" value-ref="analyticsBeanReducer"/>
<entry key="com.fatwire.analytics.domain.l3.L3IpBean" value-ref="analyticsBeanReducer"/>
<entry key="com.fatwire.analytics.domain.l3.L3HostnameBean" value-ref="analyticsBeanReducer"/>
<entry key="com.fatwire.analytics.domain.l3.L3JsBean" value-ref="analyticsBeanReducer"/>
<entry key="com.fatwire.analytics.domain.l3.L3SearchengineBean" value-ref="analyticsBeanReducer"/>
<entry key="com.fatwire.analytics.domain.l3.L3RefererBean" value-ref="analyticsBeanReducer"/>
<entry key="com.fatwire.analytics.domain.l3.L3ScreenresBean" value-ref="analyticsBeanReducer"/>
<entry key="com.fatwire.analytics.domain.l3.L3SessionQuantilBean" value-ref="analyticsBeanReducer"/>
<entry key="com.fatwire.analytics.domain.l3.L3ObjectDurationBean" value-ref="analyticsBeanReducer"/>
<entry key="com.fatwire.analytics.domain.l3.L3EngageRecBean" value-ref="analyticsBeanReducer"/>
<entry key="com.fatwire.analytics.domain.l3.L3EngageRecSegBean" value-ref="analyticsBeanReducer"/>
<entry key="com.fatwire.analytics.domain.l3.L3EngageRecSegObjBean" value-ref="analyticsBeanReducer"/>
</util:map>
FatWire Analytics 2.5 Developer’s Tutorial
Exercise 2. Developing a New Analytics Job
Overview for Creating an Analytics Job30
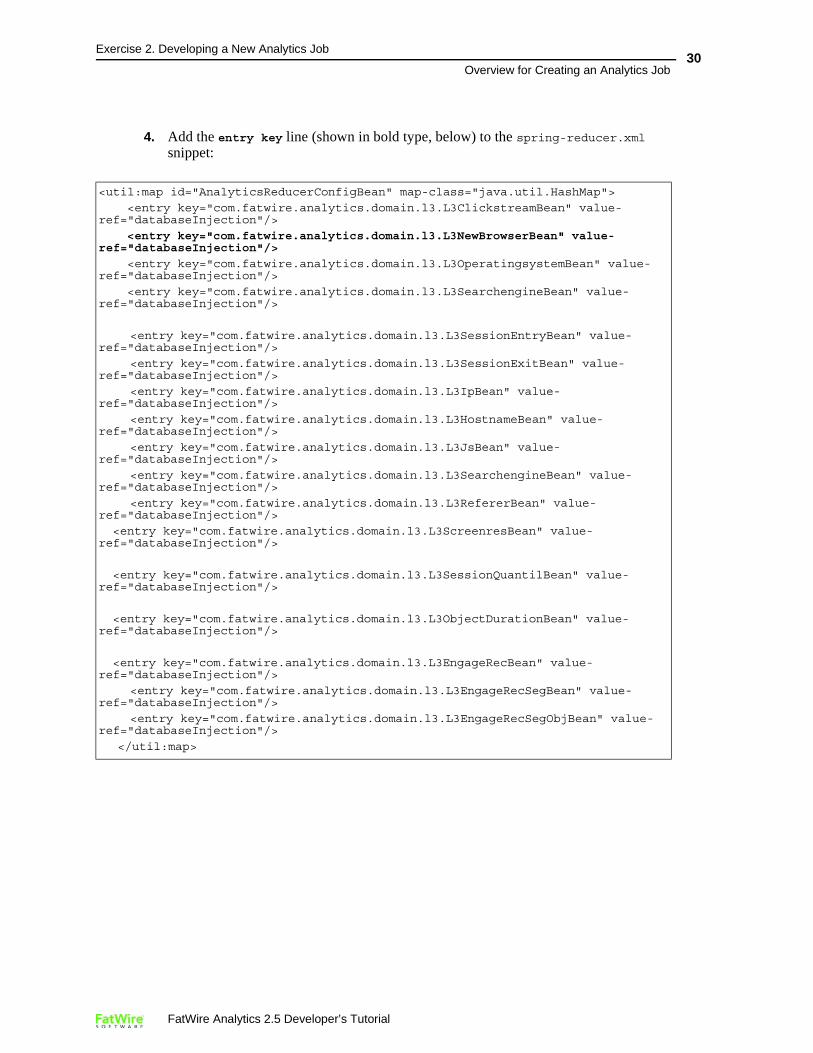
4. Add the entry key line (shown in bold type, below) to the spring-reducer.xml snippet:
<util:map id="AnalyticsReducerConfigBean" map-class="java.util.HashMap">
<entry key="com.fatwire.analytics.domain.l3.L3ClickstreamBean" value-ref="databaseInjection"/>
<entry key="com.fatwire.analytics.domain.l3.L3NewBrowserBean" value-ref="databaseInjection"/>
<entry key="com.fatwire.analytics.domain.l3.L3OperatingsystemBean" value-ref="databaseInjection"/>
<entry key="com.fatwire.analytics.domain.l3.L3SearchengineBean" value-ref="databaseInjection"/>
<entry key="com.fatwire.analytics.domain.l3.L3SessionEntryBean" value-ref="databaseInjection"/>
<entry key="com.fatwire.analytics.domain.l3.L3SessionExitBean" value-ref="databaseInjection"/>
<entry key="com.fatwire.analytics.domain.l3.L3IpBean" value-ref="databaseInjection"/>
<entry key="com.fatwire.analytics.domain.l3.L3HostnameBean" value-ref="databaseInjection"/>
<entry key="com.fatwire.analytics.domain.l3.L3JsBean" value-ref="databaseInjection"/>
<entry key="com.fatwire.analytics.domain.l3.L3SearchengineBean" value-ref="databaseInjection"/>
<entry key="com.fatwire.analytics.domain.l3.L3RefererBean" value-ref="databaseInjection"/>
<entry key="com.fatwire.analytics.domain.l3.L3ScreenresBean" value-ref="databaseInjection"/>
<entry key="com.fatwire.analytics.domain.l3.L3SessionQuantilBean" value-ref="databaseInjection"/>
<entry key="com.fatwire.analytics.domain.l3.L3ObjectDurationBean" value-ref="databaseInjection"/>
<entry key="com.fatwire.analytics.domain.l3.L3EngageRecBean" value-ref="databaseInjection"/>
<entry key="com.fatwire.analytics.domain.l3.L3EngageRecSegBean" value-ref="databaseInjection"/>
<entry key="com.fatwire.analytics.domain.l3.L3EngageRecSegObjBean" value-ref="databaseInjection"/>
</util:map>
FatWire Analytics 2.5 Developer’s Tutorial
Exercise 2. Developing a New Analytics Job
Next Steps31
Integrating the New Analytics Job with the Existing Hadoop-Jobs Component
Once you have developed the new Analytics job, integrate the new job you developed with the existing hadoop-jobs component by recreating a jar file (hadoop-jobs.jar). Copy the new hadoop-jobs.jar file to the hadoop-jobs directory. Recreating the jar file enables the hadoop-jobs component to process the data captured by the new Analytics job you developed in this exercise.
To integrate the new Analytics job with the existing hadoop-jobs component:
1. Create the hadoop-jobs.jar file.
2. Replace the existing hadoop-jobs.jar file, located in the hadoop-jobs installation directory, with the jar file you created in step 1.
3. Run the hadoop-jobs component in order to process the data captured by the parameter (added in Exercise 1).
Next StepsExercise 3 of this tutorial walks you through how to create a new report in the reporting interface. As an example, you will create the “NewBrowsers” report, which displays the number of visitors for each browser.
Note
The “NewBrowsers” report you will be creating in this tutorial, is a duplicate of the default “Browsers” report in your Analytics installation. For the purposes of this tutorial, the xml file and report name of the “Browsers” report you will be configuring, along with the bean and mapper class names, have been renamed to avoid overwriting the default “Browsers” report.
FatWire Analytics 2.5 Developer’s Tutorial

Exercise 2. Developing a New Analytics Job
Next Steps32
FatWire Analytics 2.5 Developer’s Tutorial
33
Exercise 3
Creating and Configuring a Report
Your goal in this exercise is to learn how to configure a complete, usable Analytics report.
To accomplish that, you will configure a custom report called “NewBrowsers” that will display the browsers that visitors used to gain access to the given site’s page view within the reported time period.
The report will display data that has already been captured on the FirstSite II sample site and stored in the Analytics database.
When building the report, you will first create a simple report with a test module that displays a “Hello World” greeting. You will remove this test module when you begin adding features to your report.
This exercise consists of the following sections:
• Report Design
• Creating the ‘NewBrowsers’ Report
Note
The “NewBrowser” report you will be creating in this tutorial, is a duplicate of the default “Browsers” report in your Analytics installation. For the purposes of this tutorial, the xml file and report name of the “Browsers” report you will be configuring, along with the bean and mapper class names, have been renamed to avoid overwriting the default “Browsers” report
Note
Throughout this exercise, we assume that you are working exclusively with the FirstSite II sample site. Select this site whenever prompted in the Analytics or Content Server interfaces.
FatWire Analytics 2.5 Developer’s Tutorial
Exercise 3. Creating and Configuring a Report
Report Design34
le
rt
The pair o<module>defines themodule, itsand objecthandle.
he code inside e <module> gs defines the
eport’s atures.
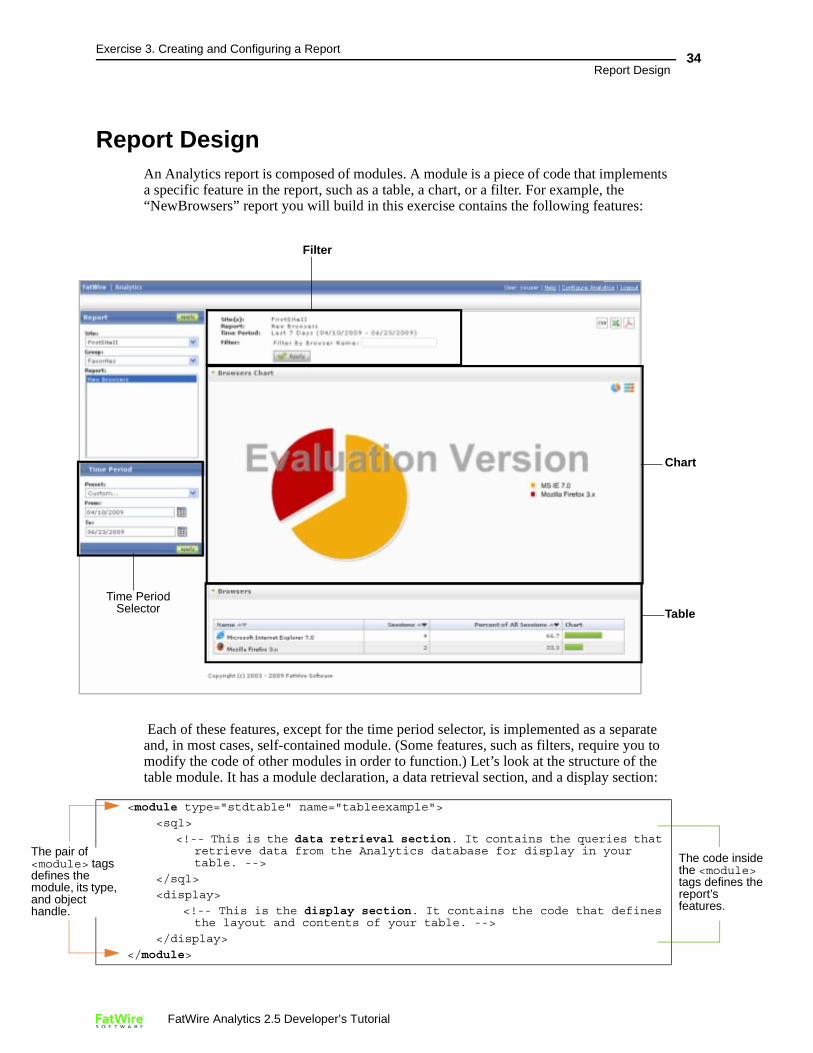
Report DesignAn Analytics report is composed of modules. A module is a piece of code that implements a specific feature in the report, such as a table, a chart, or a filter. For example, the “NewBrowsers” report you will build in this exercise contains the following features:
Each of these features, except for the time period selector, is implemented as a separate and, in most cases, self-contained module. (Some features, such as filters, require you to modify the code of other modules in order to function.) Let’s look at the structure of the table module. It has a module declaration, a data retrieval section, and a display section:
<module type="stdtable" name="tableexample">
<sql>
<!-- This is the data retrieval section. It contains the queries that retrieve data from the Analytics database for display in your table. -->
</sql>
<display>
<!-- This is the display section. It contains the code that defines the layout and contents of your table. -->
</display>
</module>
Filter
Time Period Selector Tab
Cha
f tags type,
Tthtarfe
FatWire Analytics 2.5 Developer’s Tutorial
Exercise 3. Creating and Configuring a Report
Report Design35
Modules that query the database to display data contain the <sql> and <display> tags, as shown in the sample code on page 34. Modules that do not display data, such as filter modules, contain the following structure:
The chart module has the same structure.
The tables, charts, and other features of your report contain areas (such as headings, field names and column heads) that must be filled in manually by having their values defined in a property file accessible within your application server’s classpath. For example, the following statement defines the heading for the “Browser Name” column in your table:
Now that you know how reports are built, let’s go ahead and create the “NewBrowsers” report. Continue on to “Creating the ‘NewBrowsers’ Report,” on page 40.
<filter name="filter-browsername" required="false" type="text" captions="name" key="filter-browsername" />
report_newbrowser_module_browser_column_broname=Name
Note
For your reference, the code for the “NewBrowsers” report, annotated module by module, is included in “‘NewBrowsers’ Report Code,” on page 36.”
FatWire Analytics 2.5 Developer’s Tutorial
Exercise 3. Creating and Configuring a Report
Report Design36
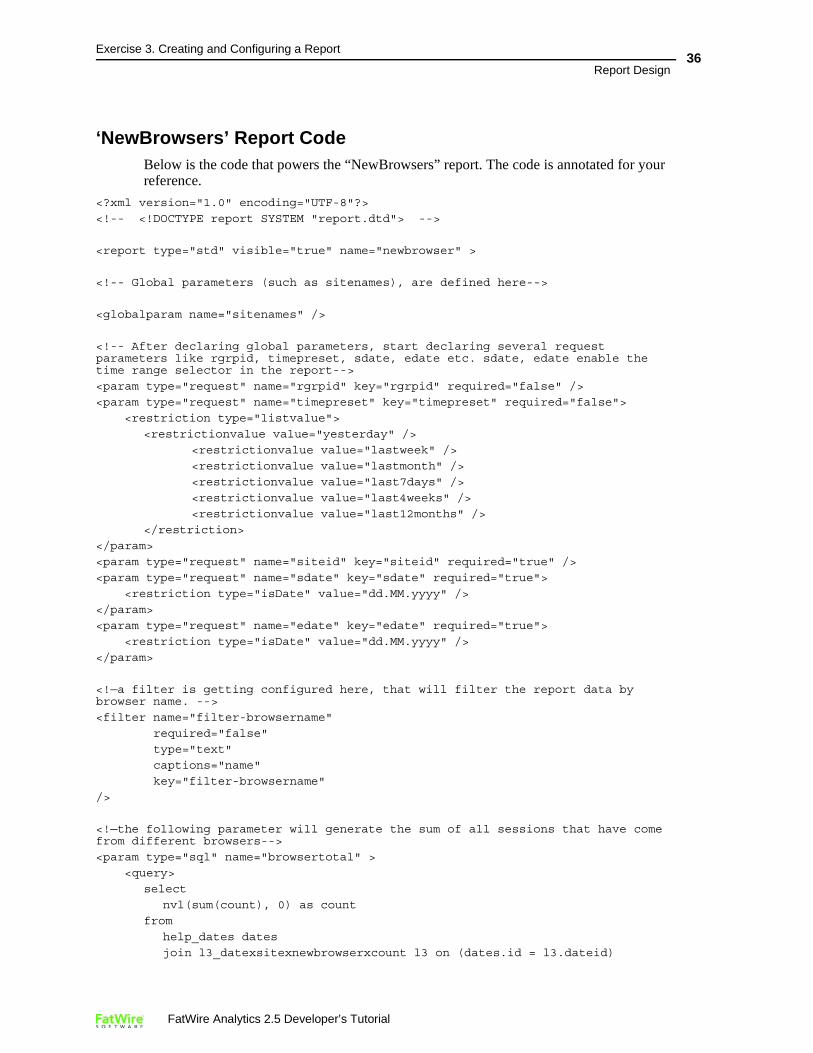
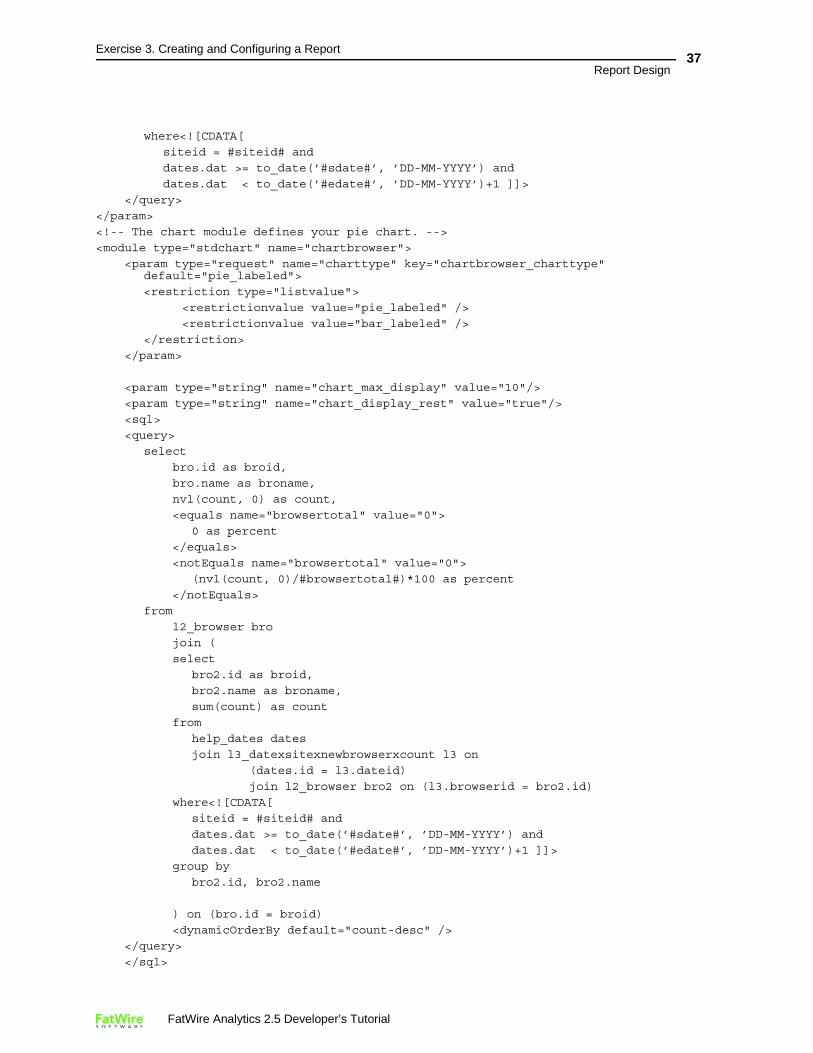
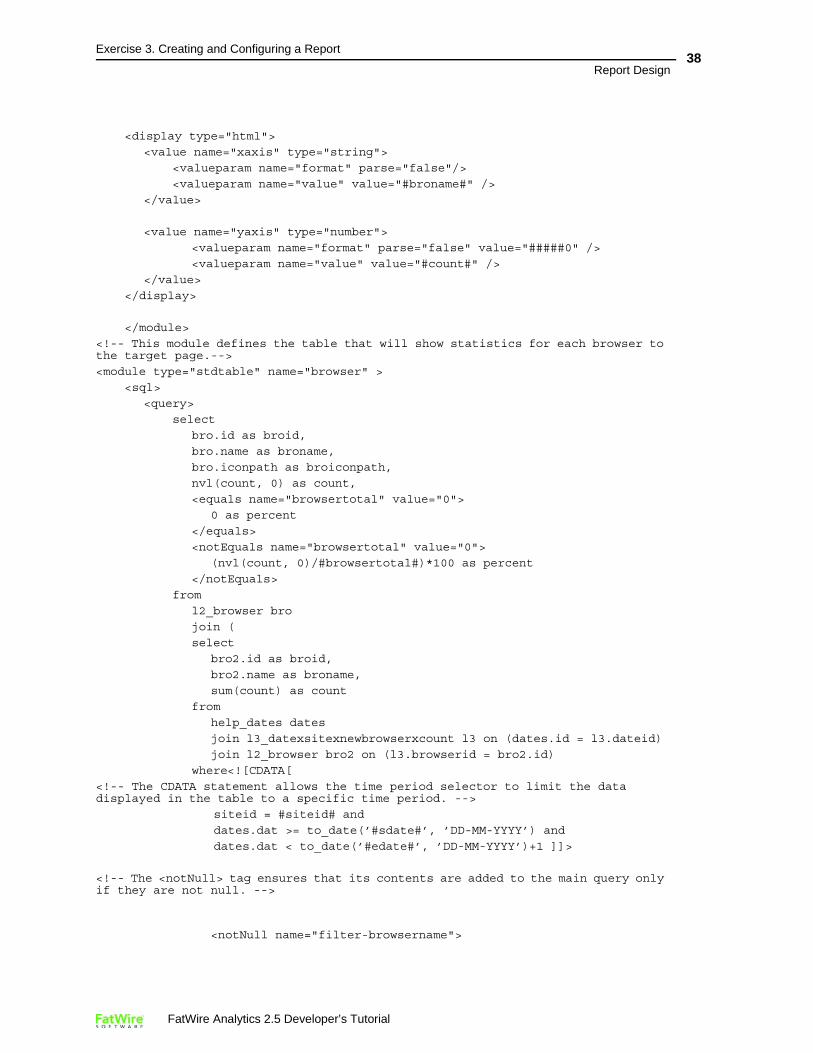
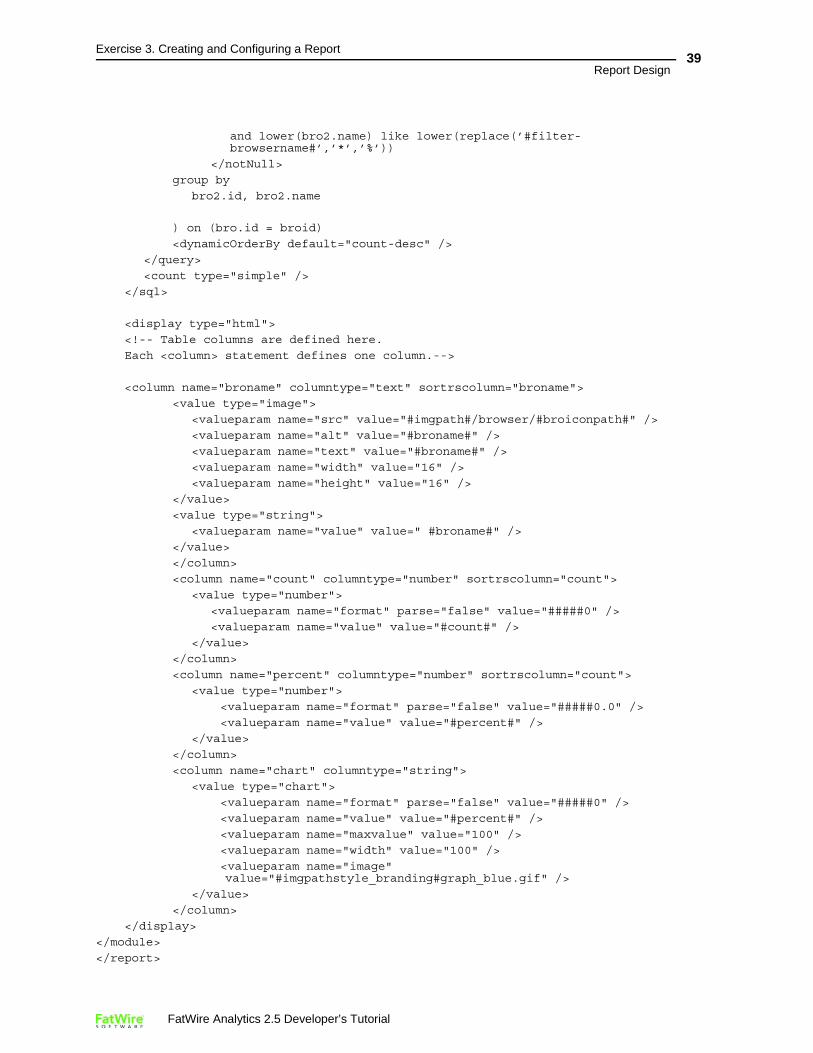
‘NewBrowsers’ Report CodeBelow is the code that powers the “NewBrowsers” report. The code is annotated for your reference.
<?xml version="1.0" encoding="UTF-8"?>
<!-- <!DOCTYPE report SYSTEM "report.dtd"> -->
<report type="std" visible="true" name="newbrowser" >
<!-- Global parameters (such as sitenames), are defined here-->
<globalparam name="sitenames" />
<!-- After declaring global parameters, start declaring several request parameters like rgrpid, timepreset, sdate, edate etc. sdate, edate enable the time range selector in the report-->
<param type="request" name="rgrpid" key="rgrpid" required="false" />
<param type="request" name="timepreset" key="timepreset" required="false">
<restriction type="listvalue">
<restrictionvalue value="yesterday" />
<restrictionvalue value="lastweek" />
<restrictionvalue value="lastmonth" />
<restrictionvalue value="last7days" />
<restrictionvalue value="last4weeks" />
<restrictionvalue value="last12months" />
</restriction>
</param>
<param type="request" name="siteid" key="siteid" required="true" />
<param type="request" name="sdate" key="sdate" required="true">
<restriction type="isDate" value="dd.MM.yyyy" />
</param>
<param type="request" name="edate" key="edate" required="true">
<restriction type="isDate" value="dd.MM.yyyy" />
</param>
<!—a filter is getting configured here, that will filter the report data by browser name. -->
<filter name="filter-browsername"
required="false"
type="text"
captions="name"
key="filter-browsername"
/>
<!—the following parameter will generate the sum of all sessions that have come from different browsers-->
<param type="sql" name="browsertotal" >
<query>
select
nvl(sum(count), 0) as count
from
help_dates dates
join l3_datexsitexnewbrowserxcount l3 on (dates.id = l3.dateid)
FatWire Analytics 2.5 Developer’s Tutorial
Exercise 3. Creating and Configuring a Report
Report Design37
where<![CDATA[
siteid = #siteid# and
dates.dat >= to_date(’#sdate#’, ’DD-MM-YYYY’) and
dates.dat < to_date(’#edate#’, ’DD-MM-YYYY’)+1 ]]>
</query>
</param>
<!-- The chart module defines your pie chart. -->
<module type="stdchart" name="chartbrowser">
<param type="request" name="charttype" key="chartbrowser_charttype" default="pie_labeled">
<restriction type="listvalue">
<restrictionvalue value="pie_labeled" />
<restrictionvalue value="bar_labeled" />
</restriction>
</param>
<param type="string" name="chart_max_display" value="10"/>
<param type="string" name="chart_display_rest" value="true"/>
<sql>
<query>
select
bro.id as broid,
bro.name as broname,
nvl(count, 0) as count,
<equals name="browsertotal" value="0">
0 as percent
</equals>
<notEquals name="browsertotal" value="0">
(nvl(count, 0)/#browsertotal#)*100 as percent
</notEquals>
from
l2_browser bro
join (
select
bro2.id as broid,
bro2.name as broname,
sum(count) as count
from
help_dates dates
join l3_datexsitexnewbrowserxcount l3 on
(dates.id = l3.dateid)
join l2_browser bro2 on (l3.browserid = bro2.id)
where<![CDATA[
siteid = #siteid# and
dates.dat >= to_date(’#sdate#’, ’DD-MM-YYYY’) and
dates.dat < to_date(’#edate#’, ’DD-MM-YYYY’)+1 ]]>
group by
bro2.id, bro2.name
) on (bro.id = broid)
<dynamicOrderBy default="count-desc" />
</query>
</sql>
FatWire Analytics 2.5 Developer’s Tutorial
Exercise 3. Creating and Configuring a Report
Report Design38
<display type="html">
<value name="xaxis" type="string">
<valueparam name="format" parse="false"/>
<valueparam name="value" value="#broname#" />
</value>
<value name="yaxis" type="number">
<valueparam name="format" parse="false" value="#####0" />
<valueparam name="value" value="#count#" />
</value>
</display>
</module>
<!-- This module defines the table that will show statistics for each browser to the target page.-->
<module type="stdtable" name="browser" >
<sql>
<query>
select
bro.id as broid,
bro.name as broname,
bro.iconpath as broiconpath,
nvl(count, 0) as count,
<equals name="browsertotal" value="0">
0 as percent
</equals>
<notEquals name="browsertotal" value="0">
(nvl(count, 0)/#browsertotal#)*100 as percent
</notEquals>
from
l2_browser bro
join (
select
bro2.id as broid,
bro2.name as broname,
sum(count) as count
from
help_dates dates
join l3_datexsitexnewbrowserxcount l3 on (dates.id = l3.dateid)
join l2_browser bro2 on (l3.browserid = bro2.id)
where<![CDATA[
<!-- The CDATA statement allows the time period selector to limit the data displayed in the table to a specific time period. -->
siteid = #siteid# and
dates.dat >= to_date(’#sdate#’, ’DD-MM-YYYY’) and
dates.dat < to_date(’#edate#’, ’DD-MM-YYYY’)+1 ]]>
<!-- The <notNull> tag ensures that its contents are added to the main query only if they are not null. -->
<notNull name="filter-browsername">
FatWire Analytics 2.5 Developer’s Tutorial
Exercise 3. Creating and Configuring a Report
Report Design39
and lower(bro2.name) like lower(replace(’#filter-browsername#’,’*’,’%’))
</notNull>
group by
bro2.id, bro2.name
) on (bro.id = broid)
<dynamicOrderBy default="count-desc" />
</query>
<count type="simple" />
</sql>
<display type="html">
<!-- Table columns are defined here.
Each <column> statement defines one column.-->
<column name="broname" columntype="text" sortrscolumn="broname">
<value type="image">
<valueparam name="src" value="#imgpath#/browser/#broiconpath#" />
<valueparam name="alt" value="#broname#" />
<valueparam name="text" value="#broname#" />
<valueparam name="width" value="16" />
<valueparam name="height" value="16" />
</value>
<value type="string">
<valueparam name="value" value=" #broname#" />
</value>
</column>
<column name="count" columntype="number" sortrscolumn="count">
<value type="number">
<valueparam name="format" parse="false" value="#####0" />
<valueparam name="value" value="#count#" />
</value>
</column>
<column name="percent" columntype="number" sortrscolumn="count">
<value type="number">
<valueparam name="format" parse="false" value="#####0.0" />
<valueparam name="value" value="#percent#" />
</value>
</column>
<column name="chart" columntype="string">
<value type="chart">
<valueparam name="format" parse="false" value="#####0" />
<valueparam name="value" value="#percent#" />
<valueparam name="maxvalue" value="100" />
<valueparam name="width" value="100" />
<valueparam name="image" value="#imgpathstyle_branding#graph_blue.gif" />
</value>
</column>
</display>
</module>
</report>
FatWire Analytics 2.5 Developer’s Tutorial
Exercise 3. Creating and Configuring a Report
Creating the ‘NewBrowsers’ Report40
Creating the ‘NewBrowsers’ ReportYou will now create the “NewBrowsers” report (shown on page 34).
1. Creating and Registering the Report File. The first task is to create the XML file that will hold the report code and register it with Analytics.
2. Adding a Table. The table displays a set of statistics for each browser (Browser Name; Sessions; Percent of all sessions; and the chart that shows the percent graphically).
3. Adding a Time Period Selector. This selector allows you to limit the data displayed in the report to a specific time period. (This feature does not require a module.)
4. Adding a Filter. Using filters, you can restrict the data displayed in the report to specific browsers and session counts.
5. Adding a Chart. The “NewBrowsers” chart shows how often a given browser was used to access the site’s page view during the reported time period.
6. Testing the Completed ‘NewBrowsers’ Report. Test your report to make sure it looks and behaves as intended.
Creating and Registering the Report FileYour first task is to create the foundation for the report – the XML file that will hold the report code. In this section you will create a report file containing the “Hello World” test module that will display only text, and you will register the report with Analytics.
The steps for creating and registering a report file are:
A. Create the XML File
B. Place the XML File in the Analytics Reports Directory
C. Label the Report Components
D. Make the Report Available to Analytics Users
E. Test the New Report
Note
In this exercise, you will add features to your report in the order shown below. Once you are familiar with report code, you can build your report in the order that’s most convenient for you. Be aware, however, that certain features, such as filters, require you to modify the code in other modules.
FatWire Analytics 2.5 Developer’s Tutorial
Exercise 3. Creating and Configuring a Report
Creating the ‘NewBrowsers’ Report41
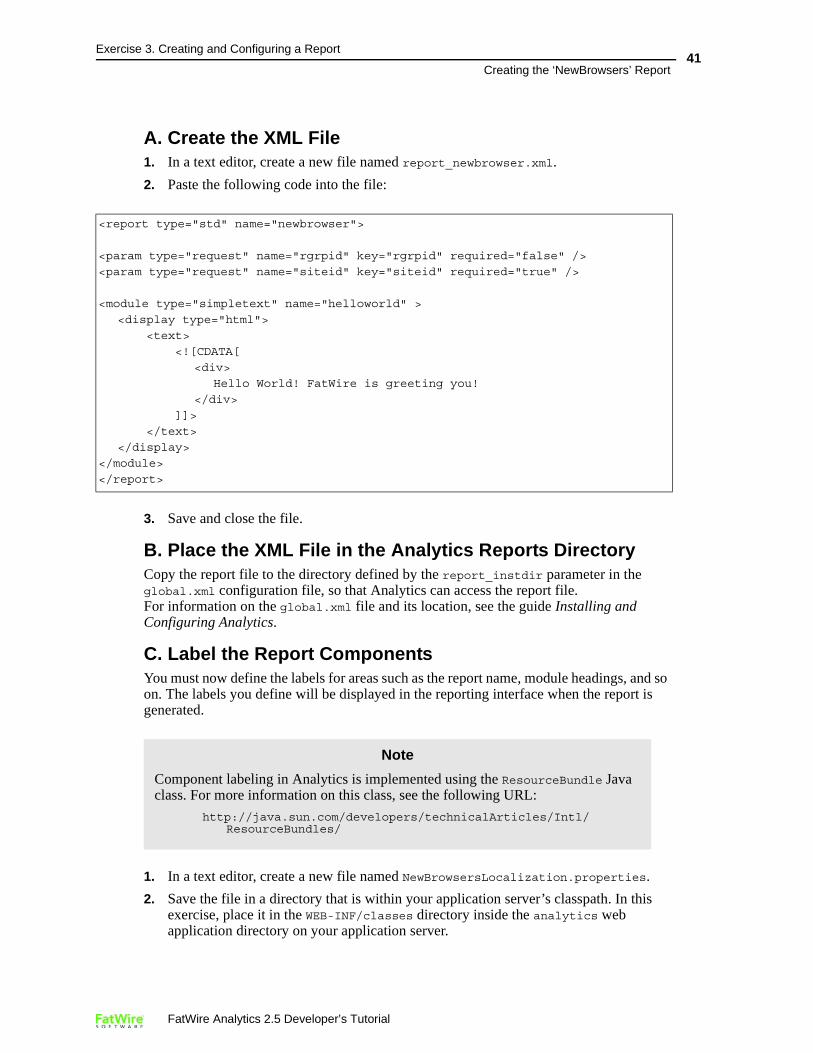
A. Create the XML File1. In a text editor, create a new file named report_newbrowser.xml.
2. Paste the following code into the file:
3. Save and close the file.
B. Place the XML File in the Analytics Reports DirectoryCopy the report file to the directory defined by the report_instdir parameter in the global.xml configuration file, so that Analytics can access the report file. For information on the global.xml file and its location, see the guide Installing and Configuring Analytics.
C. Label the Report ComponentsYou must now define the labels for areas such as the report name, module headings, and so on. The labels you define will be displayed in the reporting interface when the report is generated.
1. In a text editor, create a new file named NewBrowsersLocalization.properties.
2. Save the file in a directory that is within your application server’s classpath. In this exercise, place it in the WEB-INF/classes directory inside the analytics web application directory on your application server.
<report type="std" name="newbrowser">
<param type="request" name="rgrpid" key="rgrpid" required="false" />
<param type="request" name="siteid" key="siteid" required="true" />
<module type="simpletext" name="helloworld" >
<display type="html">
<text>
<![CDATA[
<div>
Hello World! FatWire is greeting you!
</div>
]]>
</text>
</display>
</module>
</report>
Note
Component labeling in Analytics is implemented using the ResourceBundle Java class. For more information on this class, see the following URL:
http://java.sun.com/developers/technicalArticles/Intl/ResourceBundles/
FatWire Analytics 2.5 Developer’s Tutorial
Exercise 3. Creating and Configuring a Report
Creating the ‘NewBrowsers’ Report42
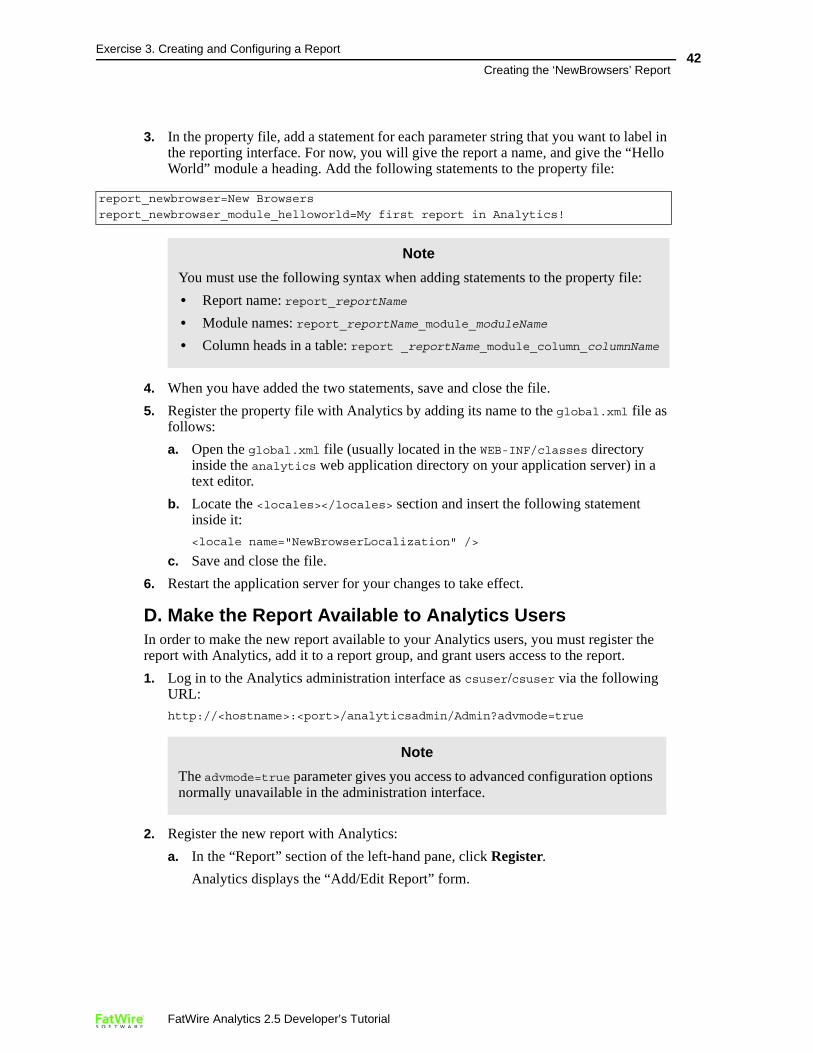
3. In the property file, add a statement for each parameter string that you want to label in the reporting interface. For now, you will give the report a name, and give the “Hello World” module a heading. Add the following statements to the property file:
4. When you have added the two statements, save and close the file.
5. Register the property file with Analytics by adding its name to the global.xml file as follows:
a. Open the global.xml file (usually located in the WEB-INF/classes directory inside the analytics web application directory on your application server) in a text editor.
b. Locate the <locales></locales> section and insert the following statement inside it:
<locale name="NewBrowserLocalization" />
c. Save and close the file.
6. Restart the application server for your changes to take effect.
D. Make the Report Available to Analytics UsersIn order to make the new report available to your Analytics users, you must register the report with Analytics, add it to a report group, and grant users access to the report.
1. Log in to the Analytics administration interface as csuser/csuser via the following URL:
http://<hostname>:<port>/analyticsadmin/Admin?advmode=true
2. Register the new report with Analytics:
a. In the “Report” section of the left-hand pane, click Register.
Analytics displays the “Add/Edit Report” form.
report_newbrowser=New Browsers
report_newbrowser_module_helloworld=My first report in Analytics!
Note
You must use the following syntax when adding statements to the property file:
• Report name: report_reportName
• Module names: report_reportName_module_moduleName
• Column heads in a table: report _reportName_module_column_columnName
Note
The advmode=true parameter gives you access to advanced configuration options normally unavailable in the administration interface.
FatWire Analytics 2.5 Developer’s Tutorial
Exercise 3. Creating and Configuring a Report
Creating the ‘NewBrowsers’ Report43
b. In the Name field, enter newbrowser.
This is the object handle for your report. The value you enter here will be used to refer to the report in code (you used this name when you labeled the components of your report in “C. Label the Report Components,” on page 41). This name will not be displayed in the reporting interface.
c. In the Config-file path field, enter report_newbrowser.xml.
d. Click Save.
3. Add the new report to the “Favorites” report group:
a. In the “Report to Reportgroup” section of the left-hand pane, click Assign.
Analytics displays the “Report Group” form.
b. In the “Report Group” drop-down list, select user.
c. In the list of reports, select the check box next to newbrowser.
d. In the “Report Group” drop-down list, select favorite.
e. In the list of reports, select the check box next to newbrowser.
f. Click Save.
4. Grant users access to the report:
a. In the “Access Rights” section of the left-hand pane, click Grant rights.
b. Analytics displays the “User Groups” form.
c. In the form, select the check box next to newbrowser.
d. Click Save.
FatWire Analytics 2.5 Developer’s Tutorial
Exercise 3. Creating and Configuring a Report
Creating the ‘NewBrowsers’ Report44
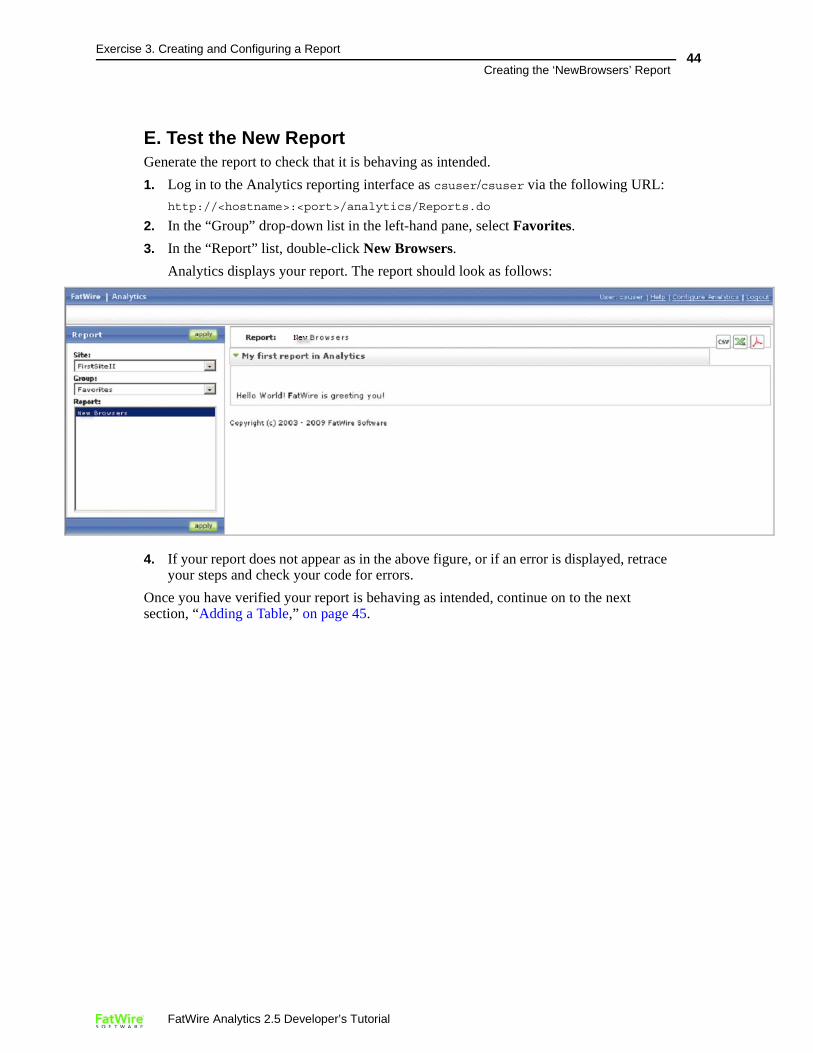
E. Test the New ReportGenerate the report to check that it is behaving as intended.
1. Log in to the Analytics reporting interface as csuser/csuser via the following URL:
http://<hostname>:<port>/analytics/Reports.do
2. In the “Group” drop-down list in the left-hand pane, select Favorites.
3. In the “Report” list, double-click New Browsers.
Analytics displays your report. The report should look as follows:
4. If your report does not appear as in the above figure, or if an error is displayed, retrace your steps and check your code for errors.
Once you have verified your report is behaving as intended, continue on to the next section, “Adding a Table,” on page 45.
FatWire Analytics 2.5 Developer’s Tutorial
Exercise 3. Creating and Configuring a Report
Creating the ‘NewBrowsers’ Report45
Adding a TableA table is the primary way of presenting data in an Analytics report. In this section, you will add a table to your “NewBrowsers” report that will display several categories of information on different browsers.
How Do I Add a Table?You add a table to your report by inserting a table module into your report’s code. A table module has two sections (as shown in the example on page 34):
• Data retrieval section (enclosed within the <sql> tag, lines 1–21 below). This section contains the SQL code that retrieves the data you want to display in your table from the Analytics database.
• Display section (enclosed within the <display> tag, lines 22–46 below). This section contains the code that formats and displays the data retrieved from the Analytics database by the code in the data retrieval section. The code in the display section defines the layout of the table and the formatting applied to each column.
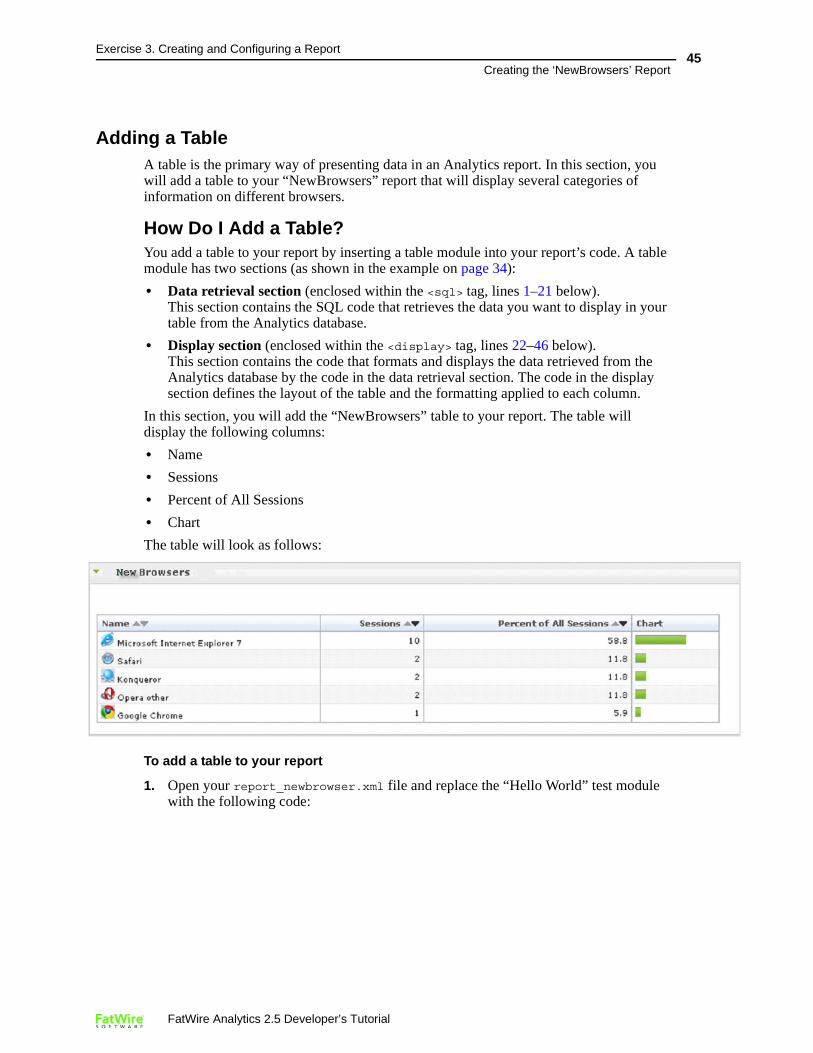
In this section, you will add the “NewBrowsers” table to your report. The table will display the following columns:
• Name
• Sessions
• Percent of All Sessions
• Chart
The table will look as follows:
To add a table to your report
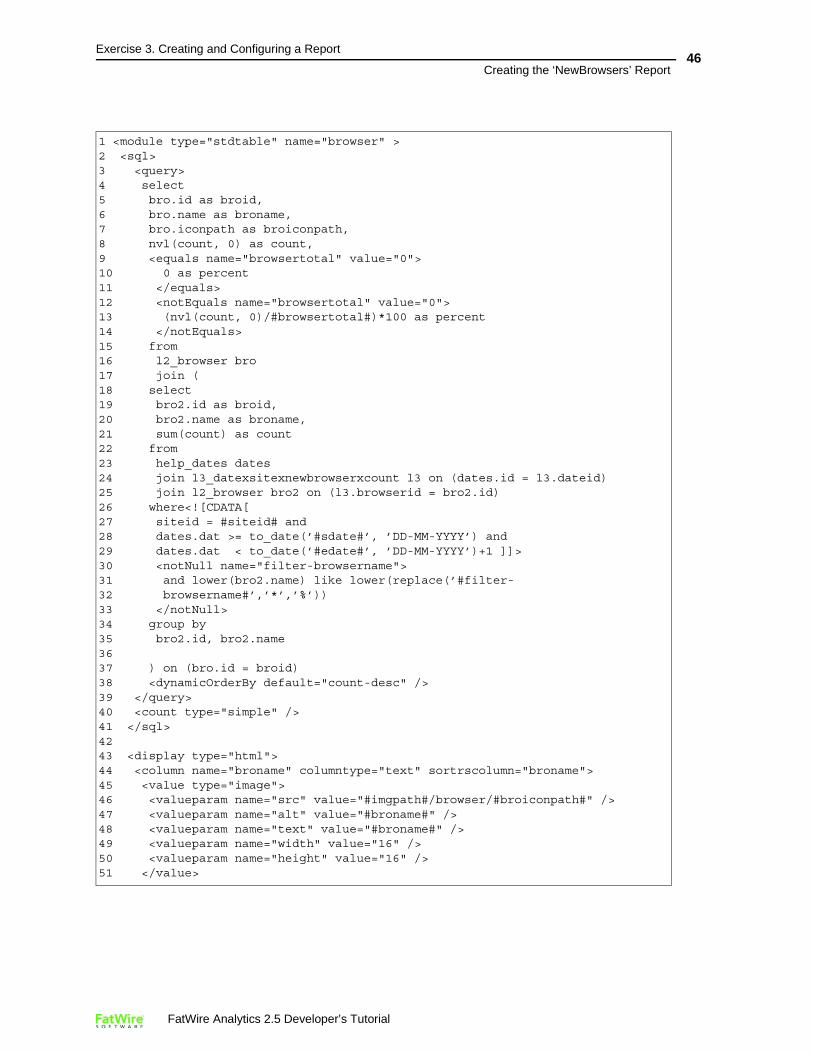
1. Open your report_newbrowser.xml file and replace the “Hello World” test module with the following code:
FatWire Analytics 2.5 Developer’s Tutorial
Exercise 3. Creating and Configuring a Report
Creating the ‘NewBrowsers’ Report46
1 <module type="stdtable" name="browser" >2 <sql>3 <query>4 select5 bro.id as broid,6 bro.name as broname,7 bro.iconpath as broiconpath,8 nvl(count, 0) as count,9 <equals name="browsertotal" value="0">10 0 as percent11 </equals>12 <notEquals name="browsertotal" value="0">13 (nvl(count, 0)/#browsertotal#)*100 as percent14 </notEquals>15 from16 l2_browser bro17 join (18 select19 bro2.id as broid,20 bro2.name as broname,21 sum(count) as count22 from23 help_dates dates24 join l3_datexsitexnewbrowserxcount l3 on (dates.id = l3.dateid)25 join l2_browser bro2 on (l3.browserid = bro2.id)26 where<![CDATA[27 siteid = #siteid# and28 dates.dat >= to_date(’#sdate#’, ’DD-MM-YYYY’) and29 dates.dat < to_date(’#edate#’, ’DD-MM-YYYY’)+1 ]]>30 <notNull name="filter-browsername">31 and lower(bro2.name) like lower(replace(’#filter-32 browsername#’,’*’,’%’))33 </notNull>34 group by35 bro2.id, bro2.name36 37 ) on (bro.id = broid)38 <dynamicOrderBy default="count-desc" />39 </query>40 <count type="simple" />41 </sql>42 43 <display type="html">44 <column name="broname" columntype="text" sortrscolumn="broname">45 <value type="image">46 <valueparam name="src" value="#imgpath#/browser/#broiconpath#" />47 <valueparam name="alt" value="#broname#" />48 <valueparam name="text" value="#broname#" />49 <valueparam name="width" value="16" />50 <valueparam name="height" value="16" />51 </value>
FatWire Analytics 2.5 Developer’s Tutorial
Exercise 3. Creating and Configuring a Report
Creating the ‘NewBrowsers’ Report47
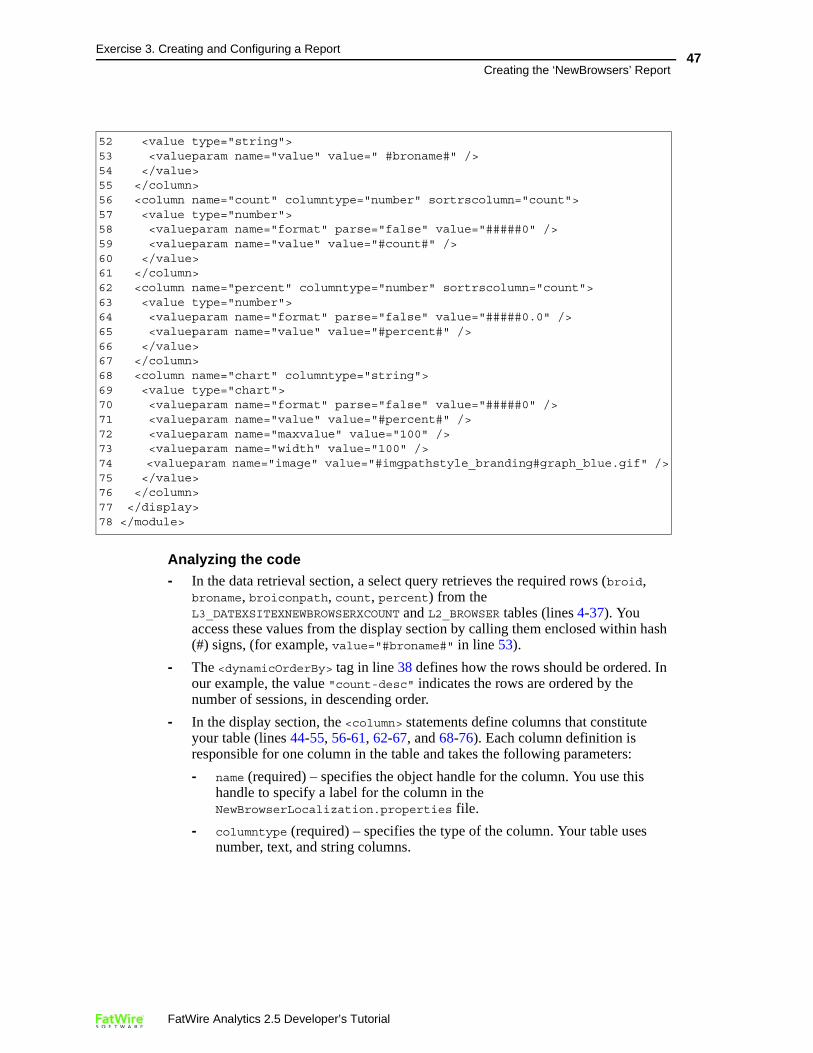
Analyzing the code- In the data retrieval section, a select query retrieves the required rows (broid,
broname, broiconpath, count, percent) from the L3_DATEXSITEXNEWBROWSERXCOUNT and L2_BROWSER tables (lines 4-37). You access these values from the display section by calling them enclosed within hash (#) signs, (for example, value="#broname#" in line 53).
- The <dynamicOrderBy> tag in line 38 defines how the rows should be ordered. In our example, the value "count-desc" indicates the rows are ordered by the number of sessions, in descending order.
- In the display section, the <column> statements define columns that constitute your table (lines 44-55, 56-61, 62-67, and 68-76). Each column definition is responsible for one column in the table and takes the following parameters:
- name (required) – specifies the object handle for the column. You use this handle to specify a label for the column in the NewBrowserLocalization.properties file.
- columntype (required) – specifies the type of the column. Your table uses number, text, and string columns.
52 <value type="string">53 <valueparam name="value" value=" #broname#" />54 </value>55 </column>56 <column name="count" columntype="number" sortrscolumn="count">57 <value type="number">58 <valueparam name="format" parse="false" value="#####0" />59 <valueparam name="value" value="#count#" />60 </value>61 </column>62 <column name="percent" columntype="number" sortrscolumn="count">63 <value type="number">64 <valueparam name="format" parse="false" value="#####0.0" />65 <valueparam name="value" value="#percent#" />66 </value>67 </column>68 <column name="chart" columntype="string">69 <value type="chart">70 <valueparam name="format" parse="false" value="#####0" />71 <valueparam name="value" value="#percent#" />72 <valueparam name="maxvalue" value="100" />73 <valueparam name="width" value="100" />74 <valueparam name="image" value="#imgpathstyle_branding#graph_blue.gif" />75 </value>76 </column>77 </display>78 </module>
FatWire Analytics 2.5 Developer’s Tutorial
Exercise 3. Creating and Configuring a Report
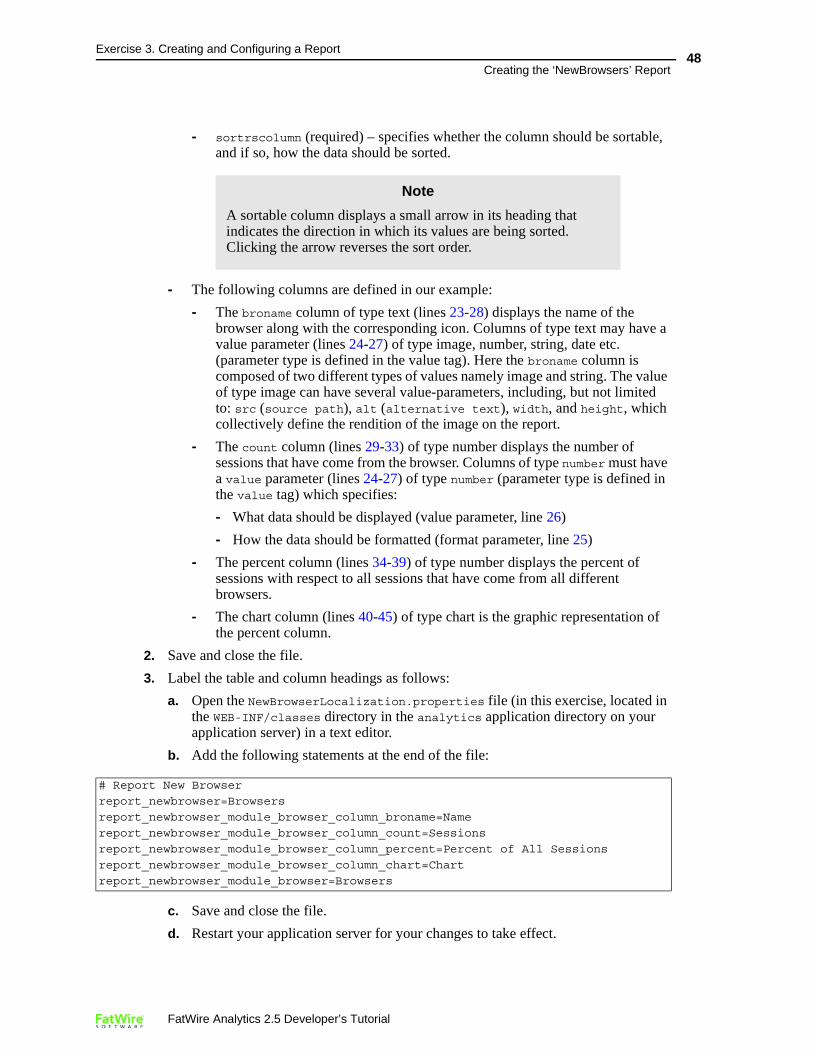
Creating the ‘NewBrowsers’ Report48
- sortrscolumn (required) – specifies whether the column should be sortable, and if so, how the data should be sorted.
- The following columns are defined in our example:
- The broname column of type text (lines 23-28) displays the name of the browser along with the corresponding icon. Columns of type text may have a value parameter (lines 24-27) of type image, number, string, date etc. (parameter type is defined in the value tag). Here the broname column is composed of two different types of values namely image and string. The value of type image can have several value-parameters, including, but not limited to: src (source path), alt (alternative text), width, and height, which collectively define the rendition of the image on the report.
- The count column (lines 29-33) of type number displays the number of sessions that have come from the browser. Columns of type number must have a value parameter (lines 24-27) of type number (parameter type is defined in the value tag) which specifies:
- What data should be displayed (value parameter, line 26)
- How the data should be formatted (format parameter, line 25)
- The percent column (lines 34-39) of type number displays the percent of sessions with respect to all sessions that have come from all different browsers.
- The chart column (lines 40-45) of type chart is the graphic representation of the percent column.
2. Save and close the file.
3. Label the table and column headings as follows:
a. Open the NewBrowserLocalization.properties file (in this exercise, located in the WEB-INF/classes directory in the analytics application directory on your application server) in a text editor.
b. Add the following statements at the end of the file:
c. Save and close the file.
d. Restart your application server for your changes to take effect.
Note
A sortable column displays a small arrow in its heading that indicates the direction in which its values are being sorted. Clicking the arrow reverses the sort order.
# Report New Browser
report_newbrowser=Browsers
report_newbrowser_module_browser_column_broname=Name
report_newbrowser_module_browser_column_count=Sessions
report_newbrowser_module_browser_column_percent=Percent of All Sessions
report_newbrowser_module_browser_column_chart=Chart
report_newbrowser_module_browser=Browsers
FatWire Analytics 2.5 Developer’s Tutorial
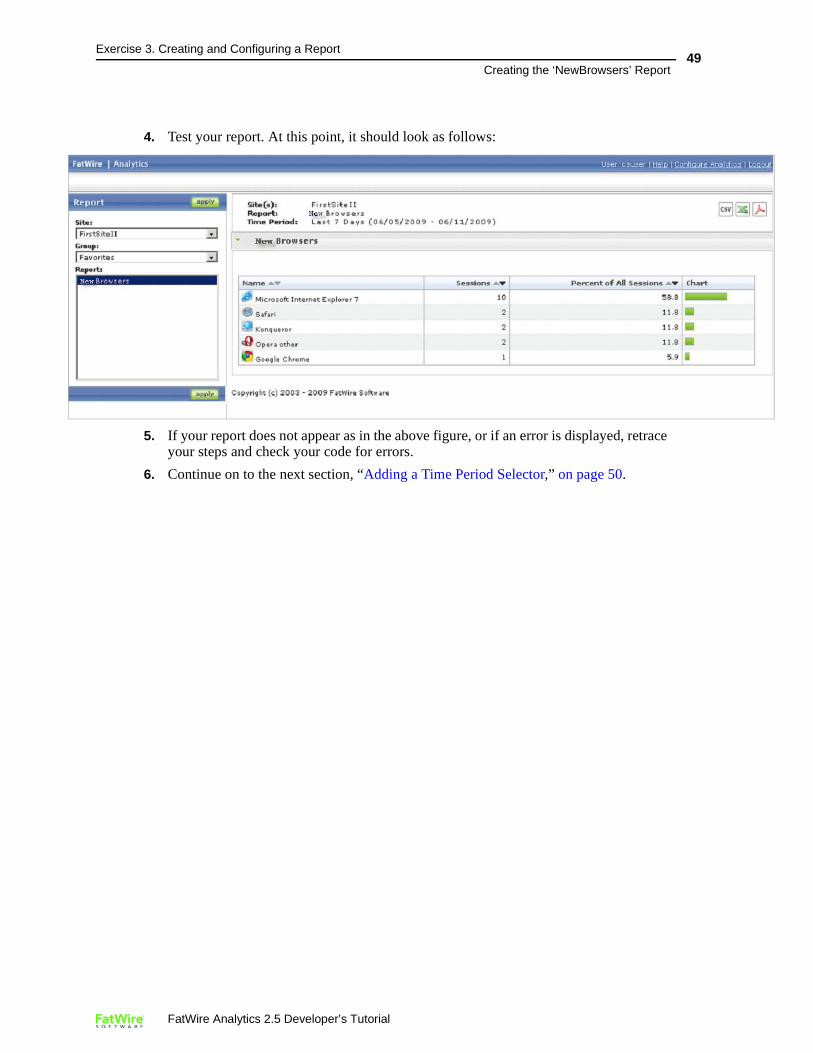
Exercise 3. Creating and Configuring a Report
Creating the ‘NewBrowsers’ Report49
4. Test your report. At this point, it should look as follows:
5. If your report does not appear as in the above figure, or if an error is displayed, retrace your steps and check your code for errors.
6. Continue on to the next section, “Adding a Time Period Selector,” on page 50.
FatWire Analytics 2.5 Developer’s Tutorial
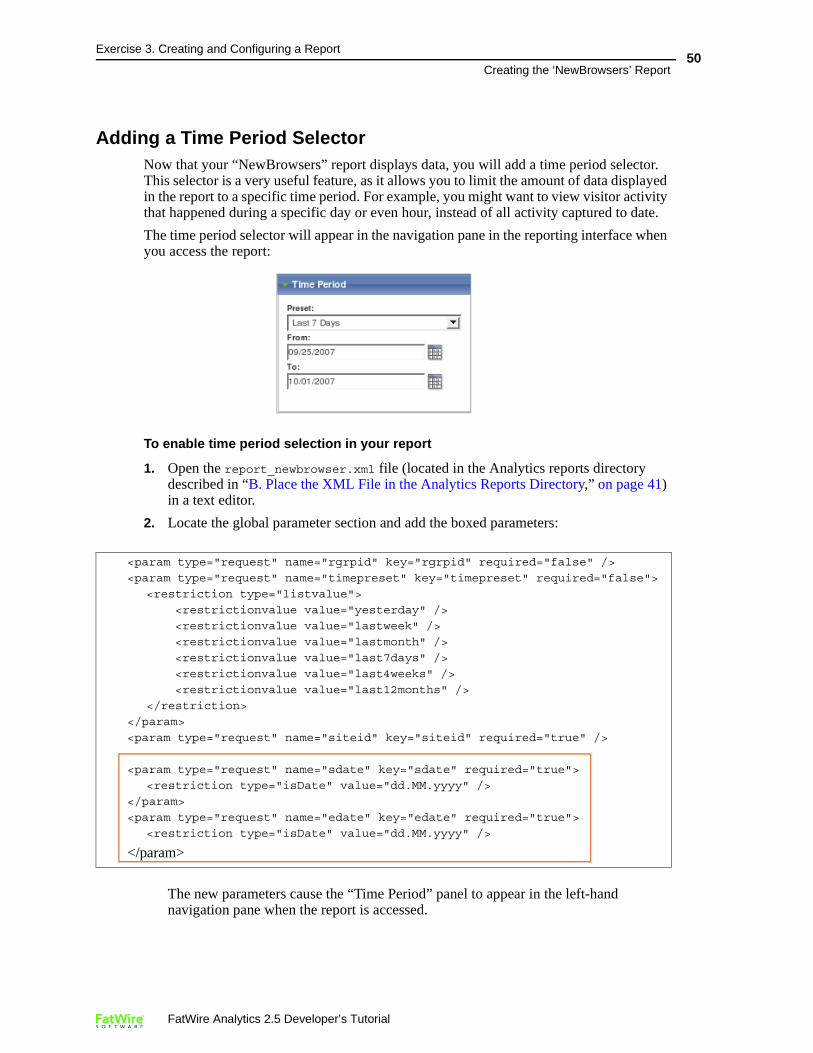
Exercise 3. Creating and Configuring a Report
Creating the ‘NewBrowsers’ Report50
Adding a Time Period SelectorNow that your “NewBrowsers” report displays data, you will add a time period selector. This selector is a very useful feature, as it allows you to limit the amount of data displayed in the report to a specific time period. For example, you might want to view visitor activity that happened during a specific day or even hour, instead of all activity captured to date.
The time period selector will appear in the navigation pane in the reporting interface when you access the report:
To enable time period selection in your report
1. Open the report_newbrowser.xml file (located in the Analytics reports directory described in “B. Place the XML File in the Analytics Reports Directory,” on page 41) in a text editor.
2. Locate the global parameter section and add the boxed parameters:
The new parameters cause the “Time Period” panel to appear in the left-hand navigation pane when the report is accessed.
<param type="request" name="rgrpid" key="rgrpid" required="false" />
<param type="request" name="timepreset" key="timepreset" required="false">
<restriction type="listvalue">
<restrictionvalue value="yesterday" />
<restrictionvalue value="lastweek" />
<restrictionvalue value="lastmonth" />
<restrictionvalue value="last7days" />
<restrictionvalue value="last4weeks" />
<restrictionvalue value="last12months" />
</restriction>
</param>
<param type="request" name="siteid" key="siteid" required="true" />
<param type="request" name="sdate" key="sdate" required="true">
<restriction type="isDate" value="dd.MM.yyyy" />
</param>
<param type="request" name="edate" key="edate" required="true">
<restriction type="isDate" value="dd.MM.yyyy" />
</param>
FatWire Analytics 2.5 Developer’s Tutorial
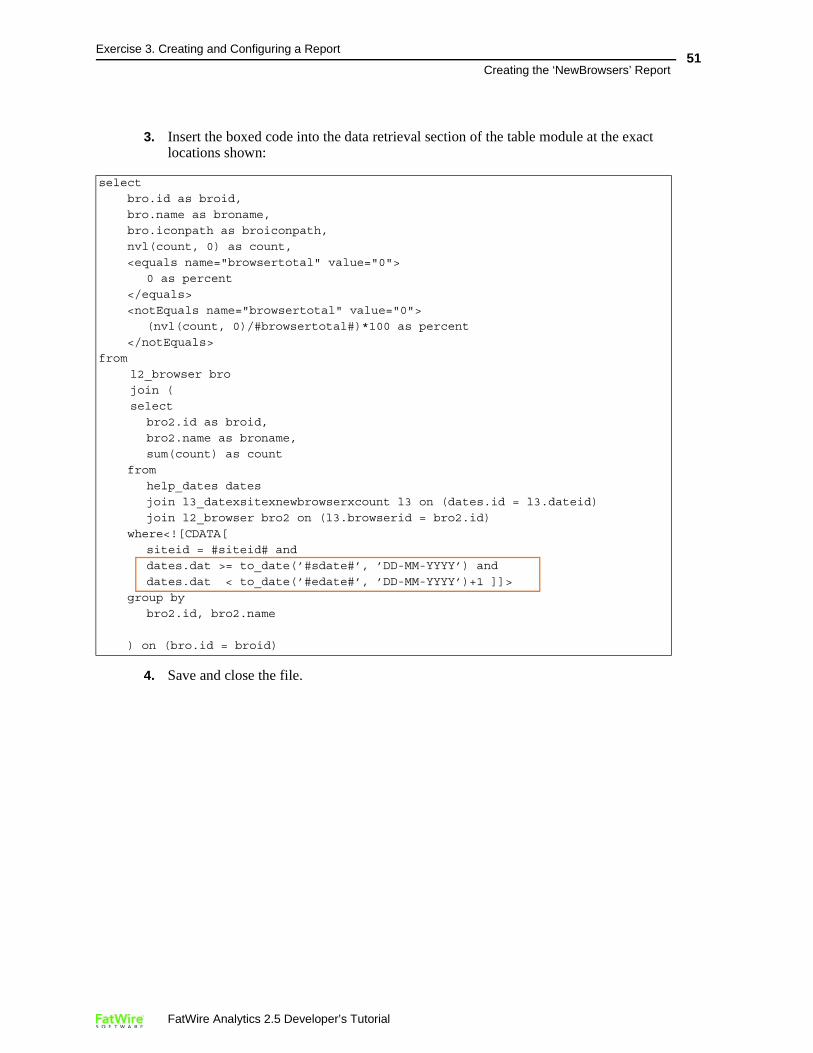
Exercise 3. Creating and Configuring a Report
Creating the ‘NewBrowsers’ Report51
3. Insert the boxed code into the data retrieval section of the table module at the exact locations shown:
4. Save and close the file.
select
bro.id as broid,
bro.name as broname,
bro.iconpath as broiconpath,
nvl(count, 0) as count,
<equals name="browsertotal" value="0">
0 as percent
</equals>
<notEquals name="browsertotal" value="0">
(nvl(count, 0)/#browsertotal#)*100 as percent
</notEquals>
from
l2_browser bro
join (
select
bro2.id as broid,
bro2.name as broname,
sum(count) as count
from
help_dates dates
join l3_datexsitexnewbrowserxcount l3 on (dates.id = l3.dateid)
join l2_browser bro2 on (l3.browserid = bro2.id)
where<![CDATA[
siteid = #siteid# and
dates.dat >= to_date(’#sdate#’, ’DD-MM-YYYY’) and
dates.dat < to_date(’#edate#’, ’DD-MM-YYYY’)+1 ]]>
group by
bro2.id, bro2.name
) on (bro.id = broid)
FatWire Analytics 2.5 Developer’s Tutorial
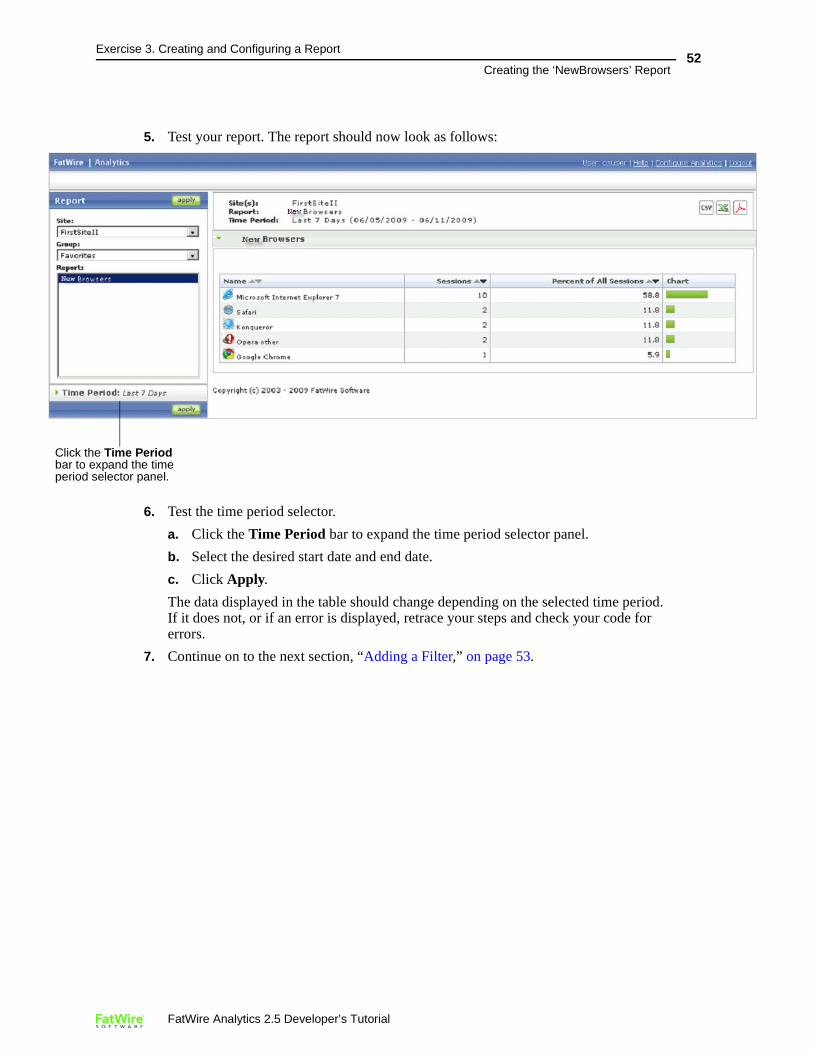
Exercise 3. Creating and Configuring a Report
Creating the ‘NewBrowsers’ Report52
Click bar toperiod
5. Test your report. The report should now look as follows:
6. Test the time period selector.
a. Click the Time Period bar to expand the time period selector panel.
b. Select the desired start date and end date.
c. Click Apply.
The data displayed in the table should change depending on the selected time period. If it does not, or if an error is displayed, retrace your steps and check your code for errors.
7. Continue on to the next section, “Adding a Filter,” on page 53.
the Time Period expand the time selector panel.
FatWire Analytics 2.5 Developer’s Tutorial
Exercise 3. Creating and Configuring a Report
Creating the ‘NewBrowsers’ Report53
Adding a FilterIn the previous section you added a time period selector to your report to enable restriction of the displayed data to a specific time period. However, what if you want to restrict the displayed data by a parameter other than time? Your solution is to add a data filter.
What Does a Filter Do?A filter module adds the “Filter by” field in the summary section of the report, and allows the users to:
• Search for a specific data point or value (for example, a specific browser).
• Restrict the displayed data to a specific range of a particular parameter (such as the number of recorded sessions)
You will add the following filter to your “NewBrowsers” report:
• A “Browser Name” filter, which will allow you to search for specific browsers or to restrict the displayed data to a specific range of browser names.
How Do I Add a Filter?To implement a filter, you must:
• Add the filter module that defines your filter(s) to the report code.
• Modify the data retrieval sections of your display modules (such as table or chart modules) to support query filtering.
To add filters to your report
1. Open the report_newbrowser.xml file (located in the Analytics reports directory described in “B. Place the XML File in the Analytics Reports Directory,” on page 41) in a text editor.
2. Add the following module code after the table module but before the closing </report> element:
Analyzing the Code
You define the filter by using a filter tag, which takes the following parameters:
- name (required) – specifies an object handle for the filter. The following conditions apply to this parameter:
- The value of this parameter must begin with filter- so that Analytics treats this definition as a filter definition.
<filter name="filter-browsername" required="false" type="text" captions="name" key="filter-browsername" />
Note
For detailed information on the tags shown in this example, and the parameters they take, see the FatWire Analytics Tag Reference.
FatWire Analytics 2.5 Developer’s Tutorial
Exercise 3. Creating and Configuring a Report
Creating the ‘NewBrowsers’ Report54
- The value must be identical to the value of the key parameter (explained below).
- required (required) – specifies whether the key parameter (explained below) must be assigned a value for the report to function. In our example, required is set to false.
- type (required) – specifies the type of the filter and, simultaneously, the filter’s input method (for example, how the filter will be presented in the reporting interface).
In this example, you are using a filter of type text, which manifests the filter as a text field into which the user can enter one or more filtering criteria. Other available types include yesno, radio, dbselect, date, and others.
- key (optional, see required above) – specifies the name used for the parameter in the URL of the report page to pass the value of the filter entered by the user when the user clicks Apply. The following conditions apply to this parameter:
- The value of this parameter must begin with filter- so that Analytics treats this definition as a filter definition.
- The value must be identical to the value of the name parameter (explained above).
Note
If either of these conditions is not met, the filter will not function.
Note
If either of these two conditions is not met, the filter will not function.
FatWire Analytics 2.5 Developer’s Tutorial

Exercise 3. Creating and Configuring a Report
Creating the ‘NewBrowsers’ Report55
3. Insert the boxed code into the data retrieval section at the exact locations shown:
Analyzing the Code- The inserted code limits the results returned by the SQL query based on the
criteria provided to the filter (for example, the filter value).
- The code inside each <notNull> tag is added to the query only if the value of the parameter called by the <notNull> tag is not null.
4. Save and close the report file. Open the NewBrowserLocalization.properties file (in this exercise, located in the WEB-INF/classes directory in the analytics application directory on your application server) in a text editor. Add the following line to the end of the file:
select
bro.id as broid,
bro.name as broname,
bro.iconpath as broiconpath,
nvl(count, 0) as count,
<equals name="browsertotal" value="0">
0 as percent
</equals>
<notEquals name="browsertotal" value="0">
(nvl(count, 0)/#browsertotal#)*100 as percent
</notEquals>
from
l2_browser bro
join (
select
bro2.id as broid,
bro2.name as broname,
sum(count) as count
from
help_dates dates
join l3_datexsitexnewbrowserxcount l3 on (dates.id = l3.dateid)
join l2_browser bro2 on (l3.browserid = bro2.id)
where<![CDATA[
siteid = #siteid# and
dates.dat >= to_date(’#sdate#’, ’DD-MM-YYYY’) and
dates.dat < to_date(’#edate#’, ’DD-MM-YYYY’)+1 ]]>
<notNull name="filter-browsername">
and lower(bro2.name) like lower(replace(’#filter-browsername#’,’*’,’%’))
</notNull>
group by
bro2.id, bro2.name
) on (bro.id = broid)
report_newbrowser_filter-browsername=Filter By Browser Name
FatWire Analytics 2.5 Developer’s Tutorial
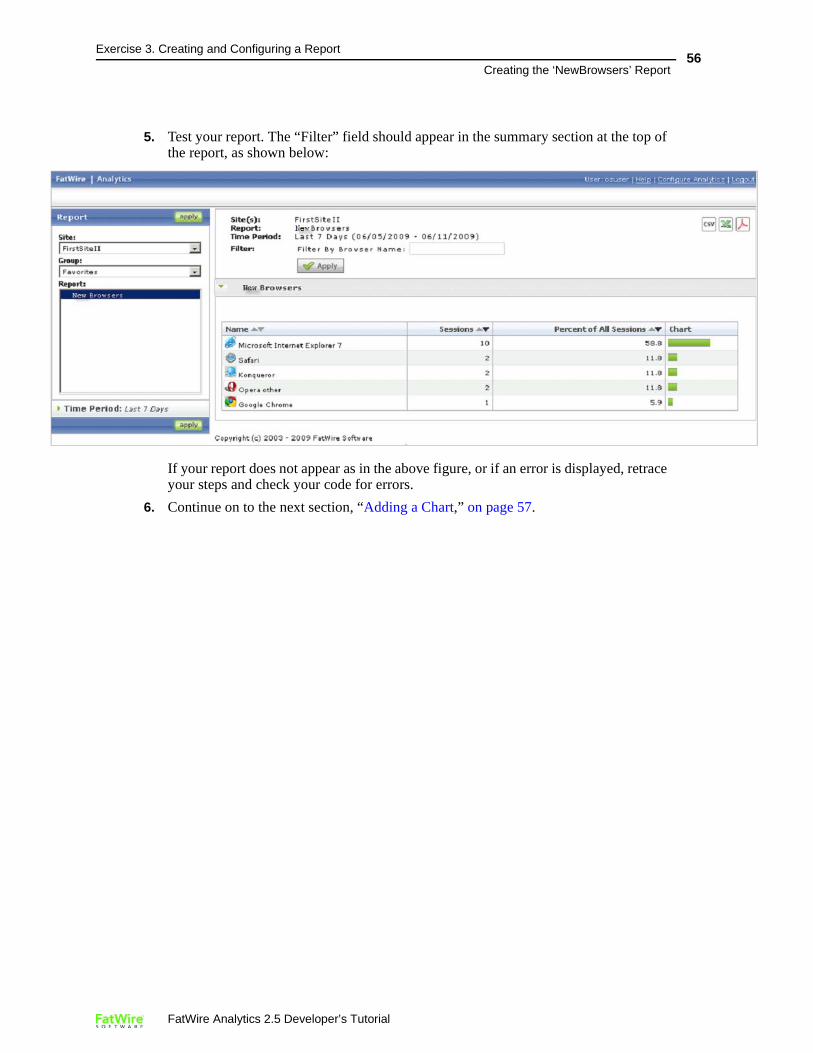
Exercise 3. Creating and Configuring a Report
Creating the ‘NewBrowsers’ Report56
5. Test your report. The “Filter” field should appear in the summary section at the top of the report, as shown below:
If your report does not appear as in the above figure, or if an error is displayed, retrace your steps and check your code for errors.
6. Continue on to the next section, “Adding a Chart,” on page 57.
FatWire Analytics 2.5 Developer’s Tutorial
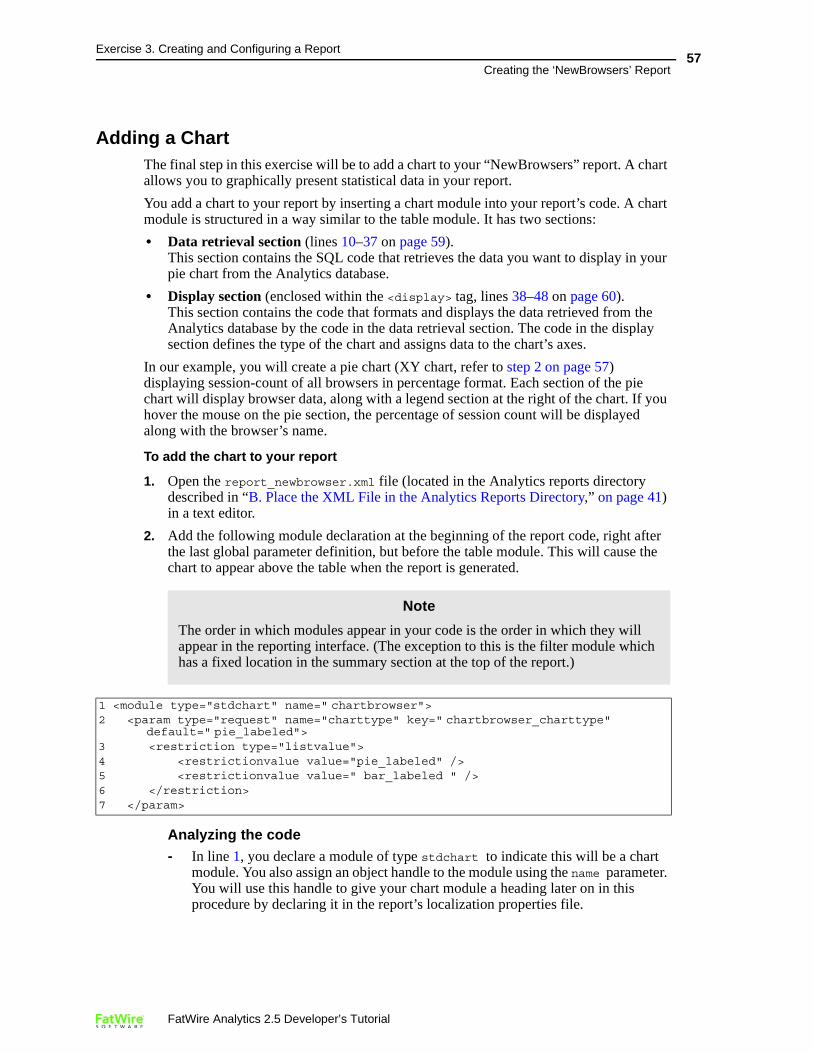
Exercise 3. Creating and Configuring a Report
Creating the ‘NewBrowsers’ Report57
Adding a ChartThe final step in this exercise will be to add a chart to your “NewBrowsers” report. A chart allows you to graphically present statistical data in your report.
You add a chart to your report by inserting a chart module into your report’s code. A chart module is structured in a way similar to the table module. It has two sections:
• Data retrieval section (lines 10–37 on page 59). This section contains the SQL code that retrieves the data you want to display in your pie chart from the Analytics database.
• Display section (enclosed within the <display> tag, lines 38–48 on page 60). This section contains the code that formats and displays the data retrieved from the Analytics database by the code in the data retrieval section. The code in the display section defines the type of the chart and assigns data to the chart’s axes.
In our example, you will create a pie chart (XY chart, refer to step 2 on page 57) displaying session-count of all browsers in percentage format. Each section of the pie chart will display browser data, along with a legend section at the right of the chart. If you hover the mouse on the pie section, the percentage of session count will be displayed along with the browser’s name.
To add the chart to your report
1. Open the report_newbrowser.xml file (located in the Analytics reports directory described in “B. Place the XML File in the Analytics Reports Directory,” on page 41) in a text editor.
2. Add the following module declaration at the beginning of the report code, right after the last global parameter definition, but before the table module. This will cause the chart to appear above the table when the report is generated.
Analyzing the code- In line 1, you declare a module of type stdchart to indicate this will be a chart
module. You also assign an object handle to the module using the name parameter. You will use this handle to give your chart module a heading later on in this procedure by declaring it in the report’s localization properties file.
Note
The order in which modules appear in your code is the order in which they will appear in the reporting interface. (The exception to this is the filter module which has a fixed location in the summary section at the top of the report.)
1 <module type="stdchart" name="�chartbrowser">2 <param type="request" name="charttype" key="�chartbrowser_charttype"
default="�pie_labeled">3 <restriction type="listvalue">4 <restrictionvalue value="pie_labeled" />5 <restrictionvalue value=" bar_labeled " />6 </restriction>7 </param>
FatWire Analytics 2.5 Developer’s Tutorial
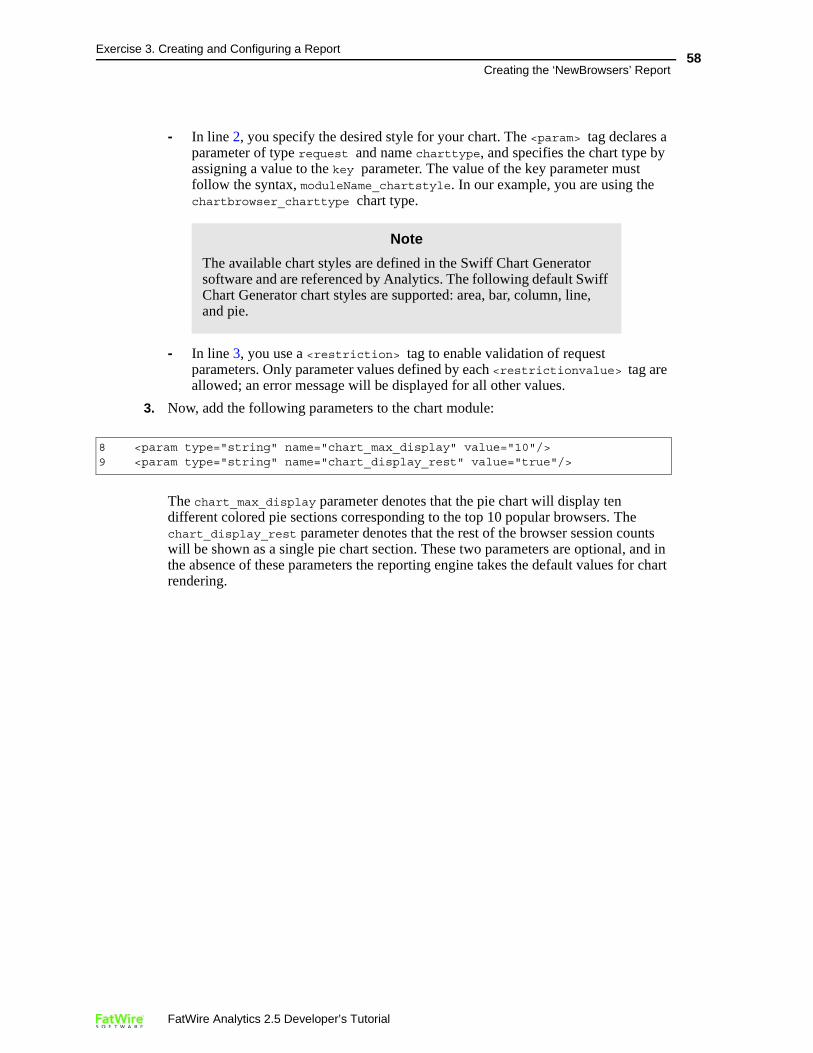
Exercise 3. Creating and Configuring a Report
Creating the ‘NewBrowsers’ Report58
- In line 2, you specify the desired style for your chart. The <param> tag declares a parameter of type request and name charttype, and specifies the chart type by assigning a value to the key parameter. The value of the key parameter must follow the syntax, moduleName_chartstyle. In our example, you are using the chartbrowser_charttype chart type.
- In line 3, you use a <restriction> tag to enable validation of request parameters. Only parameter values defined by each <restrictionvalue> tag are allowed; an error message will be displayed for all other values.
3. Now, add the following parameters to the chart module:
The chart_max_display parameter denotes that the pie chart will display ten different colored pie sections corresponding to the top 10 popular browsers. The chart_display_rest parameter denotes that the rest of the browser session counts will be shown as a single pie chart section. These two parameters are optional, and in the absence of these parameters the reporting engine takes the default values for chart rendering.
Note
The available chart styles are defined in the Swiff Chart Generator software and are referenced by Analytics. The following default Swiff Chart Generator chart styles are supported: area, bar, column, line, and pie.
8 <param type="string" name="chart_max_display" value="10"/>9 <param type="string" name="chart_display_rest" value="true"/>
FatWire Analytics 2.5 Developer’s Tutorial
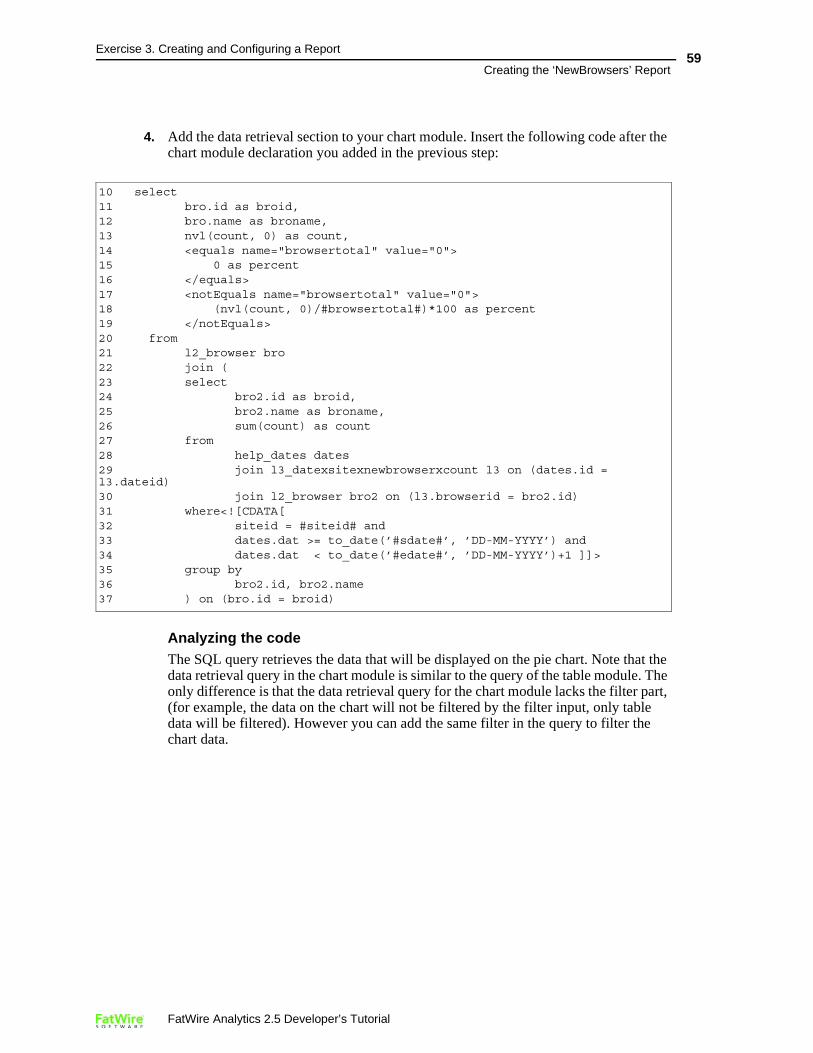
Exercise 3. Creating and Configuring a Report
Creating the ‘NewBrowsers’ Report59
4. Add the data retrieval section to your chart module. Insert the following code after the chart module declaration you added in the previous step:
Analyzing the codeThe SQL query retrieves the data that will be displayed on the pie chart. Note that the data retrieval query in the chart module is similar to the query of the table module. The only difference is that the data retrieval query for the chart module lacks the filter part, (for example, the data on the chart will not be filtered by the filter input, only table data will be filtered). However you can add the same filter in the query to filter the chart data.
10 select11 bro.id as broid,12 bro.name as broname,13 nvl(count, 0) as count,14 <equals name="browsertotal" value="0">15 0 as percent16 </equals>17 <notEquals name="browsertotal" value="0">18 (nvl(count, 0)/#browsertotal#)*100 as percent19 </notEquals>20 from21 l2_browser bro22 join (23 select24 bro2.id as broid,25 bro2.name as broname,26 sum(count) as count27 from28 help_dates dates29 join l3_datexsitexnewbrowserxcount l3 on (dates.id = l3.dateid)30 join l2_browser bro2 on (l3.browserid = bro2.id)31 where<![CDATA[32 siteid = #siteid# and33 dates.dat >= to_date(’#sdate#’, ’DD-MM-YYYY’) and34 dates.dat < to_date(’#edate#’, ’DD-MM-YYYY’)+1 ]]>35 group by36 bro2.id, bro2.name37 ) on (bro.id = broid)
FatWire Analytics 2.5 Developer’s Tutorial
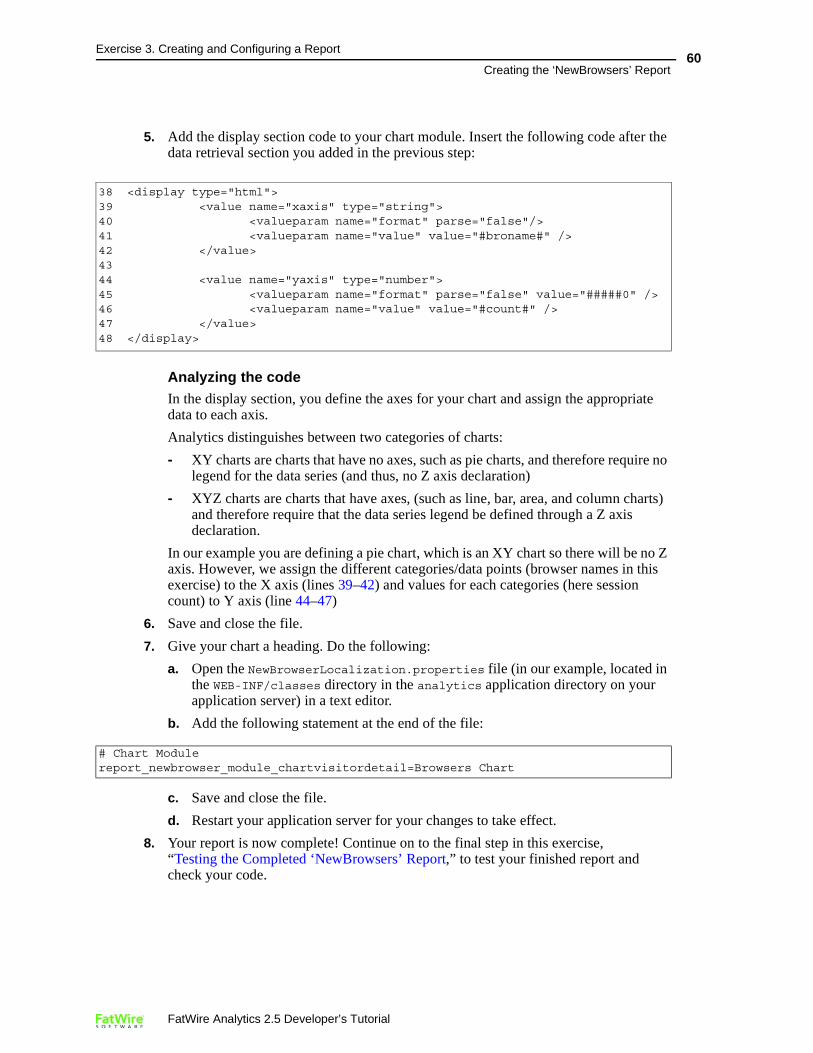
Exercise 3. Creating and Configuring a Report
Creating the ‘NewBrowsers’ Report60
5. Add the display section code to your chart module. Insert the following code after the data retrieval section you added in the previous step:
Analyzing the codeIn the display section, you define the axes for your chart and assign the appropriate data to each axis.
Analytics distinguishes between two categories of charts:
- XY charts are charts that have no axes, such as pie charts, and therefore require no legend for the data series (and thus, no Z axis declaration)
- XYZ charts are charts that have axes, (such as line, bar, area, and column charts) and therefore require that the data series legend be defined through a Z axis declaration.
In our example you are defining a pie chart, which is an XY chart so there will be no Z axis. However, we assign the different categories/data points (browser names in this exercise) to the X axis (lines 39–42) and values for each categories (here session count) to Y axis (line 44–47)
6. Save and close the file.
7. Give your chart a heading. Do the following:
a. Open the NewBrowserLocalization.properties file (in our example, located in the WEB-INF/classes directory in the analytics application directory on your application server) in a text editor.
b. Add the following statement at the end of the file:
c. Save and close the file.
d. Restart your application server for your changes to take effect.
8. Your report is now complete! Continue on to the final step in this exercise, “Testing the Completed ‘NewBrowsers’ Report,” to test your finished report and check your code.
38 <display type="html">39 <value name="xaxis" type="string">40 <valueparam name="format" parse="false"/>41 <valueparam name="value" value="#broname#" />42 </value>43 44 <value name="yaxis" type="number">45 <valueparam name="format" parse="false" value="#####0" />46 <valueparam name="value" value="#count#" />47 </value>48 </display>
# Chart Modulereport_newbrowser_module_chartvisitordetail=Browsers Chart
FatWire Analytics 2.5 Developer’s Tutorial
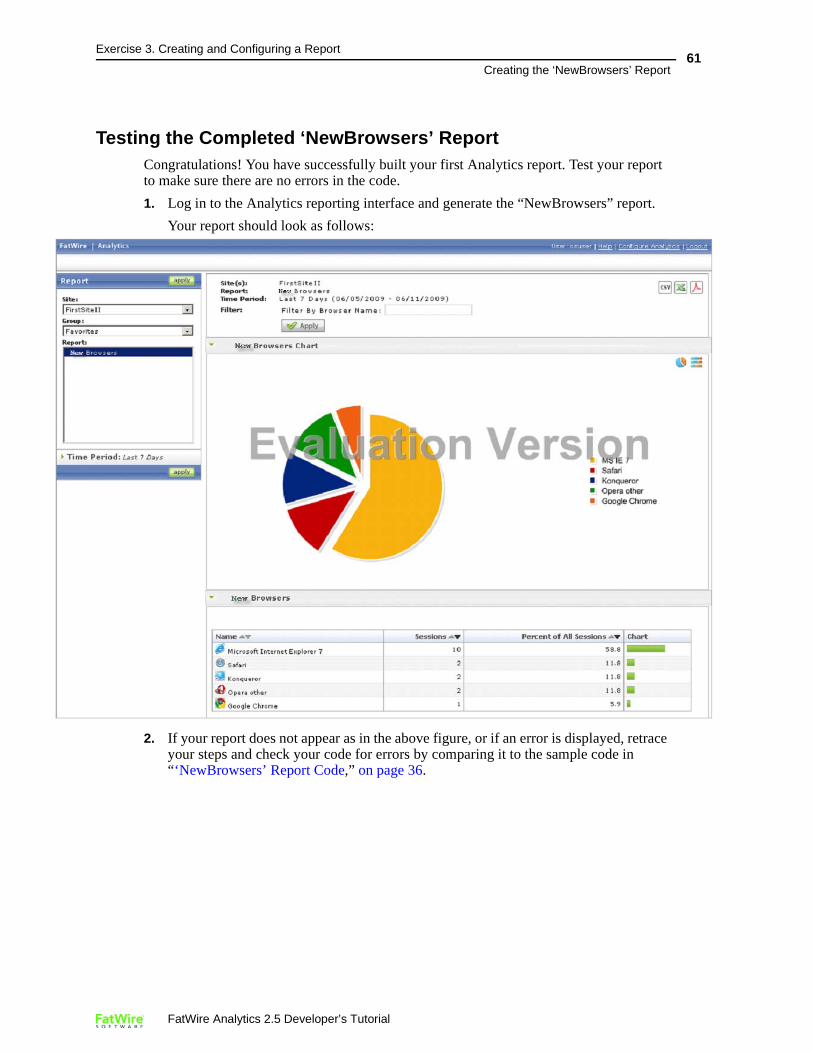
Exercise 3. Creating and Configuring a Report
Creating the ‘NewBrowsers’ Report61
Testing the Completed ‘NewBrowsers’ ReportCongratulations! You have successfully built your first Analytics report. Test your report to make sure there are no errors in the code.
1. Log in to the Analytics reporting interface and generate the “NewBrowsers” report.
Your report should look as follows:
2. If your report does not appear as in the above figure, or if an error is displayed, retrace your steps and check your code for errors by comparing it to the sample code in “‘NewBrowsers’ Report Code,” on page 36.
FatWire Analytics 2.5 Developer’s Tutorial

Exercise 3. Creating and Configuring a Report
Creating the ‘NewBrowsers’ Report62
FatWire Analytics 2.5 Developer’s Tutorial


