

DEVELOPMENT AND INFRASTRUCTURE
SERVICES
ANNUAL STATUS AND OPTIONS REPORT
2017
Author Traffic and Development Manager
Owner Head of Roads & Amenity Services
Date January 2017
Version 2.2

2
Execu ve Summary
Introduc on
The Annual Status and Op ons Report is a product of our Roads Asset Management plan which records the level
of service the Council is aiming to achieve and provides a means of iden fying and priori sing the overall
funding needs of our road assets.
The Report presents a summary of the Council’s roads assets as of April 2017. It details the current condi on of
the asset, future investment op ons and the impact of these op ons.
Asset groups considered are; Carriageways, Footways, Street Ligh ng, Bridges and Structures. Inventory
collec on and condi on assessments provide detail on the extent of the area’s roads infrastructure and the
impact recent investments have had on its condi on.
Roads infrastructure deteriora on can be slow and o en goes unno ced, meaning that the impact of invest-
ment cannot be assessed in the short term. The investment op ons presented consider the projected impact
over a 20 year period. This allows decisions to be taken with an understanding of medium and long term
implica ons.
The financial tools used to develop forecasts consider the exis ng condi on of our infrastructure and scope the
remedial costs of network improvement. It should be noted that no allowance has been made for construc on
infla on; forecasts are based upon today’s prices.
Current Status and Key Issues
Carriageway
2310 km of carriageway.
The Road Condi on Index (RCI) has improved slowly since 2010 as a result of several years of increased capital
investment. Reduced investment in the last 2 years has seen this improvement slow, however we have
maintained a steady RCI with effec ve use of treatments which are aimed at hal ng deteriora on at an early
stage in the lifecycle of the road.
Deteriora on of the roads network is compounded by increased levels of heavy traffic and a rela vely high level
of u lity excava ons. The RCI (Road Condi on Index) survey results indicates that 54.2% of the carriageway
network should be considered for treatment.
The steady state requirement of £10.1 million per year is unlikely to be met in the next few years. There is a
high risk that the improvement we have seen in the RCI will not be sustainable in the long term. The steady
state and backlog figures have been produced na onally. There are currently no similar figures available for
footways, bridges and ligh ng
Footway
529 km of footway
A significant percentage of our footways are considered to be in poor condi on and 55.7% of the footway
network should be considered for treatments. A new and enhanced inspec on regime for footways is now in
place and this will more readily iden fy areas requiring improvement.
An industry standard full footway condi on survey is being considered for 2017/18 and addi onal capital
investment of £500k has been allocated for footway schemes that will be completed 2017/18.

3
Street Ligh ng
There are 13, 506 street ligh ng columns and 14,447 luminaires across Argyll and Bute. 35% of these columns
have exceeded their expected service life.
Electricity costs will con nue to rise over the coming years however the council have embarked on an LED
street ligh ng replacement project changing all exis ng lanterns to new energy efficient LED ligh ng with a
comple on date of the end of March 2018, thus leading to lower energy costs and a reduc on in our carbon foot
print.
Some of the savings from the LED project will contribute to a column replacement programme.
Structures
889 Bridges and 1643 retaining walls.
18 of our bridges have temporary weight restric ons in place as a measure to reduce loadings and protect these
structures.
Currently the budget for 2017/18 financial year is £69k with limited budget available for future years given the
overall budget forecast.
We have seen an increase in the number of emergency works required on bridges in the past year. This is a
consequence of a number of factors including larger heavier vehicles using road network and bridges, the age of
many of the structures and the limited budget available for planned maintenance and/or replacement of these
structures.
Summary
The Carriageway, Footway, Ligh ng and Structures assets are currently in a safe and serviceable condi on.
Maintenance op ons and steady state requirements indicate that the current investment in the network is
insufficient to maintain standards indefinitely.
With reducing budgets and resources we con nue to invest as effec vely as possible to reduce immediate
deteriora on and make use of every available funding opportunity.
The roads network is a key asset for Argyll and Bute and is cri cal to suppor ng economic development. Every
effort should be made to safeguard its future .

4
STATUS AND OPTIONS REPORT 2017
Table of Contents
Carriageway 1.0 Status 5
1.1 Investment Op ons 6
1.2 Road Condi on 7
1.3 Investment and Hierarchy 8
1.4 Road Deteriora on 9
Footway 2.0 Status 10
2.1 Hierarchy and Inspec ons 11
Ligh ng 3.0 Status 12
3.1 LED Program 13
Structures 4.0 Status 14
Funding 5.0 Addi onal Projects 15

5
1.0 CARRIAGEWAYS
Road Length
A Class Roads 502km
B Class Roads 614km
C Class Roads 435km
Unclassified Roads 2,304km
The table above shows that nearly one third of our network is
made up of unclassified roads (U Class). Most of the carriage-
way is rural with over 80% of the network in rural areas.
Road Condi on
Road condi on is measured by the Sco sh Road Maintenance
Condi on Survey (SRMCS) that assess parameters such as
surface texture and cracking, smoothness and ru ng. This
provides an indica on of the residual life of the road structure.
The results show in the last year the percentage of roads
assessed as red has increased from 14.75% to 15.07% however,
in the same period the percentage of green has increased from
45.6% to 45.79%. This shows improvement and provides
confirma on on the effec ve delivery of the roads reconstruc-
on programme.
Road Construc on
23% of our roads are constructed on peat. These incur greater
construc on and maintenance costs and may require
restric ons on the weight of vehicles using the road.
New and innova ve approaches in road maintenance
techniques are being be considered in these se ngs. Tech-
niques such as recycling exis ng materials with the addi on of
some new stone and bitumen having been successfully carried
out in a number of loca ons. This saves transport costs and also
reduces the environmental impact of repairing roads by reduc-
ing the amount of new material required.
The table to the le taken from the Asset Valua on return
2016/17 indicates a total Gross Replacement cost of £2,034m
for our carriageway asset.

6
1.1 CARRIAGEWAY INVESTMENT OPTIONS
OPTION 1 ‐ £5M
An annual investment of £5m would lead to no
improvement on overall RCI with 53% of our roads
requiring a en on a er 20 years and a significant
increase in the percentage of roads in the red
category. The volume of reac ve temporary repairs
would steadily rise year on year as would public liability
claims. Customer sa sfac on levels can be expected to
steadily decrease.
OPTION 2 ‐ £8M
An annual investment of £8m would lead to slight
improvement with 37% of our roads requiring a en on
a er 20 years, however the percentage of roads
categorised as red would increase slightly. The volume
of reac ve temporary repairs should decrease apart
from on the roads of poorest condi on. Customer
sa sfac on levels could improve as more roads would
be categorised as green.
OPTION 3 ‐ £11M
An annual investment of £11m would lead to a
significant improvement with only 23% of our roads
requiring a en on a er 20 years. The volume of
reac ve temporary repairs would reduce as would
public liability claims. Customer sa sfac on levels
would also improve significantly.
OPTION 4 ‐ £1.5M for 3 years then £8M
An annual investment of £1.5m for the next 3 years
followed by £8million for the next 17 years would lead
to a significant deteriora on ini ally for the first 3 years
with 58% of our roads requiring a en on decreasing to
41% requiring a en on a er the 20 years. For the first
3 years reac ve temporary repairs would increase but
then start to decrease as would the public liability
claims.

7
1.2 ROAD CONDITION
RCI Projec ons
This diagram shows the effect of the different invest-
ment op ons over a 20 year period i.e. the total per-
centage of roads requiring a en on (the lower the %
the be er condi on the road—small number is good).
Op on 3 shows the greatest improvement. Op ons
2 and 4 also show improvement however it should be
noted that in all op ons apart from Op on 3 the red
category roads increase - this is shown in the second
graph.
Op on 4 shows an ini al worsening in condi on due to
reduced budget with an improving picture as budgets
are predicted to increase in future years.
An increase in roads in the red category will lead to an
increase in maintenance requirements for those roads.
This diagram demonstrates the effect the different
investment op ons would have on the red condi on
roads. Over 20 years , Op on 3 reduces the red condi-
on roads significantly to only 12% of our network.
The following table shows a summary of the results of each op on, green indicates an improving situa on:
Maintenance Backlog ‐ £101 million
The Sco sh Road Maintenance Condi on Survey (SRMCS) is used to annual to determine a Road Condi on Indicator
(RCI) value for each local authority road network. From these results SCOTS calculate the Maintenance Backlog for each
authority every second year. The Maintenance Backlog is the cost of achieving in one year a network free from any sec-
ons in an amber or red condi on using the latest survey date.
The Maintenance Backlog calculated in 2017 for Argyll and Bute is £101 million (Data source—SCOTS backlog Modelling
Report March 2017). This figure has reduced from previous years following research having been carried out resul ng
in adjustments at a na onal level to financial assump ons and the rates applied for repair works. These changes apply
to all councils in Scotland. However, whilst this figure has reduced there is s ll a very significant backlog of over £100
million to bring our roads up to an ideal standard.
Steady State ‐ £10.1 million
This is the amount of investment required to maintain our roads to a steady state.
Op on 1 Op on 2 Op on 3 Op on 4
Overall RCI Steady State 55% Significant Im-provement (37%)
Significant Im-provement (23%)
Slight improve-ment (41%)
% Green The same (45%) Improved (63%) Significantly improved (74%)
Improved (59%)
% Red Significant deterio-ra on (30%)
Some Deteriora-on (20%)
Slight improve-ment (12%)
Deteriora on (24%)
Reac ve Mainte-nance
Increased mainte-nance require-ments
less maintenance requirements
less maintenance requirements
Ini ally increased maintenance re-quirements-less longer term

8
1.3 CARRIAGEWAY INVESTMENT & HIERARCHY
Historical Investment
This diagram shows the carriageway spend (in £
Millions) for capital and revenue works over
the last 8 years.
Insurance Claims
Following an increase of claims against the council
in years 2012 to 2015 there is now evidence of a
decrease in the number of claims rela ng to roads
faults. An enhanced carriageway inspec on regime
may have played a part in ensuring that early
iden fica on and interven on sees us dealing with
faults prior to them becoming issues for road users.
The enhanced inspec on regime is the result of col-
labora ve work of a number of councils. The claims
graph is referring to £thousands in claim value.
Feature Descrip on Category Inspec on Frequency
Roads Strategic Routes Main Distributor Secondary Distributor Link Road Local Access Routes All other loca ons (car parks)
2 3(a) 3(b) 4(a) 4(b)
Up to 12 pa (Min 10) Up to 12 pa (Min 10) Up to 12 pa (Min 10) 4 pa Annually Annually
Carriageway Category
Hierarchy Descrip on Type of Road Descrip on
1 Motorway N/A N/A
2 Strategic Route Principal A Roads Routes for fast moving long distance with li le pedestrian traffic. Speed limits generally excess of 40mph
3a Main Distributor Major Urban Network and Inter Primary Links
Routes between strategic routes and linking urban centres to the strategic network
3b Secondary Distributor Classified Roads (B & C Class) In rural areas these roads link the strategic and main distrib-utor network.30 mph speed limits and high pedestrian ac vi-ty
4a Link Road Roads linking the Main and Sec-ondary Distributor
In rural areas these roads link the smaller villages to distribu-tor roads
4b Local Access Road Roads serving limited numbers of proper es carrying only access traffic
They are o en single lane and unsuitable for HGV
Carriageway Hierarchy and Frequency of
Inspec ons
The tables here refer to our inspec on regime
and the frequency of inspec on. A roads
posi on or hierarchy category will determine
how o en the road is inspected. We have no
category 1 roads (motorways).

9
1.4 ROAD DETERIORATION
In Argyll and Bute the road network covers a large
area – 2321km to be specific. It is used daily by the
majority of our residents and businesses and is
fundamental to social, economic and the
environmental wellbeing of our community.
Maintaining roads is vital for our road users ensur-
ing safe travel and network availability.
This picture shows an A class road with a recently
increased volume of traffic where mber extrac on
opera ons mber and fish farms ac vi es have
taken their toll. It’s the main route to Portavadie
Marina - a major tourist a rac on in the Cowal
area and also provides access to Portavadie /
Tarbert Ferry route.
The condi on of the road is a concern especially in
the event of severe winter weather. Water ingress
can lead to a freeze thaw cycle. And further
deteriora on. The crazing of this bituminous road
surface is very apparent in the picture. This is typi-
cal of many roads across Argyll and Bute.
.

10
2.0 FOOTWAY STATUS
Footway Length
Total Footway Length 512km
Total Footpath Length 9.19km
Footway Condi on
44 % of the overall footway network is currently
maintained at a sa sfactory condi on.
Excellent Condi on 5.3%
Good Condi on 39.2
Poor condi on 42.1
Defec ve/
In need of work 13.4%
FOOTWAY INVESTMENT
Last year (2016/17) £280,416 was spent on
planned maintenance for footways.
Industry standard condi on footway surveys are
planned for this year (2017/18) and £500,000
footway capital investment program will deliver
improvements in 17/18.
Table to the le taken from the Asset Valua on
return 2016/17 indicates a total Gross
Replacement cost £88,948,162 for our footway
asset.
Footway—adjacent to the
carriageway
Footpath—remote from
the carriageway
11
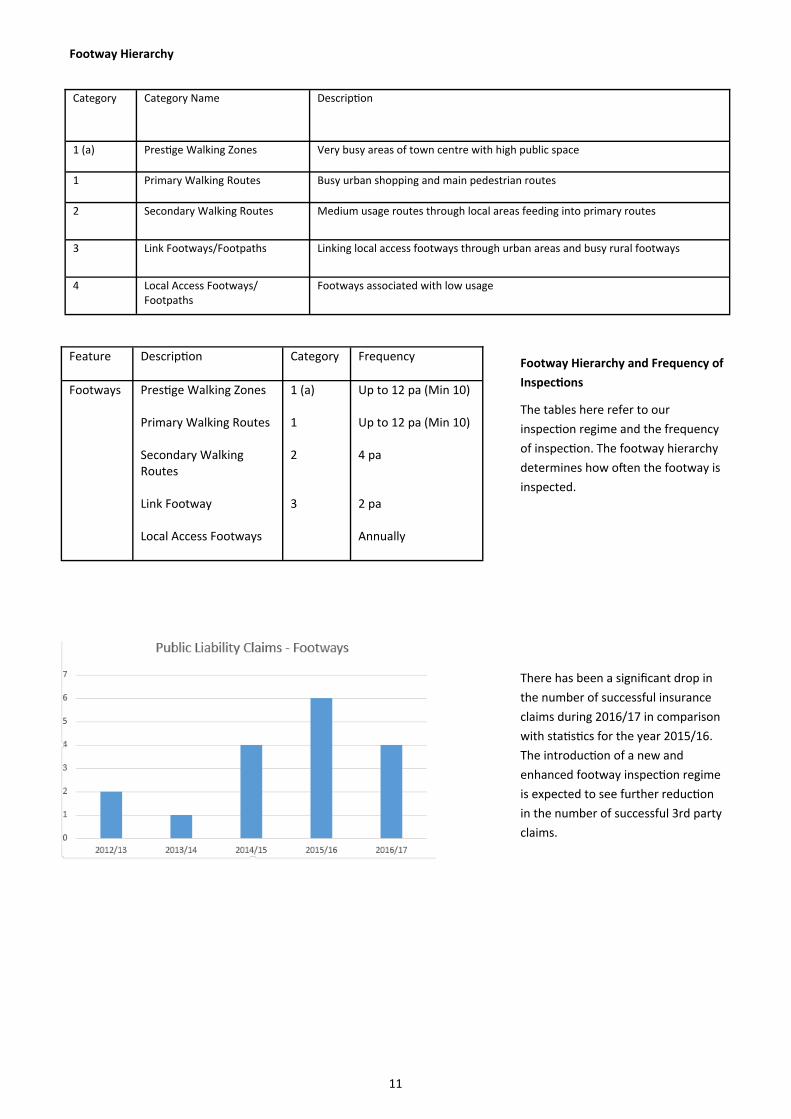
Footway Hierarchy and Frequency of
Inspec ons
The tables here refer to our
inspec on regime and the frequency
of inspec on. The footway hierarchy
determines how o en the footway is
inspected.
There has been a significant drop in
the number of successful insurance
claims during 2016/17 in comparison
with sta s cs for the year 2015/16.
The introduc on of a new and
enhanced footway inspec on regime
is expected to see further reduc on
in the number of successful 3rd party
claims.
Feature Descrip on Category Frequency
Footways Pres ge Walking Zones Primary Walking Routes Secondary Walking Routes Link Footway Local Access Footways
1 (a) 1 2 3
Up to 12 pa (Min 10) Up to 12 pa (Min 10) 4 pa 2 pa Annually
Category Category Name Descrip on
1 (a) Pres ge Walking Zones Very busy areas of town centre with high public space
1 Primary Walking Routes Busy urban shopping and main pedestrian routes
2 Secondary Walking Routes Medium usage routes through local areas feeding into primary routes
3 Link Footways/Footpaths Linking local access footways through urban areas and busy rural footways
4 Local Access Footways/Footpaths
Footways associated with low usage
Footway Hierarchy

12
3.0 STREETLIGHTING STATUS
Ligh ng Columns 13681
Cable Length 4520 km
Condi on
Over 35% of our ligh ng columns have
exceeded their service life. As the LED
replacement progresses the condi on of
each column is recorded and from this
informa on a column replacement
programme of works will be developed. At
the end of the LED replacement, when a full
column condi on survey has been complet-
ed a replacement programme will follow
based on a priori sed approach.
Historical investment in ligh ng is shown in
the graph to the le .
Lower investment in previous years has
impacted on reac ve maintenance costs
and has a ributed to more columns exceed-
ing their expected service life. Further work
needs to be undertaken to understand the
rela onship between street ligh ng asset
(column) age/condi on and corresponding
reac ve maintenance costs.
Customer Sa sfac on
There has been a significant rise in customer
enquiries last year. This is caused in part by
the reducing investment over the last few
years. Comple on of the LED replacement
program across the Council’s network
should see this number decrease in future
years. LEDs have a longer life than conven-
onal luminaires reducing dark lamps and
the need for rou ne maintenance is ex-
pected to reduce accordingly.

13
3.1 LED PROJECT
A programme to replace old SOX and
SON ligh ng with new energy efficient
(LED) luminaires has commenced and all
of the council’s ligh ng network should
be converted to LED by April/May 2018.
Already the difference in the electricity
costs are recognised and we will
con nue to make savings as the project
progresses. LED’s are more resilient, use
less energy and have a longer lifecycle.
Some of the savings generated through
the LED project will fund column
replacements and electrical upgrade
projects for our street ligh ng network.
The graph to the le shows the
electricity costs from 2015 to date.
Since the LED project started in 2017 a
clear reduc on in costs can be seen and
this will grow as the project progresses.

14
4.0 STRUCTURES STATUS
Assets
1,229 Bridges and Structures
1643 Retaining Walls
329 Culverts
2 Unusual Structures
Condi on
Our bridges and structures are inspected and
assessed to comply with the Management of High-
way Structures Code of Prac se.
27 council owned and maintained bridges as well
as 4 privately owned bridges failed assessment
under European Standards.
The average BCI value is 88.45
The latest Bridge Stock Condi on index (overall
condi on) indicates the condi on is falling slowly
indica ng stock is deteriora ng.
The inspec on regime applied to the structures
stock for 2016/17 as illustrated here.
Weight Restric ons
The number of weight restricted bridges and
retaining walls has been managed by a program of
strengthening and replacement works and the
established inspec on regime.
Currently Knock Bridge, Mull has no weight
restric on but the road itself has a 33 tonne
restric on on it due to the condi on of the road as
opposed to problems with the strength of the
bridge.
Gross Replacement Costs £528,566,009

15
ADDITIONAL PROJECTS
STTS Co—Funding Schemes
The Strategic Timber Transport Group were awarded a significantly increased award this year some of which will be used to
develop projects throughout the year, working with Argyll and Bute Council to iden fy mber haulage routes in need of
maintenance or repair. The STTG was introduced in 2005 to facilitate the sustainable transport of mber in the rural areas of
Scotland for the benefit of local communi es and the environment. In previous years STTG have co-financed a number of
works in Argyll and Bute including major improvements, road widening and passing place improvements on the B836 and the
B828 Glenmhor. Argyll and Bute Council are one of the beneficiaries of the STTG’s co-funding support and £554k will be
made available for four public road projects during 2017/18.
SUSTRANS—Hermitage Park Path and Cycle Network Project
Argyll and Bute Council are crea ng a path and cycle network through Helensburgh's Hermitage Park in partnership with the
local community. This will significantly improve and encourage cycling and walking access and develop a convenient and
a rac ve travel link through the park to local ameni es. The project will include the complete overhaul of the main path
network that directly connects the four main entry and exit points, which are located at the north, south, east and west
points of the park. It will provide key links to a broader network of paths and cycle-ways in the area, including the John Muir
Way and cycle path along Sinclair Street, which links to Regional Cycle Route 40 and in turn to NCR 7. Provision of a com-
bined path and cycleway through the park will improve opportuni es and encourage residents, be they commuters, school
pupils or visitors to Helensburgh.

16
Annual Status and Op ons Report ‐ Summary
The Carriageway, Footway, Ligh ng and Structures assets are currently in a safe and serviceable condi on.
Maintenance op ons and steady state requirements indicate that the current investment in the network is
insufficient to maintain standards indefinitely.
With reducing budgets and resources we con nue to invest as effec vely as possible to reduce immediate
deteriora on and make use of every available funding opportunity.
The roads network is a key asset for Argyll and Bute and is cri cal to suppor ng economic development.
Every effort should be made to safeguard its future .


