
SAND REPORT
SAND2003-4674
Unlimited Release
Printed December 2003
Development of Highly Integrated Magetically and Electrostatically Actuated Micropumps LDRD 64709 Final Report
Paul Galambos, Brian Sosnowchick, Jason Hendrix, Andrew Zwolinski
Prepared by Sandia National Laboratories Albuquerque, New Mexico 87185 and Livermore, California 94550
Sandia is a multiprogram laboratory operated by Sandia Corporation, a Lockheed Martin Company, for the United States Department of Energy’s
National Nuclear Security Administration under Contract DE-AC04-94-AL85000.
Approved for public release; further dissemination unlimited.

Issued by Sandia National Laboratories, operated for the United States Department of Energy by
Sandia Corporation.
NOTICE: This report was prepared as an account of work sponsored by an agency of the United
States Government. Neither the United States Government, nor any agency thereof, nor any of
their employees, nor any of their contractors, subcontractors, or their employees, make any
warranty, express or implied, or assume any legal liability or responsibility for the accuracy,
completeness, or usefulness of any information, apparatus, product, or process disclosed, or
represent that its use would not infringe privately owned rights. Reference herein to any specific
commercial product, process, or service by trade name, trademark, manufacturer, or otherwise,
does not necessarily constitute or imply its endorsement, recommendation, or favoring by the
United States Government, any agency thereof, or any of their contractors or subcontractors. The
views and opinions expressed herein do not necessarily state or reflect those of the United States
Government, any agency thereof, or any of their contractors.
Printed in the United States of America. This report has been reproduced directly from the best
available copy.
Available to DOE and DOE contractors from
U.S. Department of Energy
Office of Scientific and Technical Information
P.O. Box 62
Oak Ridge, TN 37831
Telephone: (865)576-8401
Facsimile: (865)576-5728
E-Mail: [email protected]
Online ordering: http://www.doe.gov/bridge
Available to the public from
U.S. Department of Commerce
National Technical Information Service
5285 Port Royal Rd
Springfield, VA 22161
Telephone: (800)553-6847
Facsimile: (703)605-6900
E-Mail: [email protected]
Online order: http://www.ntis.gov/help/ordermethods.asp?loc=7-4-0#online
2
3
SAND2003-4674 Unlimited Release Printed December 2003
Development of Highly Integrated Magetically and Electrostatically Actuated Micropumps LDRD 64709 Final Report Paul Galambos MEMS Device Technologies Sandia National Laboratories P.O. Box 5800 Albuquerque, New Mexico 87185-1080 Brian Sosnowchick Pennsylvania State University University Park, PA 16082 Jason Hendrix and Andrew Zwolinski Florida State University Tallahassee, FL 32306 Abstract The pump and actuator systems designed and built in the SUMMiTTM process, Sandia’s surface micromachining polysilicon MEMS (Micro-Electro-Mechanical Systems) fabrication technology, on the previous campus executive program LDRD (SAND2002-0704P) with FSU/FAMU (Florida State University/Florida Agricultural and Mechanical University) were characterized in this LDRD. These results demonstrated that the device would pump liquid against the flow resistance of a microfabricated channel, but the devices were determined to be underpowered for reliable pumping. As a result a new set of SUMMiTTM pumps with actuators that generate greater torque will be designed and submitted for fabrication. In this document we will report details of dry actuator/pump assembly testing, wet actuator/pump testing, channel resistance characterization, and new pump/actuator design recommendations.
4
Acknowledgements We would like to acknowledge Dean Ching-Jen Chen and Dr. Yousef S. Haik of FSU/FAMU for making this project possible. The research reported herein pertains to the master’s thesis research of Jason Hendrix and Andy Zwolinski. This research project was funded under the campus executive LDRD program so we would like to thank Dr. Paul Robinson, the executive associated with FSU/FAMU. We also acknowledge the staff of the Microelectronics Development Lab (MDL) at Sandia National Laboratories (SNL) for fabrication of devices.
5
Table of Contents
Introduction.........................................................................................................6 1. Dry Electrostatic Actuation............................................................................9
1.1 Viscous Drag Spiral Pump..........................................................................9
1.2 Torsional Ratcheting Actuator ..................................................................10
1.3 Release/dry process.................................................................................11
1.4 Pump ‘release’..........................................................................................12
1.5 Loaded Torsional Ratcheting Actuator Tests............................................15
1.5.1 Maximum Voltage Test....................................................................15
1.5.2 Minimum Voltage Test.....................................................................16
1.5.3 High Frequency Actuation Test .......................................................16
1.5.4 The TRA Ramp Test .......................................................................17
1.6 Dry Actuation Test Data ...........................................................................18
1.7 Failure Mechanisms .................................................................................22
1.71 Insufficient Actuation Stroke (rocking failure or stuck open)............22
1.7.2 Stuck closed ...................................................................................24
1.7.3 Burned Electrical Bridge.................................................................25
2 Wet Electrostatic Actuation .........................................................................29 2.1 Pump Priming............................................................................................30
2.2 Pump Actuation when Filled with Water ....................................................33
2.3 Effect of Different Liquids on Pump Actuation and Priming ......................36
3 Channel Resistance Characterization.........................................................37 4 2nd Generation Device Design Recommendations and Further Work......39 References ........................................................................................................42
6
Introduction This report attempts to summarize work on a very short time duration (4 month) campus executive program LDRD with FSU/FAMU involving the development of micropumps built utilizing SNL’s surface micromachining processes, SUMMiTTM (Sandia Ultra-planar Multi-level MEMS Technology – www.sandia.gov/micromachine ) and SwIFTTM (SUMMiTTM with Integrated Fluidics Technology). SUMMiTTM is the more developed of the processes and utilizes 5 levels of polysilicon (4 structural and 1 electrical) to make complex surface micromachined electro-mechanical systems [1]. SwIFTTM is based on SUMMiTTM with additional silicon nitride layers that allow optically transparent, electrically insulating channels (such as are required for many microfluidic applications) to be fabricated. In the SwIFTTM process a mechanical system (e.g. a pump or some other actuated mechanism) can be integrated with a microfluidic system, an electrochemical sensor (e.g. an electrode), and/or an optical sensor to create a completely monolithic on-chip system with microfluidic, electrical, optical, and mechanical subsystems [2, 3]. Such a system is the final objective of this work and would have national security applications in the area of chemical and biological sensing microsystems. A key component of a microfluidic microsystem is a micropump. Microfluidic systems have potential applications in the areas of biological and chemical analysis systems (µTAS – Micro Total (chemical) Analysis Systems), remote sensing, and nano-scale to micro-scale chemical and/or biological synthesis [4, 5]. In order to address these applications a micropump that can provide the power for liquid handling at the small scales of interest is required. This project was an attempt to push the development of micropumps at the chip scale of channels from a fraction of a micron to 100’s of microns deep (volumes of picoliters to microliters). This scale is particularly pertinent to biological and chemical applications that are concerned with the manipulation of macromolecules. The microfluidic system, especially the pump, provides fluidic inputs (e.g. nutrient or analyte supply) and outputs (e.g. waste removal and constituent separations) to small volumes (e.g. cells or wells) embedded in the microfluidic system that contain macromolecules which can perform a variety of sensing and synthesis functions. By fabricating the micropump monolithically on-chip with the rest of the system components a highly integrated and compact microfluidic microsystem can be developed. A microsystem can only be as small as its largest component, which should not be the micropump, because larger off-chip micropumps typically deliver much higher flow rates than are required on-chip in the microsystem. There is a size mismatch between meso-scale pumps and micro-scale microfluidics. By incorporating the micropump on-chip this mismatch is eliminated. Also, by fabricating the micropump in the same monolithic, mass-production process used to make the rest of the microfluidic system (e.g. surface micromachining with SUMMiTTM and SwIFTTM) the difficult assembly step whereby the pump is connected to the microfluidic channel system is eliminated as is the dead volume associated with these connecting fittings. Minimization of dead volume is important to the operation of any microfluidic system that requires mixing, separation or rapid feed-through of sample.
7
Many microfluidic systems utilize electro-osmotic pumps [6] that are capable of developing extremely high pressures. However electro-osmotic pumping requires control of solution pH and conductivity (limiting the fluids that can be pumped), wall surface charge control, electrolysis mitigation, and the application of high voltage (1000 V application is not uncommon). Mechanical pumps therefore have significant advantages in terms of fluid insensitivity and lower voltage requirements. However, the majority of previously developed mechanical micropumps are actually meso-scale pumps that utilize a vibrating membrane with a passive check valve system [7-10] fabricated amongst several layers, which must be carefully aligned and bonded, or a nozzle-diffuser geometry [11,12], which is inherently less efficient due to significant backflow that occurs with each return stroke of the membrane. It has previously been demonstrated that utilizing viscous drag forces is a viable option for mechanical pumping in the microscale. Viscous drag pumps or more simply viscous pumps have been demonstrated both experimentally [13] and analytically [14] for a rotating plate pump. These pumps scale well to microsystems since viscous drag forces dominate at low Reynolds number flow. In this project we are concerned with both electrostatically and magnetically actuated surface micromachined viscous micropumps. A viscous pump is a mechanical device that utilizes viscous forces, dominant at the low Reynolds numbers typical of microfluidic devices, to move fluid. Specifically, the viscous pumps discussed herein utilize a rotating disk positioned very closely (~10µm) to a stationary substrate to move fluid via Couette flow. This flow is channelized utilizing protrusions from the rotating disk that almost touch the substrate (within < 0.3 µm). These protrusions form a rotating channel that spirals outward from a central inlet (etched from the back of the wafer) to the edge of the disk and into an attached surface micromachined flow channel. The microfluidic pumping system utilized for this research was a viscous drag spiral pump previously presented by Kilani et. al. [14]. The pump and actuator were fabricated together on the same silicon module using the SUMMiTTM process. A well developed surface micromachining technology (e.g. SUMMiTTM) is an ideal platform in which to build viscous pumps because the mechanical pumping and actuation systems can be integrated with electrostatic or magnetic drives and microfluidic channels on the same chip substrate. All parts tested were released in an acid bath and supercritically dried [15]. The micromotor used to actuate the pumps was a Torsional Ratcheting Actuator [16]. All components to the system, actuator, pump and flow channel, will be discussed in the following subsections. The experimental work reported herein deals with electrostatically actuated SUMMiTTM pumps. Magnetic actuation has not progressed as far, however we are submitting designs for fabrication of magnetically actuated micropumps in SUMMiTTM, with additional magnetic material layer depositions. These magnetically actuated micropump designs will not be discussed here as we are focusing on the electrostatically actuated devices. Finally we have characterized the ‘pipe’ (actually microchannel) part of the pump/pipe microsystem contained on one silicon module, an extremely simple complete
8
microfluidic microsystem. By characterizing microchannel resistance to flow we can determine the operating point of the pump for a given pump curve. The intersection of the pump and pipe curves defines the operating point of the pump/pipe microfluidic microsystem and determines the overall performance of the microsystem in terms of pressure, flow rate, power, and efficiency. This division of the microfluidic microsystem into two components, pump and pipe, is somewhat arbitrary for this monolithic system as the pump and pipe are fabricated together on the same substrate and there would be no way to change out this pipe for a different pipe with the same pump. However the pipe resistance determination allows one to design a different pipe for fabrication with the same pump and predict the results. Alternatively, one could consider the pump/pipe combination as designed and built as a pump assembly and add different pipes on to the end of it. This is appropriate since the pump and channel (or pipe) as designed could easily be the smallest, highest flow resistance parts of a microfluidic system and could be analyzed separately. The performance of this pump would be relatively insensitive to the larger, low flow resistance flow channels that could typically be added as a piping system. The remainder of this report is organized as follows: 1) dry testing of electrostatically actuated pumps, 2) wet testing of electrostatically actuated pumps, 3) characterization of channel flow resistance, and 4) recommendations for 2nd generation designs and other work.
9
1. Dry Electrostatic Actuation This section presents the dry actuation testing procedures and results for viscous drag micropumping systems. While wet actuation will be significantly different, dry testing provides insight into how to optimally move the mechanism and differences between dry and wet actuation can be used to isolate fluid effects. Characterization began with an analysis of the driving voltage waveforms for the torsional ratcheting actuator (TRA), a micro-motor that drove the gear transmission for the pump, actuated with SAMATM (Sandia’s Arbitrary waveform MEMS Actuator), a new waveform generating computer program with the ability to generate and output arbitrary voltage signals. Based upon previous research [16], a 50% duty cycle half-sine wave was initially selected for actuation of the TRA. However, due to the geometry of the half-sine waveform and friction in the pump, the loaded micromotor could not transmit the motion required to pump the tested liquids. Six waveforms were then conceived, constructed, and selected for device actuation testing. Dry actuation tests included high voltage, low voltage, high frequency, and endurance/reliability testing of the TRA, gear transmission and pump assembly.
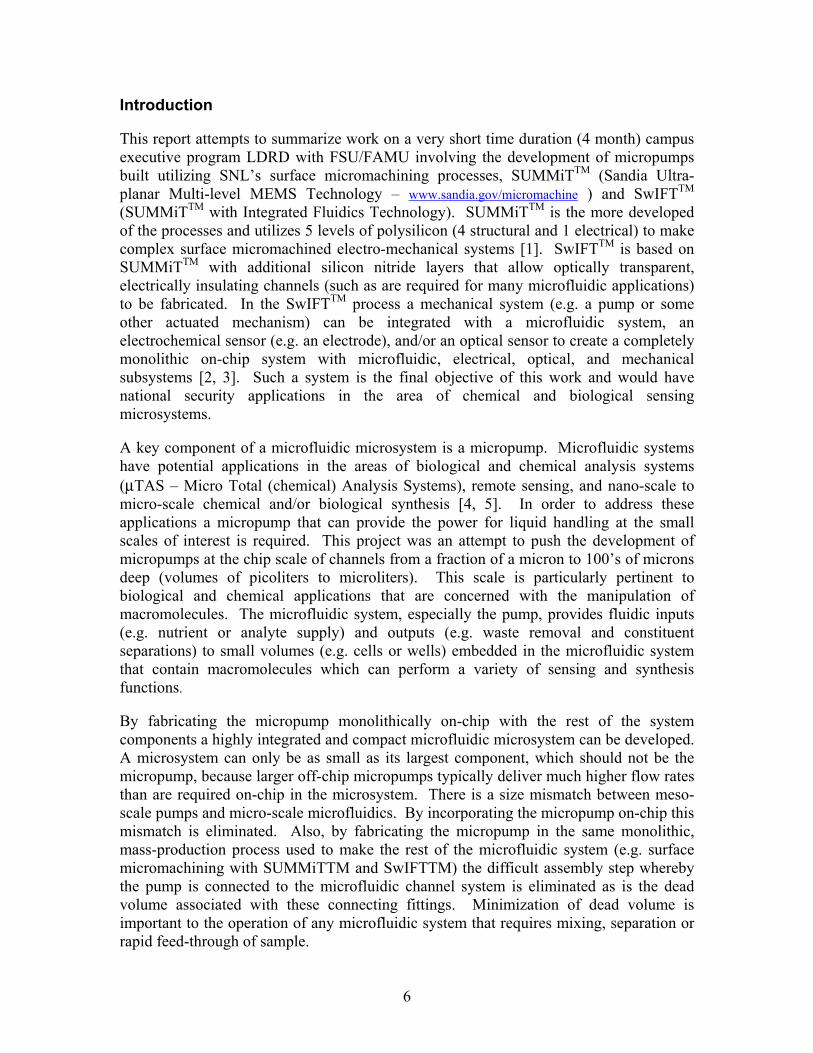
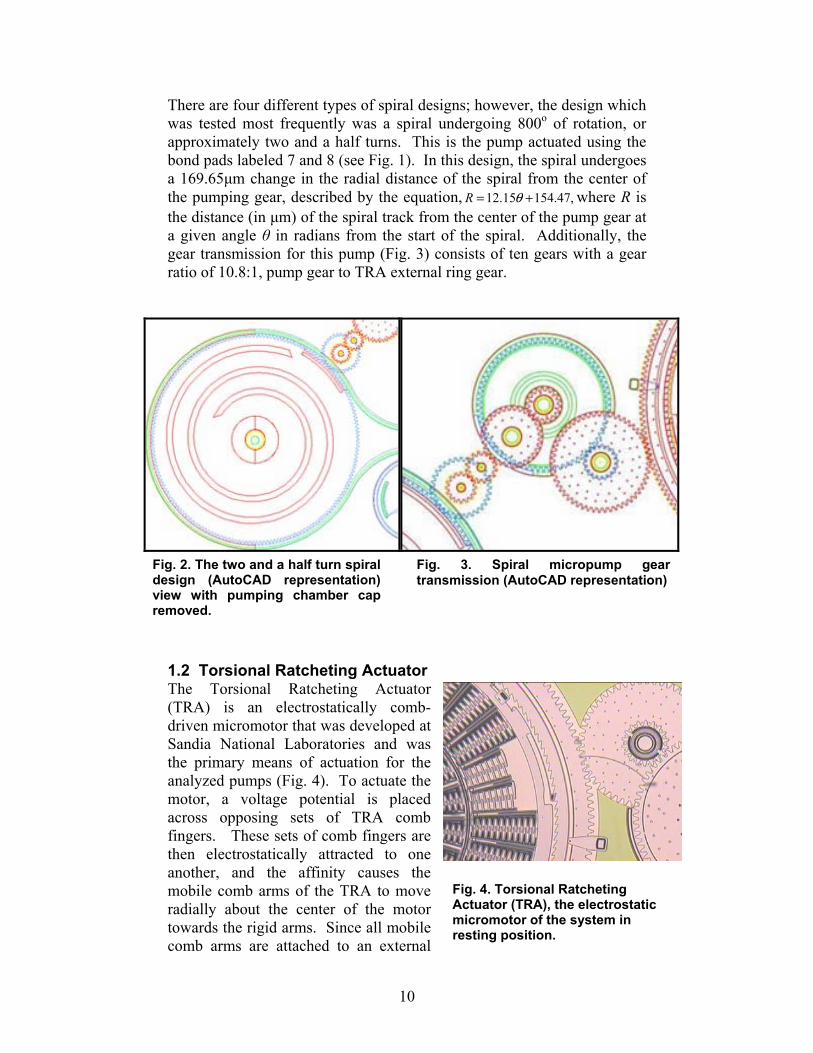
1.1 Viscous Drag Spiral Pump An overview of the die containing spiral pumps is shown in Fig. 1. Fluid enters the pumping chamber from the underside of the device through a Bosch etched hole, flows through the pumping chamber and down the pump channel to the exit Bosch etched hole on the other side of the die. To physically move fluid through the device, the pump gears have a spiral design that hangs from the underside of the pumping gear. When actuated, the pumping gear spins (Fig. 2), thereby forcing fluid down the channel of the pump to the outlet due to the viscous drag along the rotating plate.
Fig. 1. Overview of the spiral pumps tested. Components: 1) Bond pads for voltage applied, 2) pump actuator, 3) transmission, 4) pump housing, 5) build-in SUMMITTM pipe.
10
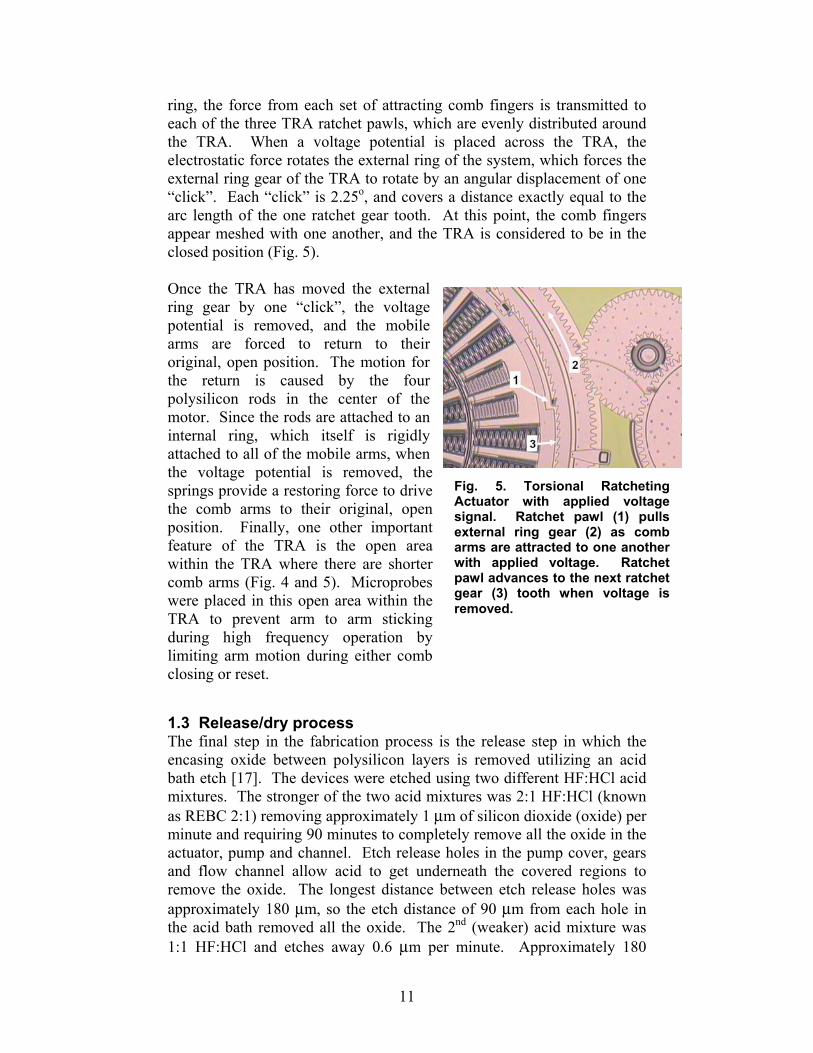
There are four different types of spiral designs; however, the design which was tested most frequently was a spiral undergoing 800o of rotation, or approximately two and a half turns. This is the pump actuated using the bond pads labeled 7 and 8 (see Fig. 1). In this design, the spiral undergoes a 169.65µm change in the radial distance of the spiral from the center of the pumping gear, described by the equation, ,47.15415.12 += θR where R is the distance (in µm) of the spiral track from the center of the pump gear at a given angle θ in radians from the start of the spiral. Additionally, the gear transmission for this pump (Fig. 3) consists of ten gears with a gear ratio of 10.8:1, pump gear to TRA external ring gear.
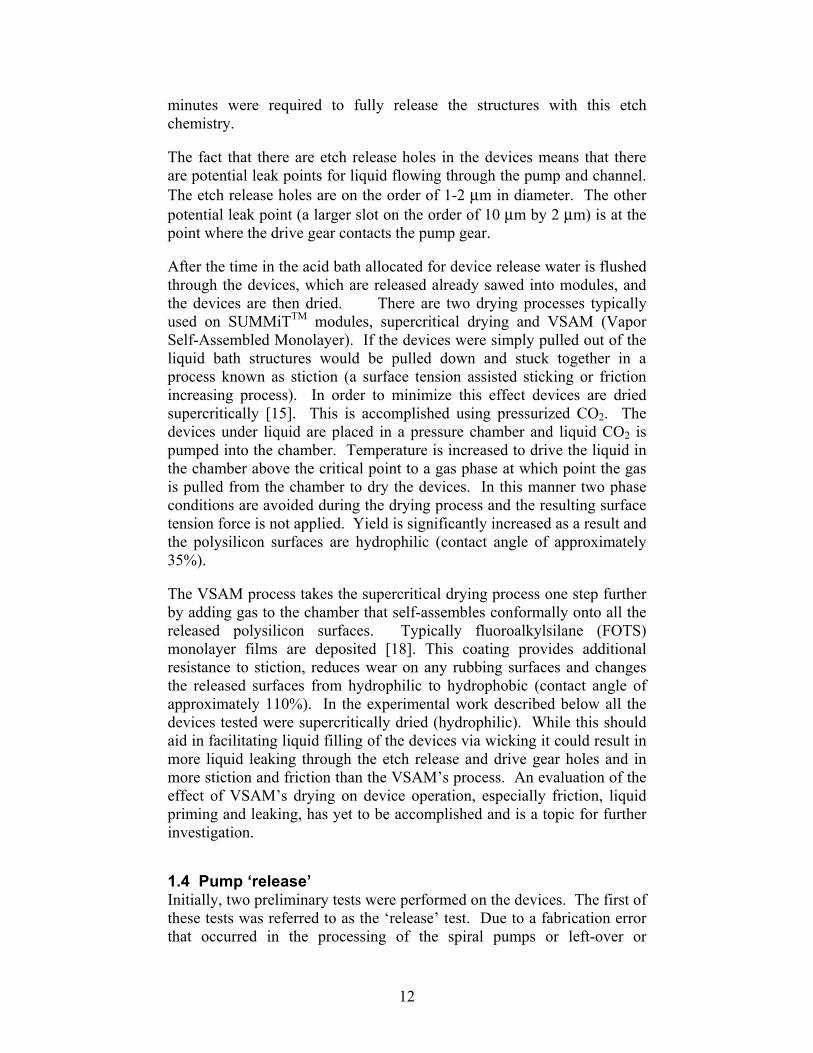
1.2 Torsional Ratcheting Actuator The Torsional Ratcheting Actuator (TRA) is an electrostatically comb-driven micromotor that was developed at Sandia National Laboratories and was the primary means of actuation for the analyzed pumps (Fig. 4). To actuate the motor, a voltage potential is placed across opposing sets of TRA comb fingers. These sets of comb fingers are then electrostatically attracted to one another, and the affinity causes the mobile comb arms of the TRA to move radially about the center of the motor towards the rigid arms. Since all mobile comb arms are attached to an external
Fig. 3. Spiral micropump gear transmission (AutoCAD representation)
Fig. 2. The two and a half turn spiral design (AutoCAD representation) view with pumping chamber cap removed.
Fig. 4. Torsional Ratcheting Actuator (TRA), the electrostatic micromotor of the system in resting position.
11
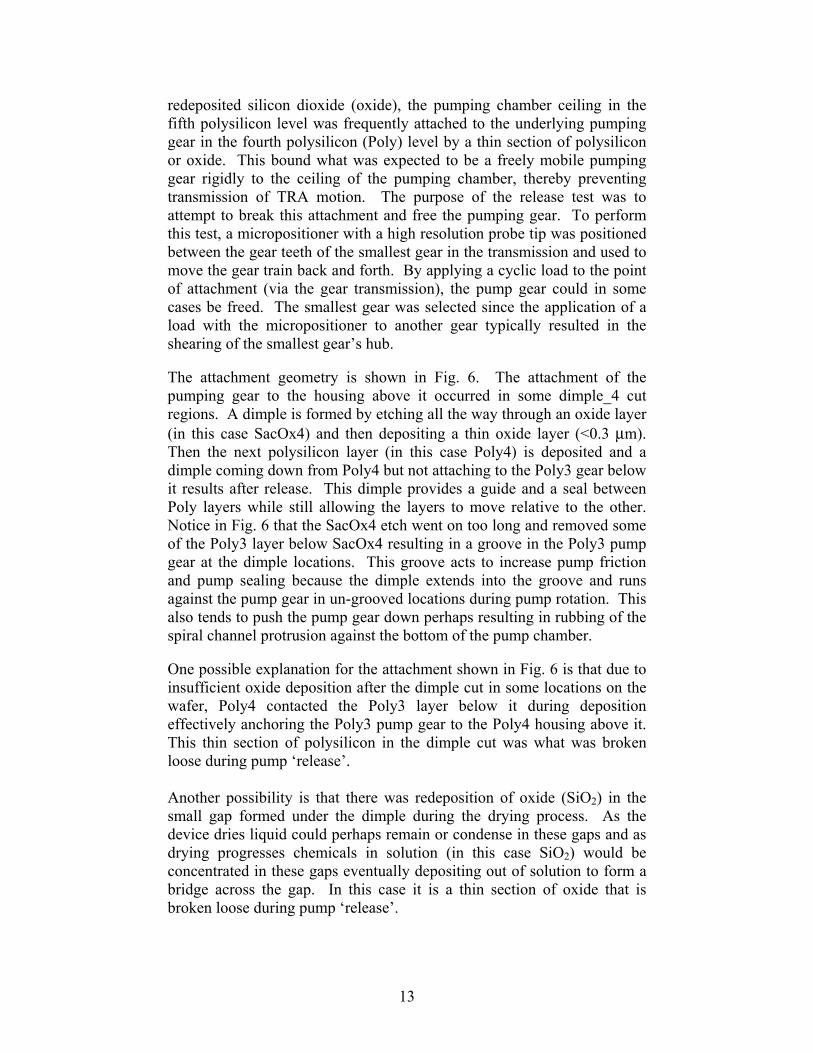
ring, the force from each set of attracting comb fingers is transmitted to each of the three TRA ratchet pawls, which are evenly distributed around the TRA. When a voltage potential is placed across the TRA, the electrostatic force rotates the external ring of the system, which forces the external ring gear of the TRA to rotate by an angular displacement of one “click”. Each “click” is 2.25o, and covers a distance exactly equal to the arc length of the one ratchet gear tooth. At this point, the comb fingers appear meshed with one another, and the TRA is considered to be in the closed position (Fig. 5).
Once the TRA has moved the external ring gear by one “click”, the voltage potential is removed, and the mobile arms are forced to return to their original, open position. The motion for the return is caused by the four polysilicon rods in the center of the motor. Since the rods are attached to an internal ring, which itself is rigidly attached to all of the mobile arms, when the voltage potential is removed, the springs provide a restoring force to drive the comb arms to their original, open position. Finally, one other important feature of the TRA is the open area within the TRA where there are shorter comb arms (Fig. 4 and 5). Microprobes were placed in this open area within the TRA to prevent arm to arm sticking during high frequency operation by limiting arm motion during either comb closing or reset.
1.3 Release/dry process The final step in the fabrication process is the release step in which the encasing oxide between polysilicon layers is removed utilizing an acid bath etch [17]. The devices were etched using two different HF:HCl acid mixtures. The stronger of the two acid mixtures was 2:1 HF:HCl (known as REBC 2:1) removing approximately 1 µm of silicon dioxide (oxide) per minute and requiring 90 minutes to completely remove all the oxide in the actuator, pump and channel. Etch release holes in the pump cover, gears and flow channel allow acid to get underneath the covered regions to remove the oxide. The longest distance between etch release holes was approximately 180 µm, so the etch distance of 90 µm from each hole in the acid bath removed all the oxide. The 2nd (weaker) acid mixture was 1:1 HF:HCl and etches away 0.6 µm per minute. Approximately 180
Fig. 5. Torsional Ratcheting Actuator with applied voltage signal. Ratchet pawl (1) pulls external ring gear (2) as comb arms are attracted to one another with applied voltage. Ratchet pawl advances to the next ratchet gear (3) tooth when voltage is removed.
12
minutes were required to fully release the structures with this etch chemistry.
The fact that there are etch release holes in the devices means that there are potential leak points for liquid flowing through the pump and channel. The etch release holes are on the order of 1-2 µm in diameter. The other potential leak point (a larger slot on the order of 10 µm by 2 µm) is at the point where the drive gear contacts the pump gear.
After the time in the acid bath allocated for device release water is flushed through the devices, which are released already sawed into modules, and the devices are then dried. There are two drying processes typically used on SUMMiTTM modules, supercritical drying and VSAM (Vapor Self-Assembled Monolayer). If the devices were simply pulled out of the liquid bath structures would be pulled down and stuck together in a process known as stiction (a surface tension assisted sticking or friction increasing process). In order to minimize this effect devices are dried supercritically [15]. This is accomplished using pressurized CO2. The devices under liquid are placed in a pressure chamber and liquid CO2 is pumped into the chamber. Temperature is increased to drive the liquid in the chamber above the critical point to a gas phase at which point the gas is pulled from the chamber to dry the devices. In this manner two phase conditions are avoided during the drying process and the resulting surface tension force is not applied. Yield is significantly increased as a result and the polysilicon surfaces are hydrophilic (contact angle of approximately 35%).
The VSAM process takes the supercritical drying process one step further by adding gas to the chamber that self-assembles conformally onto all the released polysilicon surfaces. Typically fluoroalkylsilane (FOTS) monolayer films are deposited [18]. This coating provides additional resistance to stiction, reduces wear on any rubbing surfaces and changes the released surfaces from hydrophilic to hydrophobic (contact angle of approximately 110%). In the experimental work described below all the devices tested were supercritically dried (hydrophilic). While this should aid in facilitating liquid filling of the devices via wicking it could result in more liquid leaking through the etch release and drive gear holes and in more stiction and friction than the VSAM’s process. An evaluation of the effect of VSAM’s drying on device operation, especially friction, liquid priming and leaking, has yet to be accomplished and is a topic for further investigation.
1.4 Pump ‘release’ Initially, two preliminary tests were performed on the devices. The first of these tests was referred to as the ‘release’ test. Due to a fabrication error that occurred in the processing of the spiral pumps or left-over or
13
redeposited silicon dioxide (oxide), the pumping chamber ceiling in the fifth polysilicon level was frequently attached to the underlying pumping gear in the fourth polysilicon (Poly) level by a thin section of polysilicon or oxide. This bound what was expected to be a freely mobile pumping gear rigidly to the ceiling of the pumping chamber, thereby preventing transmission of TRA motion. The purpose of the release test was to attempt to break this attachment and free the pumping gear. To perform this test, a micropositioner with a high resolution probe tip was positioned between the gear teeth of the smallest gear in the transmission and used to move the gear train back and forth. By applying a cyclic load to the point of attachment (via the gear transmission), the pump gear could in some cases be freed. The smallest gear was selected since the application of a load with the micropositioner to another gear typically resulted in the shearing of the smallest gear’s hub.
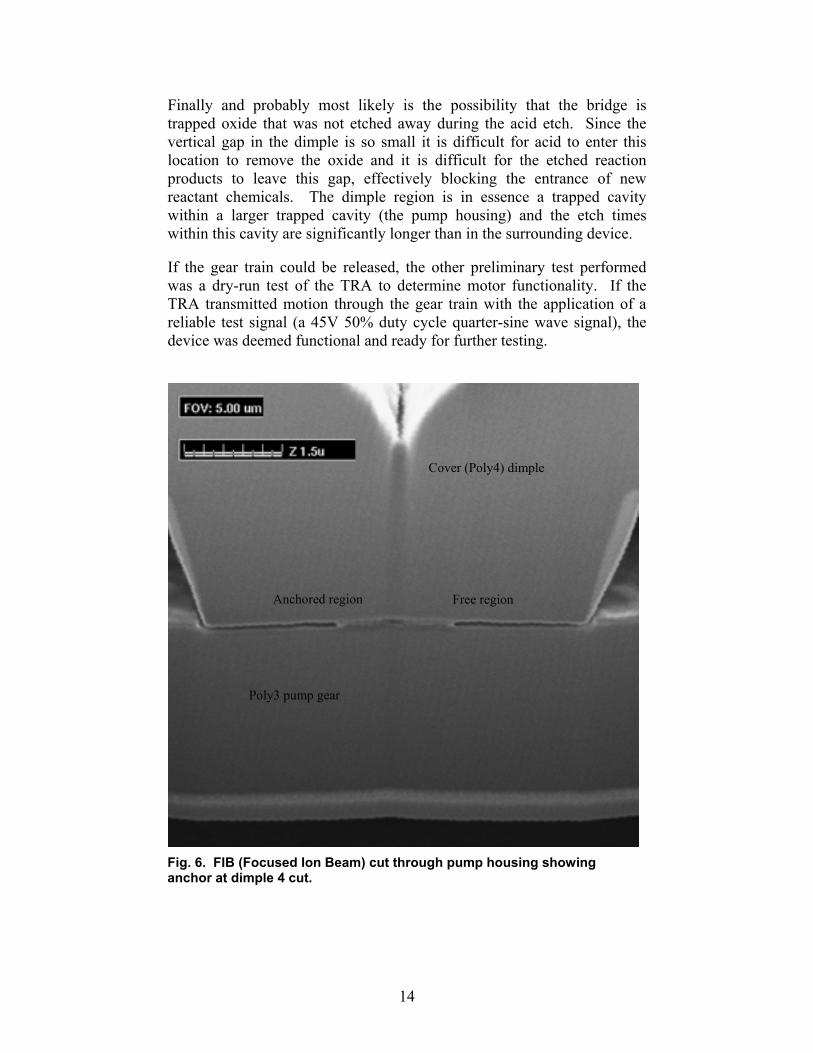
The attachment geometry is shown in Fig. 6. The attachment of the pumping gear to the housing above it occurred in some dimple_4 cut regions. A dimple is formed by etching all the way through an oxide layer (in this case SacOx4) and then depositing a thin oxide layer (<0.3 µm). Then the next polysilicon layer (in this case Poly4) is deposited and a dimple coming down from Poly4 but not attaching to the Poly3 gear below it results after release. This dimple provides a guide and a seal between Poly layers while still allowing the layers to move relative to the other. Notice in Fig. 6 that the SacOx4 etch went on too long and removed some of the Poly3 layer below SacOx4 resulting in a groove in the Poly3 pump gear at the dimple locations. This groove acts to increase pump friction and pump sealing because the dimple extends into the groove and runs against the pump gear in un-grooved locations during pump rotation. This also tends to push the pump gear down perhaps resulting in rubbing of the spiral channel protrusion against the bottom of the pump chamber.
One possible explanation for the attachment shown in Fig. 6 is that due to insufficient oxide deposition after the dimple cut in some locations on the wafer, Poly4 contacted the Poly3 layer below it during deposition effectively anchoring the Poly3 pump gear to the Poly4 housing above it. This thin section of polysilicon in the dimple cut was what was broken loose during pump ‘release’. Another possibility is that there was redeposition of oxide (SiO2) in the small gap formed under the dimple during the drying process. As the device dries liquid could perhaps remain or condense in these gaps and as drying progresses chemicals in solution (in this case SiO2) would be concentrated in these gaps eventually depositing out of solution to form a bridge across the gap. In this case it is a thin section of oxide that is broken loose during pump ‘release’.
14
Finally and probably most likely is the possibility that the bridge is trapped oxide that was not etched away during the acid etch. Since the vertical gap in the dimple is so small it is difficult for acid to enter this location to remove the oxide and it is difficult for the etched reaction products to leave this gap, effectively blocking the entrance of new reactant chemicals. The dimple region is in essence a trapped cavity within a larger trapped cavity (the pump housing) and the etch times within this cavity are significantly longer than in the surrounding device.
If the gear train could be released, the other preliminary test performed was a dry-run test of the TRA to determine motor functionality. If the TRA transmitted motion through the gear train with the application of a reliable test signal (a 45V 50% duty cycle quarter-sine wave signal), the device was deemed functional and ready for further testing.
Fig. 6. FIB (Focused Ion Beam) cut through pump housing showing anchor at dimple 4 cut.
Cover (Poly4) dimple
Anchored region
Poly3 pump gear
Free region
15
1.5 Loaded Torsional Ratcheting Actuator Tests Four tests were performed to characterize the loaded TRA micromotors of the pumps and to provide insight into optimizing the drive signals necessary for wet testing. These tests including the Maximum Voltage Test, the Minimum Voltage Test, the High Frequency Actuation Test, and the TRA Ramp Test.
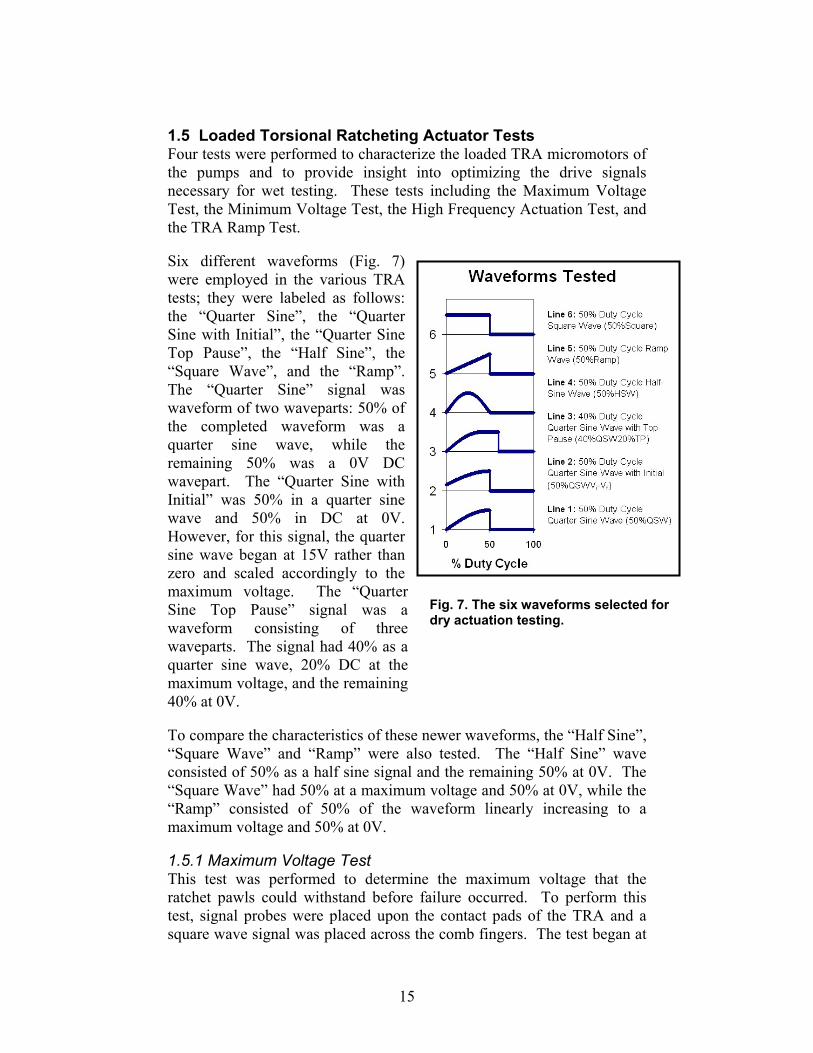
Six different waveforms (Fig. 7) were employed in the various TRA tests; they were labeled as follows: the “Quarter Sine”, the “Quarter Sine with Initial”, the “Quarter Sine Top Pause”, the “Half Sine”, the “Square Wave”, and the “Ramp”. The “Quarter Sine” signal was waveform of two waveparts: 50% of the completed waveform was a quarter sine wave, while the remaining 50% was a 0V DC wavepart. The “Quarter Sine with Initial” was 50% in a quarter sine wave and 50% in DC at 0V. However, for this signal, the quarter sine wave began at 15V rather than zero and scaled accordingly to the maximum voltage. The “Quarter Sine Top Pause” signal was a waveform consisting of three waveparts. The signal had 40% as a quarter sine wave, 20% DC at the maximum voltage, and the remaining 40% at 0V.
To compare the characteristics of these newer waveforms, the “Half Sine”, “Square Wave” and “Ramp” were also tested. The “Half Sine” wave consisted of 50% as a half sine signal and the remaining 50% at 0V. The “Square Wave” had 50% at a maximum voltage and 50% at 0V, while the “Ramp” consisted of 50% of the waveform linearly increasing to a maximum voltage and 50% at 0V.
1.5.1 Maximum Voltage Test This test was performed to determine the maximum voltage that the ratchet pawls could withstand before failure occurred. To perform this test, signal probes were placed upon the contact pads of the TRA and a square wave signal was placed across the comb fingers. The test began at
Fig. 7. The six waveforms selected for dry actuation testing.
16
80V with a frequency of 10Hz for no more than approximately one second; the purpose of this brief period of actuation was to reduce the likelihood of fatigue failure. If the ratchet pawls did not fail at a given voltage, the voltage was increased at steps of 5V and the test was repeated until pawl failure did occur. The failure voltages were then recorded as maximum tolerable voltages.
1.5.2 Minimum Voltage Test This test was performed to determine the minimum voltage required to just instigate TRA comb arm movement. It involved ramping the voltage across the TRA and determining the time at which visible movement began. The voltage signal used in this test increased from 0V to 30V in 60 seconds. Using a stop-watch for increased precision, time began when the control circuit output the signal and ended when the TRA first moved. The precision was limited to how quickly the human eye can respond to a visual change, and the TRA responded differently for each trial. For these reasons, the test was performed 20 times; data were recorded, and the average voltage to instigate TRA movement was quantified.
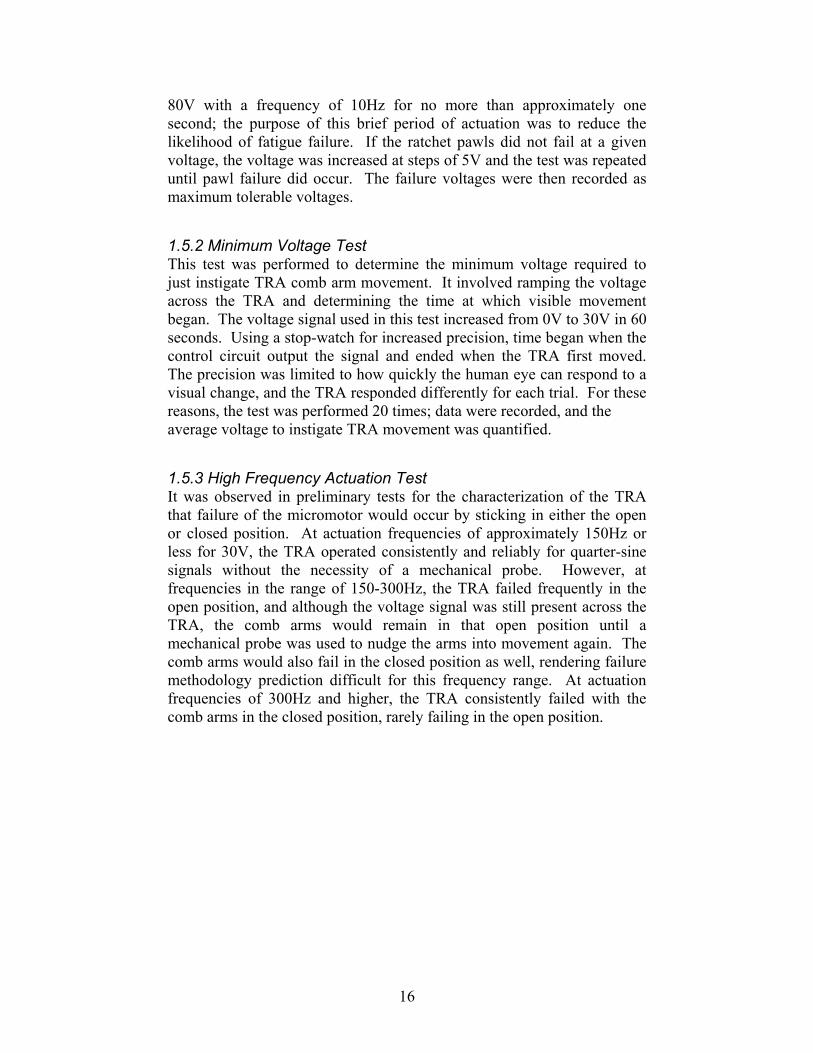
1.5.3 High Frequency Actuation Test It was observed in preliminary tests for the characterization of the TRA that failure of the micromotor would occur by sticking in either the open or closed position. At actuation frequencies of approximately 150Hz or less for 30V, the TRA operated consistently and reliably for quarter-sine signals without the necessity of a mechanical probe. However, at frequencies in the range of 150-300Hz, the TRA failed frequently in the open position, and although the voltage signal was still present across the TRA, the comb arms would remain in that open position until a mechanical probe was used to nudge the arms into movement again. The comb arms would also fail in the closed position as well, rendering failure methodology prediction difficult for this frequency range. At actuation frequencies of 300Hz and higher, the TRA consistently failed with the comb arms in the closed position, rarely failing in the open position.
17
This test was conceived and performed under the hypothesis that two mechanical probes might increase the potential TRA actuation speed by physically preventing the comb arms from getting stuck. With two probes shown in the locations on Fig. 8 to prevent stuck open and stuck closed failures, the test was performed to observe the highest sustainable actuation frequency of the TRA.
1.5.4 The TRA Ramp Test The TRA Ramp Test was conceived after obtaining data from the previous tests and performed as a means to determine which of the six aforementioned signals would operate consistently and reliably through the highest range of frequencies, and at which voltage each of the signals operated most reliably. Thirty individual runs were performed to obtain the data necessary for the analysis of this test: each of the six waveforms was tested five times with maximum signal amplitudes of 30V, 45V, 60V, 75V, and 90V. For a given signal at a given voltage, the test began at low frequencies and through gradual steps increased in frequency. The test would continue until the TRA failed to operate for a period of 10 seconds or more at a given frequency. Each step was tested for ten seconds, and the step size increased with increasing frequency ranges. The step sizes were the following: 2—40Hz range had a step size of 2Hz, 40—100Hz range had a step size of 5Hz, 100—300Hz range had a step size of 10Hz, and >300Hz had a step size of 25Hz. The motion transmitted through the complex gear train on the spiral pump was observed and recorded at each step.
The recorded responses of each of the five voltages of a given waveform were analyzed and plotted on a bar graph. The signal with the highest frequency range of “Unaided Transmission” was considered to be the optimal voltage for that waveform, since the motion was consistent and reliable.
Fig. 8. Two microprobes positioned for the high frequency actuation test. The lower probe tip prevents closed position failure. The upper probe tip prevents failure in the open position.
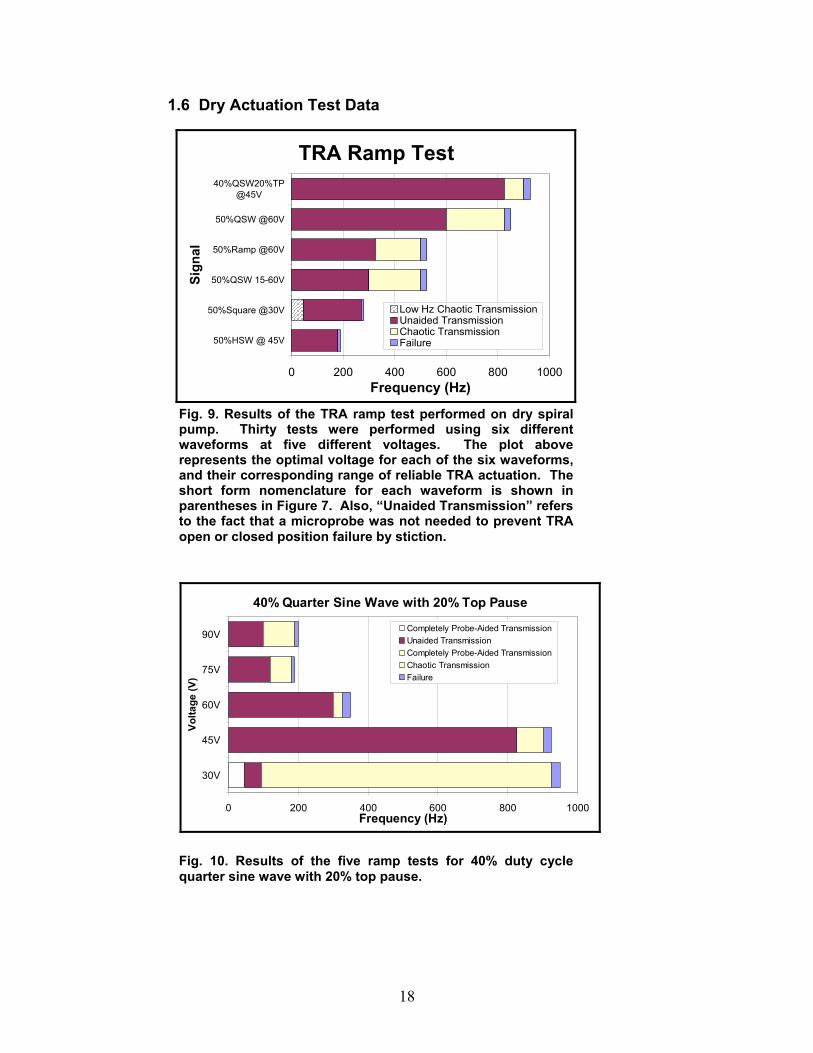
18
1.6 Dry Actuation Test Data
TRA Ramp Test
0 200 400 600 800 1000
50%HSW @ 45V
50%Square @30V
50%QSW 15-60V
50%Ramp @60V
50%QSW @60V
40%QSW20%TP@45V
Sign
al
Frequency (Hz)
Low Hz Chaotic TransmissionUnaided TransmissionChaotic TransmissionFailure
40% Quarter Sine Wave with 20% Top Pause
0 200 400 600 800 1000
30V
45V
60V
75V
90V
Volta
ge (V
)
Frequency (Hz)
Completely Probe-Aided TransmissionUnaided TransmissionCompletely Probe-Aided TransmissionChaotic TransmissionFailure
Fig. 9. Results of the TRA ramp test performed on dry spiral pump. Thirty tests were performed using six different waveforms at five different voltages. The plot above represents the optimal voltage for each of the six waveforms, and their corresponding range of reliable TRA actuation. The short form nomenclature for each waveform is shown in parentheses in Figure 7. Also, “Unaided Transmission” refers to the fact that a microprobe was not needed to prevent TRA open or closed position failure by stiction.
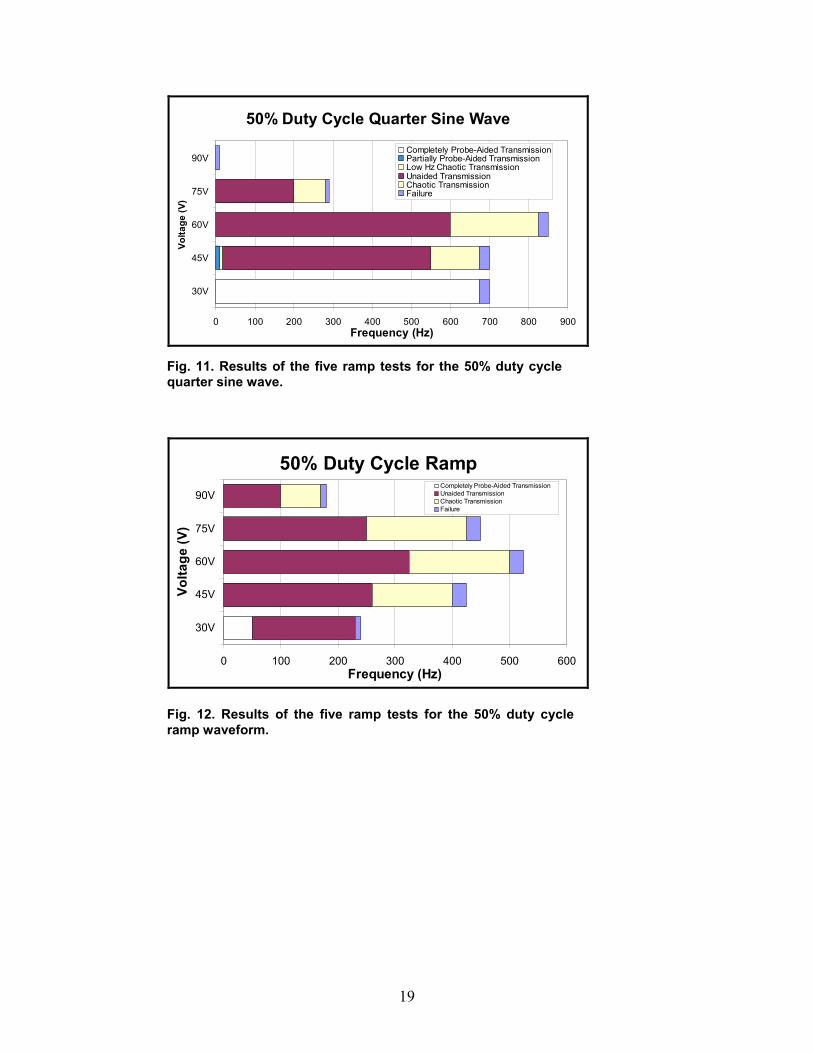
Fig. 10. Results of the five ramp tests for 40% duty cycle quarter sine wave with 20% top pause.
19
50% Duty Cycle Quarter Sine Wave
0 100 200 300 400 500 600 700 800 900
30V
45V
60V
75V
90V
Volta
ge (V
)
Frequency (Hz)
Completely Probe-Aided TransmissionPartially Probe-Aided TransmissionLow Hz Chaotic TransmissionUnaided TransmissionChaotic TransmissionFailure
50% Duty Cycle Ramp
0 100 200 300 400 500 600
30V
45V
60V
75V
90V
Volta
ge (V
)
Frequency (Hz)
Completely Probe-Aided TransmissionUnaided TransmissionChaotic TransmissionFailure
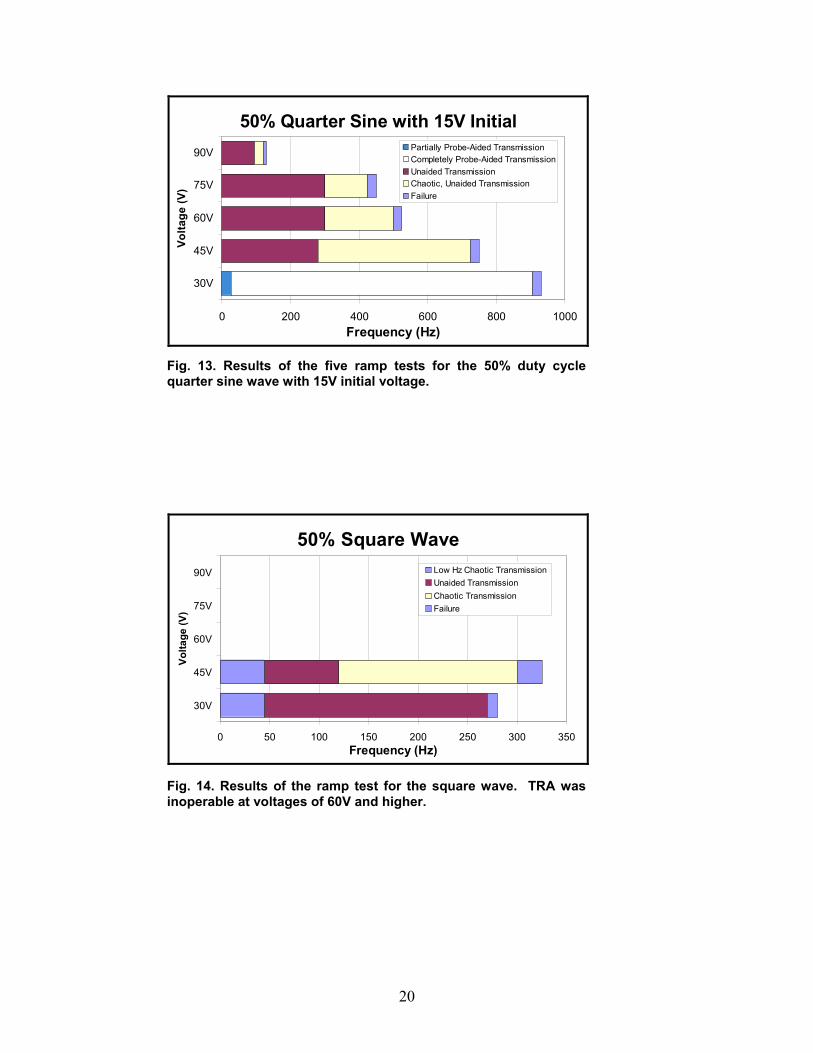
Fig. 12. Results of the five ramp tests for the 50% duty cycle ramp waveform.
Fig. 11. Results of the five ramp tests for the 50% duty cycle quarter sine wave.
20
50% Quarter Sine with 15V Initial
0 200 400 600 800 1000
30V
45V
60V
75V
90V
Volta
ge (V
)
Frequency (Hz)
Partially Probe-Aided TransmissionCompletely Probe-Aided TransmissionUnaided TransmissionChaotic, Unaided TransmissionFailure
50% Square Wave
0 50 100 150 200 250 300 350
30V
45V
60V
75V
90V
Volta
ge (V
)
Frequency (Hz)
Low Hz Chaotic TransmissionUnaided TransmissionChaotic TransmissionFailure
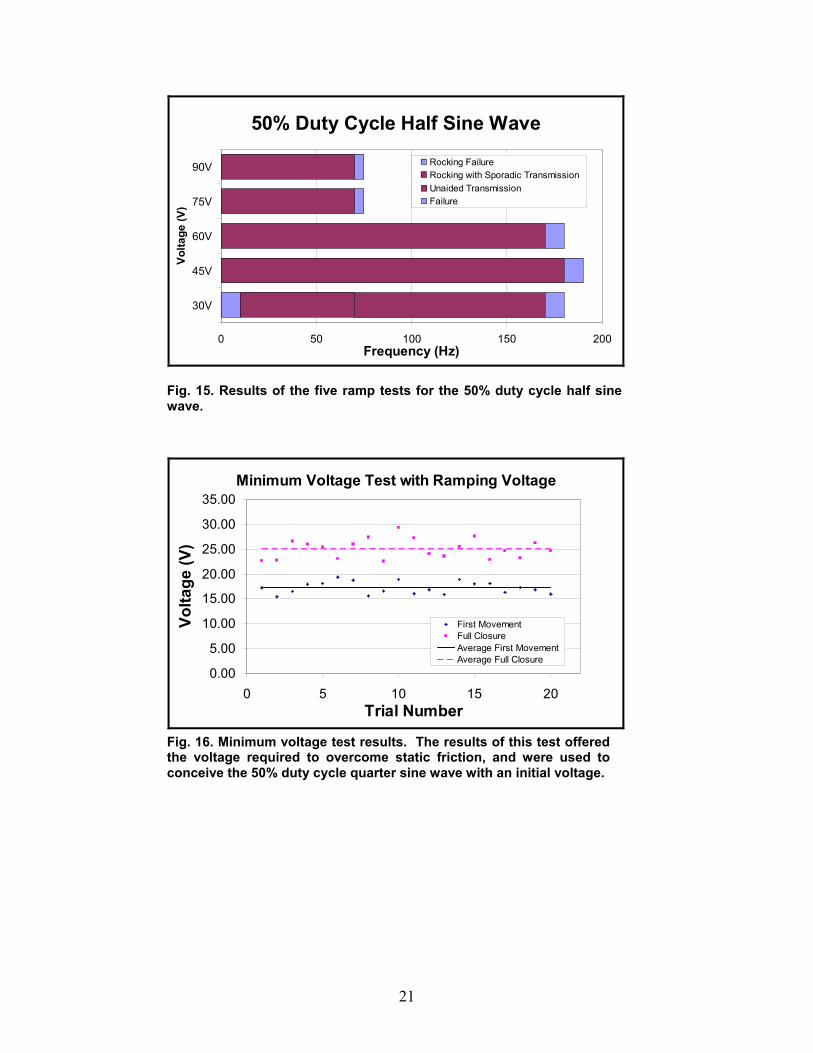
Fig. 14. Results of the ramp test for the square wave. TRA was inoperable at voltages of 60V and higher.
Fig. 13. Results of the five ramp tests for the 50% duty cycle quarter sine wave with 15V initial voltage.
21
50% Duty Cycle Half Sine Wave
0 50 100 150 200
30V
45V
60V
75V
90VVo
ltage
(V)
Frequency (Hz)
Rocking FailureRocking with Sporadic TransmissionUnaided TransmissionFailure
Minimum Voltage Test with Ramping Voltage
0.00
5.00
10.00
15.00
20.00
25.00
30.00
35.00
0 5 10 15 20Trial Number
Volta
ge (V
)
First MovementFull ClosureAverage First MovementAverage Full Closure
Fig. 16. Minimum voltage test results. The results of this test offered the voltage required to overcome static friction, and were used to conceive the 50% duty cycle quarter sine wave with an initial voltage.
Fig. 15. Results of the five ramp tests for the 50% duty cycle half sine wave.
22
Maximum Voltage Test
50
70
90
110
130
150
0 5 10 15 20
Trial Number
Volta
ge (V
)Max Voltage for FailureAverage Value for Failure
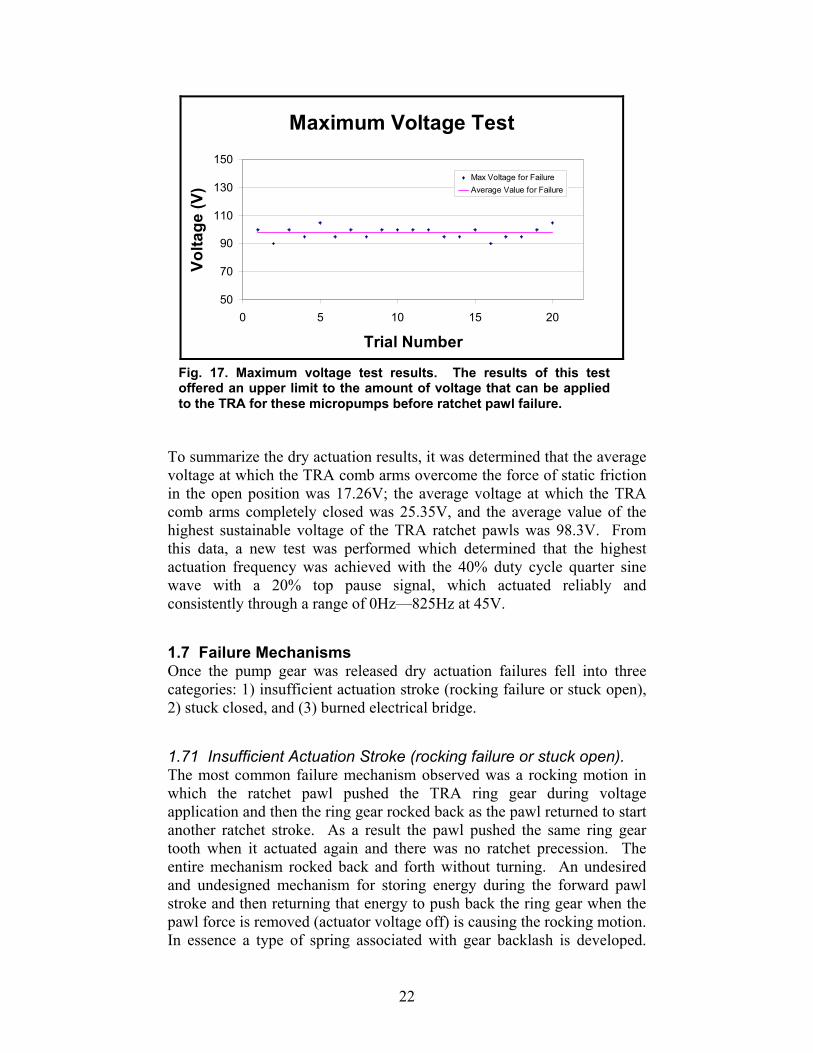
To summarize the dry actuation results, it was determined that the average voltage at which the TRA comb arms overcome the force of static friction in the open position was 17.26V; the average voltage at which the TRA comb arms completely closed was 25.35V, and the average value of the highest sustainable voltage of the TRA ratchet pawls was 98.3V. From this data, a new test was performed which determined that the highest actuation frequency was achieved with the 40% duty cycle quarter sine wave with a 20% top pause signal, which actuated reliably and consistently through a range of 0Hz—825Hz at 45V.
1.7 Failure Mechanisms Once the pump gear was released dry actuation failures fell into three categories: 1) insufficient actuation stroke (rocking failure or stuck open), 2) stuck closed, and (3) burned electrical bridge.
1.71 Insufficient Actuation Stroke (rocking failure or stuck open). The most common failure mechanism observed was a rocking motion in which the ratchet pawl pushed the TRA ring gear during voltage application and then the ring gear rocked back as the pawl returned to start another ratchet stroke. As a result the pawl pushed the same ring gear tooth when it actuated again and there was no ratchet precession. The entire mechanism rocked back and forth without turning. An undesired and undesigned mechanism for storing energy during the forward pawl stroke and then returning that energy to push back the ring gear when the pawl force is removed (actuator voltage off) is causing the rocking motion. In essence a type of spring associated with gear backlash is developed.
Fig. 17. Maximum voltage test results. The results of this test offered an upper limit to the amount of voltage that can be applied to the TRA for these micropumps before ratchet pawl failure.
23
Redesign of the TRA so that the backlash stop engages sooner could reduce this problem. Backlash was evident in the TRA ring gear and in the gears immediately attached to it. During backlash the pump ring gear did not appear to move either forward or backward implying that the backlash was caused by the inability of the TRA to overcome static friction in the pump and move the pump gear. The energy of the forward stroke was therefore stored as twist in the gear transmission rather than being transmitted to the pump ring gear and then acted to return the TRA ring gear to its original position when the voltage dropped.
The TRA was sometimes observed to stop during operation in the wide-open position. In this position the comb drive fingers are even further apart than they are in the as fabricated positions. The torsion springs are now acting to pull the comb fingers together, not to pull them apart as they usually act. During lower voltage operation significant backlash was observed. Once the voltage signal drops (e.g. at the end of each individual quarter sine wave actuation pulse) the gear train was observed pushing the TRA ring gear, and therefore the ratchet pawl, backwards. This is probably the mechanism for forcing the TRA past its equilibrium position and implies that there is sufficient momentum developed to push the TRA past its initial position (an inertia effect). Since even in the equilibrium configuration there is only one micron between the rotating part of the TRA and the backstop (prevents one row of rotating comb fingers from running into the adjacent row of stationary comb fingers), the rotating part of the TRA can be pushed into contact with the backstop by even a small amount of gear backlash. Once in contact stiction or built-up charges could cause the two surfaces to adhere, preventing further ratchet motion. When the TRA was stuck too far open a gentle push from the probe on the rotating part of the comb drive usually sufficed to restart the TRA. Once the TRA was stuck once it was likely that further sticking would be observed. Increasing voltage even 5-10 V reduced the likelihood that the comb drive would become stuck again.
Once the TRA was stuck it was tempting to blindly increase the voltage to free it. While this occasionally worked it often resulting in the TRA pawl deflecting a significant amount and possibly fracturing, rendering the TRA inoperable. In plane pawl deflection was readily observed and out of plane deflection could be deduced from changes in sharpness of the pawl image as it deflected out of plane and out of focus. A better method of freeing the TRA was to use the probe tip to free the TRA and then apply a higher voltage. In some instances the backlash stop fractured rather than the pawl. The backlash stop is a thin pawl-like structure that engages the ratchet teeth to prevent the ratchet from turning backwards. The backlash stop was ineffective in preventing the rocking motion of the ratchet even when it did not fracture. In some cases the backlash stop did not engage as the TRA ring gear returned, implying that the TRA ring gear did not advance far enough during the forward stroke.
24
The second reason for the failure was the effect of a non-optimum actuation drive signal. Recall that the springs act as a restoring force to bring the comb arms of the TRA back to their open position. With the application of a half-sine wave signal, after reaching the point of full closure at the maximum voltage, the presence of any voltage potential beyond that point results in an electrostatic force opposing the force of the restoring springs. In essence, with a half-sine wave signal, the full force of the springs was not being realized due to an opposing force from the voltage signal. In an attempt to improve the actuation drive signal match to the actuator requirements new drive signal waveforms were investigated. In particular, the 50% quarter-sine wave was initially thought to be the desired new driving waveform. Since the main problem of actuation with the half-sine waveform was its residual voltage during the 90o-180o part of the sine wave, by stepping down from the peak voltage to 0V when transitioning from the TRA closed to open position, the springs were able to fully utilize their restoring force. Such a waveform was applied using a quarter sine wave signal. This signal should eliminate the insufficient actuation stroke error (assuming that the signal is on long enough and at a high enough voltage to get the actuator to ‘click’) by allowing the spring restoring force to return the actuator. This was confirmed as the ¼ sine wave signal worked significantly better than the ½ sine wave signal (see Fig. 9).
1.7.2 Stuck closed The second category of actuator/pump dry failure was the stuck closed failure. First, it should be noted that the square wave was inoperable at voltages of 60V and higher. At higher voltages, the change in the voltage (and corresponding electrostatic force) was so high that the energy imparted to the comb arms was great enough to cause the teeth of the TRA to become stuck in the closed position. Moreover, at lower voltages where problems such as this did not occur, the TRA was able to transmit motion, but rather than ratcheting by one “click” per voltage oscillation, it was observed that the ring gear of the TRA would ratchet two or more times per voltage oscillation, which was also noticed during the tests performed by D. Tanner et al. [16]. This double and triple ratcheting caused unpredictable motion. Presumably by shortening the pulse width of the square wave this extra ratcheting motion could be overcome, and the device could operate at higher voltages, but we have not yet been able to demonstrate this effect.
Similar failure mechanisms could be observed with other drive signal waveforms as long as the comb fingers were moved close enough during the actuation stroke to experience pull-in. Pull-in is a common failure
25
mechanism for comb drive actuators that occurs when opposite polarity surface get close enough for parallel plate fields to become dominant. In their normal range of actuator motion comb drives rely on fringe E-fields and actuation force is constant throughout the stroke. The parallel plate electrostatic attraction force, on the other hand, is proportional to 1/d2, where d is the gap between the parallel electrodes (plates). When significant parallel plate electrostatic attraction occurs the plates are drawn even more closely together. This positive feedback loop causes the two plates (or in this case comb arms) to snap together resulting in a short and stiction between the two surfaces, unless the voltage is very rapidly reduced to eliminate the electrostatic attractive force, allowing the springs to prevent contact. Once the two surfaces are stuck together the spring force is generally insufficient to pull them apart and they must be separated using a probe and a micro-manipulator. Therefore if the voltage waveform is left on too long and at too high a magnitude the comb fingers approach each other too closely and pull-in results – the stuck-closed failure. The built-in stops in the TRA should have prevented actual contact between the moving and stationary comb arms, but in the open region of the actuator (Figs 4 and 5) there were no stops and contact occurred as is described in the next section.
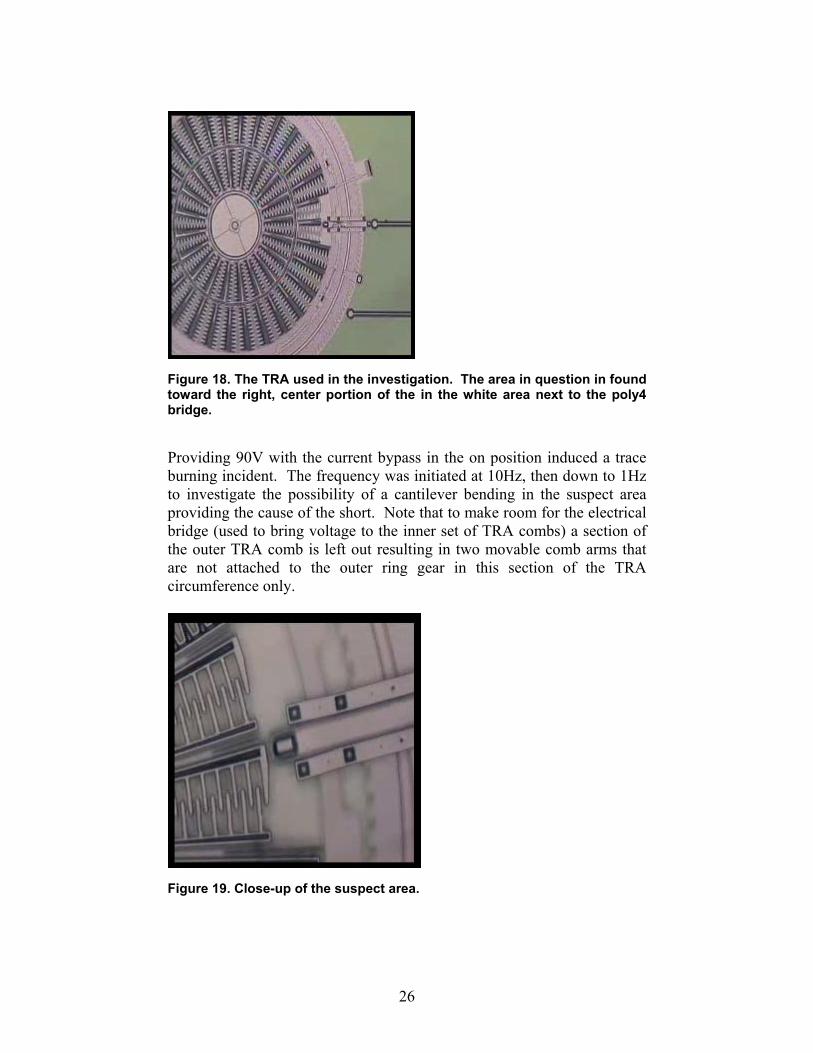
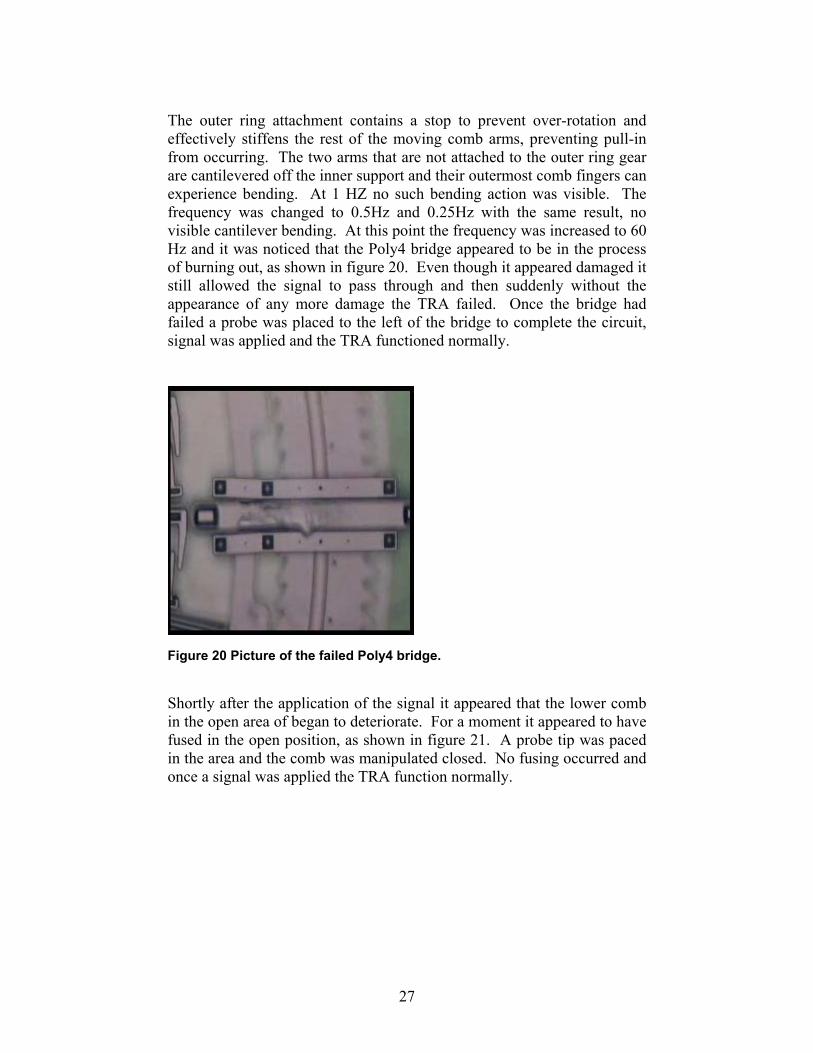
1.7.3 Burned Electrical Bridge The burned bridge failure can be considered as the stuck closed failure plus high current. When operating the pumping system “dry”, no liquids present in the channel or pumping mechanism, the actuator moves the pump but once the pump is primed with liquid the additional load causes the system to freeze (stuck-open failure). This suggests that the amount of torque generated by the system is not enough to overcome the added load imparted onto the pumping and channel surfaces by the liquid. A way to try to overcome this phenomenon is to employ a current bypass, the current is no longer limited, through the “Widowmaker” (Sandia developed high speed, high power amplifier with built in safety features) to provide the system with a greater torque. Generally the amplifier that drives the TRA is operated with a current limiting MΩ resistor that reduces the frequency response of the amplifier. When this resistor is bypassed the added current increases the frequency response of the TRA (speed of capacitor charging) and increases the chance for the TRA to short and subsequently fuse causing failure. Fusing occurred in one area of the actuator. Figure 18 shows the TRA with the area in question being located to the right, center of the TRA. A close up of the suspect area can be seen in figure 19. It should be noted that this trace burning failure also occurred when actuating the device dry if the bypass was employed, but we didn’t notice it because we generally did not utilize the bypass for dry actuation as the extra current (power) was not necessary for effective dry operation.
26
Figure 18. The TRA used in the investigation. The area in question in found toward the right, center portion of the in the white area next to the poly4 bridge.
Providing 90V with the current bypass in the on position induced a trace burning incident. The frequency was initiated at 10Hz, then down to 1Hz to investigate the possibility of a cantilever bending in the suspect area providing the cause of the short. Note that to make room for the electrical bridge (used to bring voltage to the inner set of TRA combs) a section of the outer TRA comb is left out resulting in two movable comb arms that are not attached to the outer ring gear in this section of the TRA circumference only.
Figure 19. Close-up of the suspect area.
27
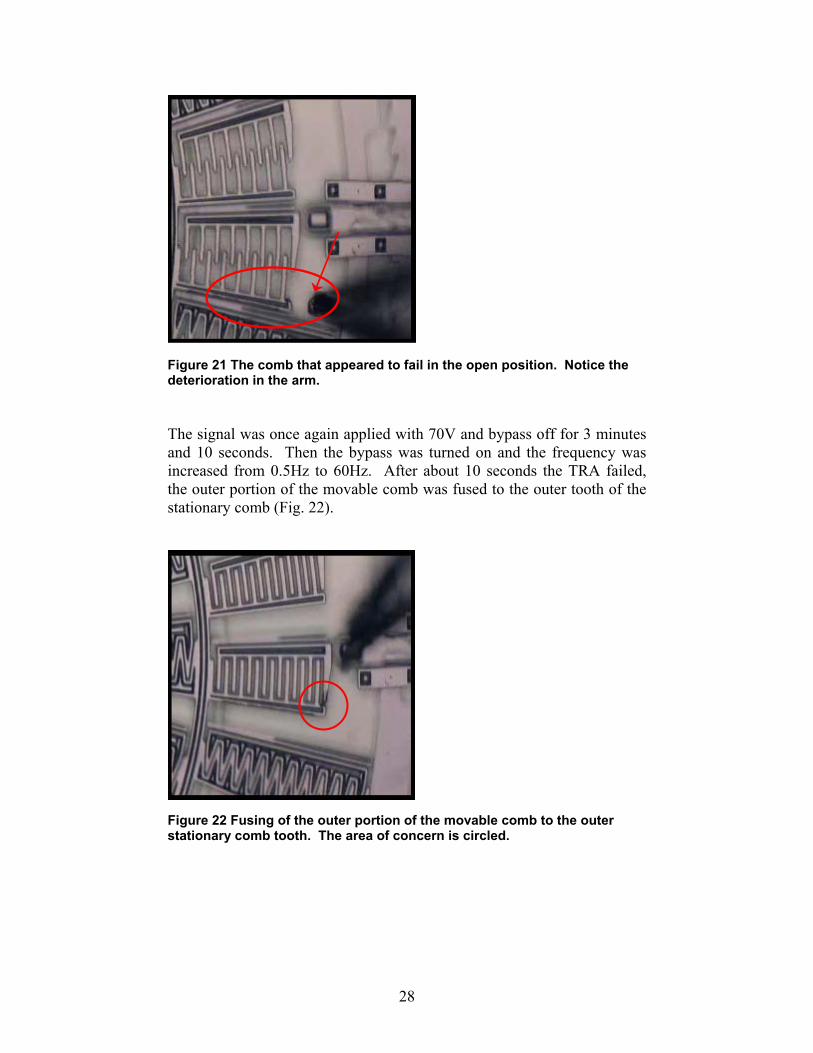
The outer ring attachment contains a stop to prevent over-rotation and effectively stiffens the rest of the moving comb arms, preventing pull-in from occurring. The two arms that are not attached to the outer ring gear are cantilevered off the inner support and their outermost comb fingers can experience bending. At 1 HZ no such bending action was visible. The frequency was changed to 0.5Hz and 0.25Hz with the same result, no visible cantilever bending. At this point the frequency was increased to 60 Hz and it was noticed that the Poly4 bridge appeared to be in the process of burning out, as shown in figure 20. Even though it appeared damaged it still allowed the signal to pass through and then suddenly without the appearance of any more damage the TRA failed. Once the bridge had failed a probe was placed to the left of the bridge to complete the circuit, signal was applied and the TRA functioned normally.
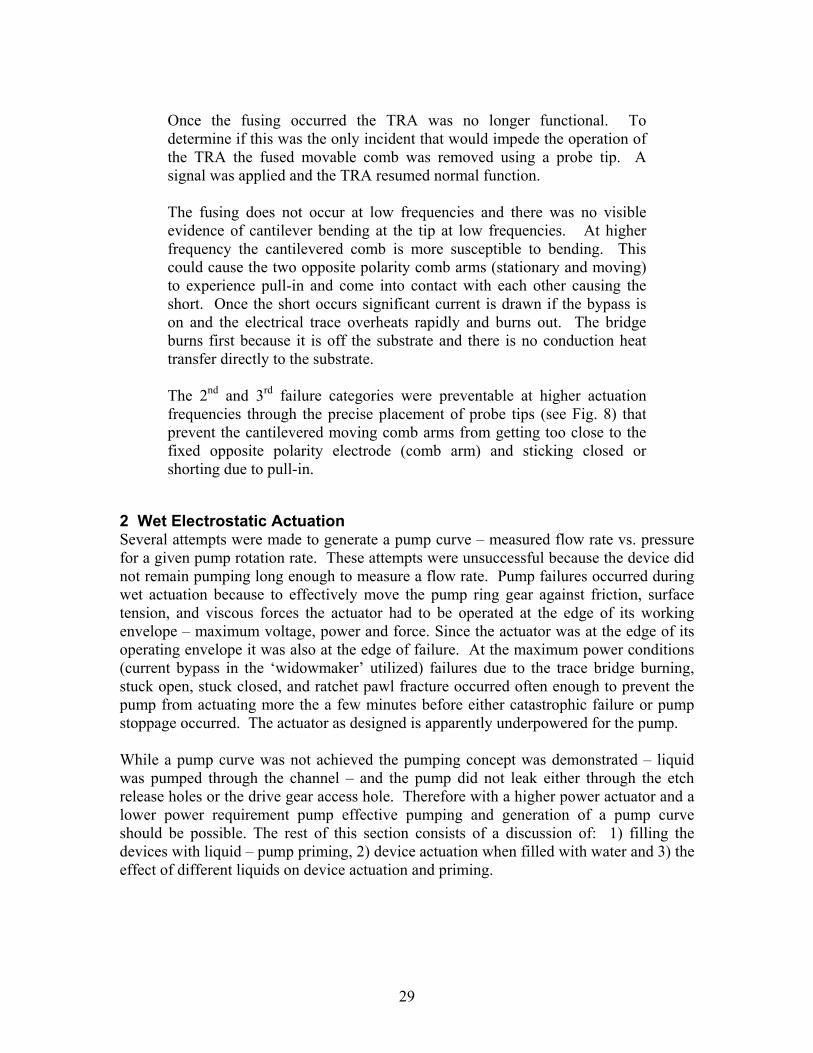
Figure 20 Picture of the failed Poly4 bridge. Shortly after the application of the signal it appeared that the lower comb in the open area of began to deteriorate. For a moment it appeared to have fused in the open position, as shown in figure 21. A probe tip was paced in the area and the comb was manipulated closed. No fusing occurred and once a signal was applied the TRA function normally.
28
Figure 21 The comb that appeared to fail in the open position. Notice the deterioration in the arm.
The signal was once again applied with 70V and bypass off for 3 minutes and 10 seconds. Then the bypass was turned on and the frequency was increased from 0.5Hz to 60Hz. After about 10 seconds the TRA failed, the outer portion of the movable comb was fused to the outer tooth of the stationary comb (Fig. 22).
Figure 22 Fusing of the outer portion of the movable comb to the outer stationary comb tooth. The area of concern is circled.
29
Once the fusing occurred the TRA was no longer functional. To determine if this was the only incident that would impede the operation of the TRA the fused movable comb was removed using a probe tip. A signal was applied and the TRA resumed normal function. The fusing does not occur at low frequencies and there was no visible evidence of cantilever bending at the tip at low frequencies. At higher frequency the cantilevered comb is more susceptible to bending. This could cause the two opposite polarity comb arms (stationary and moving) to experience pull-in and come into contact with each other causing the short. Once the short occurs significant current is drawn if the bypass is on and the electrical trace overheats rapidly and burns out. The bridge burns first because it is off the substrate and there is no conduction heat transfer directly to the substrate. The 2nd and 3rd failure categories were preventable at higher actuation frequencies through the precise placement of probe tips (see Fig. 8) that prevent the cantilevered moving comb arms from getting too close to the fixed opposite polarity electrode (comb arm) and sticking closed or shorting due to pull-in.
2 Wet Electrostatic Actuation Several attempts were made to generate a pump curve – measured flow rate vs. pressure for a given pump rotation rate. These attempts were unsuccessful because the device did not remain pumping long enough to measure a flow rate. Pump failures occurred during wet actuation because to effectively move the pump ring gear against friction, surface tension, and viscous forces the actuator had to be operated at the edge of its working envelope – maximum voltage, power and force. Since the actuator was at the edge of its operating envelope it was also at the edge of failure. At the maximum power conditions (current bypass in the ‘widowmaker’ utilized) failures due to the trace bridge burning, stuck open, stuck closed, and ratchet pawl fracture occurred often enough to prevent the pump from actuating more the a few minutes before either catastrophic failure or pump stoppage occurred. The actuator as designed is apparently underpowered for the pump. While a pump curve was not achieved the pumping concept was demonstrated – liquid was pumped through the channel – and the pump did not leak either through the etch release holes or the drive gear access hole. Therefore with a higher power actuator and a lower power requirement pump effective pumping and generation of a pump curve should be possible. The rest of this section consists of a discussion of: 1) filling the devices with liquid – pump priming, 2) device actuation when filled with water and 3) the effect of different liquids on device actuation and priming.
30
2.1 Pump Priming The following procedure was used to prime the pumps. Liquid comes into the pump from the back side of the silicon die through a Bosch etched hole into the center of the pump and then fills along the spiral channel to the attached surface micromachined channel and out the exit Bosch etched hole at the end of the channel. The Bosch etches go through the wafer in a two step process that results in a counterbored through hole from the back of the wafer. Thirty gage stainless steel capillary tubes are inserted into the entrance and exit holes from the back until they abut the bottom of the counterbore (about ½ way through the die). The tubes are attached in place using superglue or epoxy and may be sealed with additional silicone adhesive layers over the bottom and edges, but not on top of, the die. Care must be take so as not to get glue into the capillary and plug the device. A plastic tube (typically Teflon) with an inner diameter that is slightly larger than the steel capillary outer diameter is slid over the steel capillary and glued in place. This tube leads to a syringe pump that is used to move liquid to the device. When the meniscus reaches the device a 3-way valve is used to switch from flow rate controlled filling (syringe pump) to pressure controlled filling – a column of liquid (head). The device is filled very slowly using head control. Often a very slight vacuum (on the order of -0.1 Atm gage pressure) was pulled on the exit of the channel to pull the liquid the final short distance through the pump and channel. This vacuum was applied by pulling on an air filled syringe attached to the outlet capillary. A Teflon tube is glued onto the steel capillary at the exit to the built in channel (outlet capillary) and the syringe is attached to this tube using a Luer-lok connection. By timing the motion of the meniscus along the transparent exit tube, the flow rate can be measured. The device is considered primed when the meniscus in the outlet tube is clearly observed moving.
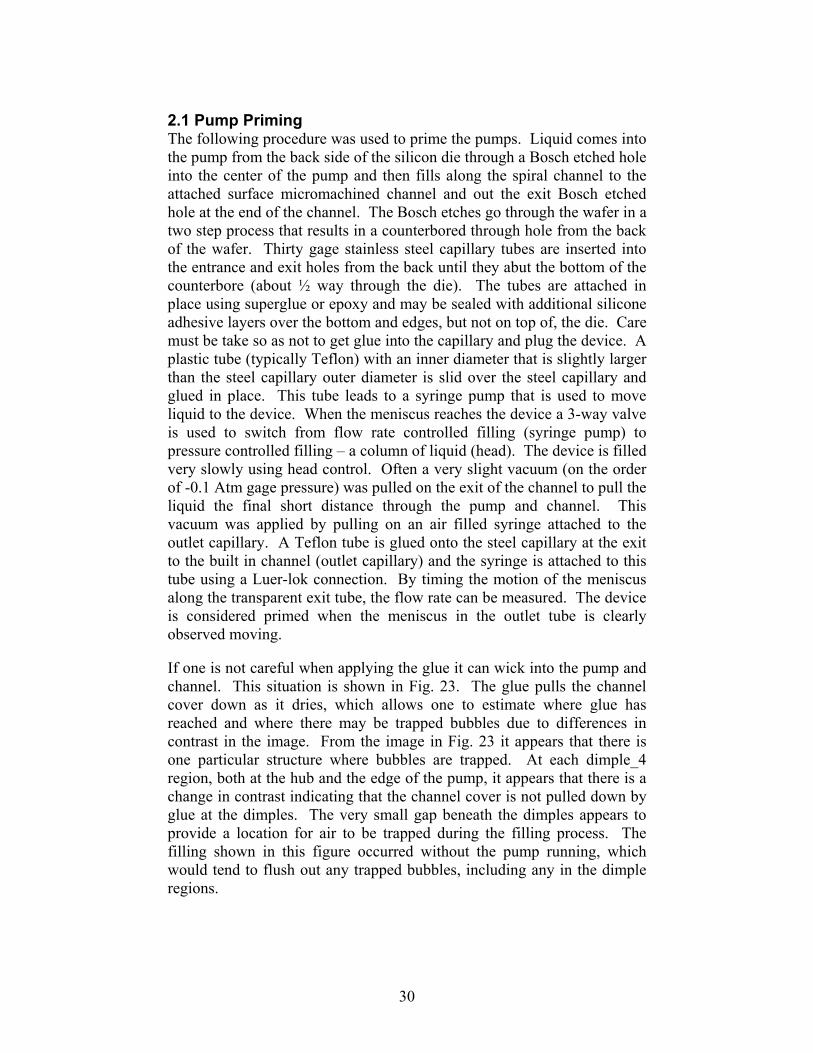
If one is not careful when applying the glue it can wick into the pump and channel. This situation is shown in Fig. 23. The glue pulls the channel cover down as it dries, which allows one to estimate where glue has reached and where there may be trapped bubbles due to differences in contrast in the image. From the image in Fig. 23 it appears that there is one particular structure where bubbles are trapped. At each dimple_4 region, both at the hub and the edge of the pump, it appears that there is a change in contrast indicating that the channel cover is not pulled down by glue at the dimples. The very small gap beneath the dimples appears to provide a location for air to be trapped during the filling process. The filling shown in this figure occurred without the pump running, which would tend to flush out any trapped bubbles, including any in the dimple regions.
31
The superglue did not leak out the etch release holes. At the etch release holes the liquid must make a 90 degree turn in order to leak out and wet along the top of the pump cover. The liquid cannot negotiate this turn with capillary force alone. A significant pressure must be applied to push liquid out these small etch release holes. The center of the liquid volume in the etch release hole is below the edge of the release hole for the hydrophilic native oxide covered polysilicon surface of the release hole. The center of hole liquid must be pushed up to at least the level of the top of the hole for the hydrophilic top surface to wet (0 degree contact angle for hydrophilic top surface).
Figure 23. Superglue filled impeller pump and channel shows device filling (spiral pump filling similar)
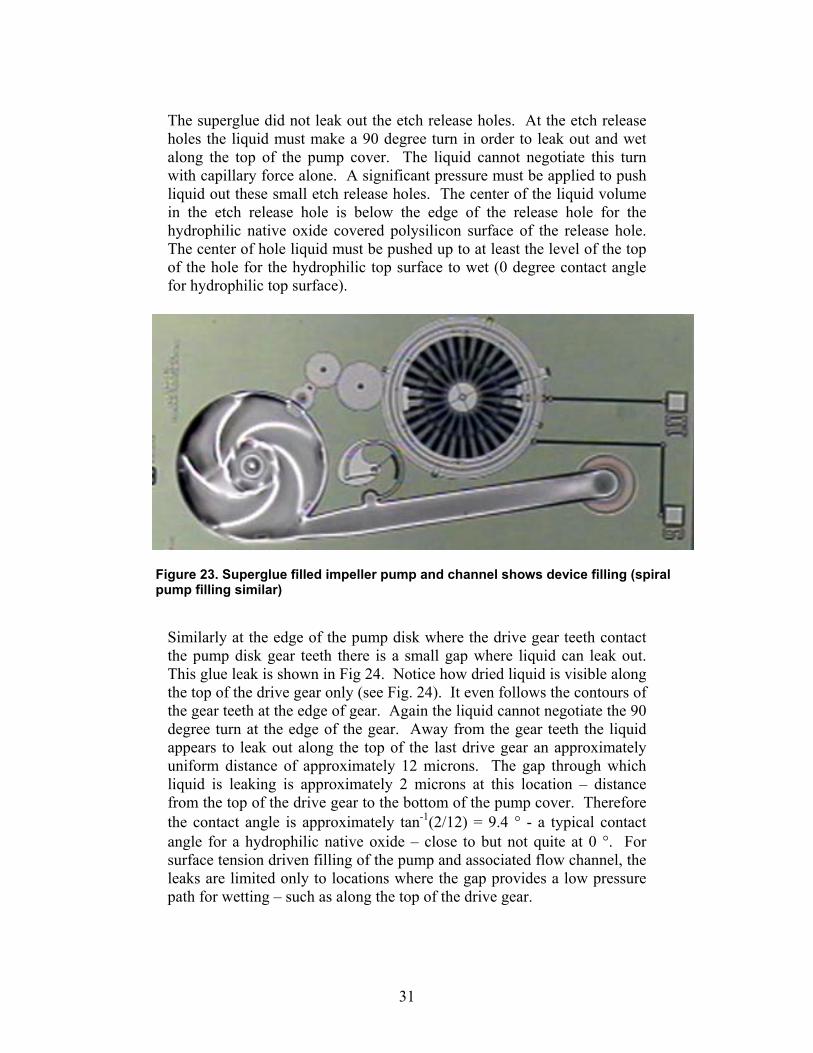
Similarly at the edge of the pump disk where the drive gear teeth contact the pump disk gear teeth there is a small gap where liquid can leak out. This glue leak is shown in Fig 24. Notice how dried liquid is visible along the top of the drive gear only (see Fig. 24). It even follows the contours of the gear teeth at the edge of gear. Again the liquid cannot negotiate the 90 degree turn at the edge of the gear. Away from the gear teeth the liquid appears to leak out along the top of the last drive gear an approximately uniform distance of approximately 12 microns. The gap through which liquid is leaking is approximately 2 microns at this location – distance from the top of the drive gear to the bottom of the pump cover. Therefore the contact angle is approximately tan-1(2/12) = 9.4 ° - a typical contact angle for a hydrophilic native oxide – close to but not quite at 0 °. For surface tension driven filling of the pump and associated flow channel, the leaks are limited only to locations where the gap provides a low pressure path for wetting – such as along the top of the drive gear.
32
Figure 24. Meniscus at drive gear opening.
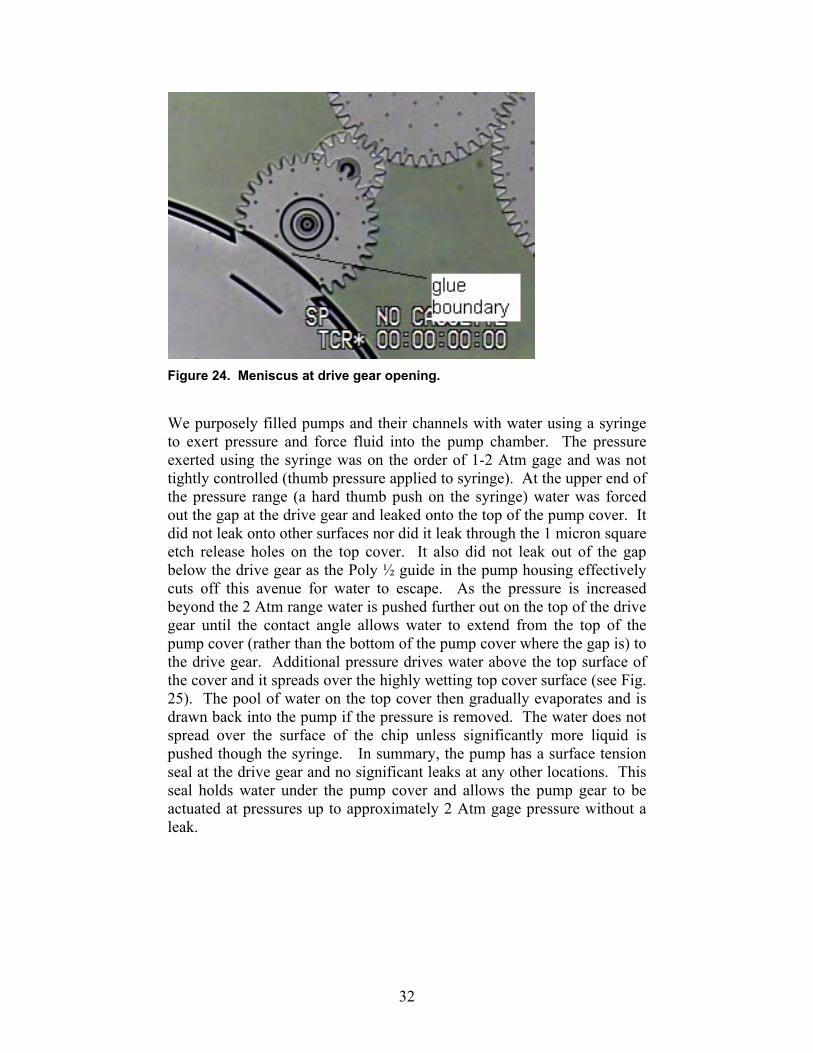
We purposely filled pumps and their channels with water using a syringe to exert pressure and force fluid into the pump chamber. The pressure exerted using the syringe was on the order of 1-2 Atm gage and was not tightly controlled (thumb pressure applied to syringe). At the upper end of the pressure range (a hard thumb push on the syringe) water was forced out the gap at the drive gear and leaked onto the top of the pump cover. It did not leak onto other surfaces nor did it leak through the 1 micron square etch release holes on the top cover. It also did not leak out of the gap below the drive gear as the Poly ½ guide in the pump housing effectively cuts off this avenue for water to escape. As the pressure is increased beyond the 2 Atm range water is pushed further out on the top of the drive gear until the contact angle allows water to extend from the top of the pump cover (rather than the bottom of the pump cover where the gap is) to the drive gear. Additional pressure drives water above the top surface of the cover and it spreads over the highly wetting top cover surface (see Fig. 25). The pool of water on the top cover then gradually evaporates and is drawn back into the pump if the pressure is removed. The water does not spread over the surface of the chip unless significantly more liquid is pushed though the syringe. In summary, the pump has a surface tension seal at the drive gear and no significant leaks at any other locations. This seal holds water under the pump cover and allows the pump gear to be actuated at pressures up to approximately 2 Atm gage pressure without a leak.
33
Figure 25. Water forced out onto the top of the pump cover by approximately 2 Atm of applied pressure.
Flow analyses conducted before this fill testing [14, 19] indicates that we can expect maximum pressures on the order of 0.1 to 1 Atm during pumping. It should also be noted that a pressure of 15000 N/m2 (0.15 Atm) was applied with a flow rate of 30 nl/sec during flow channel resistance characterization (section 3) without any observable leaks. From these observations we can conclude that liquid leakage will not be a problem with these devices. All of these observations were made with the hydrophilic (supercritically dried) release. Hydrophobically released (VSAM) devices should be even less likely to leak.
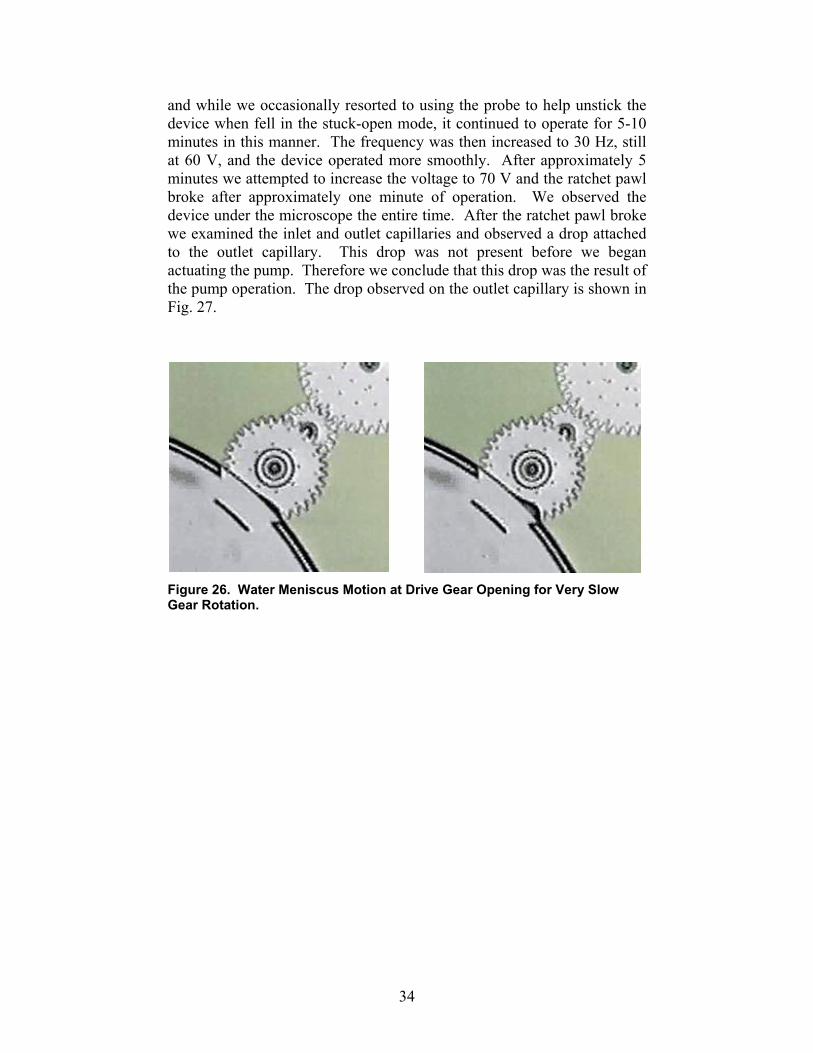
2.2 Pump Actuation when Filled with Water We were able to demonstrate that the device could pump water, although the pump was too inconsistent to generate a pump curve. Initially, there was no liquid observed at the exit capillary (glued into the exit Bosch hole at the end of the channel connected to the pump). We rotated the drive gear manually using a probe tip and observed meniscus motion as in Fig. 26. This also demonstrated that the gears could turn readily, that the pump gear was free from the top cover, and that the presence of liquid in the pump or any liquid gas interfaces associated with trapped air bubbles did not unduly hinder pump gear rotation. We then began experimenting with various drive signals. At 2 Hz we were able to actuate the pump using the 50 V ¼ sine wave signal. We increased the frequency to 10 Hz and the voltage to 60 V and continued actuation. Actuation was somewhat rough with occasional misses. A miss refers to a actuation that does not advance the pawl to the next ratchet tooth and consequently the drive gear does not rotate. If the system is stuck in the missing mode the rocking motion described earlier results. In this case while there was occasional missing
34
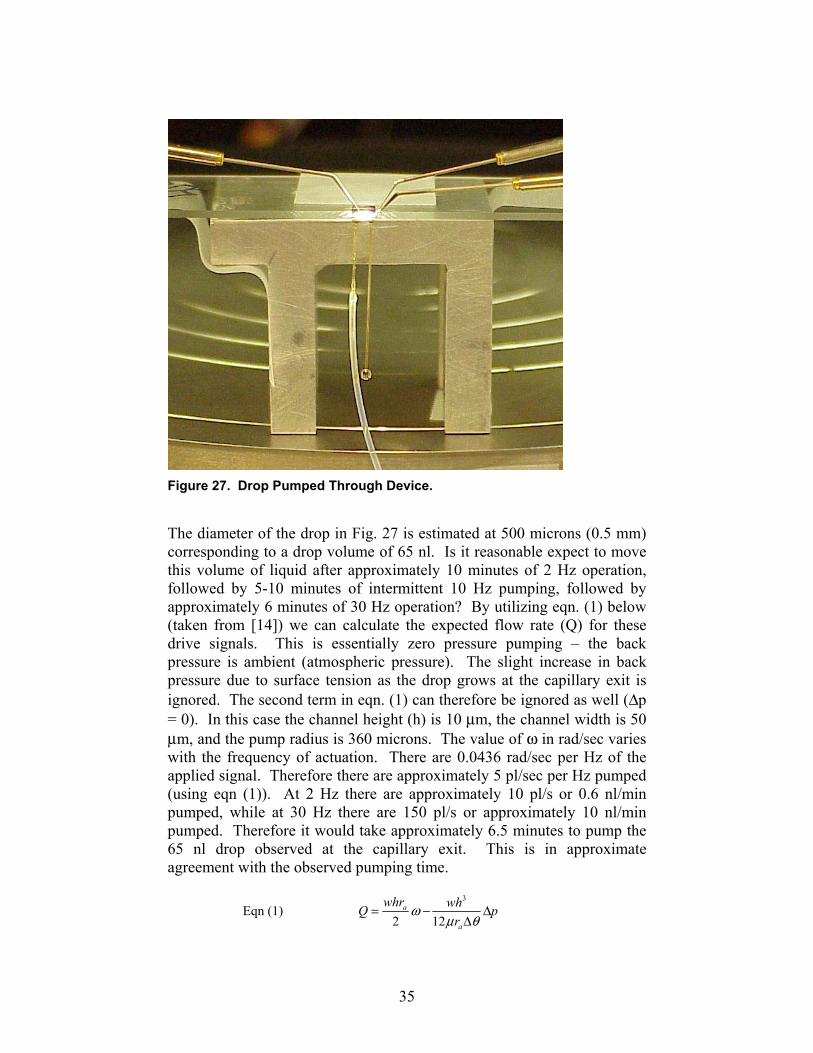
and while we occasionally resorted to using the probe to help unstick the device when fell in the stuck-open mode, it continued to operate for 5-10 minutes in this manner. The frequency was then increased to 30 Hz, still at 60 V, and the device operated more smoothly. After approximately 5 minutes we attempted to increase the voltage to 70 V and the ratchet pawl broke after approximately one minute of operation. We observed the device under the microscope the entire time. After the ratchet pawl broke we examined the inlet and outlet capillaries and observed a drop attached to the outlet capillary. This drop was not present before we began actuating the pump. Therefore we conclude that this drop was the result of the pump operation. The drop observed on the outlet capillary is shown in Fig. 27.
Figure 26. Water Meniscus Motion at Drive Gear Opening for Very Slow Gear Rotation.
35
Figure 27. Drop Pumped Through Device.
The diameter of the drop in Fig. 27 is estimated at 500 microns (0.5 mm) corresponding to a drop volume of 65 nl. Is it reasonable expect to move this volume of liquid after approximately 10 minutes of 2 Hz operation, followed by 5-10 minutes of intermittent 10 Hz pumping, followed by approximately 6 minutes of 30 Hz operation? By utilizing eqn. (1) below (taken from [14]) we can calculate the expected flow rate (Q) for these drive signals. This is essentially zero pressure pumping – the back pressure is ambient (atmospheric pressure). The slight increase in back pressure due to surface tension as the drop grows at the capillary exit is ignored. The second term in eqn. (1) can therefore be ignored as well (∆p = 0). In this case the channel height (h) is 10 µm, the channel width is 50 µm, and the pump radius is 360 microns. The value of ω in rad/sec varies with the frequency of actuation. There are 0.0436 rad/sec per Hz of the applied signal. Therefore there are approximately 5 pl/sec per Hz pumped (using eqn (1)). At 2 Hz there are approximately 10 pl/s or 0.6 nl/min pumped, while at 30 Hz there are 150 pl/s or approximately 10 nl/min pumped. Therefore it would take approximately 6.5 minutes to pump the 65 nl drop observed at the capillary exit. This is in approximate agreement with the observed pumping time.
Eqn (1) 3
2 12a
a
whr whQ pr
ωµ θ
= − ∆∆
36
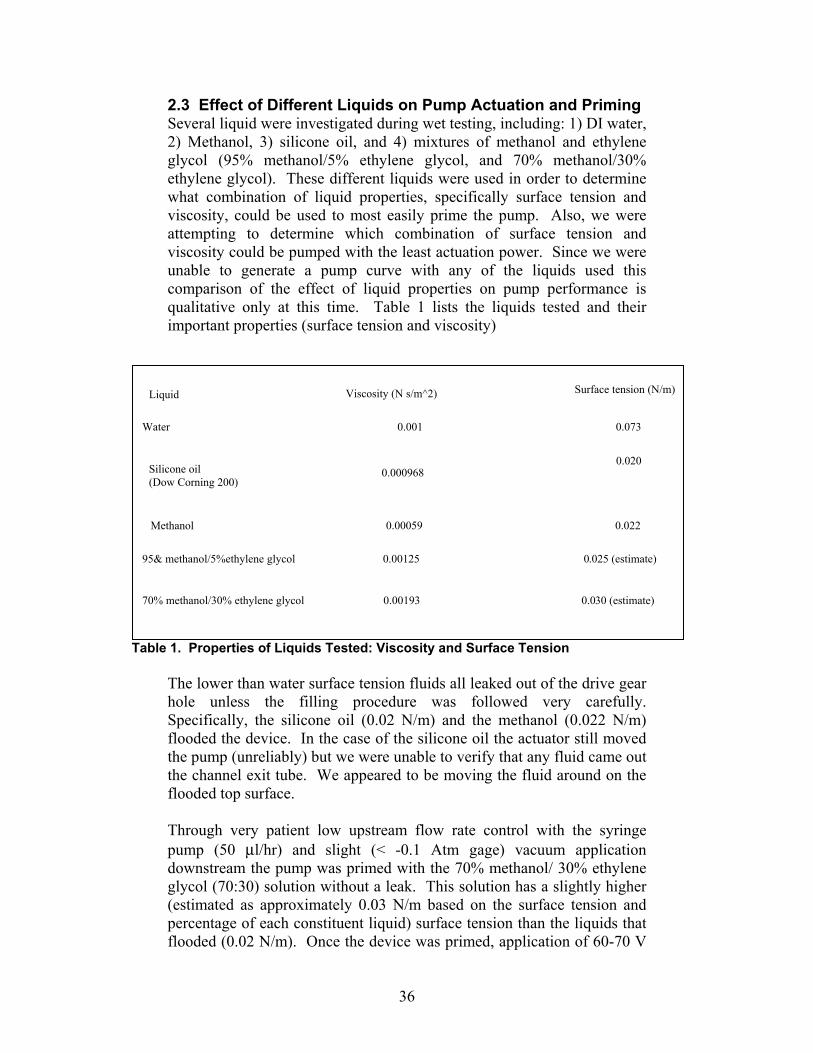
2.3 Effect of Different Liquids on Pump Actuation and Priming Several liquid were investigated during wet testing, including: 1) DI water, 2) Methanol, 3) silicone oil, and 4) mixtures of methanol and ethylene glycol (95% methanol/5% ethylene glycol, and 70% methanol/30% ethylene glycol). These different liquids were used in order to determine what combination of liquid properties, specifically surface tension and viscosity, could be used to most easily prime the pump. Also, we were attempting to determine which combination of surface tension and viscosity could be pumped with the least actuation power. Since we were unable to generate a pump curve with any of the liquids used this comparison of the effect of liquid properties on pump performance is qualitative only at this time. Table 1 lists the liquids tested and their important properties (surface tension and viscosity)
Table 1. Properties of Liquids Tested: Viscosity and Surface Tension
The lower than water surface tension fluids all leaked out of the drive gear hole unless the filling procedure was followed very carefully. Specifically, the silicone oil (0.02 N/m) and the methanol (0.022 N/m) flooded the device. In the case of the silicone oil the actuator still moved the pump (unreliably) but we were unable to verify that any fluid came out the channel exit tube. We appeared to be moving the fluid around on the flooded top surface. Through very patient low upstream flow rate control with the syringe pump (50 µl/hr) and slight (< -0.1 Atm gage) vacuum application downstream the pump was primed with the 70% methanol/ 30% ethylene glycol (70:30) solution without a leak. This solution has a slightly higher (estimated as approximately 0.03 N/m based on the surface tension and percentage of each constituent liquid) surface tension than the liquids that flooded (0.02 N/m). Once the device was primed, application of 60-70 V
Liquid Viscosity (N s/m^2) Surface tension (N/m)
Water 0.001 0.073
Silicone oil (Dow Corning 200)
0.000968 0.020
Methanol 0.00059 0.022
95& methanol/5%ethylene glycol 0.00125 0.025 (estimate)
70% methanol/30% ethylene glycol 0.00193 0.030 (estimate)
37
with the ‘widowmaker’ bypass on resulted in actuation of the pump. At lower voltages or without the bypass the pump did not actuate. After about 10 minutes of operation with the bypass on the trace bridge burned out as was observed during dry testing. From the above observations we can form the following hypotheses: 1) Surface tension of 0.02 N/m is too low and leads to a leak out of the drive gear opening. Surface tension must be at least 0.03 N/m and preferably even higher – 0.05 to 0.07 N/m for leak free operation with this design that utilizes a surface tension seal. 2) Once primed without a leak the water and 70:30 solutions behaved similarly, operating at about 70 V with ¼ sine wave or modified ¼ sine wave signals at 10-30 Hz with the widowmaker bypass on. With both liquids the actuation was unreliable and failed after only about 10 minutes of actuation. The viscosity of the 70:30 solution was about twice that of water and the surface tension was about ½ that of the DI water. This seems to indicate that viscous losses would be greater with the 70:30 solution but surface tension related losses associated with stretching phase interfaces in the pump (either at trapped bubbles or at the drive gear opening interface) would be less by about the same amount, resulting in roughly the same force and energy input requirements for pumping each liquid. Viscous and surface tension forces appear to be roughly the same order of magnitude. A fluid that would be easier to pump than water would have lower surface tension and lower viscosity than water – such as the methanol did – but not so low as to leak out of the pump. To improve the probability of pumping we could search for a liquid with a surface tension of 0.05 to 0.06 N/m and a viscosity less than 10-3 N s/m2.
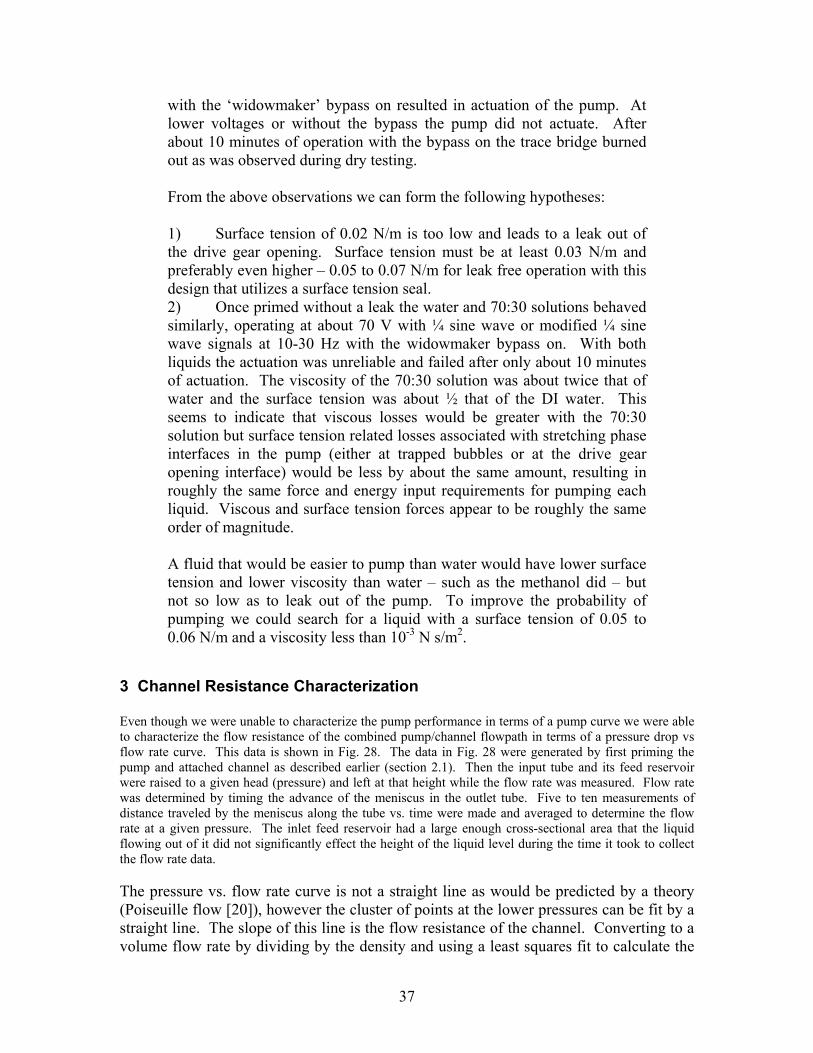
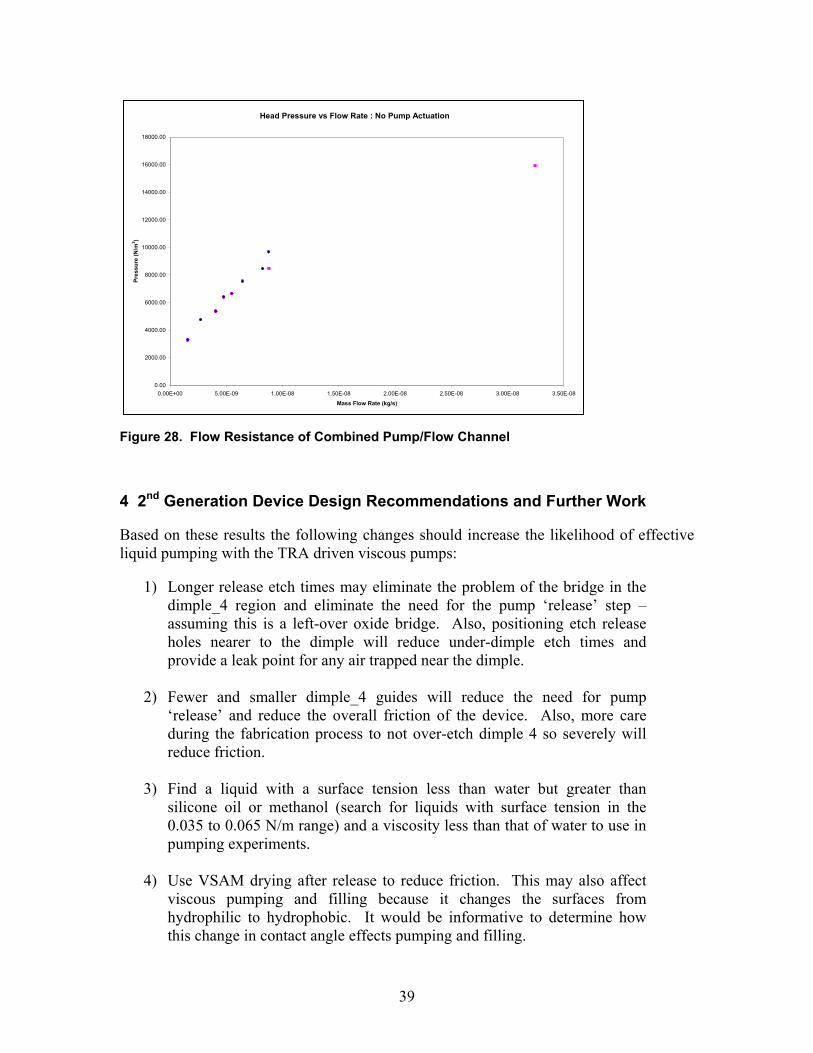
3 Channel Resistance Characterization Even though we were unable to characterize the pump performance in terms of a pump curve we were able to characterize the flow resistance of the combined pump/channel flowpath in terms of a pressure drop vs flow rate curve. This data is shown in Fig. 28. The data in Fig. 28 were generated by first priming the pump and attached channel as described earlier (section 2.1). Then the input tube and its feed reservoir were raised to a given head (pressure) and left at that height while the flow rate was measured. Flow rate was determined by timing the advance of the meniscus in the outlet tube. Five to ten measurements of distance traveled by the meniscus along the tube vs. time were made and averaged to determine the flow rate at a given pressure. The inlet feed reservoir had a large enough cross-sectional area that the liquid flowing out of it did not significantly effect the height of the liquid level during the time it took to collect the flow rate data. The pressure vs. flow rate curve is not a straight line as would be predicted by a theory (Poiseuille flow [20]), however the cluster of points at the lower pressures can be fit by a straight line. The slope of this line is the flow resistance of the channel. Converting to a volume flow rate by dividing by the density and using a least squares fit to calculate the
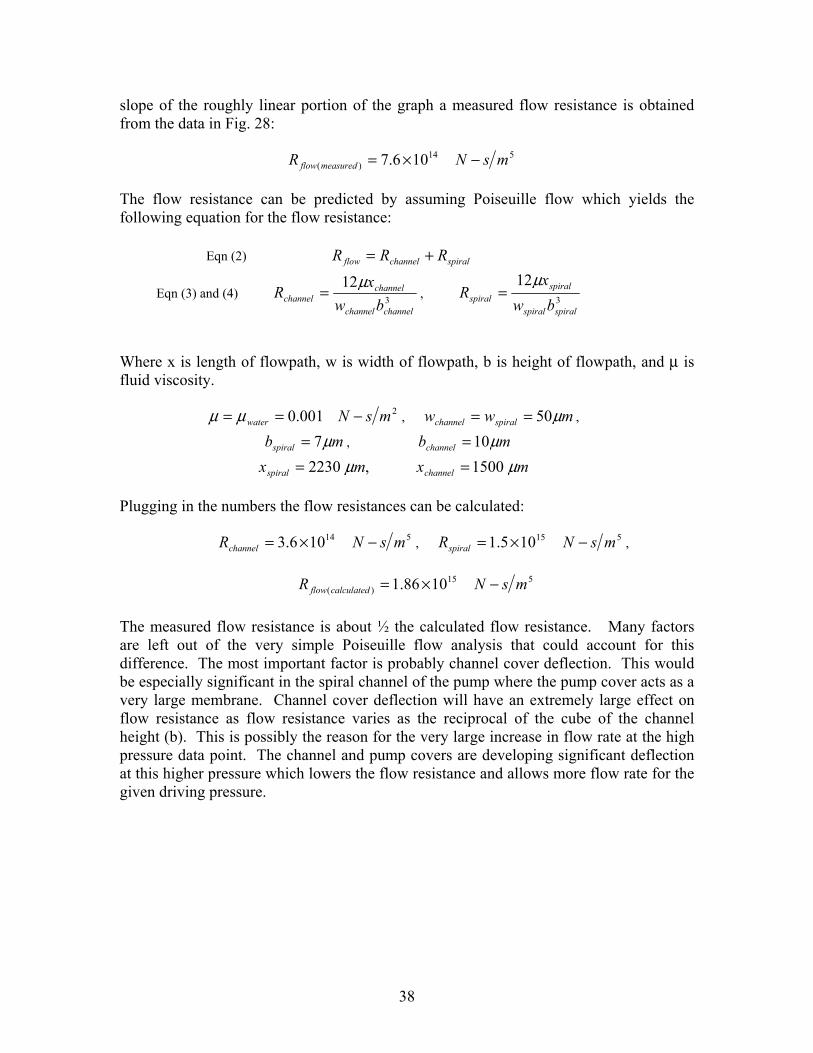
38
slope of the roughly linear portion of the graph a measured flow resistance is obtained from the data in Fig. 28: 514
)( 106.7 msNR measuredflow −×= The flow resistance can be predicted by assuming Poiseuille flow which yields the following equation for the flow resistance: Eqn (2) spiralchannelflow RRR +=
Eqn (3) and (4) 3
12
channelchannel
channelchannel bw
xR
µ= , 3
12
spiralspiral
spiralspiral bw
xR
µ=
Where x is length of flowpath, w is width of flowpath, b is height of flowpath, and µ is fluid viscosity. 2001.0 msNwater −== µµ , mww spiralchannel µ50== ,
mbspiral µ7= , mbchannel µ10=
mxmx channelspiral µµ 1500,2230 == Plugging in the numbers the flow resistances can be calculated: 514106.3 msNRchannel −×= , 515105.1 msNRspiral −×= , 515
)( 1086.1 msNR calculatedflow −×=
The measured flow resistance is about ½ the calculated flow resistance. Many factors are left out of the very simple Poiseuille flow analysis that could account for this difference. The most important factor is probably channel cover deflection. This would be especially significant in the spiral channel of the pump where the pump cover acts as a very large membrane. Channel cover deflection will have an extremely large effect on flow resistance as flow resistance varies as the reciprocal of the cube of the channel height (b). This is possibly the reason for the very large increase in flow rate at the high pressure data point. The channel and pump covers are developing significant deflection at this higher pressure which lowers the flow resistance and allows more flow rate for the given driving pressure.
39
Figure 28. Flow Resistance of Combined Pump/Flow Channel 4 2nd Generation Device Design Recommendations and Further Work Based on these results the following changes should increase the likelihood of effective liquid pumping with the TRA driven viscous pumps:
1) Longer release etch times may eliminate the problem of the bridge in the dimple_4 region and eliminate the need for the pump ‘release’ step – assuming this is a left-over oxide bridge. Also, positioning etch release holes nearer to the dimple will reduce under-dimple etch times and provide a leak point for any air trapped near the dimple.
2) Fewer and smaller dimple_4 guides will reduce the need for pump
‘release’ and reduce the overall friction of the device. Also, more care during the fabrication process to not over-etch dimple 4 so severely will reduce friction.
3) Find a liquid with a surface tension less than water but greater than
silicone oil or methanol (search for liquids with surface tension in the 0.035 to 0.065 N/m range) and a viscosity less than that of water to use in pumping experiments.
4) Use VSAM drying after release to reduce friction. This may also affect
viscous pumping and filling because it changes the surfaces from hydrophilic to hydrophobic. It would be informative to determine how this change in contact angle effects pumping and filling.
Head Pressure vs Flow Rate : No Pump Actuation
0.00
2000.00
4000.00
6000.00
8000.00
10000.00
12000.00
14000.00
16000.00
18000.00
0.00E+00 5.00E-09 1.00E-08 1.50E-08 2.00E-08 2.50E-08 3.00E-08 3.50E-08
Mass Flow Rate (kg/s)
Pres
sure
(N/m
2 )
40
5) Reducing the pump size (diameter) should reduce the torque required to
actuate the pump and reduce the pump/actuator size mismatch. With the current pump/actuator designs the actuator is mismatched with the pump in that it must operate at its maximum capacity to just barely move the pump.
6) Increase the torque that can be delivered by the actuator. The following
subtasks fit in this category:
a. Better actuator stops, both closing and opening (note: the latest and greatest TRA’s as designed by Jeff Lantz have these). This could eliminate the need for using the probes to prevent actuator stuck open and stuck closed failures.
b. Beefed up small gear. Since this was typically the only
gear that failed or rather the gear that failed first increase its size so that it can withstand higher forces.
c. Beefed up ratchet pawl head. This will reduce the ratchet
pawl failures at the higher torques. d. Thicker or at least wider trace bridge. This will reduce the
likelihood that the trace burning failure will occur. e. Use a higher torque/lower speed transmission (lower gear
ratio).
7) Transparent cover. Using the SwIFTTM process or a modified SUMMiTTM process replace the poly4 cover (or use the metal layer, but replace metal with silicon nitride) to make a pump that we can see into to investigate flow details – including possible trapped bubbles, and PIV (particle image velocimetry) using beads to seed the flow.
8) Modeling. The are several levels of modeling that could be useful in
enhancing our understanding of viscous pumps:
a. Dynamic analysis. Calculate forces (electrostatic and friction), spring constants, and viscous damping coefficients and use F=ma to determine dynamic response of the combined pump/actuator system. This could be used to size the actuator and pump more correctly, and determine a more optimum drive signal waveform and frequency. Include electrical effects such as charging time for the TRA comb drive modeled as a capacitor.
41
b. Perform power and energy analysis using inputs as in the dynamic analysis. This will allow comparison with other pumps and determination of system efficiency. Since such an analysis has already been done with just the pump [14] the incorporation of actuator modeling will allow a complete system analysis.
c. CFD (computational fluid dynamics) analysis of flowfield
details to increase pump efficiency and reliability. Specifically investigation of filling and leaking phenomena in order to identify and eliminate any possible trapped bubbles, and flow separation losses at the entrance and exit to the spiral pump channel.
42
References 1. J. J. Sniegowski, M. P. de Boer, “IC-compatible Polysilicon Surface Micromachining.” Annu. Rev. Mater. Sci., 30, pp. 299-333, 2000. 2. M Okandan, P Galambos, S S Mani S S J Jakubczak, “Development of Surface Micromachining Technologies for Microfluidics and BioMEMS”, SPIE Microfluidics and BioMEMS 2001, Proceedings of SPIE Vol. 4560 (2001), 133-139. 3. M Okandan, P Galambos, S S Mani and J Jakubczak, “Surface Micromachined Cell Manipulation Device for Transfection and Sample Preparation”, Micro Total Analysis Systems 2001, 305-306. 4. J. M. Ramsey, A. van den Berg eds, Micro Total Analysis Systems 2001, Kluwer Academic Publishers, Boston, 2001. 5. S. Shoji, M. Esashi, “Microflow Devices and Systems,” Jour. Micromechanics & Microengineering, 4, pp. 157-171, 1994. 6. P. H. Paul, D. W. Arnold, D. J. Rakestraw, “Electrokinetic Generation of High Pressures Using Porous Microstructures,” Micro Total Analysis Systems 1998, Kluwer Academic Publishers, Boston, 1998. 7. R. Zengerle, J. Ulrich, S. Kluge, M. Richter, A. Richter. “Bidirectional Silicon Micropump,” Sensors and Actuators A, 50, pp. 81-86, 1995. 8. W. Bernard, H. Kahn, A. Heuer, M. Huff, “Thin-Film Shape-Memory Alloy Actuated Micropumps,” IEEE Jour. of Microelectromechanical Systems, 7 no. 2, pp. 245-251, 1998. 9. D. Xu, L. Wang, G. Ding, Y Zhou, A. Yu, B. Cai, “Characteristics and Fabrication of NiTi/Si Diaphragm Micropump,” Sensors and Actuators A, 93, pp. 87-92, 2001. 10. R. Linnemann, P. Woias, C.-D. Senfft, J. A. Ditterich, “A Self-Priming and Bubble-Tolerant Piezoelectric Silicon Micropump for Liquids and Gases,” Proceedings of the 1998 IEEE Micro-electromechanical Systems Workshop, pp. 532-537, 1998. 11. A. Olsson, O. Larsson, J. Holm, L. Lundbladh, O. Ohman, G. Stemme, “Valve-Less Diffuser Micropumps Fabricated Using Thermoplastic Replication,” Proceedings of the 1997 IEEE Micro-electromechanical Systems Workshop, pp. 305-310, 1997. 12. J. H. Tsai, L. Lin, “A Thermal Bubble Actuated Micronozzle-diffuser Pump,” Proceedings of the 2001 IEEE Micro-electromechanical Systems Workshop, pp. 409-412, 2001.
43
13. M. Sen, D. Wajerski, M. Gad-el-Hak, “A Novel Pump for MEMS Applications,” Journal of Fluids Engineering-Transactions of the ASME, 118 no. 3, pp. 624-627, 1996. 14. M. I. Kilani, P. C. Galambos, Y. S. Haik, C-J Chen, “Design and Analysis of a Surface Micromachined Spiral-Channel Viscous Pump,” ASME Jour. Of Fluids Engineering, 125, pp. 339-344, 2003. 15. G. T. Mulhern, D. S. Soane, A. T. Howe, “Supercritical Carbon Dioxide Drying of Microstuctures.” International Conference on Solid-State Sensors and Actuators, Transducers’93, pp. 296-299, 1993. 16. D. Tanner, J. Walraven, S. Barnes, N. Smith, F. Bitsie, S. Swanson, “Reliability of a MEMS Torsional Ratcheting Actuator,” Annual Proceedings—Reliability Physics (Symposium), pp. 81-90, 2001. 17. W. P. Eaton, R. L. Jarecki and J. H. Smith, “Prediction of Release-Etch Times for Surface-Micromachined Structures”, 1997 International Conference on Solid-State Sensors and Actuators, Chicago, IL, June 16-19, 1997, Vol. 1, pp. 249-252. 18. T. M. Mayer, M. P. de Boer, N. D. Shinn, P. J. Clews, and T. A. Michalske, “Chemical vapor deposition of fluoroalkylsilane monolayer films for adhesion control in microelectromechanical systems”, J. Vac. Sci. Technol. B, 18 (5), Sep/Oct 2000, pp. 2433-2440. 19. Richard C Givler, personal communication based on GOMA analysis of the viscous drag pump. GOMA is Sandia National Laboratories computational fluid dynamics code incorporating surface tension and fluid/solid interaction models. 20. Frank M. White, “Viscous Fluid Flow”, 2nd edition, McGraw Hill, 1991.
44
Distribution: 1 MS 9018 Central Technical Files, 8945-1 2 MS 0899 Technical Library, 9616 1 MS 0323 D. Chavez, LDRD Office, 1011 1 MS 1080 Paul Galambos, 1769 1 MS 1080 Dave Sandison, 1769 1 MS 1077 Tom Zipperian, 1740 1 MS 1078 Don Rohr, 1701 1 MS 1080 Jay Jakubczak 1703 1 MS 0865 Regan Stinnett, 1903 1 MS 1080 Harold Stewart, 1749 1 MS 1080 Murat Okandan, 1749 1 MS 1080 Jim Allen, 1769 1 MS 1080 Sita Mani, 1749 1 MS 1425 Steve Martin, 1707


