

Dissertation Progress Report
Tim Schoenharl
Notre Dame CSE
February 27, 2007
Tim Schoenharl (Notre Dame CSE) Dissertation Progress Report February 27, 2007 1 / 24

Overview
1 Research Goals
2 Completed Work
3 Status of Completed and Proposed Goals
4 Publications
Tim Schoenharl (Notre Dame CSE) Dissertation Progress Report February 27, 2007 2 / 24
Original Research Goals
� Network Understanding / Anomaly Detection System
� Creation of Simulations from Streaming Data
� Updating Simulations from Streaming Data
� Online Validation Against Streaming Data
� Sensor Steering
Tim Schoenharl (Notre Dame CSE) Dissertation Progress Report February 27, 2007 3 / 24

Original Research Goals
� Network Understanding / Anomaly Detection System Removed
� Creation of Simulations from Streaming Data
� Updating Simulations from Streaming Data
� Online Validation Against Streaming Data
� Sensor Steering Removed
Tim Schoenharl (Notre Dame CSE) Dissertation Progress Report February 27, 2007 4 / 24
Revised Research Goals
Research goals have been revised to reflect the priority of the WIPERproject
� GIS for Data Analysis, Visualization and Simulation
� Data Curation
� WIPER: Simulation Prediction System
� Design and Implementation of WIPER Simulation
� Movement and Activity Models
Tim Schoenharl (Notre Dame CSE) Dissertation Progress Report February 27, 2007 5 / 24

Revised Research Goals
Research goals have been revised to reflect the priority of the WIPERproject
� GIS for Data Analysis, Visualization and Simulation
� Data Curation
� WIPER: Simulation Prediction System System description, publishedin [1, 2, 3]
� Design and Implementation of WIPER Simulation
� Movement and Activity Models
Tim Schoenharl (Notre Dame CSE) Dissertation Progress Report February 27, 2007 6 / 24

Original Research Goal Status
� Creation of Simulations from Streaming Data - Mostly Complete
� Updating of Simulations from Streaming Data - In Progress
� Online Validation Against Streaming Data - Offline Implementation.Working Towards Online Implementation
Tim Schoenharl (Notre Dame CSE) Dissertation Progress Report February 27, 2007 7 / 24
Revised Research Goal Status
� GIS for Visualization and Simulation - Complete
� Data Curation - Complete
� Design and Implementation of WIPER Simulation Prediction System -Mostly complete
� Design and Implementation of WIPER Simulation - Mostly Complete
� Movement and Activity Models - Taxonomy and Implementation ofseveral movement models complete.
Tim Schoenharl (Notre Dame CSE) Dissertation Progress Report February 27, 2007 8 / 24

Creation of Simulations from Streaming Data
1
2
3
4
Tower Activity 1 7 2 5 3 22 4 10
Movement Model
Activity Model
Figure: Graphical Explanation of Process for Generating Simulations fromStreaming Data
Tim Schoenharl (Notre Dame CSE) Dissertation Progress Report February 27, 2007 9 / 24
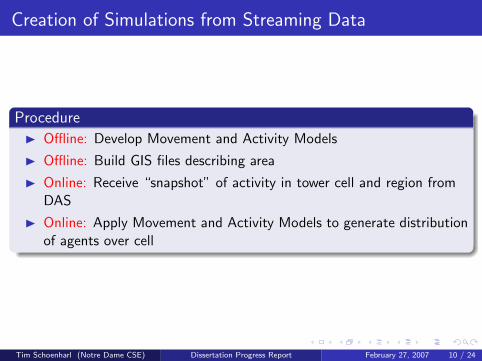
Creation of Simulations from Streaming Data
Procedure
� Offline: Develop Movement and Activity Models
� Offline: Build GIS files describing area
� Online: Receive “snapshot” of activity in tower cell and region fromDAS
� Online: Apply Movement and Activity Models to generate distributionof agents over cell
Tim Schoenharl (Notre Dame CSE) Dissertation Progress Report February 27, 2007 10 / 24

Validation of Simulations
●
●●
●
●
●
●
●
●
●●
●
●●●●●●●●
●
●●●●●●●●●●●●●●●●●●●●●●
●
●
●
●
●
●
●●
●
●
●
●
●
●
●
●
●
●
●
●
●
●
●
●
●
●
●
●
●
●
●
●
●●
●●
●
●
●
●●●
●
●●●
●
●
●
●
●
●
●
●●
●●
●
●●
●
●
●
●●
●
●
●
●
●
●
●
●●
●
●
●
●
●●
●
●
●
●
●
●
●●
●
●●
●●
●
●
●
●●
●
●
●
0 20 40 60 80 100 120 140
020
4060
8010
012
014
0
Call Activity Sampled at 10 Minute Intervals
Time Interval
Cal
l Act
ivity
●●●
●
●
●
●
●
●
●
●
●
●●●●●●●
●
●
●●●●●●●●
●●●●●●●●
●●●●
●●●●
●
●
●
●
●
●●
●
●●
●
●
●
●
●●
●
●
●
●
●
●
●
●
●
●
●●
●
●
●
●
●
●
●
●
●
●
●
●
●
●●●●●
●
●
●
●
●
●
●
●●
●
●
●
●
●
●●
●
●●
●
●
●
●
●
●●
●
●
●
●
●
●
●
●
●
●
●
●
●
●
●
●●
●
●
●
●
●
●●●
●●
●
●
Empirical DataSimulated Data
Figure: Plot of actual andsimulated activity data.
Call Activity Data Validation
� Activity Model uses EmpiricalData to Generate Activity
� Passes Kolmogorov-Smirnovtest, D = 0.0903, p=0.6003,two-sided test at α = 0.05
Tim Schoenharl (Notre Dame CSE) Dissertation Progress Report February 27, 2007 11 / 24

Validation of Simulations
●
●●
●
●
●
●
●
●
●●
●
●●●●●●●●
●
●●●●●●●●●●●●●●●●●●●●●●
●
●
●
●
●
●
●●
●
●
●
●
●
●
●
●
●
●
●
●
●
●
●
●
●
●
●
●
●
●
●
●
●●
●●
●
●
●
●●●
●
●●●
●
●
●
●
●
●
●
●●
●●
●
●●
●
●
●
●●
●
●
●
●
●
●
●
●●
●
●
●
●
●●
●
●
●
●
●
●
●●
●
●●
●●
●
●
●
●●
●
●
●
0 20 40 60 80 100 120 140
020
4060
8010
012
014
0
Call Activity Sampled at 10 Minute Intervals
Time Interval
Cal
l Act
ivity
●
●●
●
●
●●
●
●
●●
●
●●●●●●●
●
●
●●●
●●●●●●●●●●●●●
●●●●
●●●●
●
●
●
●
●
●
●
●
●●
●
●
●
●
●●
●
●
●
●
●
●
●
●
●
●
●●
●
●
●
●
●
●
●
●
●
●
●
●
●
●●●●
●
●
●
●
●
●
●
●
●●
●
●
●
●
●
●
●
●
●●
●
●
●
●
●
●
●
●
●
●
●
●
●
●
●
●
●
●
●
●
●●
●●
●
●
●
●
●
●●●
●
●
●
●
Empirical DataData with Gaussian Noise
Figure: Empirical Data Plottedagainst data normally distributedaround the points.
Call Activity Data Validation
� Data generated by normallydistributing points aroundempirical data
� Generated with mean =empirical data, sd = 1
� Fails Kolmogorov-Smirnov test,D = 0.1389, p = 0.1243,two-sided test at α = 0.05
Tim Schoenharl (Notre Dame CSE) Dissertation Progress Report February 27, 2007 12 / 24

Validation of Simulations
Several issues remain when validating simulations online vs streaming data
� Valid against empirical data? Distribution? Model? Currently usingKS test against empirical data, with poor results
� KS test unable to distinguish normally distributed data generatedfrom empirical distribution
� Idea: Utilize the prior probability of anomaly from MMPP model forvalidation.
� Implement in a per cell fashion, need to be cautious with timeintervals
Tim Schoenharl (Notre Dame CSE) Dissertation Progress Report February 27, 2007 13 / 24

GIS for Visualization and Simulation
Figure: GIS Image from aWIPER Simulation
GIS Uses:
� Visualizing tower locations,relationship to urban areas, etc
� Simulations: agent and towerlocations can be initialized fromdata, agents can interact withreal world geography
Tim Schoenharl (Notre Dame CSE) Dissertation Progress Report February 27, 2007 14 / 24
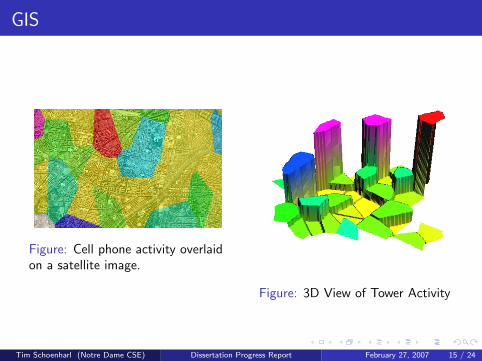
GIS
Figure: Cell phone activity overlaidon a satellite image.
Figure: 3D View of Tower Activity
Tim Schoenharl (Notre Dame CSE) Dissertation Progress Report February 27, 2007 15 / 24
Data Curation
Production Machine(Azrael)
Archive/Test Machine
Internet
Incoming Data
Raw Data
Hashed Data (Flat files and DB Tables)
ND Research Machines
Data Reception Process
-Check Validity of data-Send receipt to data originator-Transfer data to archive
Data Hashing & Encryption
-Files are decompressed, hashed-More thorough integrity checking-Hashed files transferred to Production machine-Raw files are encrypted and stored
Data Upload Server (Sim5)
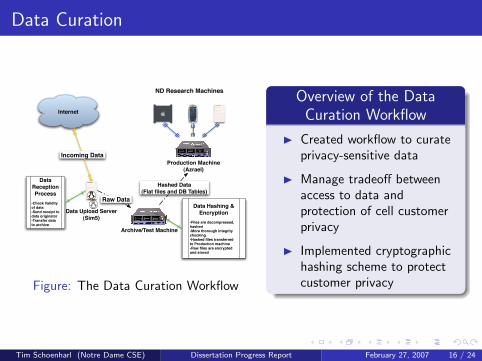
Figure: The Data Curation Workflow
Overview of the DataCuration Workflow
� Created workflow to curateprivacy-sensitive data
� Manage tradeoff betweenaccess to data andprotection of cell customerprivacy
� Implemented cryptographichashing scheme to protectcustomer privacy
Tim Schoenharl (Notre Dame CSE) Dissertation Progress Report February 27, 2007 16 / 24
The WIPER Scenario
Real World
Call Activity
Dynamic Social Network
Anomaly?
Simulation Prediction
System
Yes
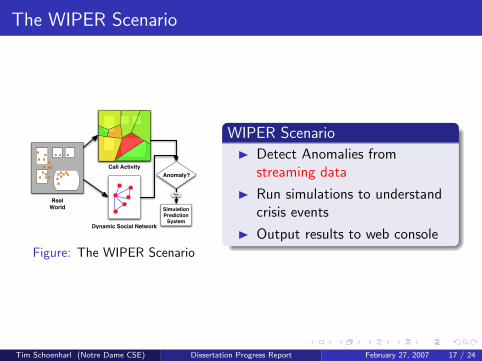
Figure: The WIPER Scenario
WIPER Scenario
� Detect Anomalies fromstreaming data
� Run simulations to understandcrisis events
� Output results to web console
Tim Schoenharl (Notre Dame CSE) Dissertation Progress Report February 27, 2007 17 / 24
Overview of the WIPER System
Decision Support System (DSS)
Decision Support System (DSS)
Decision Support System (DSS)
Decision Support System (DSS)Simulation and
Prediction System (SPS)
Simulation and Prediction System
(SPS)
Simulation and Prediction System
(SPS)
Simulation and Prediction System
(SPS)
Simulation and Prediction System
(SPS)
Simulation and Prediction System
(SPS)
Mobile Agent for Data
Preprocessing
Mobile Agent for Data
Preprocessing
Mobile Agent for Data
Preprocessing
Data Source Cellular Service
Provider
Data Stream Detection and Alert System
(DAS)
Potential Anomaly?
Raw Data Stream
Dyna
mic
Data
Req
uest Dynamically
Injected Data
Web Console Clients(Internet)
Data Source and Measurement
Layer
Detection, Simulation and
Prediction Layer
Decision Support
Layer
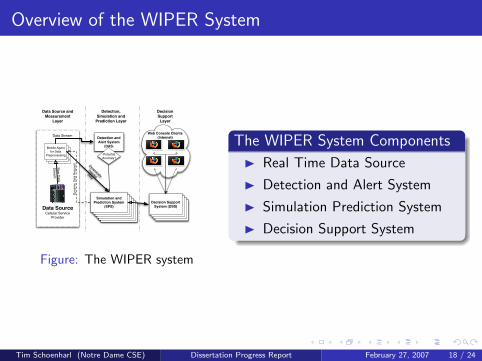
Figure: The WIPER system
The WIPER System Components
� Real Time Data Source
� Detection and Alert System
� Simulation Prediction System
� Decision Support System
Tim Schoenharl (Notre Dame CSE) Dissertation Progress Report February 27, 2007 18 / 24

Design and Implementation of WIPER Simulation
WiperSimModelWiperAgentsVoronoAgentsDataLoggerSpatialLookupsetup()buildModel()buildDisplay()buildSchedule()
WiperAgentDataLoggerVoronoiAgentMovementModelActivityModelDataLoggerGeometrystep()moveToLatLong()Voronoi Agent
GeometrycontainedAgentscontainsAgent()getRandomIntPoint()registerAgent()
Activity Model
checkCall()modelType()
Movement Model
move()modelType()
Null Movement
Model
Random Movement
Model
Flee Visualization
Movement Model
crisisLocation
Bounded Flee Movement
ModelcrisisLocationmovementRatefleeRadius
Flee Movement
ModelcrisisLocationmovementRate
Move And Return
MovementModel
movementRatewithinThreshold()
Null Activity Model
Always Call Model
Distribution Based ModelDistributionFilegetCallsNow()
ColorMap Gradient Helper
createColorMapMinMax()
Data LoggerLog FilelogCall()logLocation()
Spatial Lookup Structure
VoronoiCellsSpatialIndexgetVoronoiCellForAgent()initialize()
1
*1
*
1
1
1
1
1
1
1
1
1
1
11
1
*
Figure: The WIPER Simulation
Tim Schoenharl (Notre Dame CSE) Dissertation Progress Report February 27, 2007 19 / 24

Crisis Behavior Taxonomy
Crisis Behavior
Flee Flock Jam
Flee Point Flee Area Flee Line
Chemical Spill
Tsunami
Protest Traffic Jam
Fire Tsunami
Figure: A Taxonomy of Crisis Scenarios.
Tim Schoenharl (Notre Dame CSE) Dissertation Progress Report February 27, 2007 20 / 24

Movement and Activity Models
� As shown in the previous figure, movement models for crisis scenarioscan be arranged in a taxonomy. This taxonomy allows rapiddevelopment of models due to shared components.
� The class hierarchy mirrors the crisis taxonomy and uses code re-useto reduce development time and increase model validity.
Tim Schoenharl (Notre Dame CSE) Dissertation Progress Report February 27, 2007 21 / 24
Movement Models
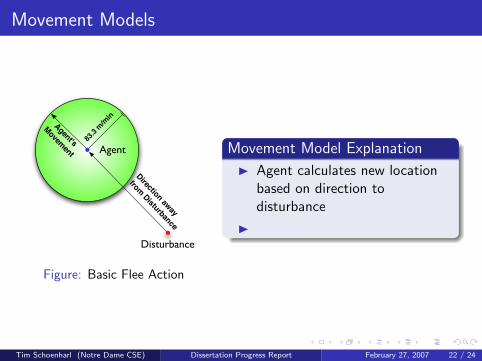
83.3
m/min
Direction away
from Disturbance
Agent's
Movement Agent
Disturbance
Figure: Basic Flee Action
Movement Model Explanation
� Agent calculates new locationbased on direction todisturbance
�
Tim Schoenharl (Notre Dame CSE) Dissertation Progress Report February 27, 2007 22 / 24
Activity Models
●
●●
●
●
●
●
●
●
●
●
●
0 5 10 15 20
050
100
150
200
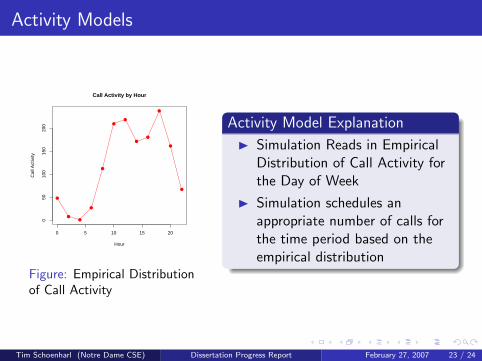
Call Activity by Hour
Hour
Cal
l Act
ivity
Figure: Empirical Distributionof Call Activity
Activity Model Explanation
� Simulation Reads in EmpiricalDistribution of Call Activity forthe Day of Week
� Simulation schedules anappropriate number of calls forthe time period based on theempirical distribution
Tim Schoenharl (Notre Dame CSE) Dissertation Progress Report February 27, 2007 23 / 24
Publications
[1] T. Schoenharl, G. Madey, G. Szabo, and A.-L. Barabasi, “WIPER: Amulti-agent system for emergency response,” in Proceedings of the ThirdInternational ISCRAM Conference, May 2006.
[2] T. Schoenharl, R. Bravo, and G. Madey, “WIPER: Leveraging the cell phonenetwork for emergency response,” International Journal of Intelligent Controland Systems, vol. TBA, 2007.
[3] G. R. Madey, A.-L. Barabasi, N. V. Chawla, M. Gonzalez, D. Hachen,B. Lantz, A. Pawling, T. Schoenharl, G. Szabo, P. Wang, and P. Yan,“Enhanced situational awareness: Application of DDDAS concepts toemergency and disaster management,” in Proceedings of the InternationalConference on Computational Science (P. Sloot and J. Dongarra, eds.), May2007.
Tim Schoenharl (Notre Dame CSE) Dissertation Progress Report February 27, 2007 24 / 24


