
DIY Automation and Precision Agriculture
John Van de Vegte P.Eng. Ontario Ministry of Agriculture, Food and Rural Affairs
Environmental Management Branch

Improving Agriculture
2
Need to Improve:
Need to Reduce:
ProductivityCrop Yield
Livestock Health
Cost of ProductionRisk of Loss
Environmental ImpactWater & Energy Consumption
Improving Agriculture
3
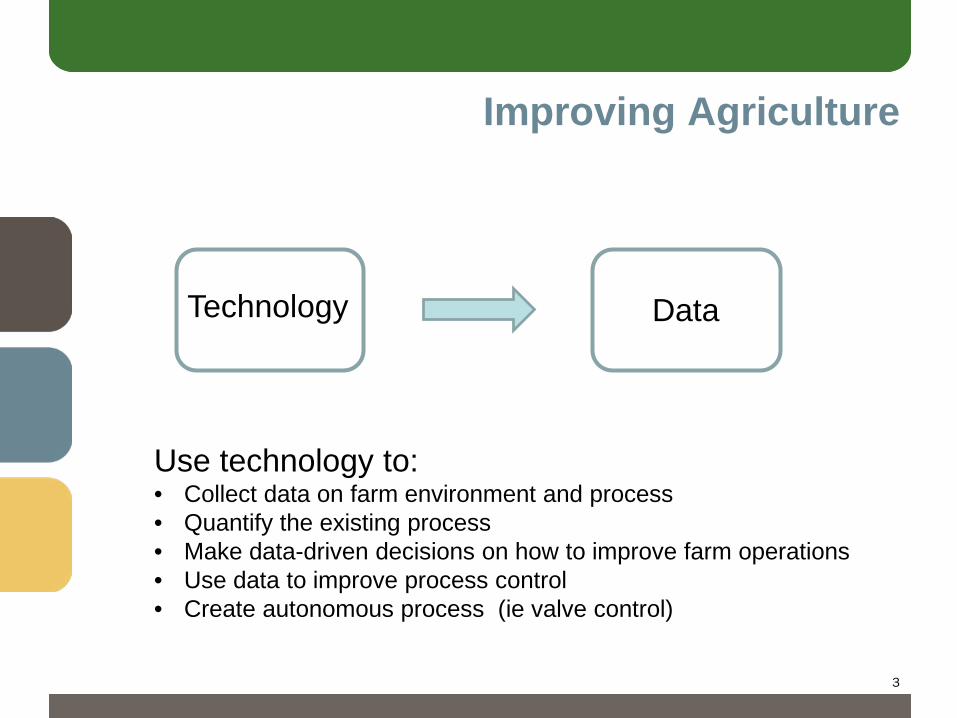
Technology Data
Use technology to:• Collect data on farm environment and process• Quantify the existing process• Make data-driven decisions on how to improve farm operations• Use data to improve process control• Create autonomous process (ie valve control)

Data & Technology in Our Lives
4
• Collection, storage and manipulation of data• Technology is available and cheaper than ever before!

Technology Already in Agriculture
5
Precision Ag
Robotics in the BarnGPS-Guided Tractor

Reducing Cost of Technology Trend
6

Do-It-Yourself Technology
7
Input Brain Output
Collect Data Do What? Do
Technology does not have to be complex!
Inputs
8
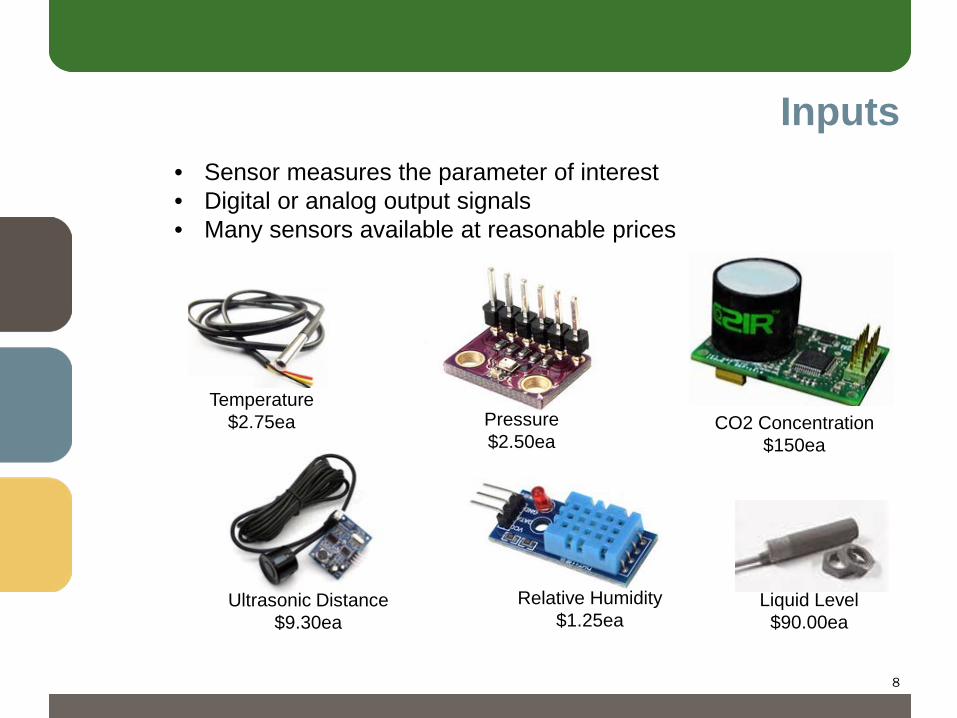
Temperature $2.75ea
Ultrasonic Distance $9.30ea
Pressure $2.50ea
Relative Humidity $1.25ea
CO2 Concentration $150ea
• Sensor measures the parameter of interest• Digital or analog output signals• Many sensors available at reasonable prices
Liquid Level$90.00ea
Brains
9
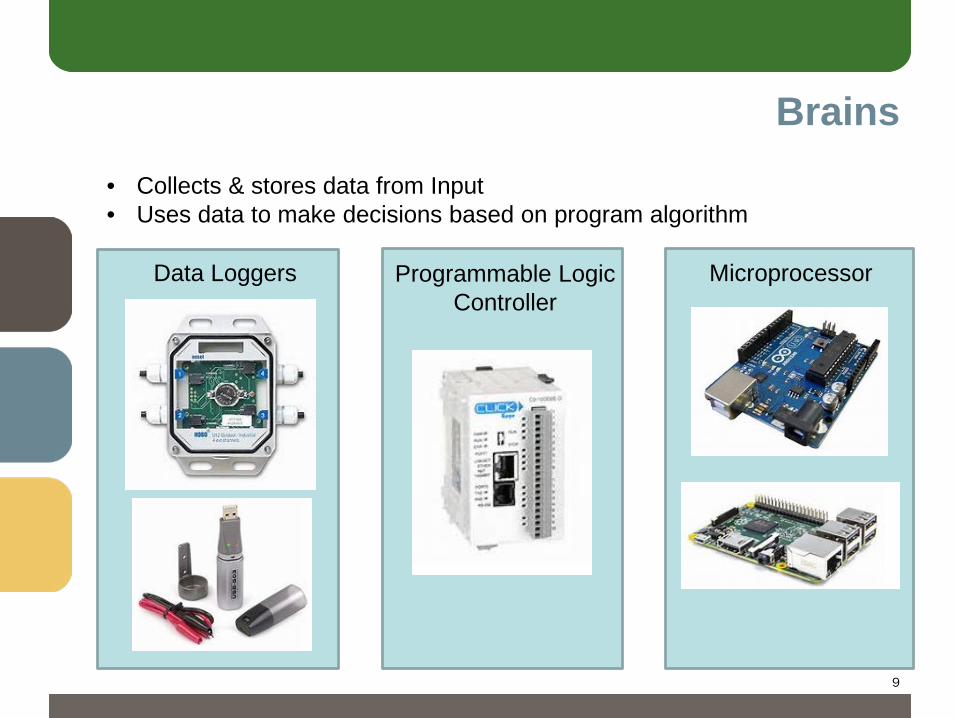
Data Loggers Programmable Logic Controller
Microprocessor
• Collects & stores data from Input • Uses data to make decisions based on program algorithm

Programming the Brain
10
Playing Video Games
Into
Programming Microprocessor
Do you have a programmer in-house?
Free microprocessor programming language and tutorials available on-line www.arduino.ccwww.raspberrypi.org

Outputs
11
Information (from Data Logger) Action (from PLC or Microprocessor)
• Conducts actions as directed by the program in the Brain

Examples
12
• Examples of project conducted over the past 2 years
• Initial focus on data collection to quantify processes
• Evaluation of the data collected highlights opportunities to improve process
Knowledge is Power
Field Vegetable Livestock Tree Fruit

Wash-Water Turbidity Monitoring
13
Can field vegetable wash-water turbidity monitoring be used to reduce water consumption?
• Measurement captured every 30sec on data logger.
• Reduced water consumption and increased recirculation in vegetable wash process
Manure Monitoring at Swine Barn
14
0
1
2
3
4
5
6
25/04 14/06 03/08 22/09 11/11
Dis
tanc
e fro
m S
enso
r (ft)
Time
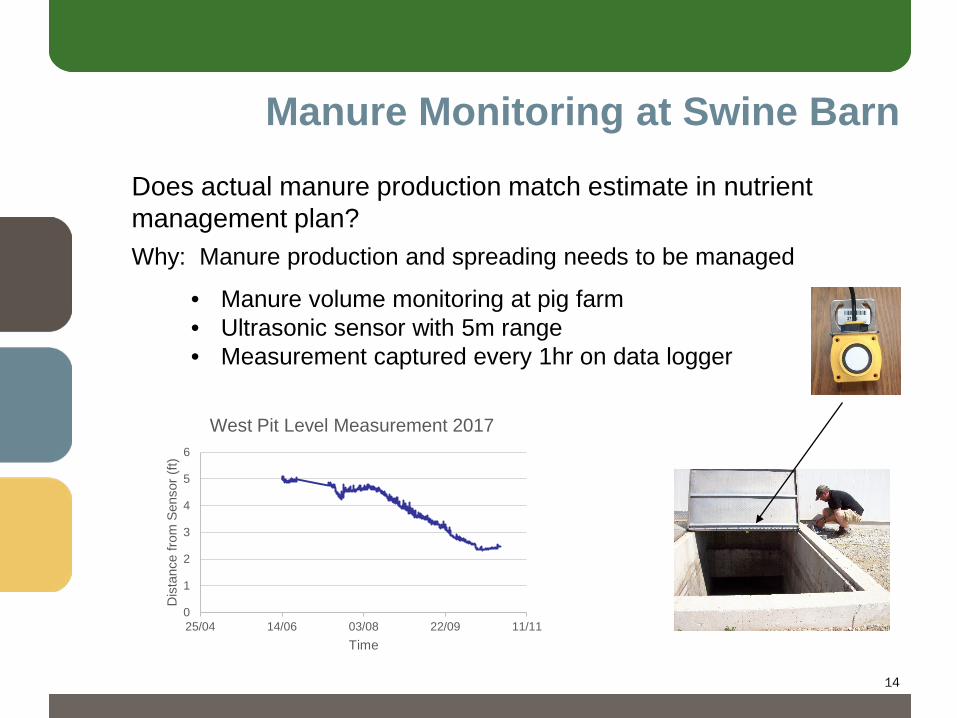
West Pit Level Measurement 2017
• Manure volume monitoring at pig farm• Ultrasonic sensor with 5m range• Measurement captured every 1hr on data logger
Does actual manure production match estimate in nutrient management plan?Why: Manure production and spreading needs to be managed

Ammonia Levels in Lamb Barns
15
0
5
10
15
20
25
30
NH3
Con
c'n
(ppm
)
NH3 Concentration (PPM)
• Ammonia sensor with 200ppm limit• Measurement captured every 30min.
What is Ammonia concentration in lamb barns?Why: Exposure to excessive ammonia has health impacts. Exposure limit for humans is 25ppm (8hr time weighed average)

Methane Levels in Swine and Dairy Barns
16
Tem
p.(º
C)
CH
4 C
onc’
n(%
LEL)
What is methane concentration in swine and dairy barns?Why: Methane is explosive at concentrations between 5% and 15%
• Wireless sensor with data sent to Cloud• Measurement captured every 15min.• Found instances of high methane concentration

Peach Size in Harvest Totes
17
Can we measure peach size range in totes on arrival at packaging operation?Why: Peach size required to manage packaging process.
• Camera mount above door to cold storage• Read RFID tag on skid• Digital photo taken every 0.5 seconds as lift-truck brings skid into storage• Automatically determine when full skid is in view• Measure diameter of all visible peaches• Export peach size data for skid to production management software

Summary
18
• Make data-driven decisions on how to improve your production process.
• Technology to collect critical data at your farm is available at reasonable cost.
• You can Do-It-Yourself!
What do you want to measure or control at your farm?

19
Thank You!


