
DMC Technology Server Re-fresh
Contents
• Evaluate vendor Blade technology• Develop a Blade architecture that meets
DMC/PBB requirements• Develop a stand-alone server re-fresh
architecture• CBA associated with migrating to a Blade
architecture and it’s impact on relocating to a new data center.
• Observations• Appendix
Evaluate Vendor Blade Technology

Evaluate vendor Blade technology Blade Architecture Benefits
• General Benefits (details slide 20 & 22)
– Fewer Network ports– Less floor space – Less Electricity– Ease of manageability
• Specific DMC Benefits (details slide 22)
– Increased compute power (CPU & RAM)– Increased network scaling– More virtualization capabilities
Evaluate vendor Blade technology Vendors Technology Evaluated
• IBM
• HP
• Cisco
Evaluate vendor Blade technology Vendor Technology Assessment
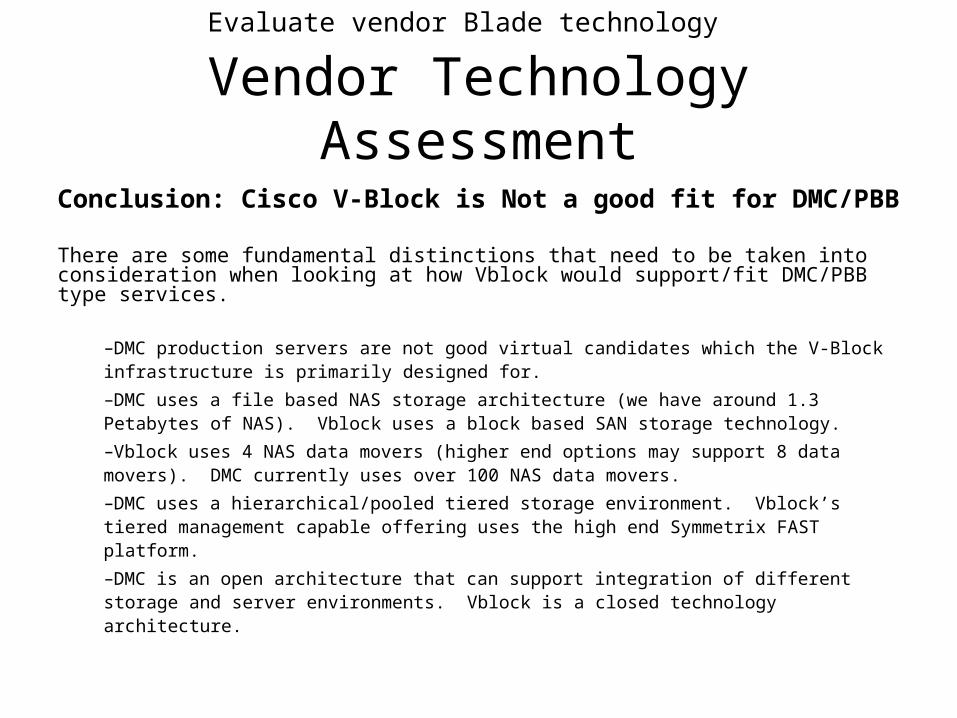
Conclusion: Cisco V-Block is Not a good fit for DMC/PBB
There are some fundamental distinctions that need to be taken into consideration when looking at how Vblock would support/fit DMC/PBB type services.
–DMC production servers are not good virtual candidates which the V-Block infrastructure is primarily designed for.
–DMC uses a file based NAS storage architecture (we have around 1.3 Petabytes of NAS). Vblock uses a block based SAN storage technology.
–Vblock uses 4 NAS data movers (higher end options may support 8 data movers). DMC currently uses over 100 NAS data movers.
–DMC uses a hierarchical/pooled tiered storage environment. Vblock’s tiered management capable offering uses the high end Symmetrix FAST platform.
–DMC is an open architecture that can support integration of different storage and server environments. Vblock is a closed technology architecture.

Evaluate vendor Blade technology Technology Assessment
Requirement Description IBM HP Result
Ease of hardware deployment (Post Initial Install)How easy is it to add a blade and or Chassis 3 3Ease of Management of Blade/Chassis How easy is it to manage the chassis and blades 3 3 Based on input from EISFlexibility of Blade config Options for I/O, i.e. network, san, sas 3 3Flexibility of Chassis config Options for I/O, i.e. network, san, sas 3 3 HP - Flexconnect
Blade hardware options Options relating to PCI cards, CPU, RAM, Hard drives 3 3
HP has an option to take up a blade slot to add drives, but it costs you a slot
Chassis hardware options Options relating to network, san, sas 3 3
IBM has more hardware Brands/optionsHP has Flexconnect, which is limited for some options, but very flexible
Power Management Ability to provide Power management, if needed 3 3
Density per rack How many blades per rack 4 3
HP - 4 chassis x 16 half height = 64 (HP has qualifiers to do 4 chassis)IBM - 5 chassis x 14 full height = 70
Local Disk Flexibility - Non SAN Ability to provide high speed local disk storage without a SAN 3 3
HP has an option to take up a blade slot to add drivesIBM has a SAS drawer capability that HP does not
Support Ease of getting support and technician onsite 3 3 Based on input from EIS and CW
Scoring is 1 to 5, 5 being best Total 31 30
Conclusion: IBM is rated above HP, but not by a significant amount. Either IBM or HP would meet DMC/PBB needs. (If IBM pricing ends up being equal to or cheaper than HP, we would go with IBM.)
Develop a Blade architecturewhich meets DMC/PBB requirements
Develop a stand-alone server re- fresh architecture
Note: There are separate attachments covering the above two deliverables.
CBA

CBA
Considerations
• Some servers will continue to be stand-alone and will require upgrading regardless if DMC moves to a Blade server architecture.
• The new location has limited floor space within the initial build out allocation for DMC.
• There are many variables that make it difficult to capture all costs associated with Blades and servers going into the new data center.
CBA Approach
The DMC server infrastructure was grouped as follows:Group A: Systems that are past due for re-freshGroup B: Systems that need to start being re-freshed this yearGroup C: Systems that have one to two more years before needing a
re-fresh
Key data analyzed (list is not prioritized):
Racks needed Stand-alone serversBlade servers RAMCore compute power Network PortsElectrical power Floor spaceAssociated pricing
Working with IBM and HP, a Blade architecture was developed and priced in line with DMC/PBB requirements. The prices were not negotiated. HP provided pricing using the SPE standard discount and IBM provided what they called “budget planning” pricing.

CBA
Blade Architecture & Stand-Alone Server Upgrade
IBM Blades *Remaining
Stand-Alone Server (SAS) Upgrades
(non-blade able)
Totals
Group A $480,803(45 blades = 73physical servers)
$98,136(11 physical servers upgrades)
$578,942
Group B $331,143(46 blades=46 physical servers)
$69,911(8 physical servers upgrades)
$401,054
Group C $453,970(59 blades=59physical servers)
(leaving 10 newer physical servers that are non-blade able and don’t need upgrades) $453,970
Group
A+B$811,946(91 blades=119physical)
$168,047(19 SAS upgrades)
$977,143
Group
A+B+C$1,265,916(150 blades = 178 Physical)
$168,047(19 SAS upgrades)
$1,431,113
The IBM & HP prices are not negotiated prices. HP used Standard SPE discount pricing IBM provided “budget planning” pricing.
Group A: Systems that are past due for re-freshGroup B: Systems that need to start being re-freshed this yearGroup C: Systems that have one to two more years before needing a re-fresh
* See slide 23 for details

CBA
Blade Architecture & Stand-Alone Server Upgrade
HP Blades *RemainingStand-Alone Server (SAS)
Upgrades (non-blade able)
Totals
Group A $454,907(45 blades = 73physical servers)
$98,136(11 physical servers upgrades)
$553,043
Group B $294,111(46 blades=46 physical servers)
$69,911(8 physical servers upgrades)
$364,022
Group C $428,928(59blades=59physical servers)
(leaving 10 newer physical servers that are non-blade able and don’t need upgrades) $428,928
Group
A+B$749,018(91 blades=119physical)
$168,047(19 SAS upgrades)
$917,065
Group
A+B+C$1,177,946(150 blades = 178 Physical)
$168,047 (19 SAS upgrades)
$1,345,993
The IBM & HP prices are not negotiated prices. HP used Standard SPE discount pricing IBM provided “budget planning” pricing.
Group A: Systems that are past due for re-freshGroup B: Systems that need to start being re-freshed this yearGroup C: Systems that have one to two more years before needing a re-fresh
* See slide 23 for details
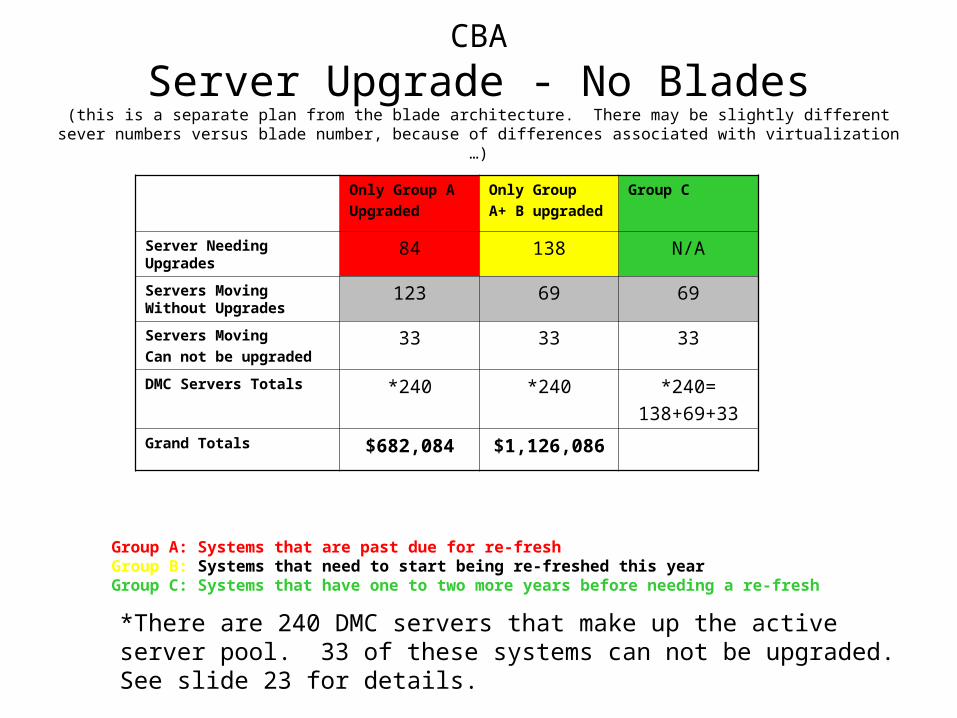
Only Group A
Upgraded
Only Group
A+ B upgraded
Group C
Server Needing Upgrades 84 138 N/A
Servers Moving Without Upgrades
123 69 69
Servers Moving
Can not be upgraded33 33 33
DMC Servers Totals *240 *240 *240=
138+69+33
Grand Totals $682,084 $1,126,086
Group A: Systems that are past due for re-freshGroup B: Systems that need to start being re-freshed this yearGroup C: Systems that have one to two more years before needing a re-fresh
CBA
Server Upgrade - No Blades(this is a separate plan from the blade architecture. There may be slightly different sever numbers versus blade
number, because of differences associated with virtualization …)
*There are 240 DMC servers that make up the active server pool. 33 of these systems can not be upgraded. See slide 23 for details.
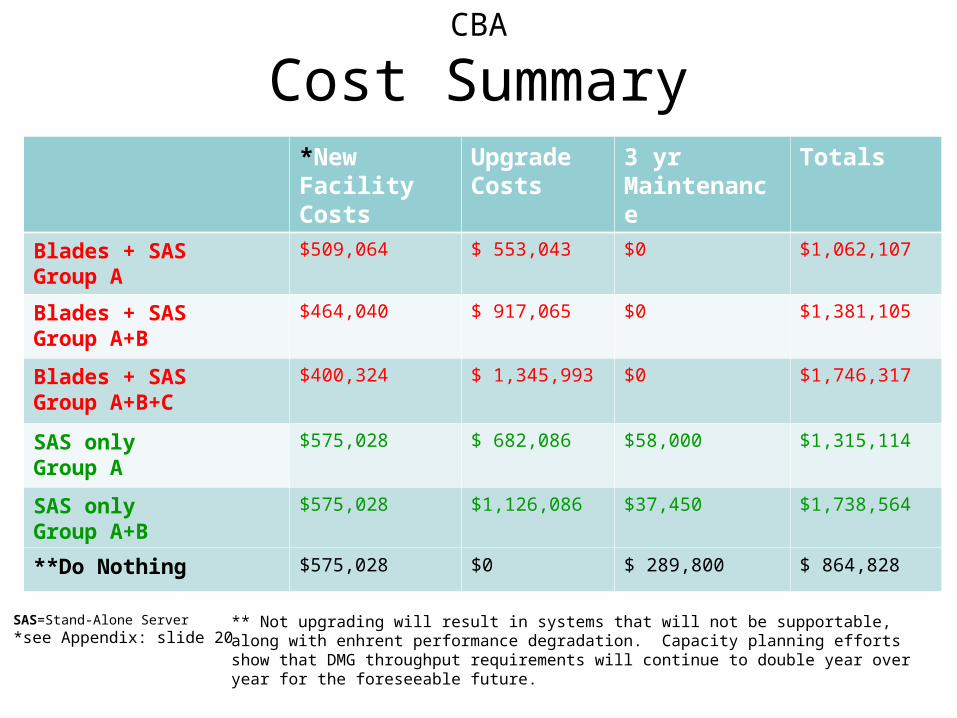
CBA
Cost Summary*New Facility Costs
UpgradeCosts
3 yr Maintenance
Totals
Blades + SASGroup A
$509,064 $ 553,043 $0 $1,062,107
Blades + SASGroup A+B
$464,040 $ 917,065 $0 $1,381,105
Blades + SASGroup A+B+C
$400,324 $ 1,345,993 $0 $1,746,317
SAS onlyGroup A
$575,028 $ 682,086 $58,000 $1,315,114
SAS onlyGroup A+B
$575,028 $1,126,086 $37,450 $1,738,564
**Do Nothing $575,028 $0 $ 289,800 $ 864,828
SAS=Stand-Alone Server
*see Appendix: slide 20** Not upgrading will result in systems that will not be supportable, along with enhrent performance degradation. Capacity planning efforts show that DMG throughput requirements will continue to double year over year for the foreseeable future.

Observations
Observations
• Based on the current layout and space allocations for DMC, If we do not move to Blades we will immediately use up all racks space planned for servers. (slides 19,20,22)
• We should move forward with Blade upgrade of “Group A + B” prior to moving data centers.
• With Blade migration, Compute power goes up significantly, while network port needs go down significantly, and space needs go down. (See Appendix: Data Elements slide 22.)

Apendix
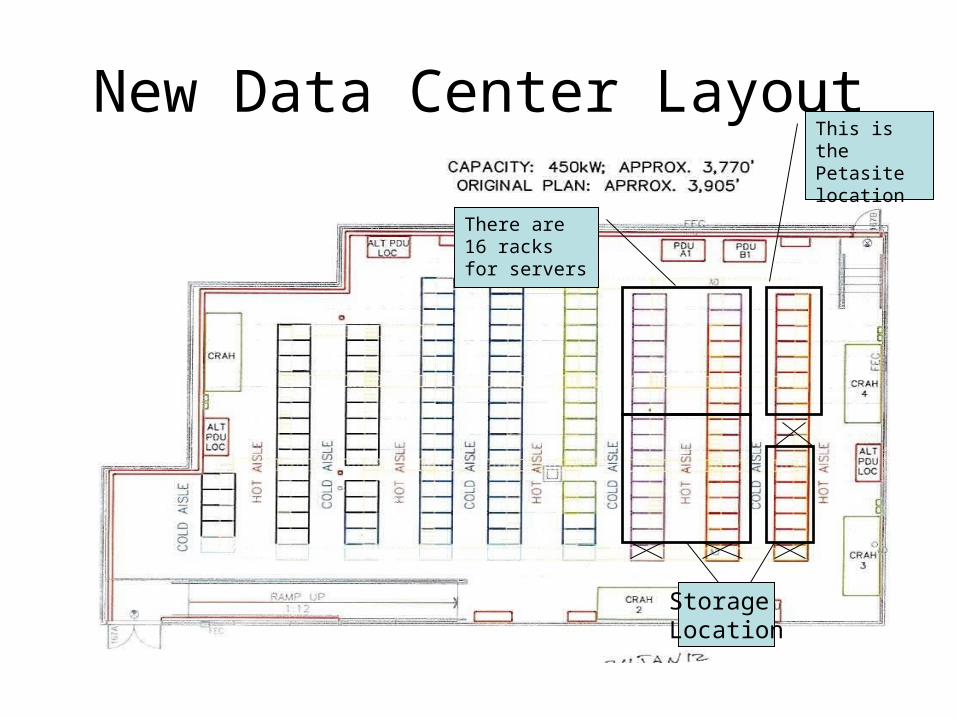
New Data Center Layout
There are 16 racks for servers
This is the Petasite location
Storage Location

Facilities Costs
Move without Blade upgrade
QTY Blade Group A
& remaining Stand-alone servers
QTY Blade Group A+B
& remaining Stand-alone Servers
QTY Blade Group A+B+C &
Remaining Stand-alone Servers
QTY
Fixed Costs
*Ports(1Gb+10Gb+FC)
$340,660 1060 $318,640 818 $315,560 700 $283,140 405
Rack Build $80,000 16 $65,000 13 $50,000 10 $40,000 8
Sub-Totals $420,660 $383,640 $365,560 $323,140
Recurring
Costs (Yr)
Rack Floor Space
$117,120 16 $95,160 13 $73,200 10 $58,560 8
Electricity/Rack $37,248 16 $30,264 13 $23,280 10 $18,624 8
Sub-Totals 1yr $154,368 $125,424 $96,480 $77,184
Total $575,028 $509,064 $462,040 $400,324
*Note that fixed port costs going forward can be significantly higher if additional switching and power and space are needed when scaling…

Upgrade Cost DetailsUsing HP Blades & remaining stand-alone servers (SAS) costs:
Server Upgrade - No Blades
Upgrades Fixed *1 yr Recurring
Totals
Group A $682,084 $420,660 $154,368 $1,257,112
Group A+B $1,126,086 $420,660 $154,368 $1,701,114
HP costs Upgrades Fixed *1 yr Recurring
Totals
Group A+SAS $553,043 $383,640 $125,424 $1,062,107
Group A+B+SAS $917,065 $365,560 $96,480 $1,379,105
Group A+B+C+SAS $1,345,993 $323,140 $77,184 $1,746,317
SAS= Stand-alone Servers
Server Maintenance Offsets 1 yr Recurring
No Upgrades $84,000 (rising annually)
Group A upgraded $58,800
Group A+B upgraded $37,450
* See slide 20
CBA
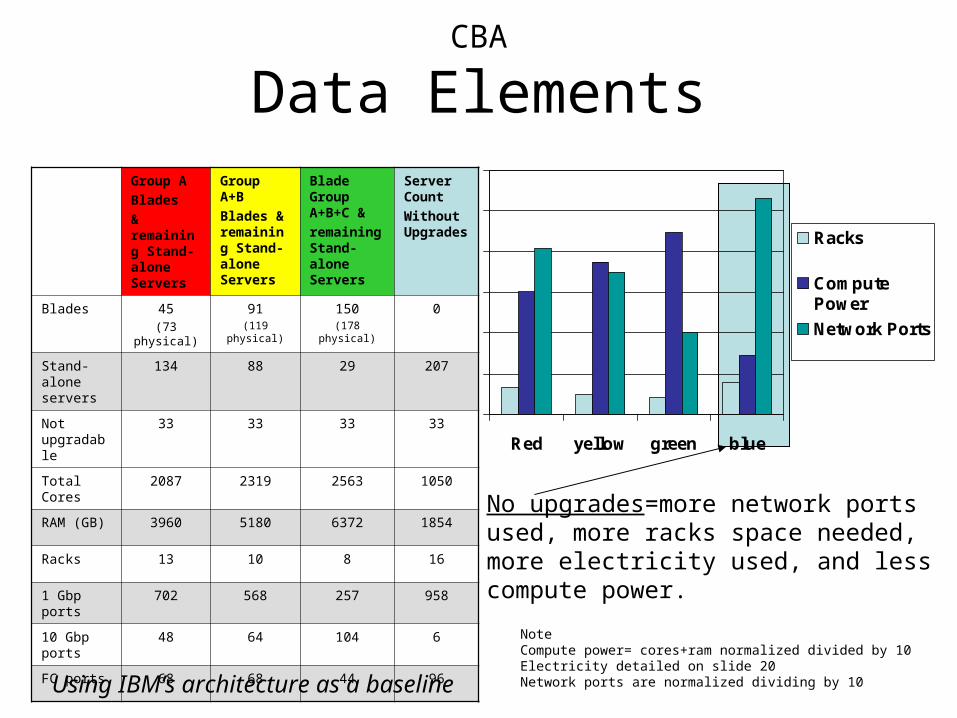
Data ElementsGroup A
Blades
& remaining Stand-alone Servers
Group A+B
Blades & remaining Stand-alone Servers
Blade Group A+B+C &
remaining Stand-alone Servers
Server Count
Without Upgrades
Blades 45(73 physical)
91(119 physical)
150(178 physical)
0
Stand-alone servers
134 88 29 207
Not upgradable
33 33 33 33
Total Cores 2087 2319 2563 1050
RAM (GB) 3960 5180 6372 1854
Racks 13 10 8 16
1 Gbp ports 702 568 257 958
10 Gbp ports
48 64 104 6
FC ports 68 68 44 96
Red yellow green blue
Racks
ComputePower
Network Ports
Using IBM’s architecture as a baseline
No upgrades=more network ports used, more racks space needed, more electricity used, and less compute power.
NoteCompute power= cores+ram normalized divided by 10Electricity detailed on slide 20Network ports are normalized dividing by 10
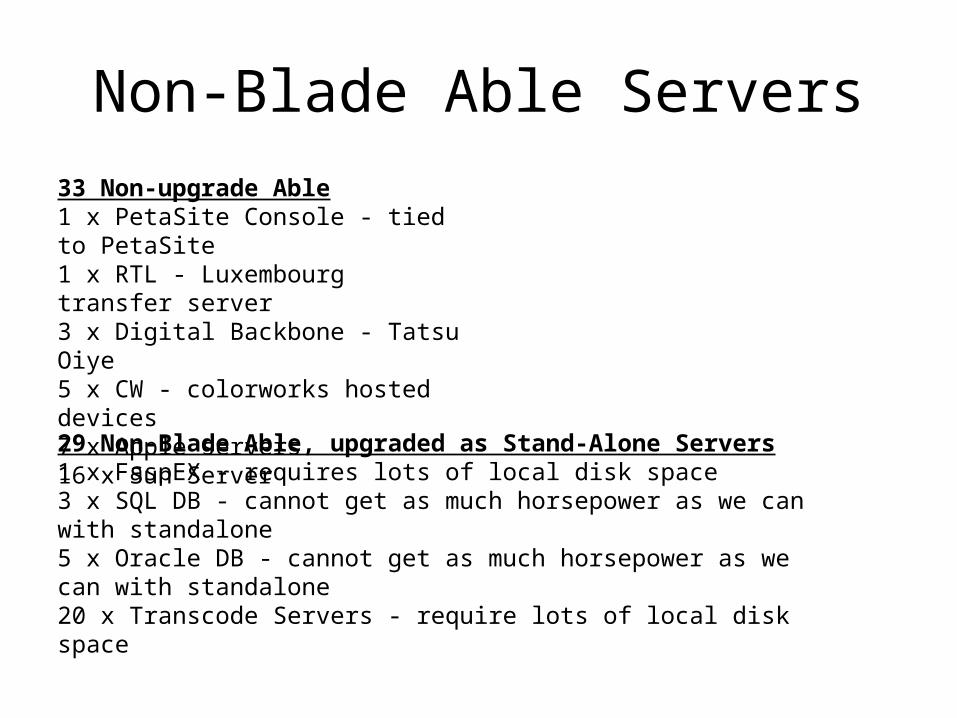
Non-Blade Able Servers
33 Non-upgrade Able1 x PetaSite Console - tied to PetaSite1 x RTL - Luxembourg transfer server3 x Digital Backbone - Tatsu Oiye5 x CW - colorworks hosted devices7 x Apple servers16 x Sun Server
29 Non-Blade Able, upgraded as Stand-Alone Servers1 x FaspEX - requires lots of local disk space3 x SQL DB - cannot get as much horsepower as we can with standalone5 x Oracle DB - cannot get as much horsepower as we can with standalone20 x Transcode Servers - require lots of local disk space


![OLD SALEM LINEN - The Primitive Hare30 ct Old Salem Linen by The Primitive Hare DMC DMC @ DMC 3022 Moss by Nina's Threads [Þ] DMC 898 coffee brown -vy dk Backstitch Lines: DMC-898](https://static.documents.pub/doc/80x56/5e2f3827f0aac16b9567a31f/old-salem-linen-the-primitive-30-ct-old-salem-linen-by-the-primitive-hare-dmc.jpg)


