

Indian Journal of Biotechnology
Vol 13, April 2014, pp 165-171
DNA barcoding of Indian ant species based on cox1 gene
Rakshit Ojha1, S K Jalali
1*, T M Mushtak Ali
2, T Venkatesan
1, Sean W Prosser
3 and N K Krishna Kumar
1
1National Bureau of Agriculturally Important Insects, Hebbal, Bangalore 560 024, India 2Department of Entomology, University of Agricultural Sciences, GKVK Campus, Bangalore 560 065, India
3Department of Molecular and Cellular Biology, College of Biological Science, University of Guelph
Guelph, Ontario, Canada N1G 2W1
Received 17 January 2013; revised 6 May 2013; accepted 14 June 2013
Sixteen species of ants collected from Karnataka, India, were sequenced and barcoded for a 658 bp region of the
mitochondrial cytochrome c oxidase subunit 1 gene (cox1). This gene is frequently termed as CO1 in barcoding approach
and serves as the core of a global bioidentification marker for insects and other animals. The AT content in DNA of 16 ant
species was estimated as 68.55%, which is in accordance with invertebrates. The variance of AT content among species was
much higher for the 1st base (AT1) compared to the 2nd and 3rd bases, which were nearly invariant. The distance within
species was calculated using Kimura 2-parameter (K2P) and it was 0.166, 0.000 and 0.333% for mean, minimum and
maximum, respectively. Moreover, our data also showed some phylogenetic signal. In a neighbor-joining tree for all
sequences, two clusters were obtained, the first cluster consisted of subfamilies Formicinae and Myrmicinae, while other
clade showed relationship between subfamily Myrmicinae and Ponerinae clustered with subfamily Dolichodrinae, which is
not in contradiction with cladistics analysis of morphological data for ants and is consistent with traditional phylogeny of
ants. The present results thus favour DNA barcoding as a decisive tool in quick and reliable identifications of ants.
Keywords: Barcodes, cox1, cytochrome c oxidase subunit 1, Indian ants, molecular characterization
Introduction
The science behind classifying living species based
on shared features, i.e., taxonomy, has been a part of
human society for centuries. The quantification of
biodiversity, which is increasingly decimated,
presents a daunting challenge to taxonomists because
it requires discovery and analysis to proceed at a
greatly accelerated pace1. Recognition of subtle
anatomical differences between closely related
species requires subjective judgment of a specialist
and also demands great deal of taxonomic
knowledge2. Hebert et al
3 observed that, for critical
identification of 10-15 million species based on
morphological diagnosis, a community of 15,000
taxonomists will be required. In order to identify these
species at the rate of expertise available, it may
require centuries to even complete a preliminary
‘Encyclopedia of life’4, signaling the need for a new
approach to taxon recognition5.
Utilization of DNA sequence diversity to identify
organisms assessed directly or indirectly through
protein analysis has been gaining importance6,7
.
About five decades ago, starch gel electrophoresis
of proteins was first used to identify species8.
Tautz et al9 advocated the case for a DNA-based
taxonomic system, whereas Hebert et al3 believed
that a single gene sequence would be sufficient to
differentiate vast majority of animal species, and
proposed the use of the mitochondrial DNA gene
cytochrome c oxidase subunit 1 (cox1) as a global
identification marker for animals. The cox1 region is
useful for inferring phylogenetic relationships among
populations and it is also used as the primary DNA
barcode throughout the world3. Although the cox1
region is highly conserved, differences do exist in the
length and sequence of the regions flanking cox1.
Previous phylogenetic studies have shown the utility
of cox1 for the identification of genetic variability1.
The sequence obtained was equated to a barcode with
species being distinguished by their particular
sequence10
. Just as the unique pattern of bars in a
Universal Product Code (UPC) identifies each
consumer product, a “DNA barcode” identifies each
organism. Short DNA barcodes, about 700 bp in
length, can be quickly processed from thousands of
specimens and unambiguously analyzed by computer
———————
*Author for correspondence:
Mobile: +91-9449673949
Email: [email protected]

INDIAN J BIOTECHNOL, APRIL 2014
166
programs3. Therefore, DNA barcoding could
revolutionize taxonomy and diversity by linking
established museum collections to unknown species
from the field, facilitating the description of new
species, revealing cryptic species, and linking adult
with juvenile or male with female11,12
.
Concerns have been raised and reported regarding
the efficacy of the cox1 approach to DNA
barcoding13,14
. However, large scale sequencing of
short cox1 fragments for biodiversity inventories
indicates that sequence variation is highly structured
and partitioned with discrete genetic clusters
that correspond broadly to species level entities15
.
To that end, we describe in this communication how
cox1 DNA barcoding enables rapid identification of
molecular operational taxonomic units as described
by,
Floyd et al16
and Blaxter17
for the assessment
of diversity of some ant species in Karnataka state
of India.
India is one of the world’s mega diversity regions
for ants, where they occur frequently throughout the
country in various ecosystems including forest,
grassland and human habitat. Ants are important
components of ecosystems not only because they
constitute a great part of animal biomass, but also as
ecosystem engineers. It is estimated that there are
more species of ants in a square kilometer of Brazilian
forest than all the lions and elephants in Africa18
.
Although ants dominate the biomass of most
terrestrial communities, act as pollinators and seed
dispersers, and are critical to nutrient cycling and
ecosystem function, there is a global lack of studies of
ant diversity or community structure19
. This may be
largely because of the difficulty of species-level
identifications. The vast diversity of ant fauna
includes approx 660 species from 87 genera in India
and will continue to increase in numbers as more and
more systematic explorations in diverse habitats are
undertaken by taxonomists. Myrmicines family forms
the bulk of Indian ant diversity with 45% of total
Indian ants, while family Formicines is the second
leading ant group (25% of species), with Camponotus
and Polyrachis constituting the majority of the
diversity19
. Ants on the Andaman and Nicobar
Islands, India were surveyed and it resulted in
doubling the number of ant species recorded from
these islands. Records include five endemic species,
but no endemic genera. However, the surveys were
fairly superficial and it is likely that many species
remain to be discovered on these islands20
. Five
Indian ant species are on the International Union for
Conservation of Nature (IUCN) red list20
.
In the present study, we examined the cox1, a
protein coding mitochondrial gene, for barcoding
approach to assemble ants of India in a global
library of DNA barcodes at BOLDSYSTEMS
(http://www.barcodinglife.com/). Species clusters
were identified using ClustalW tool and a tree based
approach was used to study phylogeny. This approach
can be used to barcode the total diversity of Indian ant
species.
Materials and Methods Collection and Identification
Ants were collected during the month of September
to December 2011 in Karnataka state of India from
the following locations: i) Bangalore (12°58' N;
77°38' E; 3018 ft), ii) Mandya (12°13'N; 76°20' E;
2224 ft); iii) Medikeri (12°19' N; 75°53' E; 5000 ft);
and iv) Kolar (13°01' N; 77°71' E; 4850 ft). At each
of these sites, ants were collected by brush and cotton
wool pad and transferred to collection tubes
containing 95% alcohol. The specimens were
identified to species level and distributed into their
respective subfamily to obtain a clear phylogenetic
signal (Table 1) immediately upon their collection by
Table 1—Distribution of ant species into their respective
subfamilies and tribes on the basis of classification
Species Tribe Collection site
Subfamily: Formicinae
Camponotus irritance Camponotini Bangalore
C. parius Camponotini Bangalore
C. compressus GR-17 Camponotini Mandya
C. compressus Camponotini Bangalore
Anoplolepis gracilipes Lasiini Medikeri
Oecophylla samaragdina Oecophyllini Mandya
Paratrechina longicornis Plagiolepidini Bangalore
Plagiolepis sp. Plagiolepidini Bangalore
Subfamily: Myrmicinae
Aphaenogaster beccarii Pheidolini Bangalore
Pheidologeton diversus Pheidolini Medikeri
Solenopsis geminata Solinopsidni Kolar
Monomorium scabriceps Solinopsidni Mandya
Myrmicaria brunnea Myrmicarini Kolar
Subfamily: Ponerinae
Leptogenys chinensis Ponerini Bangalore
Subfamily: Dolichoderinae
Tapinoma melanocephalum Dolichoderini Bangalore
Technomyrmex albipes Dolichoderini Bangalore

OJHA et al: DNA BARCODING OF INDIAN ANT SPECIES.
167
one of the authors. The specimens, thus, collected
and morphologically identified were used for cox1
barcoding at the National Bureau of Agriculturally
Important Insects (NBAII) Bangalore, India. Genetic Analysis
DNA was extracted from somatic tissues (thorax,
abdomen) rich in mitochondria using Qiagen
DNeasy® kit, following the manufacturer’s protocols.
Remaining parts of each ants and respective
individuals were kept as voucher specimens at
NBAII. The extracts were subjected to PCR
amplification of a 658 bp region near the 5' terminus
of the cox1 gene following standard protocol (Hebert
et al)3. Primers used were: forward primer (LCO
1490: 5'-GGTCAACAAATCATAAAGATATTGG-3'),
and reverse primer (HCO 2198: 5'-TAAACTTCA
GGGTGACCAAAAAATCA-3').
PCR reactions were carried out in 96-well plates,
50 µL reaction volume containing: 5 µL GeNeiTM
Taq
buffer, 1 µL GeNeiTM
10mM dNTP mix, 2.5 µL
(20 pmol/µL) forward primer, 2.5 µL (20 pmol/µL)
reverse primer, 1 µL GeNeiTM
Taq DNA polymerase
(1 U/µL), 2 µL DNA (50 ng/µL), and 36 µL sterile
water. Thermo cycling consisted of an initial
denaturation of 94°C for 5 min, followed by 30 cycles
of denaturation at 94°C for 1 min, annealing at 55°C
for 1 min and extension at 72°C for 1 min. PCR
was performed using a C1000™ Thermal Cycler. The
amplified products were analyzed on a 1.5% agarose
gel electrophoresis as described by Sambrook and
Russell21
. The amplified products were sent to two
commercial sequencing companies, SciGenome Pvt.
Ltd., India and Ocimum Biosolutions Pvt. Ltd., India.
Each ant species was bi-directionally sequenced and
checked for homology, insertions and deletions,
stop codons, and frame shifts by using NCBI BLAST.
All sequences were uploaded to GenBank and
the Barcode of Life Database (BOLD,
http://www.boldsystems.org).
Data Analysis
The pairwise analysis of 16 sequences was
conducted using Kimura 2-parameter (K2P) method
in MEGA4. The number of base substitutions per site
was analyzed between all sequences. Codon positions
included were 1st+2
nd+3
rd+non-coding. All positions
containing gaps and missing data were eliminated
from the dataset. The A, T, G, C, AT and GC content
of all 16 sequences was obtained using a computer
program designed in the Bioinformatics Lab at
NBAII, Bangalore, India. The AT% at three codon
positions was calculated using the same program.
Sequences were aligned using the MegAlign tool
of the DNASTAR software package to highlight the
conserved gene regions using Boxshade option.
Residue distances were estimated using the ClustalW
program of MEGA 4.0.2 software with default
settings of gap opening penalty 10 and a
gap-extension 0.1 in pairwise and 0.05 in multiple
alignments. Sequence divergences were calculated
and a NJ tree of distances was created to provide a
graphic representation of the among-species
divergences22
. Sequencing neutrality, rate of
substitutions and per cent identities were calculated
using DNASTAR Lasergene 8. Sequences and
other specimen information are available in the
project “Ants of India” in the campaign section
and “Ants of the World” in BOLD Systems
at the website (http://www.boldsystems.org). Five
sequences (Anoplolepis gracilipes Smith, Oecophylla
smaragdina Fabricius, Plagiolepis sp., Solenopsis
geminata Fabricius & Technomyrmex albipes Smith)
were examined for homology by downloading each
sequence from GenBank since these were the only
available sequences present in GenBank when we
checked all the 16 species reported by us. Sequences
and other specimen informations are available at
BOLD Systems (http://www.boldsystems.org).
Results and Discussion All cox1 sequences were submitted to the NCBI-
GenBank under accession numbers: Camponotus
compressus Fabricius-JN886027, S. geminate
Fabricius-JN886028, Myrmicaria brunnea Saunders-
JN886029, Leptogenys chinensis Mayr-JN886030,
Aphaenogaster beccarii Emery-JN886031, C. parius
Emery-JN886032, C. irritans Smith-JN886033,
Paratrechina longicornis Latreille-JN886034,
O. smaragdina Fabricius-JN886035, Tapinoma
melanocephalum Fabricius-JN886036, Plagiolepis
sp.-JN886037, T. albipes Smith-JN886038,
C. compressus Fabricius-JN987857, Monomorium
scabriceps Mayr-JN987858, Pheidologeton diversus
Jerdon-JN987859 and A. gracilipes Smith-JN987860.
PCR products from different ant species were easily
produced and aligned as no insertions, deletions or
stop codons were observed as 1st frame of DNA
sequences were chosen from ORF finder for
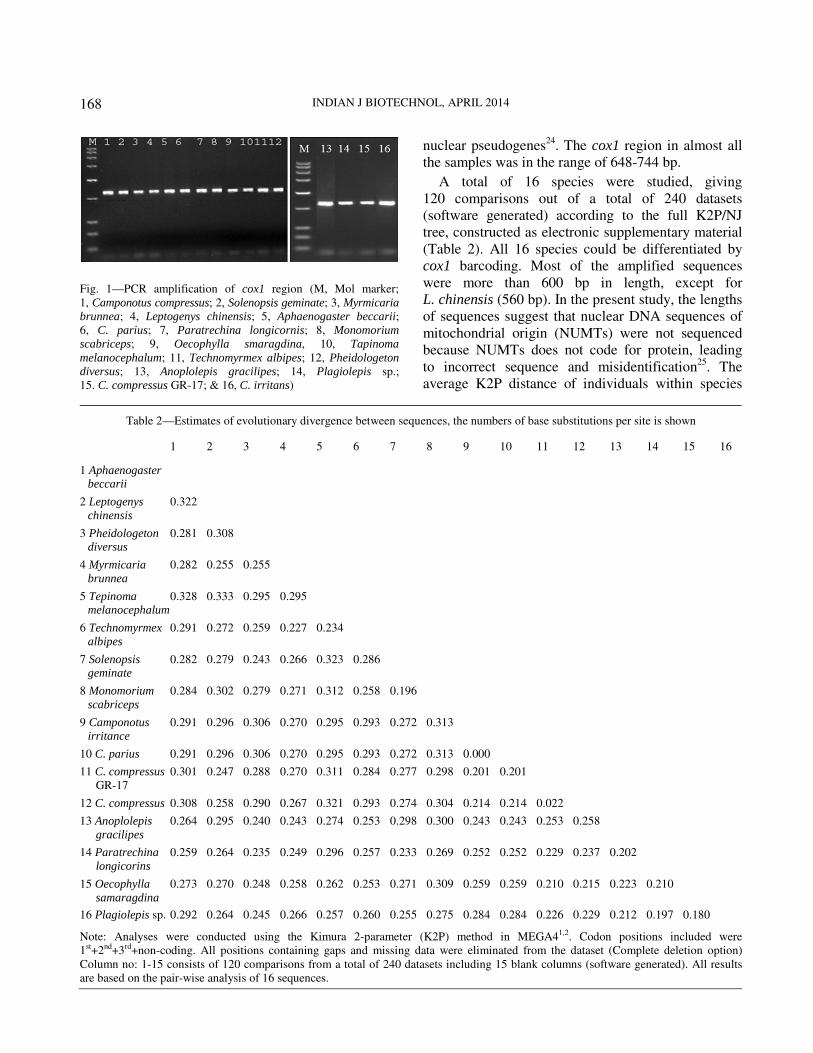
submission. The visualized PCR product contained
only discrete single bands (Fig. 1), thus indicating that
sequences obtained were mitochondrial DNA and not
INDIAN J BIOTECHNOL, APRIL 2014
168
Fig. 1—PCR amplification of cox1 region (M, Mol marker;
1, Camponotus compressus; 2, Solenopsis geminate; 3, Myrmicaria
brunnea; 4, Leptogenys chinensis; 5, Aphaenogaster beccarii;
6, C. parius; 7, Paratrechina longicornis; 8, Monomorium
scabriceps; 9, Oecophylla smaragdina, 10, Tapinoma
melanocephalum; 11, Technomyrmex albipes; 12, Pheidologeton
diversus; 13, Anoplolepis gracilipes; 14, Plagiolepis sp.;
15. C. compressus GR-17; & 16, C. irritans)
nuclear pseudogenes24
. The cox1 region in almost all
the samples was in the range of 648-744 bp.
A total of 16 species were studied, giving
120 comparisons out of a total of 240 datasets
(software generated) according to the full K2P/NJ
tree, constructed as electronic supplementary material
(Table 2). All 16 species could be differentiated by
cox1 barcoding. Most of the amplified sequences
were more than 600 bp in length, except for
L. chinensis (560 bp). In the present study, the lengths
of sequences suggest that nuclear DNA sequences of
mitochondrial origin (NUMTs) were not sequenced
because NUMTs does not code for protein, leading
to incorrect sequence and misidentification25
. The
average K2P distance of individuals within species
Table 2—Estimates of evolutionary divergence between sequences, the numbers of base substitutions per site is shown
1 2 3 4 5 6 7 8 9 10 11 12 13 14 15 16
1 Aphaenogaster
beccarii
2 Leptogenys
chinensis
0.322
3 Pheidologeton
diversus
0.281 0.308
4 Myrmicaria
brunnea
0.282 0.255 0.255
5 Tepinoma
melanocephalum
0.328 0.333 0.295 0.295
6 Technomyrmex
albipes
0.291 0.272 0.259 0.227 0.234
7 Solenopsis
geminate
0.282 0.279 0.243 0.266 0.323 0.286
8 Monomorium
scabriceps
0.284 0.302 0.279 0.271 0.312 0.258 0.196
9 Camponotus
irritance
0.291 0.296 0.306 0.270 0.295 0.293 0.272 0.313
10 C. parius 0.291 0.296 0.306 0.270 0.295 0.293 0.272 0.313 0.000
11 C. compressus
GR-17
0.301 0.247 0.288 0.270 0.311 0.284 0.277 0.298 0.201 0.201
12 C. compressus 0.308 0.258 0.290 0.267 0.321 0.293 0.274 0.304 0.214 0.214 0.022
13 Anoplolepis
gracilipes
0.264 0.295 0.240 0.243 0.274 0.253 0.298 0.300 0.243 0.243 0.253 0.258
14 Paratrechina
longicorins
0.259 0.264 0.235 0.249 0.296 0.257 0.233 0.269 0.252 0.252 0.229 0.237 0.202
15 Oecophylla
samaragdina
0.273 0.270 0.248 0.258 0.262 0.253 0.271 0.309 0.259 0.259 0.210 0.215 0.223 0.210
16 Plagiolepis sp. 0.292 0.264 0.245 0.266 0.257 0.260 0.255 0.275 0.284 0.284 0.226 0.229 0.212 0.197 0.180
Note: Analyses were conducted using the Kimura 2-parameter (K2P) method in MEGA41,2. Codon positions included were
1st+2nd+3rd+non-coding. All positions containing gaps and missing data were eliminated from the dataset (Complete deletion option)
Column no: 1-15 consists of 120 comparisons from a total of 240 datasets including 15 blank columns (software generated). All results
are based on the pair-wise analysis of 16 sequences.

OJHA et al: DNA BARCODING OF INDIAN ANT SPECIES.
169
was 0.166%, with minimum 0.000% and maximum
0.333% (Table 2). Our analysis is the first step
towards assembling the ants of India into a global
library of DNA barcodes. Comparative analysis of A,
T, G, C content was found to have a relatively high
AT content of 68.55% (64.5%-76.3%) compared to
31.44% of GC content. This difference was attributed
to the AT content of the 1st codon (AT1), which
ranged from 20.44-33.13%. The AT content at
2nd
and 3rd
codon positions was nearly invariant
(Table 3). As expected, closely allied species, which
grouped closely in the N-J tree, showed high
percentage of identity and low divergence. For
example, C. irritance and C. parius showed 91.9%
identity and 0.0% divergence, while L. chinensis and
P. diversus showed 58.4% identity and 30.8%
divergence. An interesting observation was that
higher genetic distance was observed in the 1st codon
position compared to the 2nd
and 3rd
codon positions.
Average genetic distances among the different groups
of ants used in this study showed higher values at
the1st codon position, indicating that detailed study on
the 1st codon position for ants might reveal possible
evolutionary information among this closely related
group of organisms. Sequences were heavily AT
biased due to this 1st codon position, which is
expected in insect mtDNA1.
A phylogeny tree constructed using the N-J method
revealed two clusters (Fig. 2). The first cluster
consisted of two sub-clades representing two
subfamilies of ant species: Formicinae (8 species) and
Myrmicinae (4 species), which were originated from
similar ancestors. The second main cluster consisted
of the subfamilies Ponerinae (1 species), Myrmicinae
(1 species), and Dolichoderinae (2 species), showing
sharing of similar characters from their ancestors.
L. chinensis (Ponerinae) is a primitive species of ant
related to M. brunnea (Myrmicinae), which is
consistent with cladistics analysis of morphological
data for ants by Baroni Urbani et al26
and also favours
traditional phylogeny, since all the 16 species were
morphologically identified using traditionally
morphological keys27
. The sequences obtained in the present study
[C. compressus (680 bp), S. geminata (678 bp), M. brunnea (689 bp), L. chinensis (560 bp), A. beccarii
(683 bp), C. parius (687 bp), P. longicornis (648 bp), M. scabriceps (687bp), O. smaragdina (685 bp), T. melanocephalum (690 bp), T. albipes (688 bp), P. diversus (685 bp), A. gracilipes (691 bp), Plagiolepis sp. (744 bp), C. compressus GR-17. (686 bp) and C. irritans (689 bp)] were compared to homologous sequences available in GenBank (Fig. 3). Of all the sequences reported in the study, five were found similar with their respective sequences in GenBank (identities ranged from 89% to 100%), while the remaining 11 sequences were reported for the first time.
Table 3—Per cent AT at the 1st, 2nd, and 3rd codon positions of
16 different ant species of the family Formicidae
Family: Formicidae 1st 2nd 3rd
Anoplolepis gracilipes 20.96 27.58 19.51
Aphaenogaster beccarii 20.44 24.91 20.27
Camponotus compressus 30.74 22.26 20.49
C. compressus GR-17 30.39 21.58 20.51
C. irritans 20.49 24.95 19.83
C. parius 25.22 20.51 20.36
Leptogenys chinensis 21.32 30.90 20.82
Monomorium scabriceps 25.07 19.90 20.51
Myrmicaria brunnea 20.66 26.11 20.00
Oecophylla smaragdina 33.13 22.18 20.97
Paratrechina longicornis 28.57 20.66 21.12
Pheidologeton diversus 24.20 19.78 20.49
Plagiolepis sp. 28.11 20.82 21.12
Solenopsis geminata 25.22 19.75 20.66
Tapinoma melanocephalum 24.46 20.82 20.51
Technomyrmex albipes 26.89 20.51 20.82
Mean 25.36 22.70 20.49
Fig. 2—Cluster analysis based dendrogram depicting genetic
relationships among 16 different ant species, generated by
Bootstrap Test Phylogeny using N-J (Neighbour-joining) method
of MEGA 4 Software. All species are from 4 subfamilies, which
distribute into two main clades (subfamily Myrmicinae clustered
in both clades) that are 12% similar.

INDIAN J BIOTECHNOL, APRIL 2014
170
Fig. 3—Nucleotide alignment of all 16 ant barcodes obtained in the study. Sequences were first assembled using the SeqBuilder tool and
then aligned using the MegAlign tool of the DNASTAR software package. Matching residues are highlighted in grey.

OJHA et al: DNA BARCODING OF INDIAN ANT SPECIES.
171
The present study clearly shows that availability of
DNA tools for diversity assessment will greatly
facilitate and complement taxonomic studies. The
combination of DNA sequencing data with traditional
taxonomy will serve as a model that can be applied
across disciplines. It will increase the rate of species
identification, which will eventually help to deal with
current biodiversity crisis1. In situation where species
identification is difficult, the potential utility of DNA
barcoding is immense. Our results reveal that
cox1 barcoding will permit the unambiguous
identification of ant species of India, thus there is
need to look for integrated approach in taxonomy for
quick identification of insect biodiversity.
Acknowledgements
The authors wish to express their sincere thanks to
NAIP Project of National Agricultural Bioinformatics
Grid, New Delhi, granted to National Bureau of
Agriculturally Important Insects, Bangalore, under
which necessary facilities were provided for the
present study. Authors are also thankful to Dr P D N
Hebert of Biodiversity Institute of Ontario, Canada
for his useful suggestions and advice and Dr C A
Viraktamath of GKVK, Bangalore, for his useful
suggestions, corrections and proper classification of
ant species.
References 1 Smith M A, Fisher B L & Hebert P D, DNA barcoding for
effective biodiversity assessment of a hyper diverse
arthropod group: The ants of Madagascar, Philos Trans R
Soc London B (Biol Sci), 360 (2005) 1825-1834.
2 Brooks T M, Da Fonseca G A B & Rodrigues A S L,
Protected areas and species, Conserv Biol, 18 (2004)
616-618.
3 Hebert P D, Cywinska A, Ball S L & de Waard J R,
Biological identifications through DNA barcodes, Proc Biol
Sci, 270 (2003) 313-321.
4 Wilson E O, The encyclopedia of life, Trends Ecol Evol,
18 (2003) 77-80.
5 Hebert P D N, Ratnasingham S & de Waard J R, Barcoding
animal life: Cytochrome c oxidase subunit 1 divergences
among closely related species, Proc R Soc Lond B (Biol Sci),
270 Suppl 1 (2003) S96-S99.
6 Kurtzman C P, Molecular taxonomy of the yeasts, Yeast,
10 (1994) 1727-1740.
7 Wilson K H, Molecular biology as a tool for taxonomy,
Clin Infect Dis, 20 Suppl 2 (1995) S117-S121.
8 Manwell C & Baker C M, A sibling species of sea cucumber
discovered by starch gel electrophoresis, Comp Biochem
Physiol, 10 (1963) 39-53.
9 Tautz D, Arctander P, Minelli A, Thomas R H & Vogler A P,
DNA points the way ahead in taxonomy, Nature (Lond),
418 (2002) 479.
10 Ward R D, Zemlak T S, Innes B H, Last P R & Hebert P D
N, DNA barcoding Australia’s fish species, Philos Trans R
Soc Lond B (Biol Sci), 360 (2005) 1847-1857.
11 Hebert P D N, Penton E H, Burns J M, Janzen D H &
Hallwachs W, Ten species in one: DNA barcoding reveals
cryptic species in the neotropical skipper butterfly Astraptes
fulgerator, Proc Natl Acad Sci USA, 101 (2004)
14812-14817.
12 Hebert P D N, Stoeckle M Y, Zemlak T S & Francis C M,
Identification of birds through DNA barcodes, PLoS Biol,
2 (2004) e312.
13 Lipscomb D, Platnick N & Wheeler Q, The intellectual
content of taxonomy: A comment on DNA taxonomy,
Trends Ecol Evol, 18 (2003) 65-66.
14 Moritz C & Cicero C, DNA barcoding: Promise and pitfalls,
PLoS Biol, 2 (2004) e354.
15 Papadopoulou A, Bergsten J, Fujisawa T, Monaghan M T,
Barraclough T G et al, Speciation and DNA barcodes:
Testing the effects of dispersal on the formation of discrete
sequence clusters, Philos Trans R Soc Lond B (Biol Sci), 363
(2008) 2987-2996.
16 Floyd R, Abebe E, Papert A & Blaxter M, Molecular
barcodes for soil nematode identification, Mol Ecol,
11 (2002) 839-850.
17 Blaxter M L, The promise of a DNA taxonomy, Philos Trans
R Soc Lond B (Biol Sci), 359 (2004) 669-679.
18 Folgarait P J, Ant biodiversity and its relationship to
ecosystem functioning: A review, Biodivers Conserv,
7 (1998) 1221-1244.
19 Bharti H, Altitudinal diversity of ants in Himalayan regions
(Hymenoptera: Formicidae), Sociobiology, 52 (2008) 305-322.
20 Mohanraj P, Ali M & Veenakumari K, Formicidae of the
Andaman and Nicobar Islands (Indian Ocean: Bay of
Bengal), J Insect Sci, 10 (2010) 172.
21 Sambrook, J F & Russell D W, Molecular cloning: A
laboratory manual, 3rd edn (Cold Spring Harbor Laboratory
Press, Cold Spring Harbor, New York, USA) 2001, p 2100.
22 Saitou N & Nei M, The neighbor-joining method: A new
method for reconstructing phylogenetic trees, Mol Biol Evol,
4 (1987) 406-425.
23 Kumar S, Tamura K, Jakobsen I B & Nei M, MEGA2:
Molecular evolutionary genetics analysis software,
Bioinformatics, 17 (2001) 1244-1245.
24 Bensasson D, Zhang D, Hartl D L & Hewitt G M,
Mitochondrial pseudogenes: Evolution’s misplaced
witnesses, Trends Ecol Evol, 16 (2001) 314-321.
25 Zhang D X & Hewitt G M, Nuclear integrations: Challenges
for mitochondrial DNA markers, Trends Ecol Evol,
11 (1996) 247-251.
26 Urbani C B, Bolton B & Ward P S, The internal phylogeny
of ants (Hymenoptera: Formicidae), Syst Entomol, 17 (1992)
301-329.
27 Holldobler B and Wilson E O, The ants (Harvard University
Press, Cambridge, MA, USA) 1990, p 732.


