
Accepted Manuscript
Title: Dramatic Performance Gains in Vanadium Redox FlowBatteries Through Modified Cell Architecture
Authors: D.S. Aaron, Q. Liu, Z. Tang, G.M. Grim, A.B.Papandrew, A. Turhan, T.A. Zawodzinski, M.M. Mench
PII: S0378-7753(11)02445-1DOI: doi:10.1016/j.jpowsour.2011.12.026Reference: POWER 15184
To appear in: Journal of Power Sources
Received date: 7-9-2011Revised date: 9-12-2011Accepted date: 11-12-2011
Please cite this article as: D.S. Aaron, Q. Liu, Z. Tang, G.M. Grim, A.B. Papandrew, A.Turhan, T.A. Zawodzinski, M.M. Mench, Dramatic Performance Gains in VanadiumRedox Flow Batteries Through Modified Cell Architecture, {\it{Journal of PowerSources}} (2010), doi:10.1016/j.jpowsour.2011.12.026
This is a PDF file of an unedited manuscript that has been accepted for publication.As a service to our customers we are providing this early version of the manuscript.The manuscript will undergo copyediting, typesetting, and review of the resulting proofbefore it is published in its final form. Please note that during the production processerrors may be discovered which could affect the content, and all legal disclaimers thatapply to the journal pertain.
Page 1 of 18
Accep
ted
Man
uscr
ipt
Dramatic Performance Gains in Vanadium Redox Flow Batteries Through Modified Cell
Architecture
D. S. Aaron1, Q. Liu1, Z. Tang1, G. M. Grim1, A. B. Papandrew1, A. Turhan1, T. A.
Zawodzinski1,2, M. M. Mench1,2
1 BRANE Lab, University of Tennessee Departments of Chemical and Biomolecular
Engineering and Mechanical, Aerospace and Biomedical Engineering, The University of
Tennessee Knoxville, 37996
2 Oak Ridge National Laboratory, Oak Ridge Tennessee, 37831
Submitted to the Journal of Power Sources as a Short Communication
August 28, 2011
Page 2 of 18
Accep
ted
Man
uscr
ipt
Abstract
We demonstrate a vanadium redox flow battery with a peak power density of 557 mW cm-2 at a
state of charge of 60%. This power density, the highest reported to date, was obtained with a
zero-gap flow field cell architecture and non-wetproofed carbon paper electrodes. The
electrodes were comprised of stacked sheets of carbon paper and optimized through systematic
variation of the total electrode thickness. We anticipate significant reductions in the ultimate
system cost of redox flow battery systems based on this design.
1. Introduction
Redox flow batteries (RFBs) are a potentially enabling technology for intermittent, renewable
energy sources such as wind and solar power [1-3]. Large-scale energy storage in RFBs could
alleviate the unpredictability of such energy sources by leveling their output over time [4-7].
One type of RFB is the all-vanadium redox battery, in which vanadium is dissolved in an acid
solution, typically sulfuric acid. Since vanadium has four redox states, the V2+/V3+ and V4+/V5+
(present as VO2+/VO2+) redox couples act as the negative and positive electrolytes, respectively.
During discharge, V2+ is oxidized to V3+ while V5+ is reduced V4+; charging a VRB reverses this
process.
Much of the emphasis of recent research on vanadium redox batteries (VRBs) has focused on
improving the energy density of the device. Indeed, conventional VRBs are limited in this
regard, offering roughly 20 – 30 Wh L-1 (Li-ion batteries exceed 150 Wh L-1) [8]. Work to
increase this has focused on increasing the electrolyte concentration in the system. One
important result of this work has been enabling wider operating temperatures along with the
higher concentrations of vanadium species [9]. However, for most stationary power uses, the
Page 3 of 18
Accep
ted
Man
uscr
ipt
energy density per se is a secondary consideration. Cost is a primary driver of applicability of
these systems. Roughly speaking, key contributors to the installed cost of a VRB are the cost of
the vanadium, the membranes used and everything else in similar proportion [10]. The
vanadium cost is fixed by the required capacity and the purity of the vanadium feedstock
demanded. The remaining costs are strong functions of the performance of the battery, best
expressed as the power density or current density in the operating voltage range. The total area
of cell and membrane represent a significant cost, which can be directly reduced by improving
the power density. We note in passing that the operating cost of the system will be also be
strongly influenced by the efficiency of operation. At the cell level, this is tantamount to
increasing the operating voltage of the cell. This, in turn, also implies that the most rational path
forward is to maximize the current density over a given voltage range, with a few other
implications for the manner of operating the system.
In this work, we report the first in a series of efforts to increase VRB performance. Some rather
slight changes in cell design and material selection enable a dramatic increase in power density
of roughly five-fold over previously reported devices, with significant gains also achieved at a
higher operating efficiency point.
2. Method of Approach
2.1 Cell construction
A modified direct methanol fuel cell (Fuel Cell Technologies) with 5 cm2 active area was
utilized in this work, as shown in Figure 1. To minimize ionic and contact resistances between
the membrane and electrode, the RFB had a “zero-gap” configuration, meaning that the
membrane, electrodes, and current collectors were in direct contact. A Nafion 117 (Ion-Power,
Page 4 of 18
Accep
ted
Man
uscr
ipt
Inc.) membrane served as the separator. The electrodes were 10 AA carbon paper (SGL
Technologies GmbH) with uncompressed thickness of ~410 m and specific resistance of 0.012
-cm. Poco pyro-sealed graphite plates with machined serpentine flow channels distributed the
electrolyte across the active area of the RFB while also conducting current to gold-plated current
collectors.
2.2 Electrolyte system
The all-vanadium electrolyte was initially made by dissolution of 1.0 M VOSO4 (99.9% purity,
Alfa Aesar) in a sulfuric acid solution with a total SO42- concentration of 5 M. Both electrolyte
reservoirs initially consisted of a solution containing only the V4+ ion. The positive electrolyte
volume was initially 100 mL, twice the negative electrolyte volume. These electrolytes were
then charged until the V4+ was converted to V2+ (negative electrode electrolyte) and V5+ (positive
electrode electrolyte), and subsequently half of the positive electrolyte solution was removed
from its reservoir, making the solution volumes equal. Acid-resistant diaphragm (KNF Lab) or
peristaltic (Cole Parmer) pumps maintained a flow rate of 20 mL min-1 during charging.
Nitrogen purging in the negative electrolyte reservoir was used to prevent the charged V2+ from
oxidizing to V3+.
2.3 Electrochemical measurements
Polarization curves and impedance spectroscopy were performed with a Bio-Logic HCP-803
potentiostat or a Scribner 857 potentiostat. The positive electrode of the battery served as the
working electrode, while the counter and reference leads connected to the negative electrode.
Discharging polarization curves were recorded galvanostatically, with the battery at an inital
state of charge (SoC) of either 50% or 100%. The battery was assumed to be at full charge when
Page 5 of 18
Accep
ted
Man
uscr
ipt
a current of < 20 mA (4 mA cm-2) was observed when the battery was held potentiostatically at
1.8 V. A SoC of 50% was achieved by assuming 100% coulombic efficiency and discharging
from 100% SoC at 500 mA for the appropriate time, based on the electrolyte volume and
concentration. Each step in the polarization curves lasted for 30s. All experiments in this work
occurred at room temperature with no active temperature control. However, the reservoir
temperature did not measurably increase during an experiment, and the assumption of constant
temperature is maintained throughout this work.
High frequency resistance (HFR) was measured at a single frequency in a range from 10 to 100
kHz with an AC perturbation of 10 mV amplitude. Areal specific resistance (ASR) was
calculated by multiplying the HFR by the active area of the membrane, 5 cm2. The ASR allowed
us to correct polarization curves for ohmic (iR) losses at a given current density. The use of iR
correction is noted where appropriate.
3. Results and Discussion
The critical difference between most designs reported in the literature and that described here is
our use of a fuel cell-type structure with zero gap for electrolyte flow. We flow the solution
through a flow field in contact with a porous carbon electrode. Flow into the electrode occurs by
some combination of diffusion and convection perpendicular to the flow field path. It is possible
that the use of a serpentine flow channel may introduce unacceptable pressure drops in
installation-level cell hardware. If this is the case, the increased power density and efficiency
realized by such a design, detailed below, may compensate for the increased parasitic pump load.
A detailed analysis of system-level considerations such as these is beyond the scope of this
contribution.
Page 6 of 18
Accep
ted
Man
uscr
ipt
We used polarization curves to frame our analysis of the performance of the RFBs, as they help
determine which processes dominate the overpotential at a particular current [11]. It is important
to note that in a laboratory-scale flow battery, unlike in a fuel cell, a significant depletion of
electrolyte capacity may occur during the measurement of a polarization curve. During our
investigation of the optimized battery described below, the state of charge of the electrolytes was
reduced from 100% to less than 35% when the limiting current density was reached. In this case,
the peak power density was obtained when the SOC had been reduced to 60%. The state of
charge of the battery has a significant effect on the maximum power density of the device. In the
case of an initial state of charge of 50%, the peak power was reached at a state of charge of
approximately 41%.
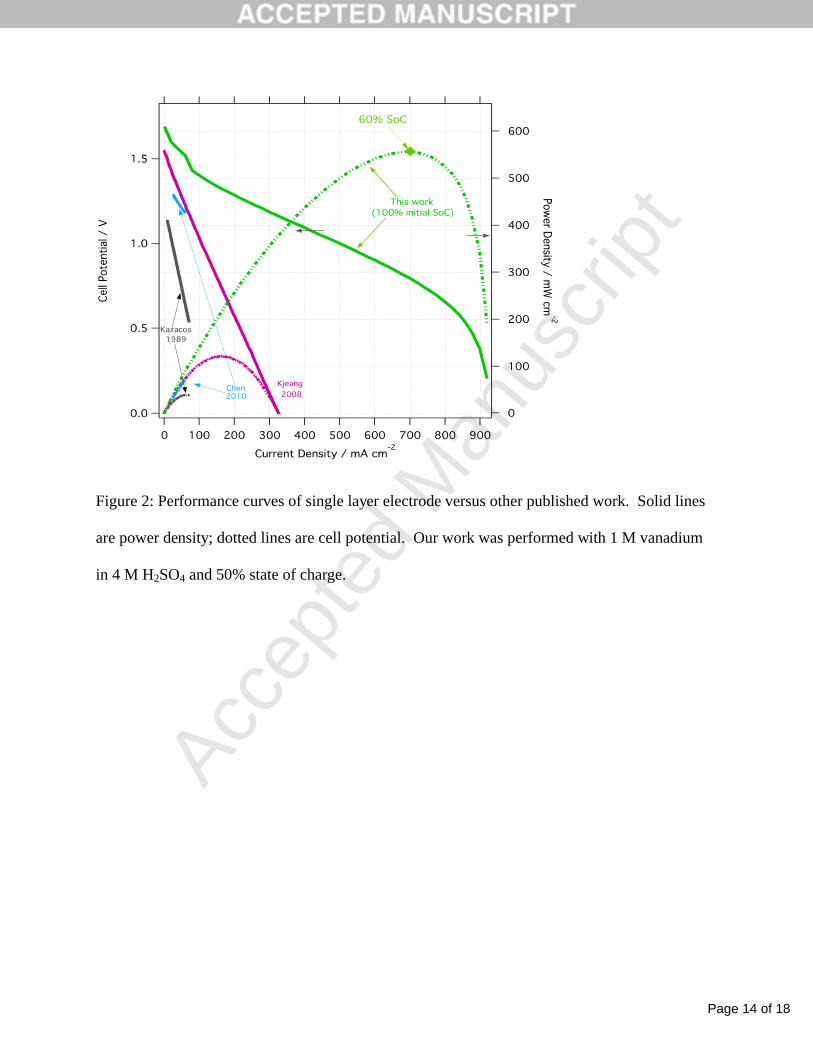
Figure 2 shows a comparison between the polarization curves of the optimized RFB and others
found in the literature. Only one contribution [12] included a full polarization curve; the rest of
the results were for partial polarization curves that had been used to calculate the internal
resistance of a RFB. Additionally, the state of charge of these reported systems is seldom clearly
defined. Nevertheless, the limiting current for our RFB with optimized electrode thickness
exceeded 920 mA cm-2 at 0.20 V while the next highest was 280 mA cm-2 [12]. Moreover, the
cell reported by Kjeang et al. [12] was of a microfluidic design that is not considered feasible for
a large-scale energy storage application and showed small overall output. For a VRB with more
similarities to our design, we found no published, complete polarization curves. However, the
result from Chen et al. [13] shows an overpotential of 293 mV at 20 mA cm-2 compared to 70
mV at the same current for our RFB. The state of charge of the device in Ref. [13] is not stated
explicitly; our device was at nearly full charge. However, we found the overpotentials in our
Page 7 of 18
Accep
ted
Man
uscr
ipt
system at 20 mA cm-2 were unchanged at an initial state of charge of 50%. The design we report
here thus offers increased efficiency over the entire range of operational current density.
The use of a zero-gap cell architecture and thin electrodes had a pronounced effect on the ohmic
losses in the cell. An ASR of 0.50 -cm2 was found for the VRB reported here, while the ASR
values reported by Chen (13) and Kazacos (14) were 3.5 -cm2 and 5.4 -cm2, respectively.
Irrespective of any other losses, a VRFB with an OCV of 1.5 V and an ASR of 5 -cm2 will
never be capable of sustaining more than 300 mA cm-2, and in service will be limited to even
lower current density in order to deliver a useful cell voltage. In contrast, a battery with an ASR
of 0.50 -cm2 is limited to 3 A cm-2. Of course, other losses are present, and this is plainly
evident in the nonlinearity of the polarization curves we present. Nevertheless, lowering the
ohmic ASR of a battery is a prerequisite for increasing its maximum current and power density.
Elimination of any gap between the membrane and the electrodes, a substantial reduction in
electrode thickness, and a significant compressive load on the cell are all likely contributors to
the reported reductions in ohmic ASR. These modifications respectively reduce the ionic,
electronic, and contact resistances in the electrode, and when taken together have a large overall
effect on the total cell ASR.
While high power density is desirable and often an important metric of RFB performance,
overpotential is an essential consideration as well. Improved power density can lead to reduced
costs, as less material would be needed to support a desired power output. However, the
overpotential is also quite large at high power, resulting in relatively inefficient operation. This
inefficiency, manifested as waste heat, can also introduce stack thermal control issues. Thus,
efforts to improve RFBs can also focus on maximizing current at a relatively low overpotential
Page 8 of 18
Accep
ted
Man
uscr
ipt
(i.e. a practical voltage efficiency) rather than pushing out the limiting current to greater values.
In this regard, we have made nearly five-fold improvements in current density at 1.2 V.
Nonetheless, documenting the peak power provides more complete information to contribute to
the optimization. Also, higher performance near the peak power point provides a wider
operating range for the same device, i.e. a larger ratio between peak power and power at a typical
high efficiency operating point. This provides a bit more flexibility in sizing a battery if
substantial short-term fluctuation of power demand or peak shaving ability is present in the
system to which storage is added.
We focused on increasing RFB performance by probing the influence of electrode thickness on
polarization losses in the cell. A key trade-off associated with thicker electrodes is between the
enhancement of the available surface area for the electrochemical reaction and the penalties
associated with poorer mass transport through a thicker layer. We systematically varied the
thickness of one electrode by stacking multiple layers of carbon paper on top of one another,
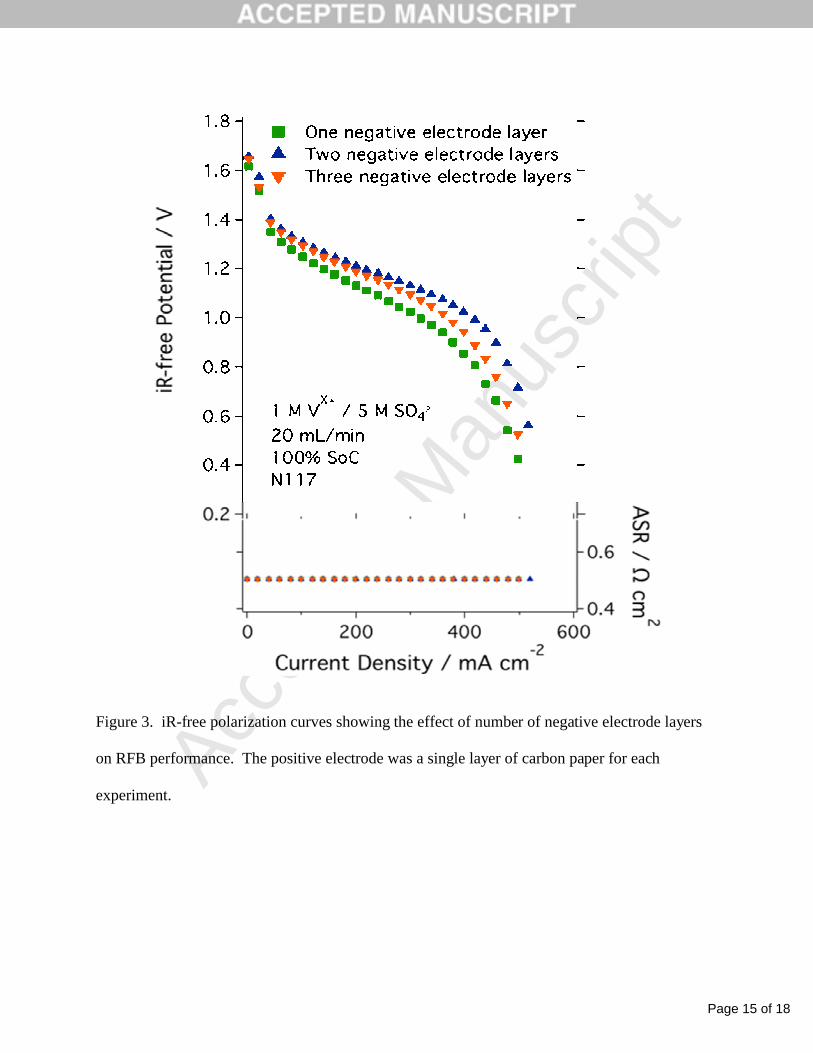
while retaining a single layer of carbon paper as the conjugate electrode. Figures 3 and 4 show
iR-free polarization curves from RFBs initially at 100% SoC for which the number of layers of
carbon paper comprising the negative and positive electrodes, respectively, was varied from 1 to
3. In all cases, the electrode compression was 19 - 25% when the RFB was assembled.
On the negative electrode, multiple layers were superior (i.e. lower overpotential) to a single-
layer, though three layers performed worse than two layers (Figure 3). The overpotentials at 20
mA cm-2 (in the activation dominated polarization region) for one, two and three layers of
negative electrode were 98, 83, and 113 mV, respectively. The best performance in the ohmic
and mass transport-limited regions was observed with two negative electrode layers, as well,
with the difference more pronounced than at low current. There is clearly an important interplay
Page 9 of 18
Accep
ted
Man
uscr
ipt
between the kinetic losses which scale with the available electrode surface area and the ohmic
losses in the electrolyte solutions, which are a function of the convective and diffusive flow to
and from the electrode. Different electrode materials will clearly impact this balance.
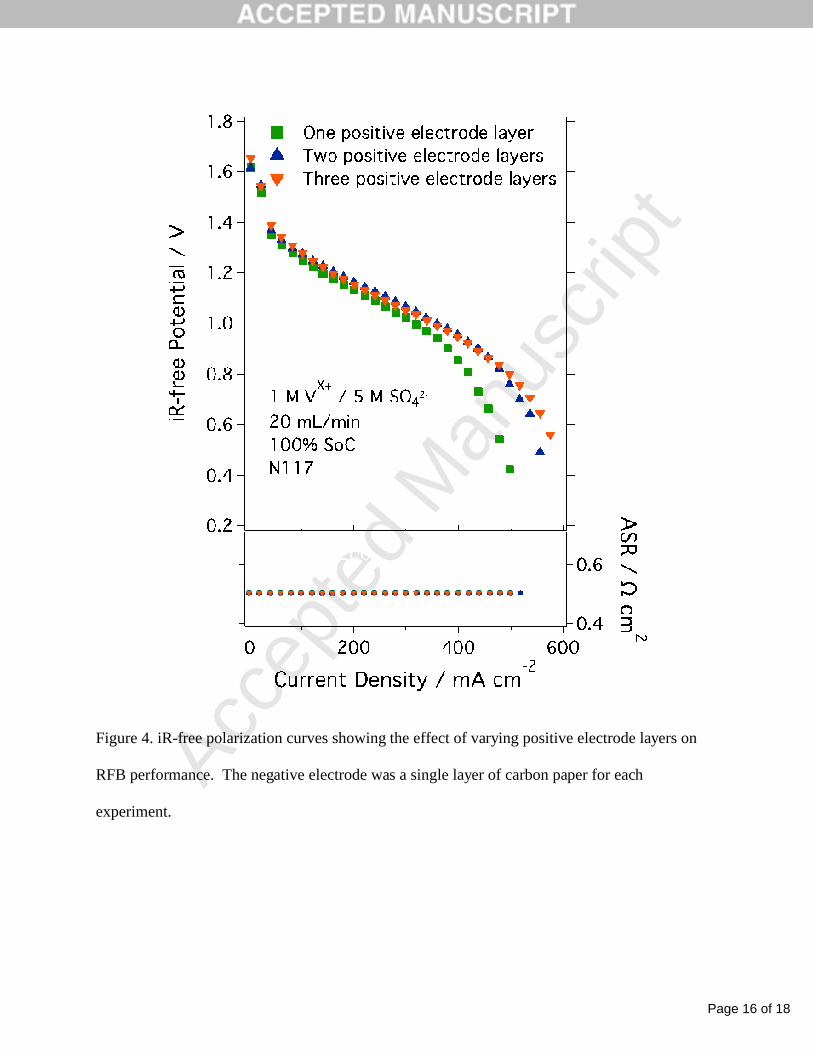
Figure 4 shows results for one to three layers of positive electrode carbon paper and a single
negative electrode layer. In this case, multiple layers were again superior to a single electrode
layer; however, three positive electrode layers performed slightly better than two, especially at
greater current. At 20 mA cm-2, two layers again exhibited the least overpotential – the
overpotentials were 98, 68, and 109 mV for one, two and three positive electrode layers,
respectively. Above 520 mA cm-2, however, the three-layer setup exhibited less iR-free
overpotential than the two-layer setup.
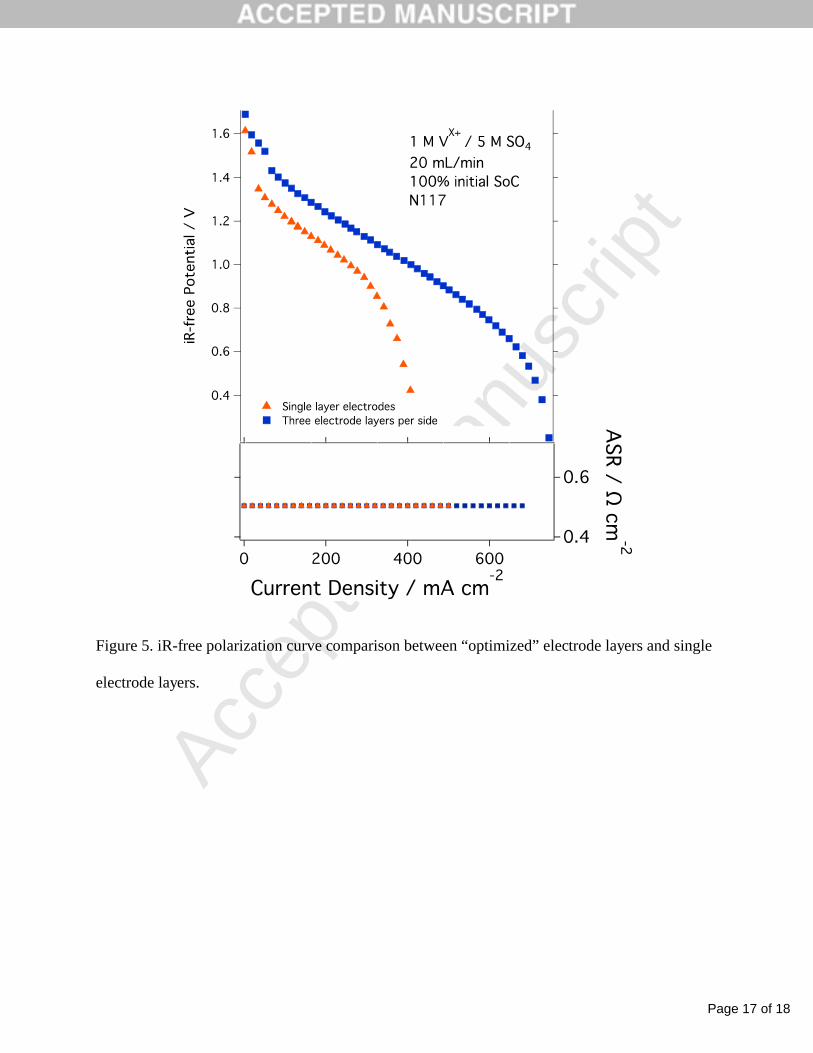
Based on these results, we attempted to construct an optimized RFB employing two layers of
carbon paper as the negative electrode and three layers as the positive electrode, since these
exhibited the lowest overpotentials individually. However, this configuration did not result in the
best performance. We found instead that a configuration using three layers of carbon paper to
form each electrode was superior. This illustrates the importance of single-electrode studies,
which we are presently conducting with the aid of a recently developed in situ reference
electrode [15].
Figure 5 compares the iR-free polarization curves from the optimized RFB to the single-layer
case at a starting SoC of 100%.
5. Conclusions
In this work, the maximum reported power density of a vanadium redox flow battery was
increased more than five-fold compared to other conventional published systems. We attribute
Page 10 of 18
Accep
ted
Man
uscr
ipt
this primarily to the zero gap flow field architecture and thin carbon paper electrodes that
ensured good contact between all components of the cell and reduced charge transport distances.
In addition, the presence of a serpentine flow field effectively spread the electrolyte across the
entire membrane surface area, enhancing mass transport to the electrodes. Utilization of multiple
electrode material layers as the negative and positive electrodes also resulted in improved flow
battery output, and demonstrated the coupled nature of ohmic, kinetic, and mass transport losses
in these systems. The results of this study provide a pathway forward to reduced cost and
dramatically improved performance in vanadium redox flow battery systems.
Acknowledgements
This work was partially funded by the Experimental Program to Stimulate Competitive Research
(EPSCoR) under NSF grant EPS-1004083. Partial support of this work was also provided
though NSF Early Career Development Award # 0644811.
References
[1] M. Rychick, M. Skyllas-Kazacos, Journal Of Power Sources 22 (1988) 59-67.
[2] M. Skyllas-Kazacos, D. Kasherman, D.R. Hong, M. Kazacos, Journal Of Power Sources
35 (1991) 399-404.
[3] R. Dell, Journal Of Power Sources 100 (2001) 2-17.
[4] L. Joerissen, J. Garche, C. Fabjan, G. Tomazic, Journal Of Power Sources 127 (2004) 98-
104.
Page 11 of 18
Accep
ted
Man
uscr
ipt
[5] C. Ponce de Leon, A. Frias-Ferrer, J. Gonzalez-Garcia, D. Szanto, F.C. Walsh, Journal Of
Power Sources 160 (2006) 716-732.
[6] C. Fabjan, J. Garche, B. Harrer, L. Jorissen, C. Kolbeck, F. Philippi, G. Tomazic, F.
Wagner, Electrochimica Acta 47 (2001) 825-831.
[7] Z. Yang, J. Zhang, M. Kintner-Meyer, X. Lu, D. Choi, J. Lemmon, J. Liu, Chemical
Reviews 111 (2011) 3577 – 3613.
[8] M. Skyllas-Kazacos, G. Kazacos, G. Poon, H. Verseema. International Journal of Energy Research 34 (2010) 182-189.
[9] J. Zhang, L. Li, Z. Nie, B. Chen, M. Vijayakumar, S. Kim, W. Wang, B. Schwenzer, J.
Liu, Z. Yang, Journal of Applied Electrochemistry, DOI: 10.1007/s10800-011-0312-1
[10] M. Moore, R. Counce, J. Watson, T. Zawodzinski, H. Kamath Chemical Engineering
Education, submitted
[11] D. Aaron, Z. Tang, A. Papandrew, T. Zawodzinski, Journal of Applied Electrochemistry,
41, (2011) 1175
[12] Kjeang, E., R. Michel, D. Harrington, N. Djilali, D. Sinton, Journal of the American
Chemical Society 130 (2008) 4000 – 4006.
[13] D. Chen, S. Wang, M. Xiao, Y. Meng, Journal of Power Sources 195 (2010) 2089-2095.
[14] M. Kazacos, M. Skyllas-Kazacos, Journal of the Electrochemical Society, 136 (1989)
2759

Page 12 of 18
Accep
ted
Man
uscr
ipt
[15] D. Aaron, T. Zhijiang, J. Lawton, A. B. Papandrew and T. A. Zawodzinski, ECS Trans., in
press. (2011)

Page 13 of 18
Accep
ted
Man
uscr
ipt
Figure 1: Picture/Schematic of VRB test setup in the BRANE lab.
Page 14 of 18
Accep
ted
Man
uscr
ipt
Figure 2: Performance curves of single layer electrode versus other published work. Solid lines
are power density; dotted lines are cell potential. Our work was performed with 1 M vanadium
in 4 M H2SO4 and 50% state of charge.
Page 15 of 18
Accep
ted
Man
uscr
ipt
Figure 3. iR-free polarization curves showing the effect of number of negative electrode layers
on RFB performance. The positive electrode was a single layer of carbon paper for each
experiment.
Page 16 of 18
Accep
ted
Man
uscr
ipt
Figure 4. iR-free polarization curves showing the effect of varying positive electrode layers on
RFB performance. The negative electrode was a single layer of carbon paper for each
experiment.
Page 17 of 18
Accep
ted
Man
uscr
ipt
Figure 5. iR-free polarization curve comparison between “optimized” electrode layers and single
electrode layers.

Page 18 of 18
Accep
ted
Man
uscr
ipt
Highlights
The MR phenomenon is observed in BCMCO sample in the FC magnetization measurement
as the applied field is below 1030 Oe.
The presence of two components to the magnetic ordering come from the contribution of
Mn3+/Mn4+ and Cr3+moments.
The MR phenomenon is suggested to stem from the antiparallel coupling of the Cr3+
moments and the canted Mn3+/4+ moments.


