Dust storm 1935Dust storm 1935
Ed O’LenicEd O’Lenic
National Weather ServiceNational Weather Service
NWS NWS Medium-Range and Medium-Range and Long-Range ForecastsLong-Range Forecasts
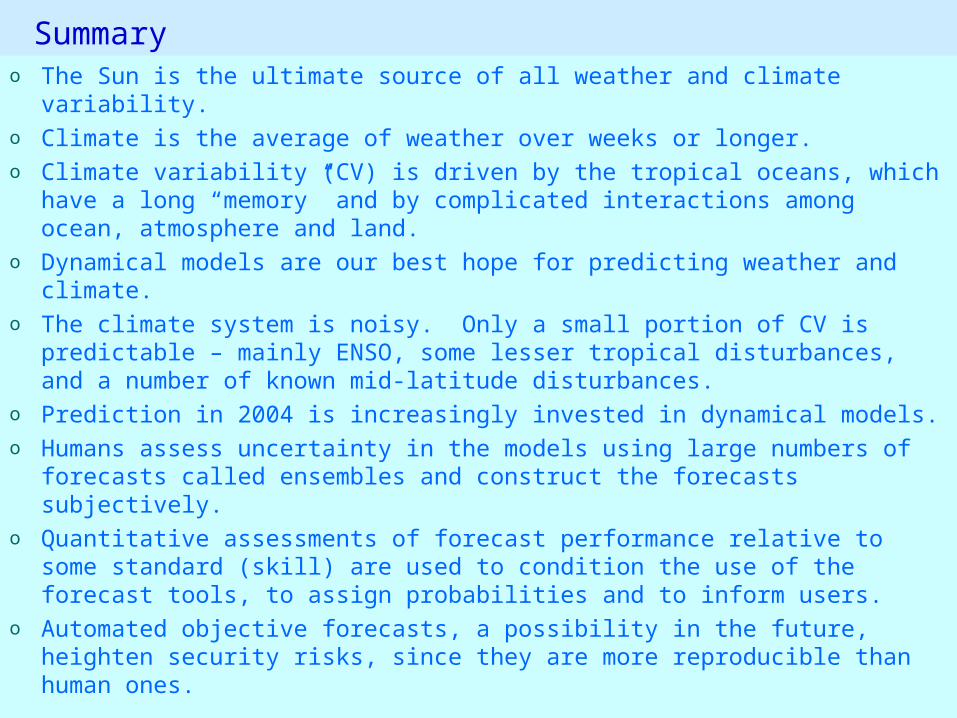
Summaryo The Sun is the ultimate source of all weather and climate variability.o Climate is the average of weather over weeks or longer.o Climate variability (CV) is driven by the tropical oceans, which have a
long “memory” and by complicated interactions among ocean, atmosphere and land.
o Dynamical models are our best hope for predicting weather and climate.
o The climate system is noisy. Only a small portion of CV is predictable – mainly ENSO, some lesser tropical disturbances, and a number of known mid-latitude disturbances.
o Prediction in 2004 is increasingly invested in dynamical models.o Humans assess uncertainty in the models using large numbers of
forecasts called ensembles and construct the forecasts subjectively.o Quantitative assessments of forecast performance relative to some
standard (skill) are used to condition the use of the forecast tools, to assign probabilities and to inform users.
o Automated objective forecasts, a possibility in the future, heighten security risks, since they are more reproducible than human ones.
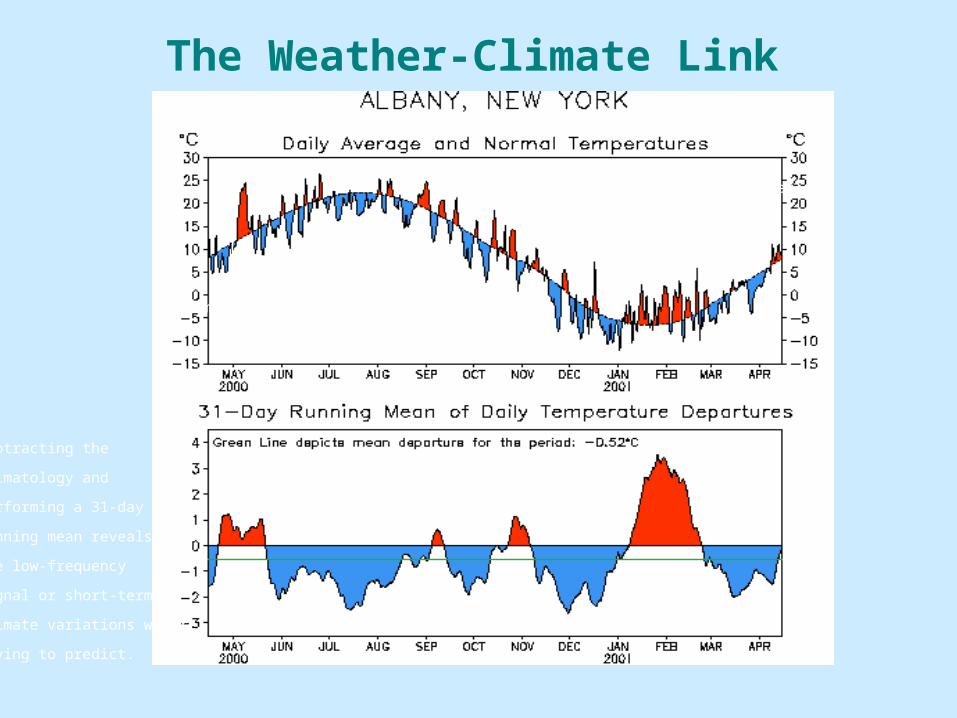
The Weather-Climate Link
•Smooth curve = 30 year mean (climatology)
•Wildly oscillating curve = daily “weather”
Subtracting the
climatology and
performing a 31-day
running mean reveals
the low-frequency
signal or short-term
climate variations we are
trying to predict.

Examples of time series
Time series
TIME
VA
LU
E ->
0 10 20 30 40 50 60 70 80 90 100
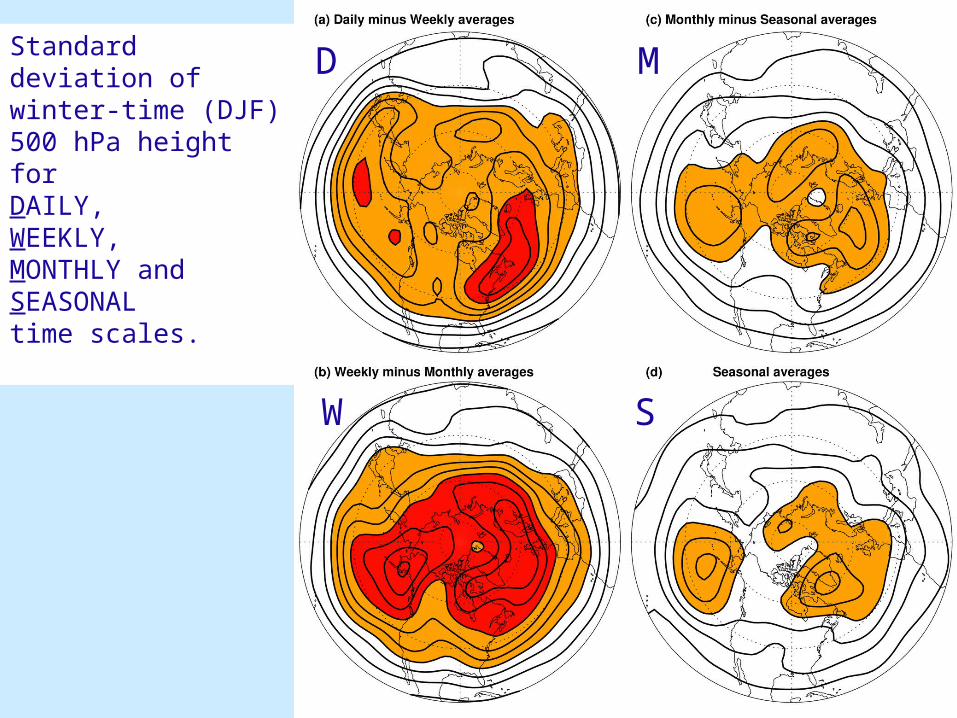
Standard deviation ofwinter-time (DJF) 500 hPa height forDAILY, WEEKLY, MONTHLY and SEASONALtime scales.
Standard deviation ofwinter-time (DJF) 500 hPa height forDAILY, WEEKLY, MONTHLY and SEASONALtime scales.
D M
W S

Time Behavior: Frequency SpectraTime Behavior: Frequency Spectra88..White noiseWhite noise is a time series that has the same is a time series that has the same
variance in every frequency, i.e. a flat spectrum:variance in every frequency, i.e. a flat spectrum:
Frequency
Pow
er

Time Behavior: Time Behavior: AutocorrelationAutocorrelation
T i m e B e h a v i o r : A u t o c o r r e l a t i o n1 . A s i m p l e d e f i n i t i o n o f a u t o c o r r e l a t i o n a t t i m e l a g τ i s
t h a t v a l u e s o f a t i m e s e r i e s s e p a r a t e d b y τ a r e c o r r e l a t e d w i t h e a c h o t h e r ; m a t h e m a t i c a l l y t h e a u t o c o r r e l a t i o n f u n c t i o n i s
2 . S e r i a l c o r r e l a t i o n i s a n o t h e r n a m e f o r a u t o c o r r e l a t i o n .
3 . P e r s i s t e n c e i s p e r f e c t l a g 1 a u t o c o r r e l a t i o n .
x xx t x x t x s ( ) ( / 2
- 2 5
- 2 0
- 1 5
- 1 0
- 5
0
5
1 0
1 5
2 0
2 5
1 9 7 0 1 9 7 1 1 9 7 2 1 9 7 3 1 9 7 4
7-da
y M
A T
max
anom
alie
s (°
F)
Time Behavior: AutocorrelationTime Behavior: Autocorrelation
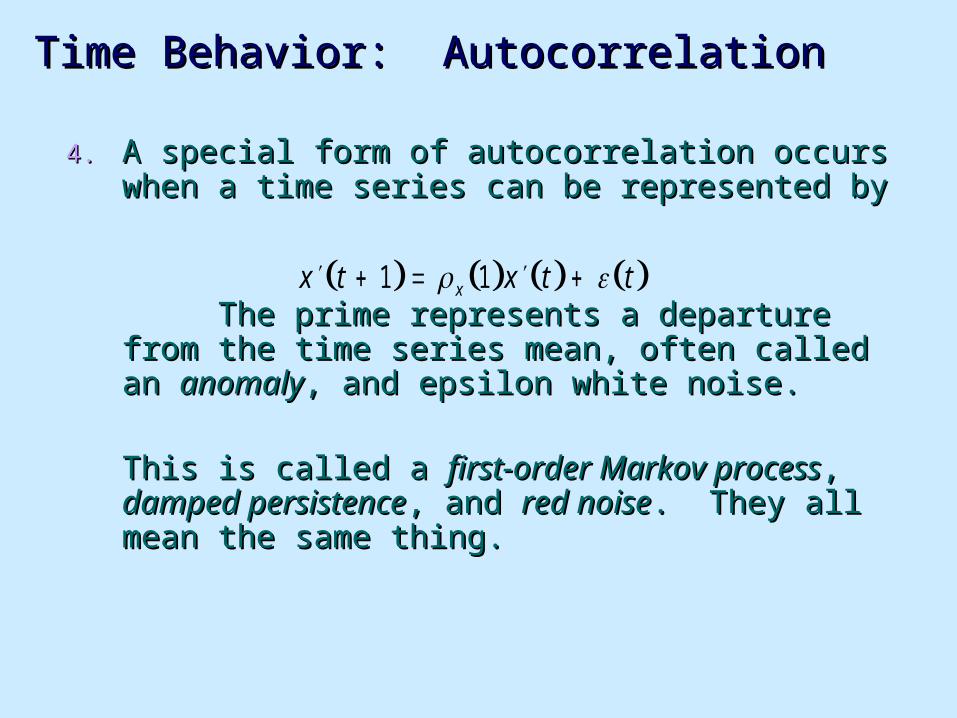
4.4. A special form of autocorrelation occurs when a A special form of autocorrelation occurs when a time series can be represented bytime series can be represented by
The prime represents a departure from the The prime represents a departure from the time series mean, often called an time series mean, often called an anomalyanomaly, and , and epsilon white noise.epsilon white noise.
This is called a This is called a first-order Markov processfirst-order Markov process, , damped persistencedamped persistence, and , and red noisered noise. They all . They all mean the same thing.mean the same thing.
x t x t tx1 1
Time Behavior: AutocorrelationTime Behavior: Autocorrelation
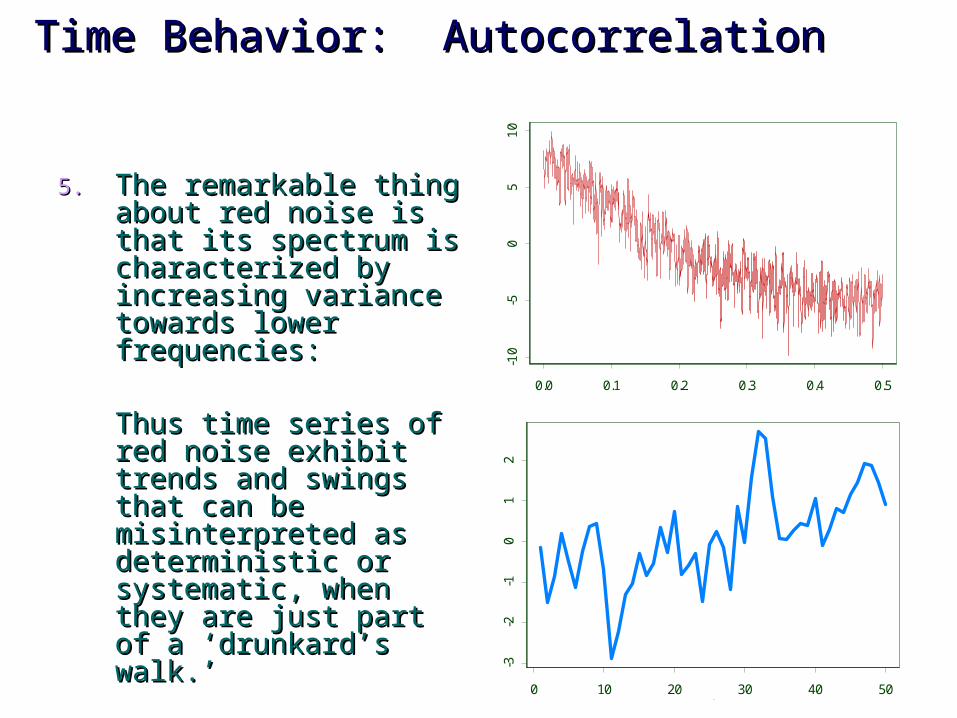
5.5. The remarkable thing The remarkable thing about red noise is about red noise is that its spectrum is that its spectrum is characterized by characterized by increasing variance increasing variance towards lower towards lower frequencies:frequencies:
Thus time series of Thus time series of red noise exhibit red noise exhibit trends and swings trends and swings that can be that can be misinterpreted as misinterpreted as deterministic or deterministic or systematic, when systematic, when they are just part of a they are just part of a ‘drunkard’s walk.’‘drunkard’s walk.’ 0 10 20 30 40 50
Index
-3-2
-10
12
day
ano
mal
ies
frequency
Spe
ctra
po
wer
0.0 0.1 0.2 0.3 0.4 0.5redspec$freq
-10
-50
51
0

Idealized spectrum of extra-tropical Idealized spectrum of extra-tropical height variabilityheight variability
0
0.2
0.4
0.6
0.8
1
1.2
0.001 0.01 0.1 1 10
20 days
( = 2 / r )
200020000 200 2
~ 10 dayseasonal~ 6 yr~ 60 yr daily
anthropogenic forcing ?
ENSOeffect
synoptic broadening
red noisebackground
Idealized spectrum of extratropical height variability
P
log
Time Averages
Periods

DefinitionsDefinitions
- Weather – A snapshot of the atmosphere. - Climate – A “time exposure” of the weather over
weeks - years.- Climate Forecast – Probability of unusual warm, cold,
wet, dry, stormy, calm, conditions over weeks, seasons, …
- Natural Variability – Range of possible values of climate.
- Skill – Accuracy of a forecast compared to a standard.- Dynamical Model – Allows physically-based calculation
of likely future values of weather/climate variables.- Statistical Model – Uses empirical relationships to
calculate likely future values of weather/climate variables.
- ENSO – El Nino/Southern Oscillation, comprised of El Nino, Neutral, La Nina
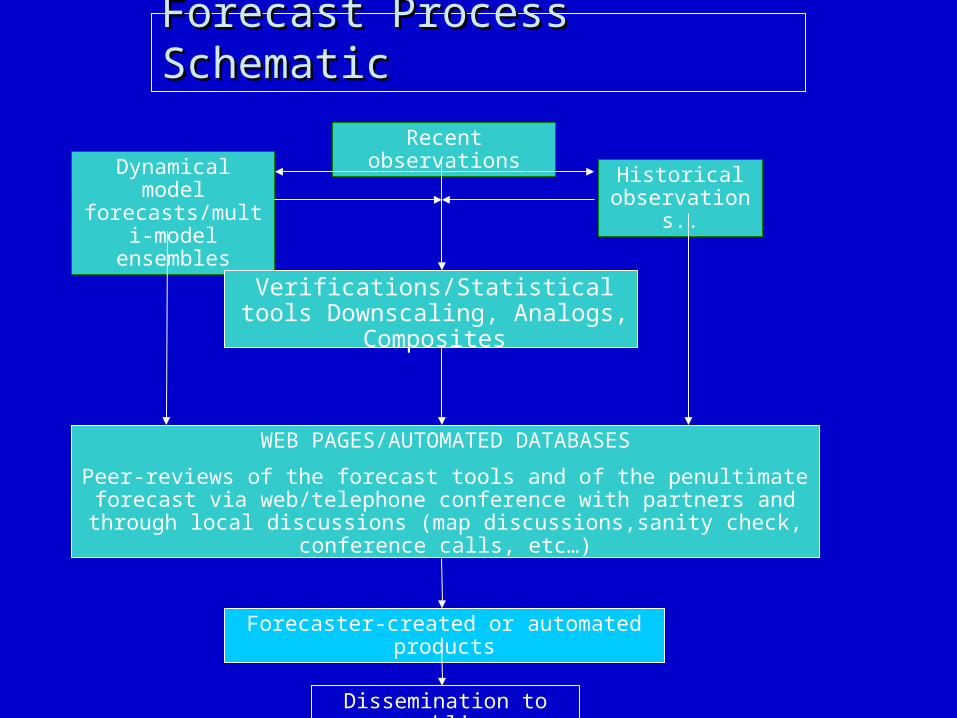
Forecast Process SchematicForecast Process Schematic
Dynamical model forecasts/multi-
model ensembles
Recent observations
Historical observations..
Verifications/Statistical tools Downscaling, Analogs, Composites
WEB PAGES/AUTOMATED DATABASES
Peer-reviews of the forecast tools and of the penultimate forecast via web/telephone conference with partners and through local discussions (map
discussions,sanity check, conference calls, etc…)
Forecaster-created or automated products
Dissemination to public

Long-Range Temperature Forecast Process
RECENT AND HISTORICAL OBSERVATIONS - Mean and typical variability (climatology)
- Most recent status of the atmosphere- Developmental data for statistical models
- Starting values for dynamical models- Verification data for models and forecasts
ASSESSMENT OF UNCERTAINTY- Ensembles of forecasts/inter-compare models
- Status of ENSO- Known skill of models
- Bias removal
HUMAN PREDICTION- Community assessment of forecast models
- Remove uncorrected biases- Make categorical forecasts
- Assign probabilities subjectively
DISSEMINATE

Climatology – The “what” we compare things to, Climatology – The “what” we compare things to, is just the 30-year average of something, like is just the 30-year average of something, like ocean temperature. ocean temperature.
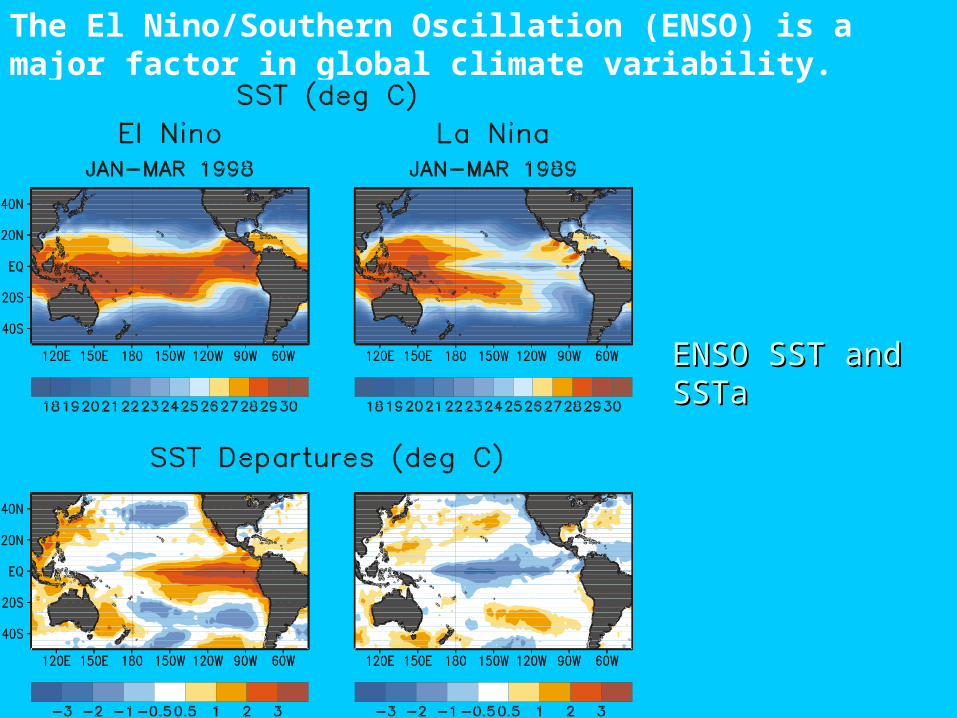
The El Nino/Southern Oscillation (ENSO) is a major factor in global climate variability.
ENSO SST and ENSO SST and SSTaSSTa

Locations For M ajor Storm s (Days Per W inter Season)
La Nina 1998-1999~Above AverageStorm s, H urricane
Force W indsNov 98 - Feb 99
Active HurricaneSeason
Aug-Nov 98
TornadoesJan 1999
No M ajor “Northeasters”
Below Norm alStorm iness
Dec 98-Feb 99
M ajor Ice StormJan 99
M ajorSnow Storm
Jan 99
Extensive IceStorm
Dec 98
Exam ples of C limate Control Over Weather Patterns.The Basis of Linking Climate and W eather
Extensive Storm sDec 97-M ar 98
M assiveIce Storm
Jan 98
Strong “Northeaster”
Storm sJan-Feb 98
Tornado O utbreakFeb 98
Frequent Storm sNov 97-M ar 98
El Nino 1997-1998~
DroughtSpring 1999
Dim inishedHurricane
Threat
Very strong ENSO events produce reliable impacts on short-term U.S. climate, unfortunately, few ENSO events are.

50 years of tropical storm activity
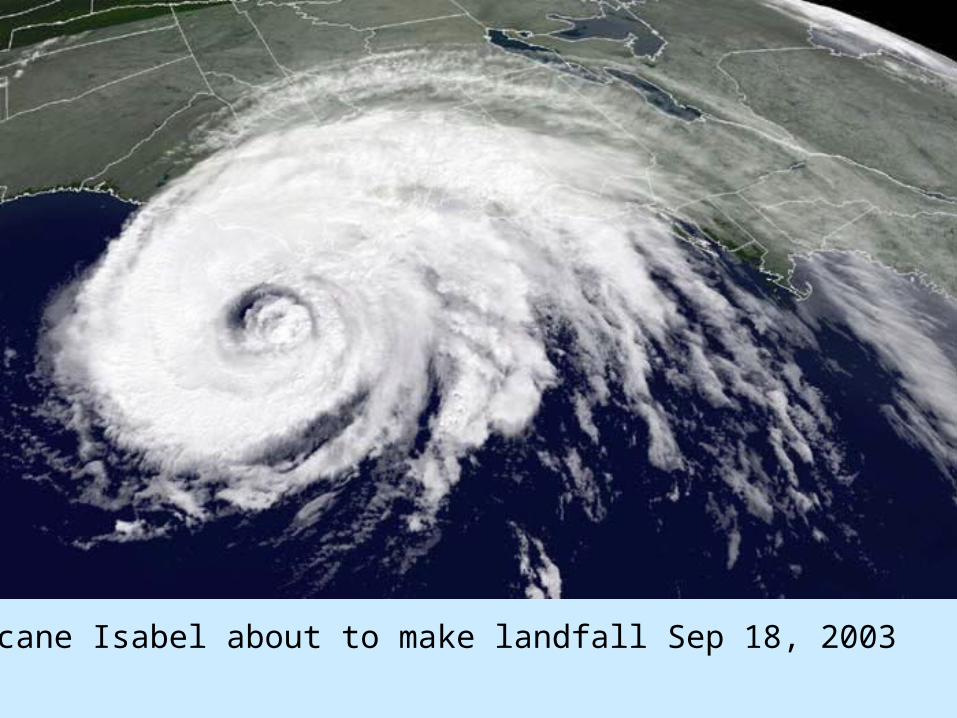
IsabelIsabel
Hurricane Isabel about to make landfall Sep 18, 2003

May 2003 Atlantic Hurricane Season May 2003 Atlantic Hurricane Season OutlookOutlook

Climate Model-derived streamflow Climate Model-derived streamflow forecast for 2003forecast for 2003

CPC’s Seasonal forecasts, a collaborative activity
Each month, on the second Friday, and the following Tuesday,
CPC joins with our main collaborators - NOAA’s ClimateDiagnostics Center (CDC) and the private, non-profit, NOAA-supported International Institute for Climate Prediction (IRI)to discuss the recent status of the climate system, theperformance of our recent forecasts, and the informationavailable in the latest set of forecast tools (Friday) and thefirst draft of the forecast (Tuesday). CPC’s Official Forecastis released on the third Thursday of the month at 8:30 AM.A web page and a telephone conference call are used toexchange information.
Impact on markets is less than 6-10- and 8-14-day forecasts.
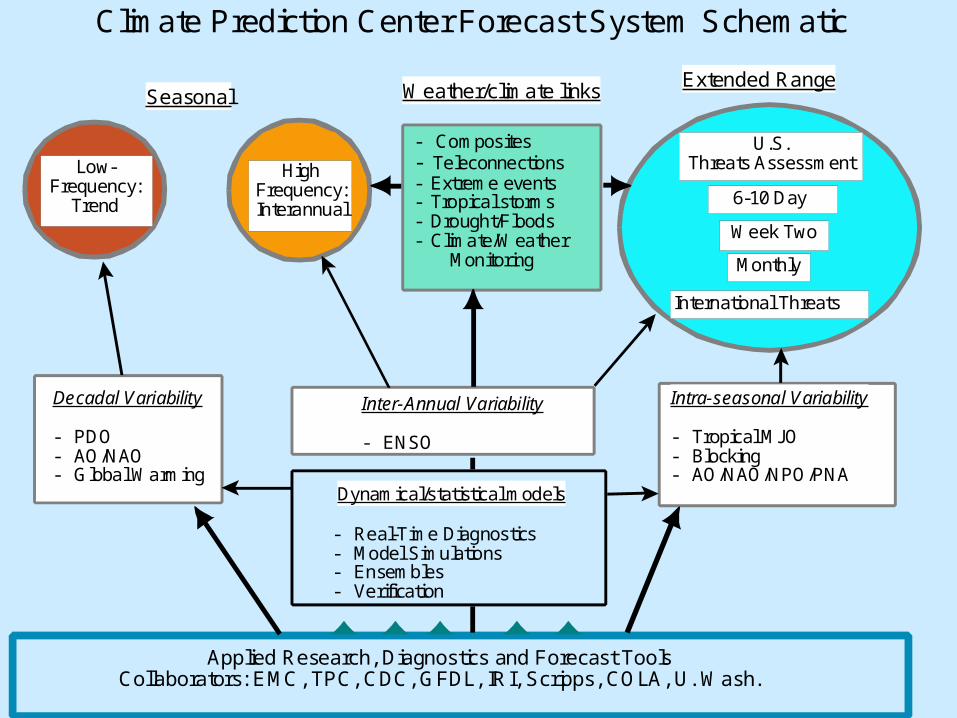
CPC forecast system schematic
Applied Research, Diagnostics and Forecast ToolsCollaborators: EMC, TPC, CDC, GFDL, IRI, Scripps, COLA, U. Wash.
Inter-Annual Variability
- ENSO
Decadal Variability
- PDO- AO/NAO- Global Warming
Intra-seasonal Variability
- Tropical MJO- Blocking- AO/NAO/NPO/PNA
SeasonalExtended Range
Climate Prediction Center Forecast System Schematic
HighFrequency:Interannual
Low-Frequency:
Trend
U.S.Threats Assessment
6-10 Day
Week Two
Monthly
International Threats
Dynamical/statistical models
- Real-Time Diagnostics- Model Simulations- Ensembles- Verification
Weather/climate links
- Composites- Teleconnections- Extreme events- Tropical storms- Drought/Floods- Climate/Weather Monitoring

LLF SSTa from 1 Jan 2004LLF SSTa from 1 Jan 2004

LLF for FMA from 1 Jan LLF for FMA from 1 Jan 20042004
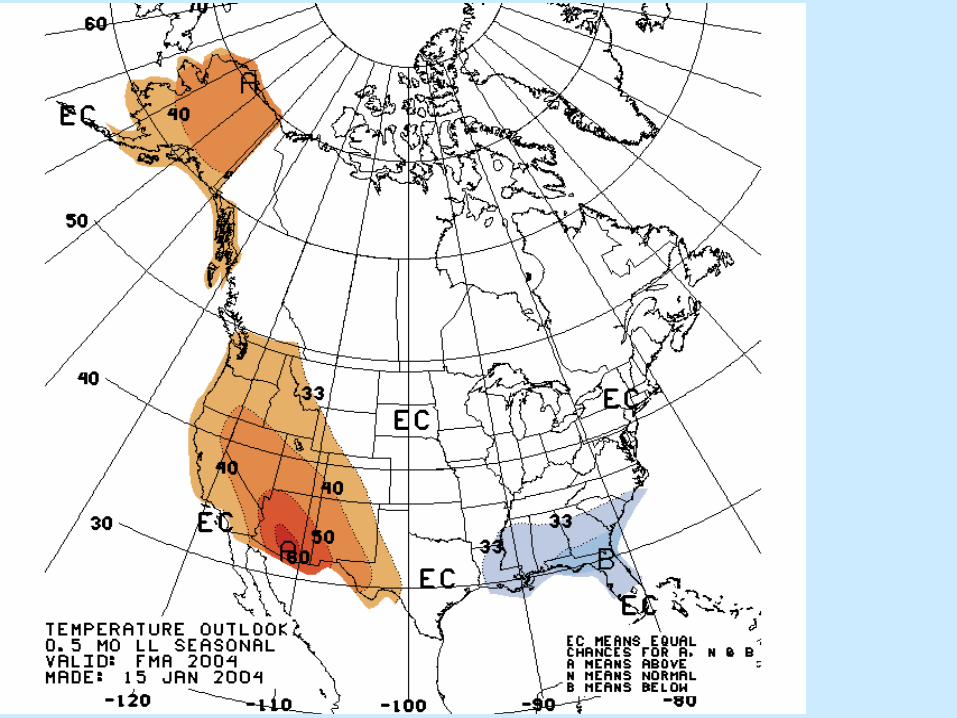
FMA 2004 Off TFMA 2004 Off T
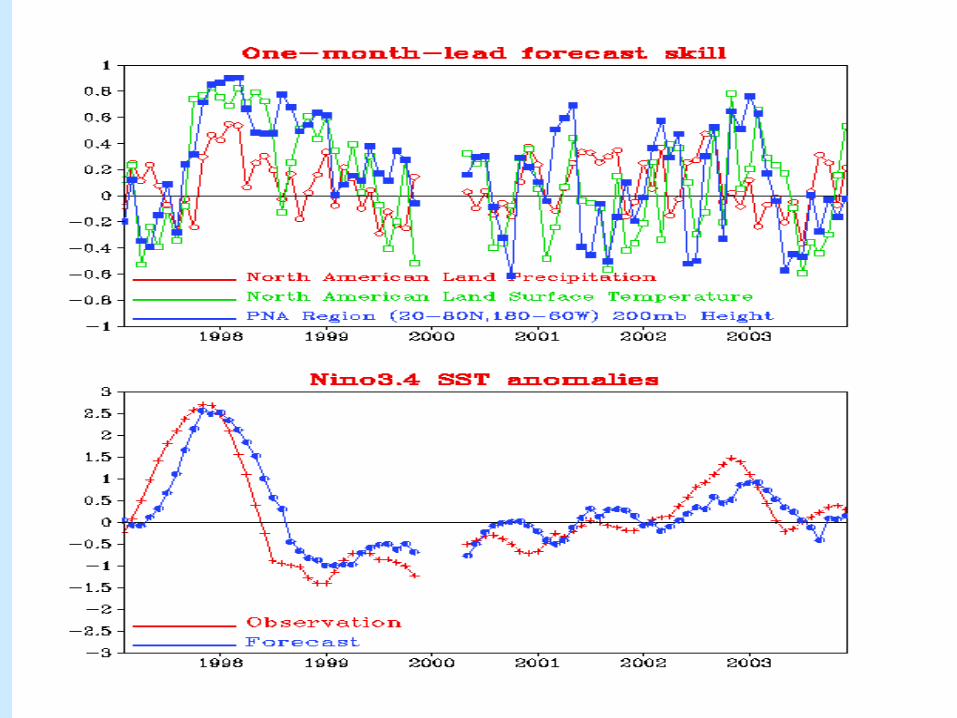
CFS skillCFS skill
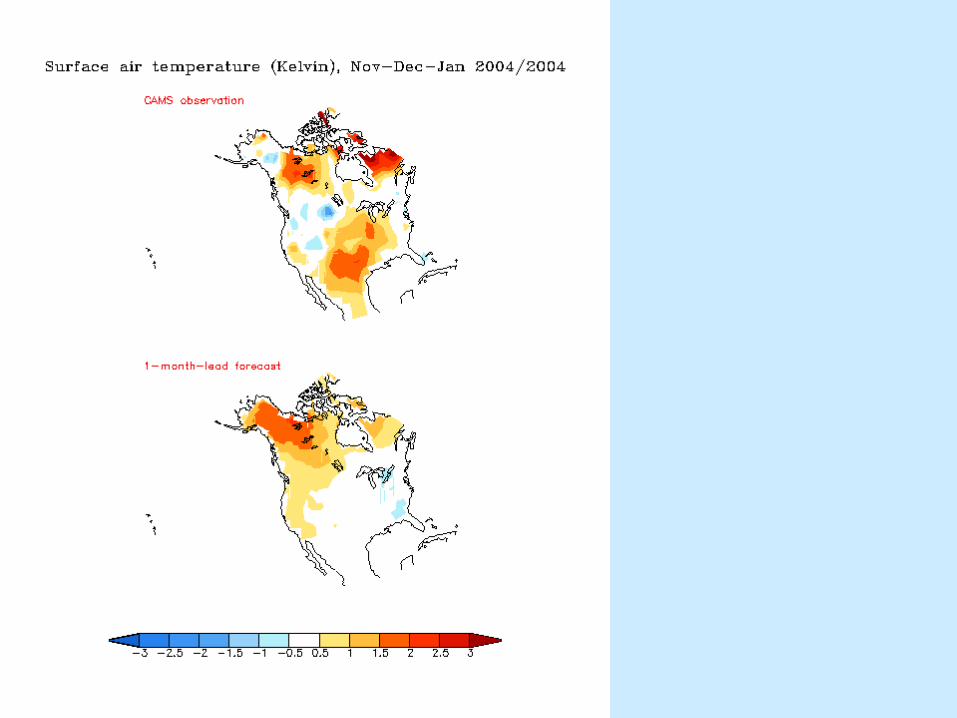
CFS Obs and FcstCFS Obs and Fcst

OFF T skill


CPC’s Medium-Range Forecasts
- Valid for an average of days 6-10 and 8-14 in the future- Prepared daily. Weekdays by a human. Weekend
automated.- Relies nearly completely on dynamical model forecasts.- A single forecaster prepares the forecast and releases it
at 3PM- Secure computer systems are used to disseminate the
forecasts- Internet and NWS circuits are used to disseminate.- No outside collaboration is used.- Strongly impacts markets.

MRF die off curveMRF die off curveDIE-OFF of model daily forecast skill

6-10 day T6-10 day T

Medium-Range Forecast Process Mirrors that for Long-Range
RECENT AND HISTORICAL OBSERVATIONS - Mean and typical variability (climatology)
- Most recent status of the atmosphere- Developmental data for statistical models
- Starting values for dynamical models- Verification data for models and forecasts
ASSESSMENT OF UNCERTAINTY- Ensembles of forecasts/inter-compare models
- Status of major circulation anomalies- Known skill of models
- Bias removal
HUMAN PREDICTION- Assessment of forecast models
- Remove uncorrected biases- Make categorical forecasts
- Assign probabilities subjectively
DISSEMINATE

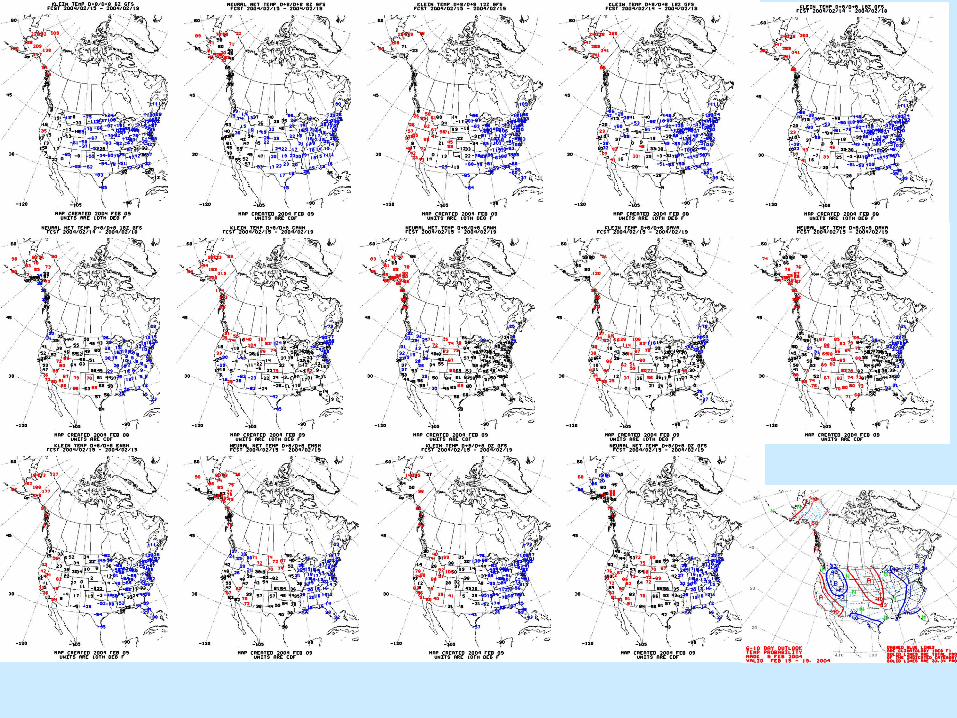
Spaghetti diagram
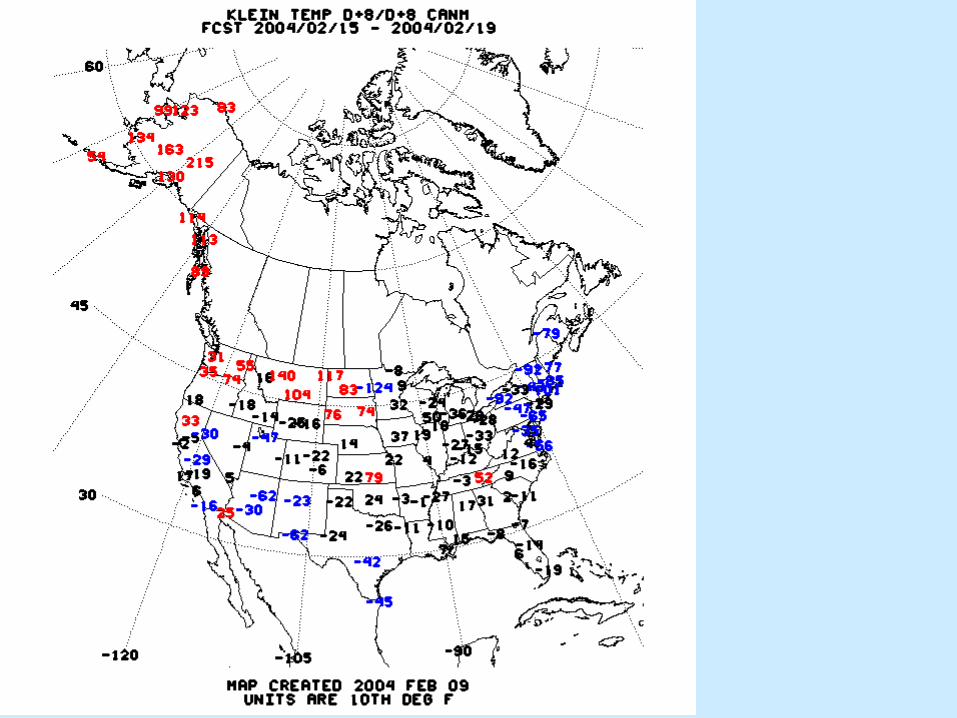
Canadian KL T
T forecast toolsT forecast tools

CDC Pr(upper tercile 850T)

Uncalibrated forecastsUncalibrated forecasts

Calibrated forecastsCalibrated forecasts

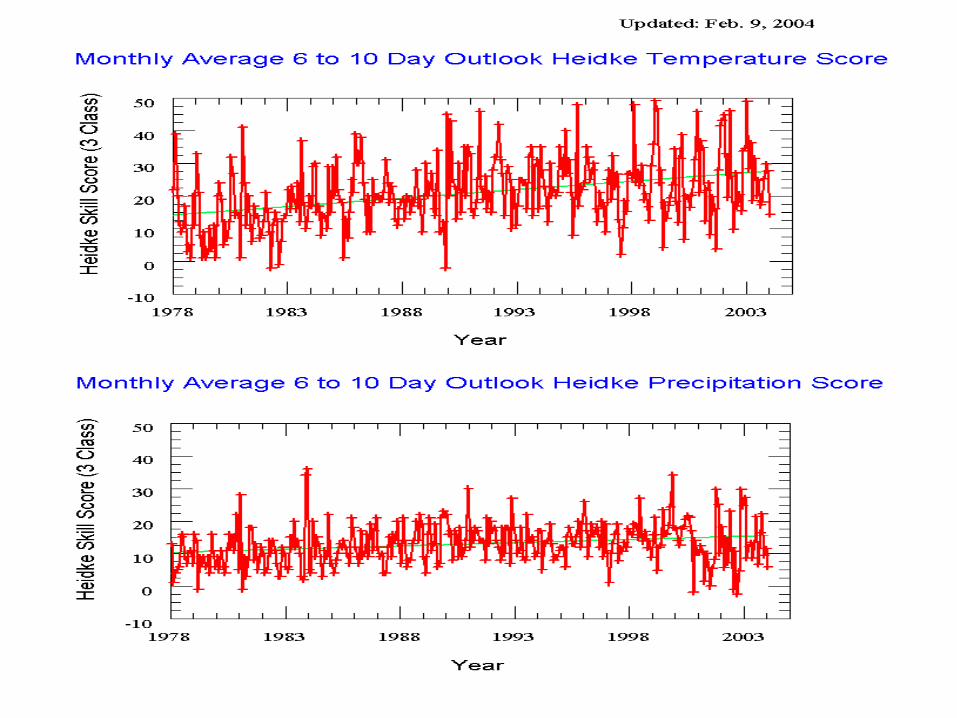
6-10 skill


Summaryo The Sun is the ultimate source of all weather and climate variability.o Climate is the average of weather over weeks or longer.o Climate variability (CV) is driven by the tropical oceans, which have a
long “memory” and by complicated interactions among ocean, atmosphere and land.
o Dynamical models are our best hope for predicting weather and climate.
o The climate system is noisy. Only a small portion of CV is predictable – mainly ENSO, some lesser tropical disturbances, and a number of known mid-latitude disturbances.
o Prediction in 2004 is increasingly invested in dynamical models.o Humans assess uncertainty in the models using large numbers of
forecasts called ensembles and construct the forecasts subjectively.o Quantitative assessments of forecast performance relative to some
standard (skill) are used to condition the use of the forecast tools, to assign probabilities and to inform users.
o Automated objective forecasts, a possibility in the future, heighten security risks, since they are more reproducible than human ones.