Dynamic models for understanding infrastructure and housing investments
ACC Sustainable Human Settlements CitylabUrban Transformation: Challenges For Infrastructure & Housing Provision
Nick Graham30th October 2012

2 of 18
Why use dynamic models?
1. To understand the multiple processes and variables that simultaneously affect housing supply and demand
2. To understand the interactions between housing, infrastructure, transport, space and money.
Example: eThekwini Housing Model
Example: City Efficiency Costing Model

3
eThekwini Housing Model
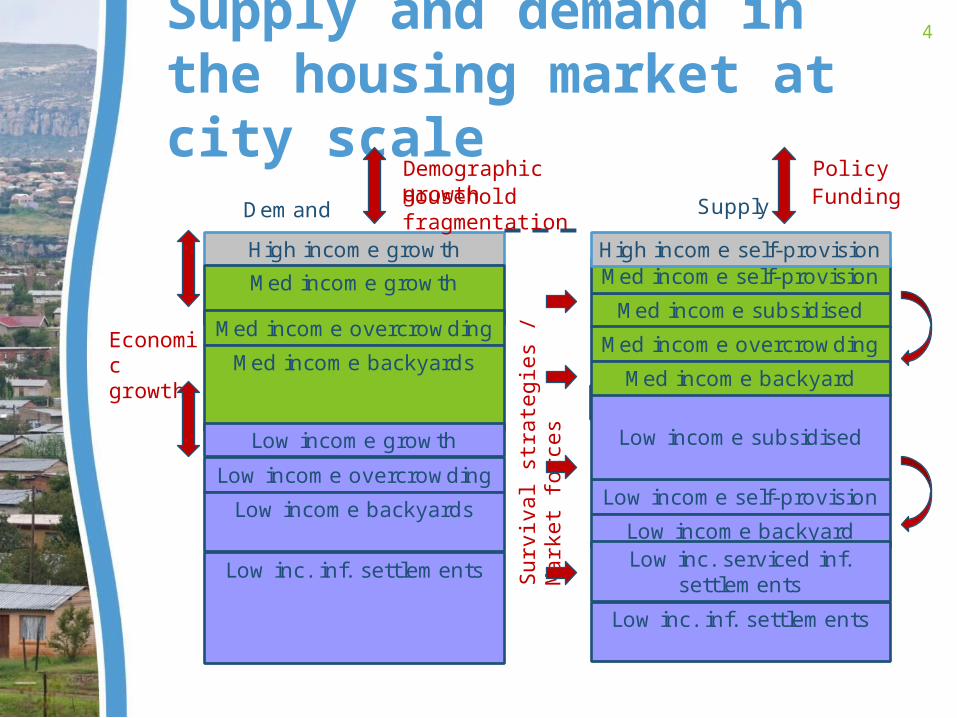
4 of 18Supply and demand in the housing market at city scale
DemandHigh income growthMed income growth
Med income overcrowdingMed income backyards
Low income growthLow income overcrowding
Low income backyards
Low inc. inf. settlements
Low income self-provision
Supply
Med income subsidisedMed income overcrowding
Downward raidingLow income subsidised
Low inc. inf. settlements
Med income self-provisionHigh income self-provision
Med income backyard
Low income backyardLow inc. serviced inf.
settlements
Demographic growth
Economic growth
Household fragmentationPolicyFunding
Surv
ival
stra
tegi
es /
Mar
ket f
orce
s
5
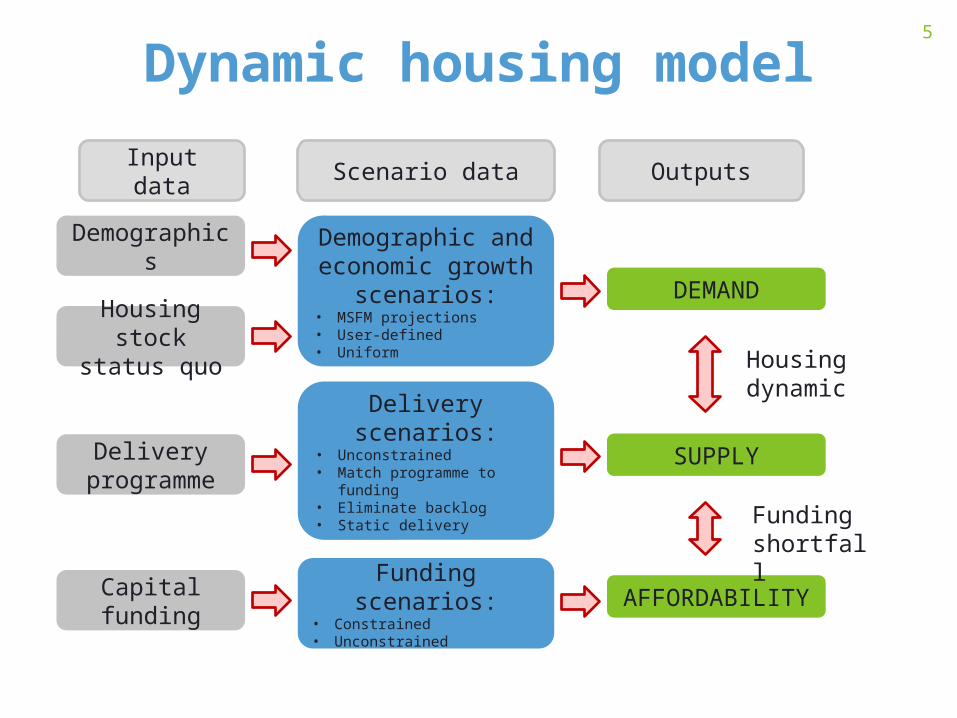
Dynamic housing model
DEMAND
SUPPLY
AFFORDABILITY
Housing stock status quo
Demographics Demographic and economic growth
scenarios:• MSFM projections• User-defined • Uniform
Delivery programme
Delivery scenarios:• Unconstrained• Match programme to funding• Eliminate backlog• Static delivery
Capital funding Funding scenarios:• Constrained• Unconstrained
Input data Scenario data Outputs
Housing dynamic
Funding shortfall
6
-
5,000
10,000
15,000
20,000
25,000
30,000
Opp
ortu
nitie
s pe
r yea
r
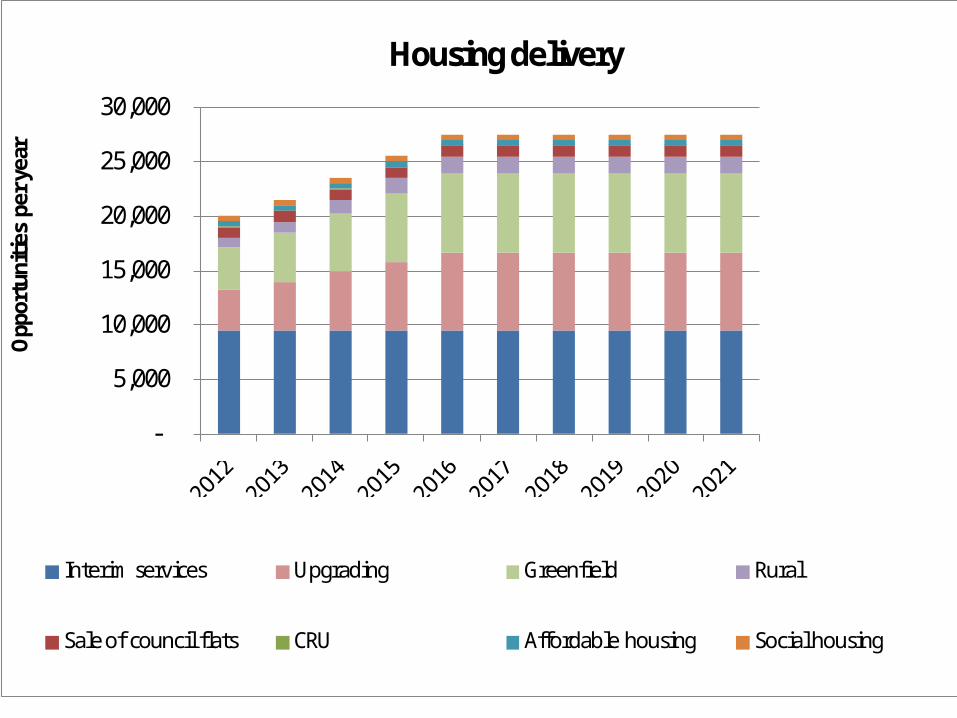
Housing delivery
Interim services Upgrading Greenfield Rural
Sale of council flats CRU Affordable housing Social housing
7
-100,000
-
100,000
200,000
300,000
400,000
500,000
600,000
700,000
800,000
900,000
2011 2012 2013 2014 2015 2016 2017 2018 2019 2020 2021
Hous
ehol
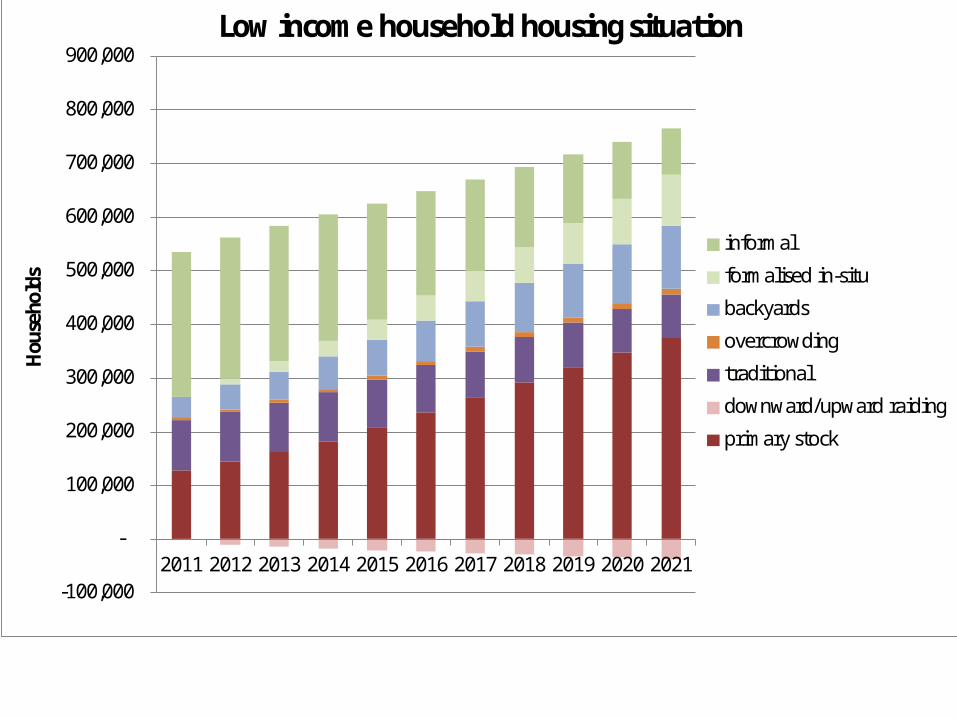
dsLow income household housing situation
informal
formalised in-situ
backyards
overcrowding
traditional
downward/upward raiding
primary stock

8
-
50,000
100,000
150,000
200,000
250,000
300,000
350,000
2011 2012 2013 2014 2015 2016 2017 2018 2019 2020 2021
Hous
ehol
dsMedium income household housing situation
informal
traditional
backyards
overcrowding
downward raiding
primary stock
9
-
500
1,000
1,500
2,000
2,500
R m
illio
n pe
r yea
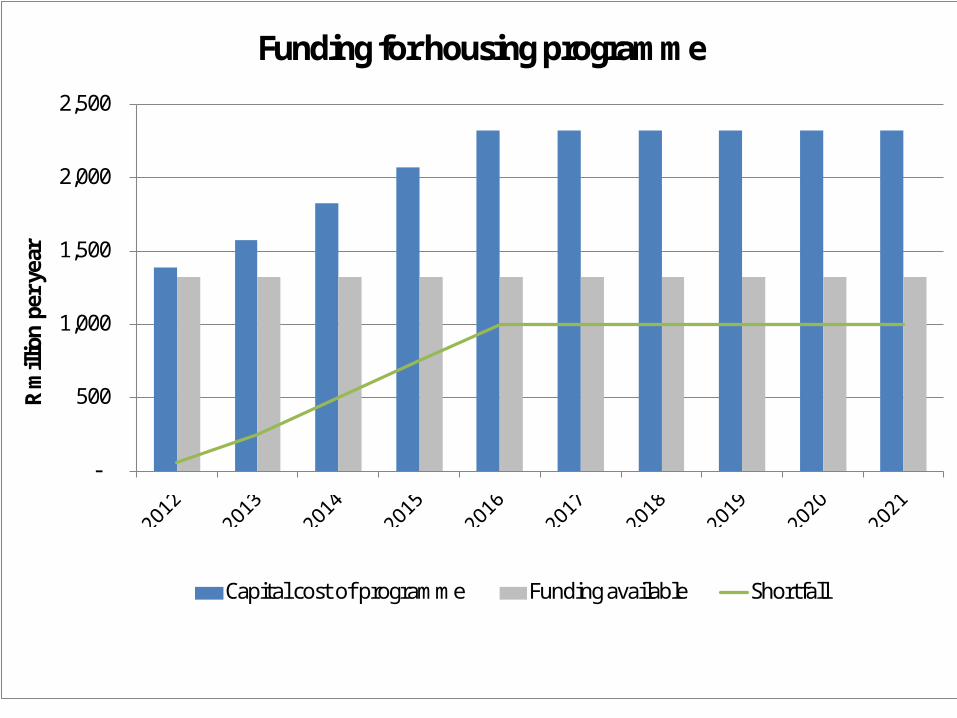
rFunding for housing programme
Capital cost of programme Funding available Shortfall
10
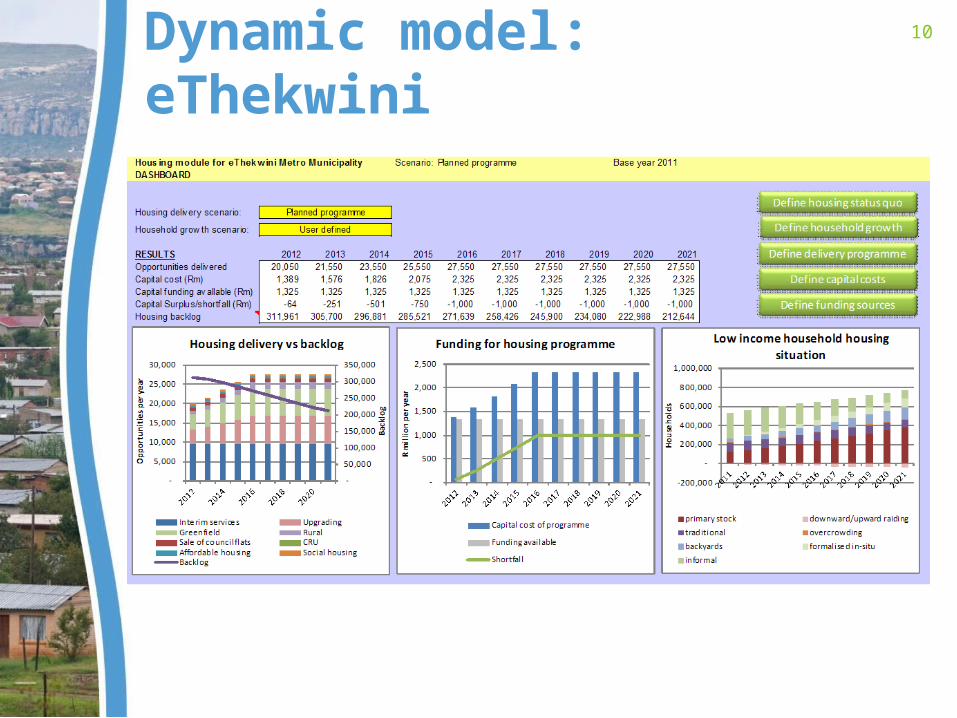
Dynamic model: eThekwini

11 of 18
Learning
Interventions need to be understood in the context of market distortion and general supply shortage
Targets, budgets and programmes do not tie up and are unrealistic.
12
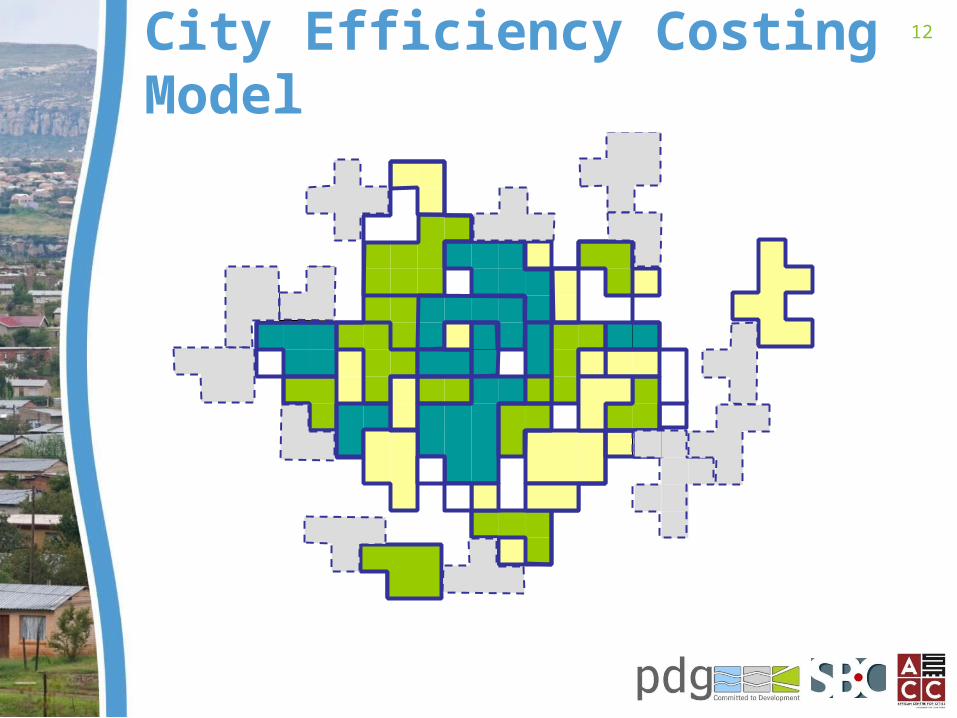
City Efficiency Costing Model
9 High Income11 Medium Income17 Low Income11 VacantFuture zones
9 High Income11 Medium Income17 Low Income11 VacantFuture zones
13
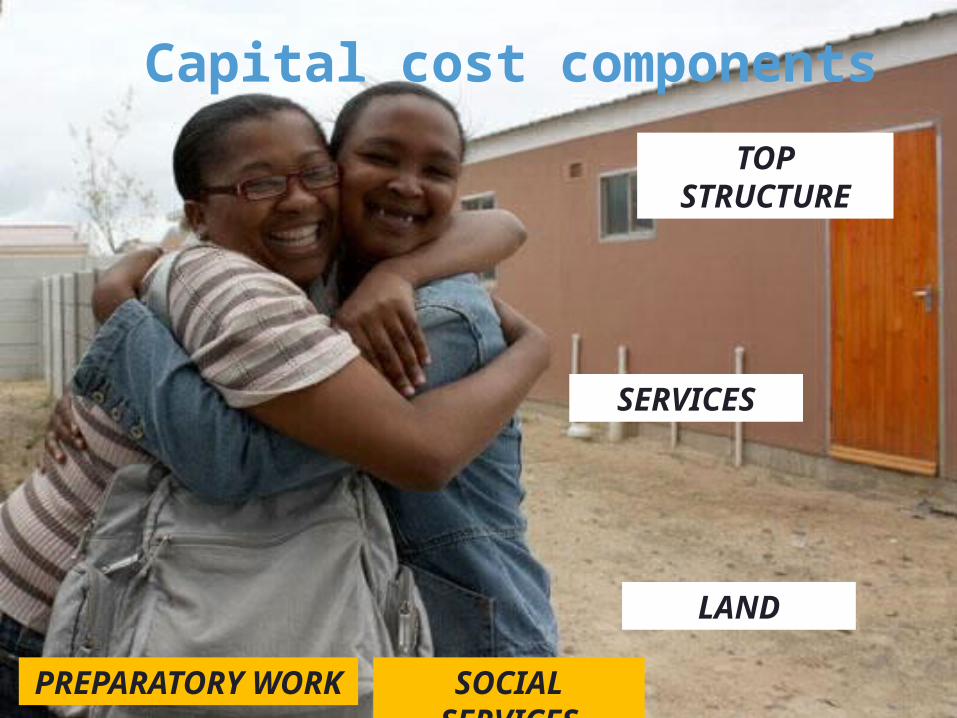
LAND
SOCIAL SERVICESPREPARATORY WORK
SERVICES
TOP STRUCTURE
Capital cost components

14
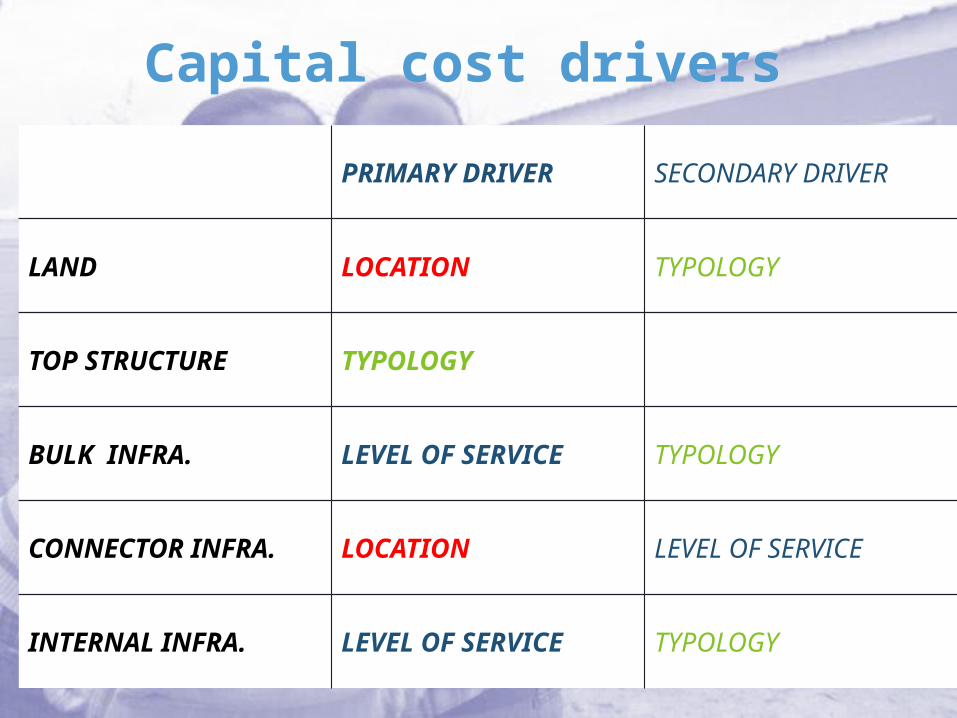
Capital cost drivers
PRIMARY DRIVER SECONDARY DRIVER
LAND LOCATION TYPOLOGY
TOP STRUCTURE TYPOLOGY
BULK INFRA. LEVEL OF SERVICE TYPOLOGY
CONNECTOR INFRA. LOCATION LEVEL OF SERVICE
INTERNAL INFRA. LEVEL OF SERVICE TYPOLOGY
15
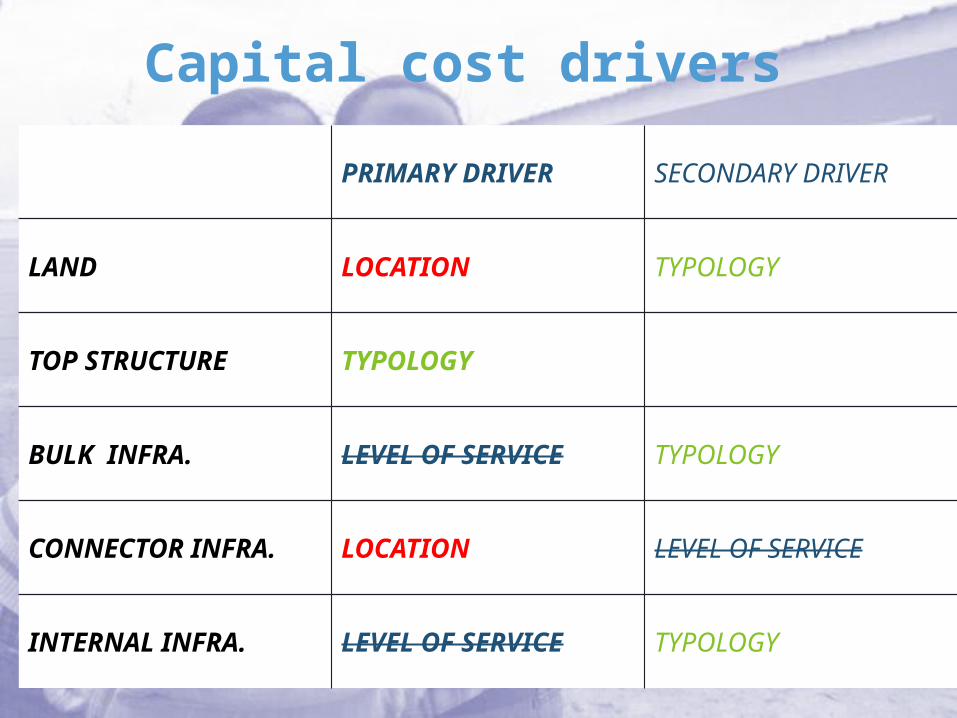
Capital cost drivers
PRIMARY DRIVER SECONDARY DRIVER
LAND LOCATION TYPOLOGY
TOP STRUCTURE TYPOLOGY
BULK INFRA. LEVEL OF SERVICE TYPOLOGY
CONNECTOR INFRA. LOCATION LEVEL OF SERVICE
INTERNAL INFRA. LEVEL OF SERVICE TYPOLOGY
16
Capital cost drivers
PRIMARY DRIVER SECONDARY DRIVER
LAND LOCATION TYPOLOGY
TOP STRUCTURE TYPOLOGY
BULK INFRA. LEVEL OF SERVICE TYPOLOGY
CONNECTOR INFRA. LOCATION LEVEL OF SERVICE
INTERNAL INFRA. LEVEL OF SERVICE TYPOLOGY
17
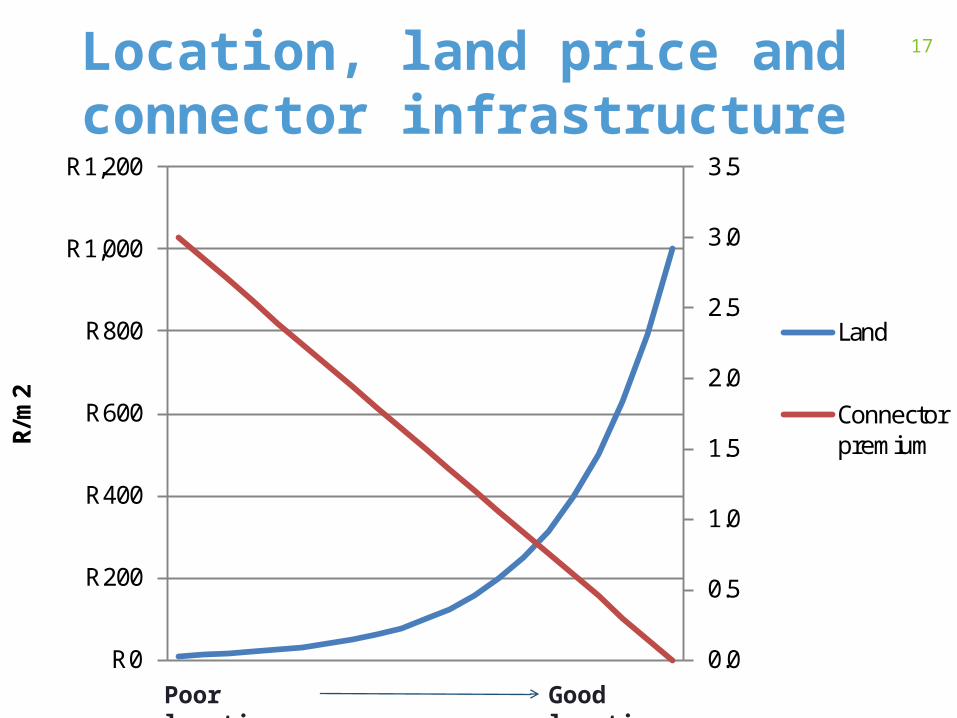
0.0
0.5
1.0
1.5
2.0
2.5
3.0
3.5
R 0
R 200
R 400
R 600
R 800
R 1,000
R 1,200
R/m
2
Land
Connector premium
Poor location Good location
Location, land price and connector infrastructure

18
R 49,868
R 124,742 R 139,981
R 149,062 R 155,687
R 0R 20,000R 40,000R 60,000R 80,000
R 100,000R 120,000R 140,000R 160,000R 180,000
In-situ servicing Semi-detached house
Detached house 3 storey walk-up 5 storey flat
Land Internal infrastructure Connector infrastructure
Bulk infrastructure Top structure
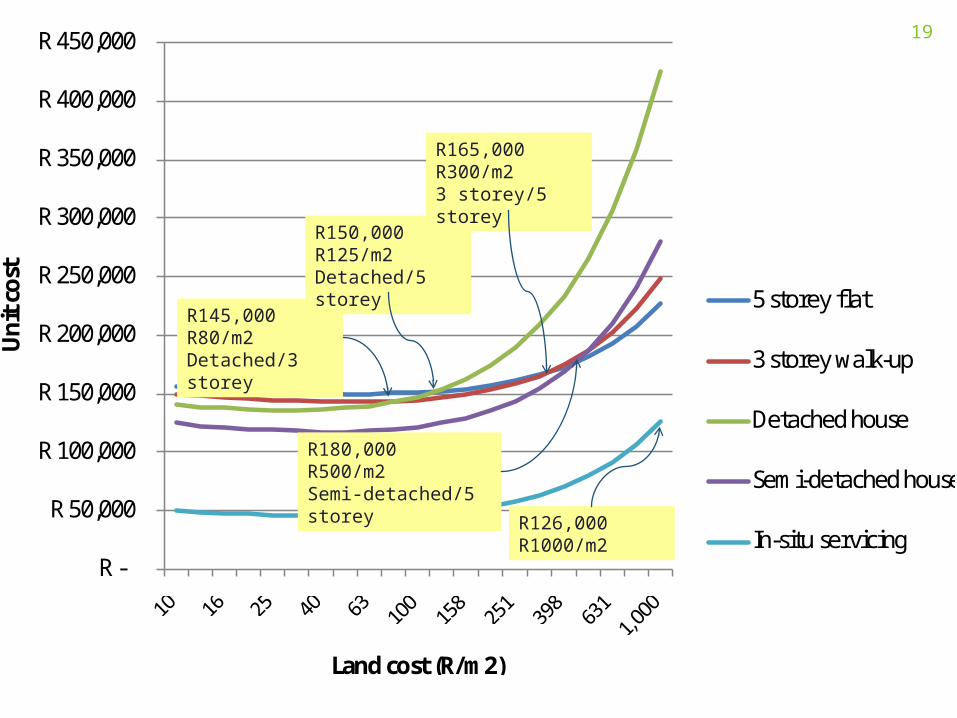
19
R -
R 50,000
R 100,000
R 150,000
R 200,000
R 250,000
R 300,000
R 350,000
R 400,000
R 450,000 Un
it co
st
Land cost (R/m2)
5 storey flat
3 storey walk-up
Detached house
Semi-detached house
In-situ servicing
R145,000R80/m2Detached/3 storey
R150,000R125/m2Detached/5 storey
R165,000R300/m23 storey/5 storey
R180,000R500/m2Semi-detached/5 storey
R126,000R1000/m2

21
-2,000 4,000 6,000 8,000
10,000 12,000 14,000
Hous
ehol
ds City
Stat
e
Hous
ehol
ds City
Stat
e
Hous
ehol
ds City
Stat
e
Land and housing
Infrastructure Total
R m
illio
n
Capital cost of development over 10 years
2020 - Urban sprawl
2020 - Compact city
22
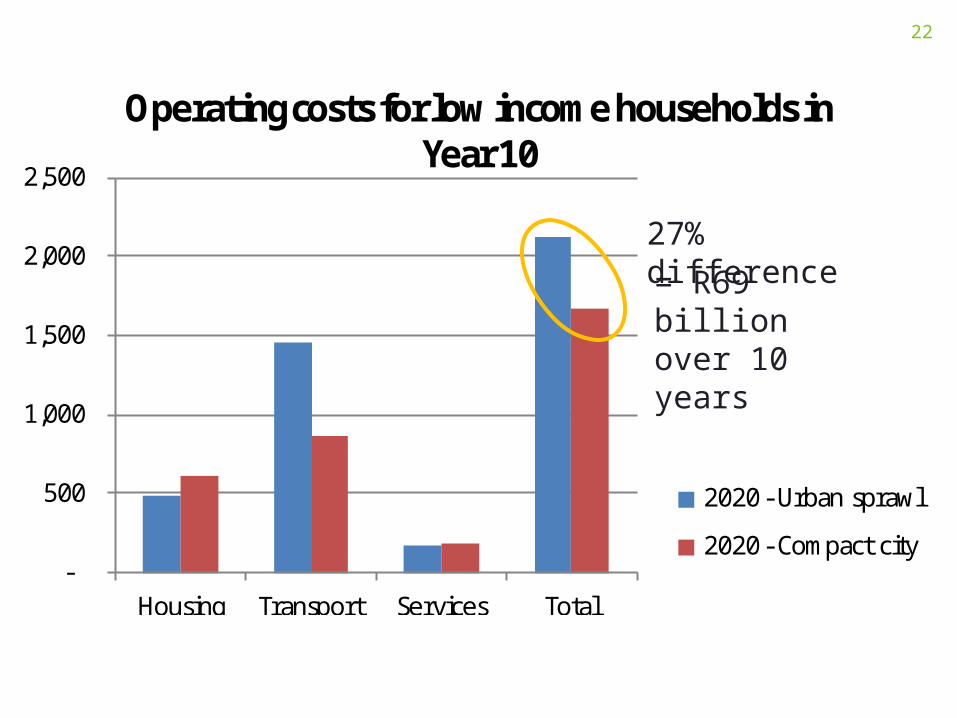
-
500
1,000
1,500
2,000
2,500
Housing Transport Services Total
Operating costs for low income households in Year 10
2020 - Urban sprawl
2020 - Compact city
27% difference= R69 billion over 10 years
23
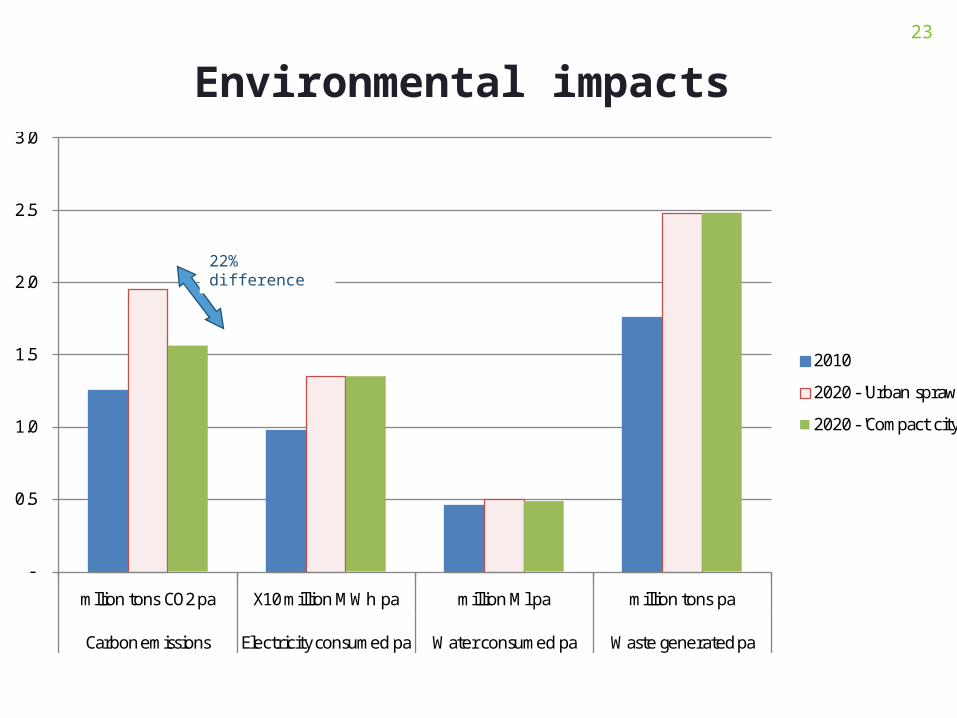
Environmental impacts
-
0.5
1.0
1.5
2.0
2.5
3.0
mllion tons CO2 pa X10 million MWh pa million Ml pa million tons pa
Carbon emissions Electricity consumed pa Water consumed pa Waste generated pa
2010
2020 - 'Urban sprawl'
2020 - 'Compact city'
22% difference
24 of 18
Learning There is no apparent capital financial
incentive for the City or State to densify Capital costs are strongly driven by top
structure costs and land costs, not by infrastructure costs
Short-term capital decisions outweigh longer term operating cost savings
The majority of the costs of urban sprawl and potential benefits of a compact city, are borne by households and the environment, and not by developers, the City or the State.