
October 28, 2010SOFTBANK CORP.
Earnings Resultsfor the Six-month Period
Ended September 30, 2010(April to September 2010)
November 12, 2010 Version
DisclaimerThis material was prepared based on information available and views held at the time it was made. Statements in this material that are not historical facts, including, without limitation, plans, forecasts and strategies are “forward-looking statements”.
Forward-looking statements are by their nature subject to various risks and uncertainties, including, without limitation, a decline in general economic conditions, general market conditions, technological developments, changes in customer demand for products and services, increased competition, risks associated with international operations, and other important factors, each of which may cause actual results and future developments to differ materially from those expressed or implied in any forward-looking statement. With the passage of time, information in this material (including, without limitation, forward-looking statements) could be superseded or cease to be accurate.
SOFTBANK CORP. disclaims any obligation or responsibility to update, revise or supplement any forward-looking statement or other information in any material or generally to any extent. Use of or reliance on the information in this material is at your own risk.
Information contained herein regarding companies other than SOFTBANK CORP. and other companies of the SOFTBANK Group is quoted from public sources and others. SOFTBANK CORP. has neither verified nor is responsible for the accuracy of such information.
*Please refer to the last page for details relating to the application of new accounting standards, definition of terms, trademarks and registered trademarks used in this material.
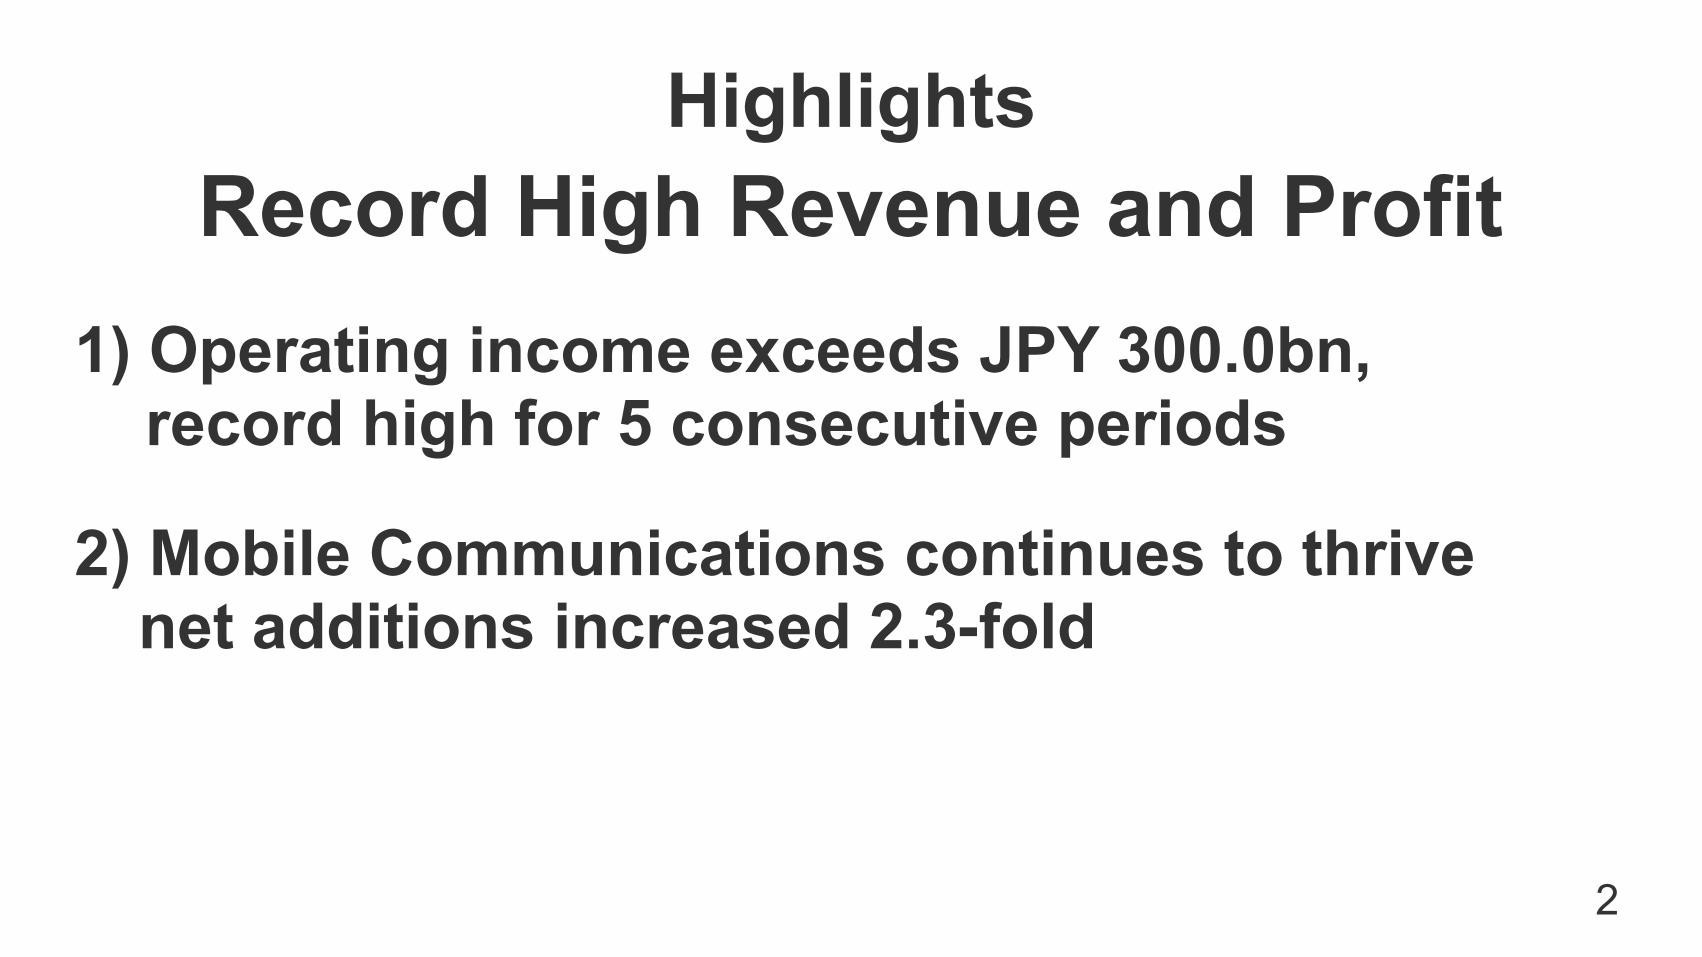
1) Operating income exceeds JPY 300.0bn, record high for 5 consecutive periods
2) Mobile Communications continues to thrive net additions increased 2.3-fold
2
Record High Revenue and ProfitHighlights

Consolidated Earnings Results
3
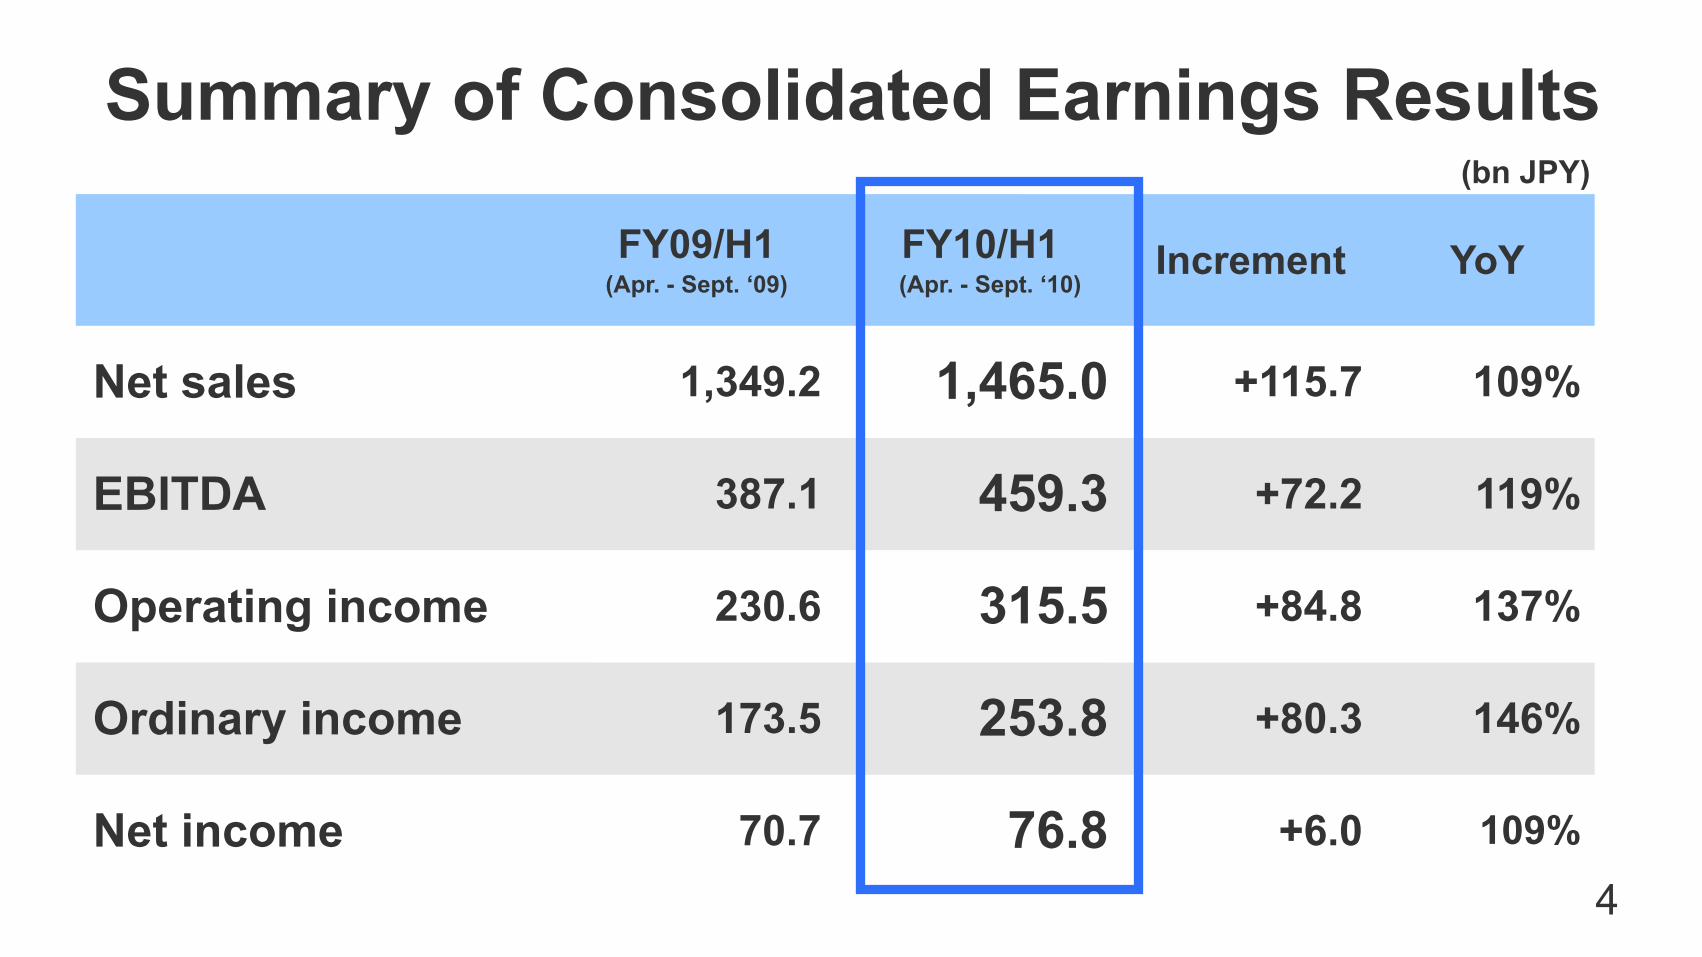
Summary of Consolidated Earnings Results
FY09/H1(Apr. - Sept. ‘09)
FY10/H1 (Apr. - Sept. ‘10)
Increment YoY
Net sales 1,349.2 1,465.0 +115.7 109%
EBITDA 387.1 459.3 +72.2 119%
Operating income 230.6 315.5 +84.8 137%
Ordinary income 173.5 253.8 +80.3 146%
Net income 70.7 76.8 +6.0 109%
(bn JPY)
4

Consolidated net sales
Consolidated operating income
(YoY)
(YoY)
(4.6)+115.7
+84.8
Revenue and profit increase
Competitors’ Comparison (FY10/H1 YoY)
NTT DOCOMOKDDI
(bn JPY)
5Revenue and profit
decrease*Created by SOFTBANK CORP. based on respective companies’ publicly available information.
(3.1) 46.2
(7.6)
Revenue decrease and profit increase
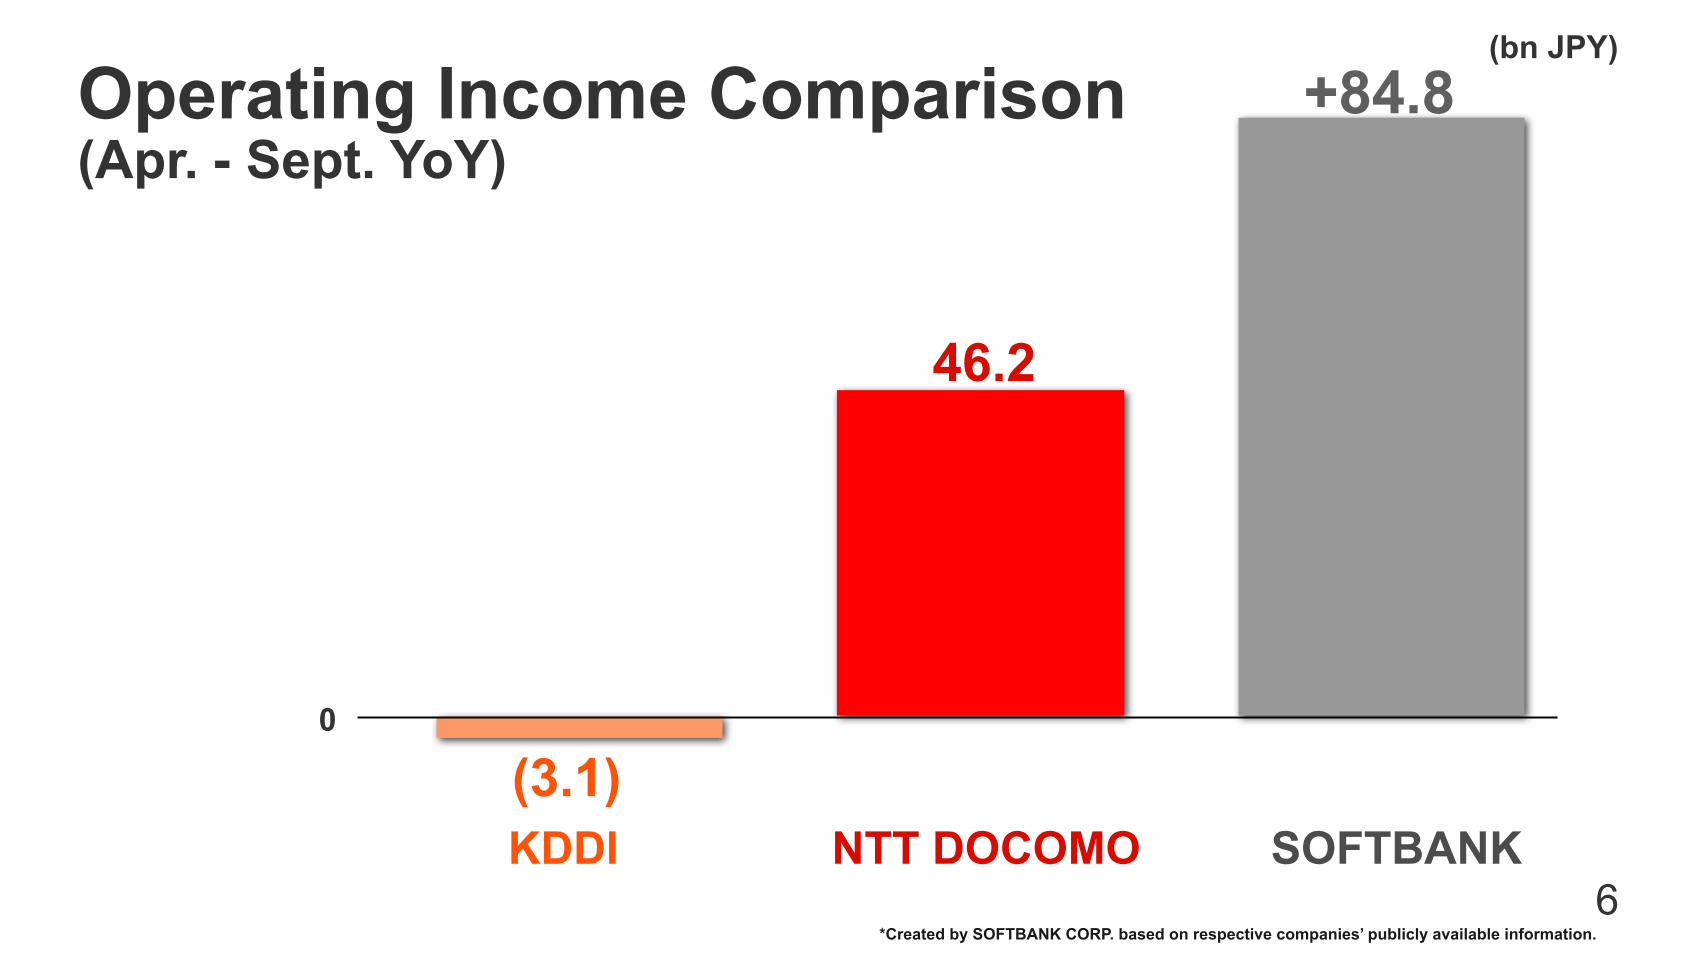
Operating Income Comparison +84.8
(3.1)
(bn JPY)
0
SOFTBANKKDDI NTT DOCOMO*Created by SOFTBANK CORP. based on respective companies’ publicly available information.
6
(Apr. - Sept. YoY)
46.2
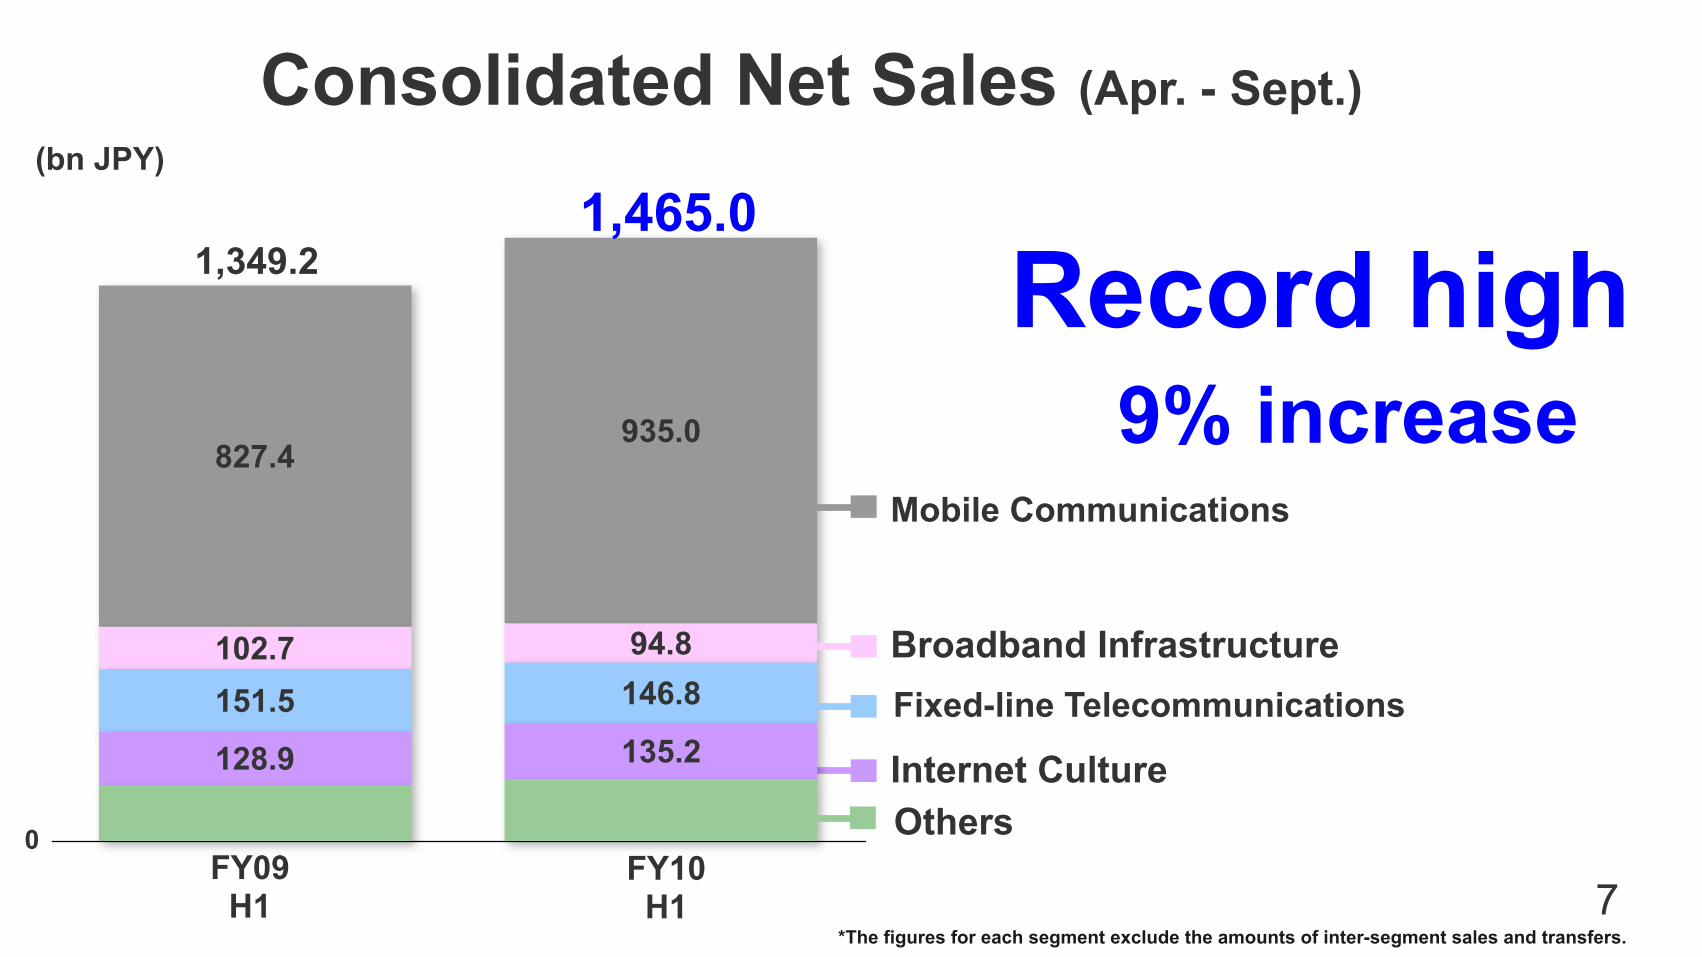
935.0827.4
94.8102.7146.8151.5135.2128.9
Mobile Communications
Broadband InfrastructureFixed-line Telecommunications
Internet Culture
FY09H1
Consolidated Net Sales (Apr. - Sept.)
1,349.21,465.0
(bn JPY)
FY10H1
0
Record high9% increase
Others
7*The figures for each segment exclude the amounts of inter-segment sales and transfers.
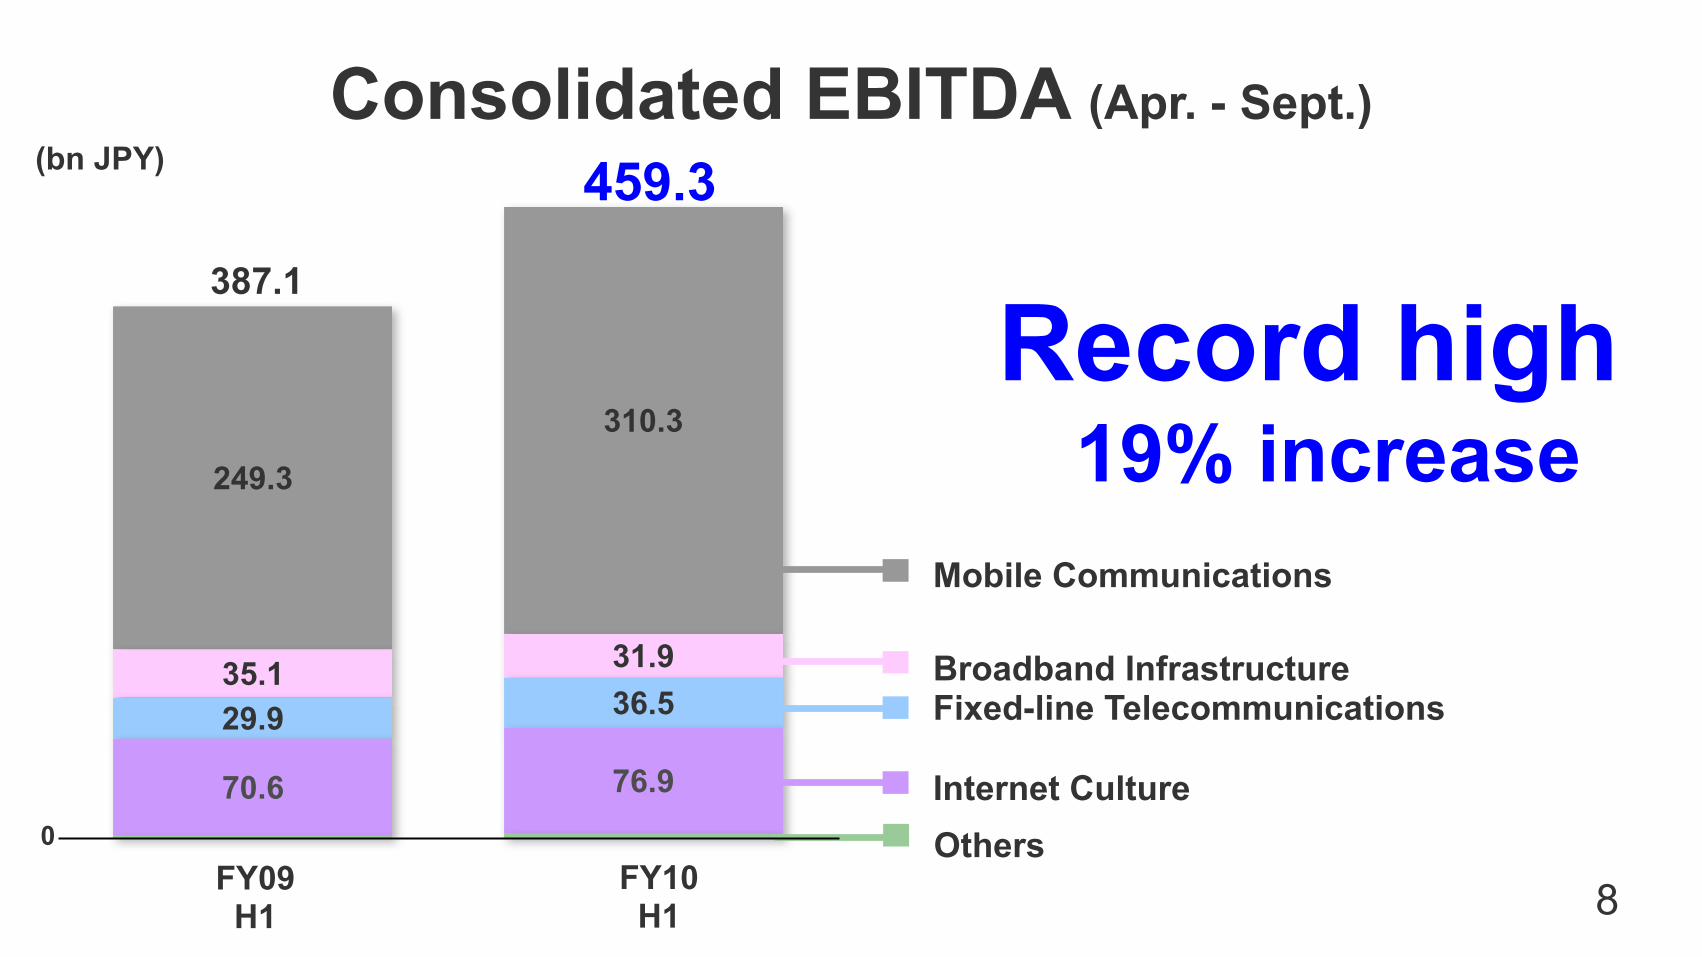
310.3
249.3
31.935.136.529.9
76.970.6
Mobile Communications
Broadband InfrastructureFixed-line Telecommunications
Internet Culture0
(bn JPY)
FY09H1
FY10H1
387.1
459.3
Record high
Consolidated EBITDA (Apr. - Sept.)
Others
19% increase
8

(bn JPY)
0
459.3Consolidated EBITDA (Apr. - Sept.)
03H1
(FY)04H1
05H1
06H1
07H1
08H1
09H1
10H1
12.050.2
228.4
314.2335.5
387.1
-23.6
19% increase
Record high for 7 consecutive
periods
9

207.2
131.7
22.727.0 13.67.8
71.664.9
Mobile Communications
Broadband InfrastructureFixed-line Telecommunications
Internet Culture
0
(bn JPY)
FY09H1
FY10H1
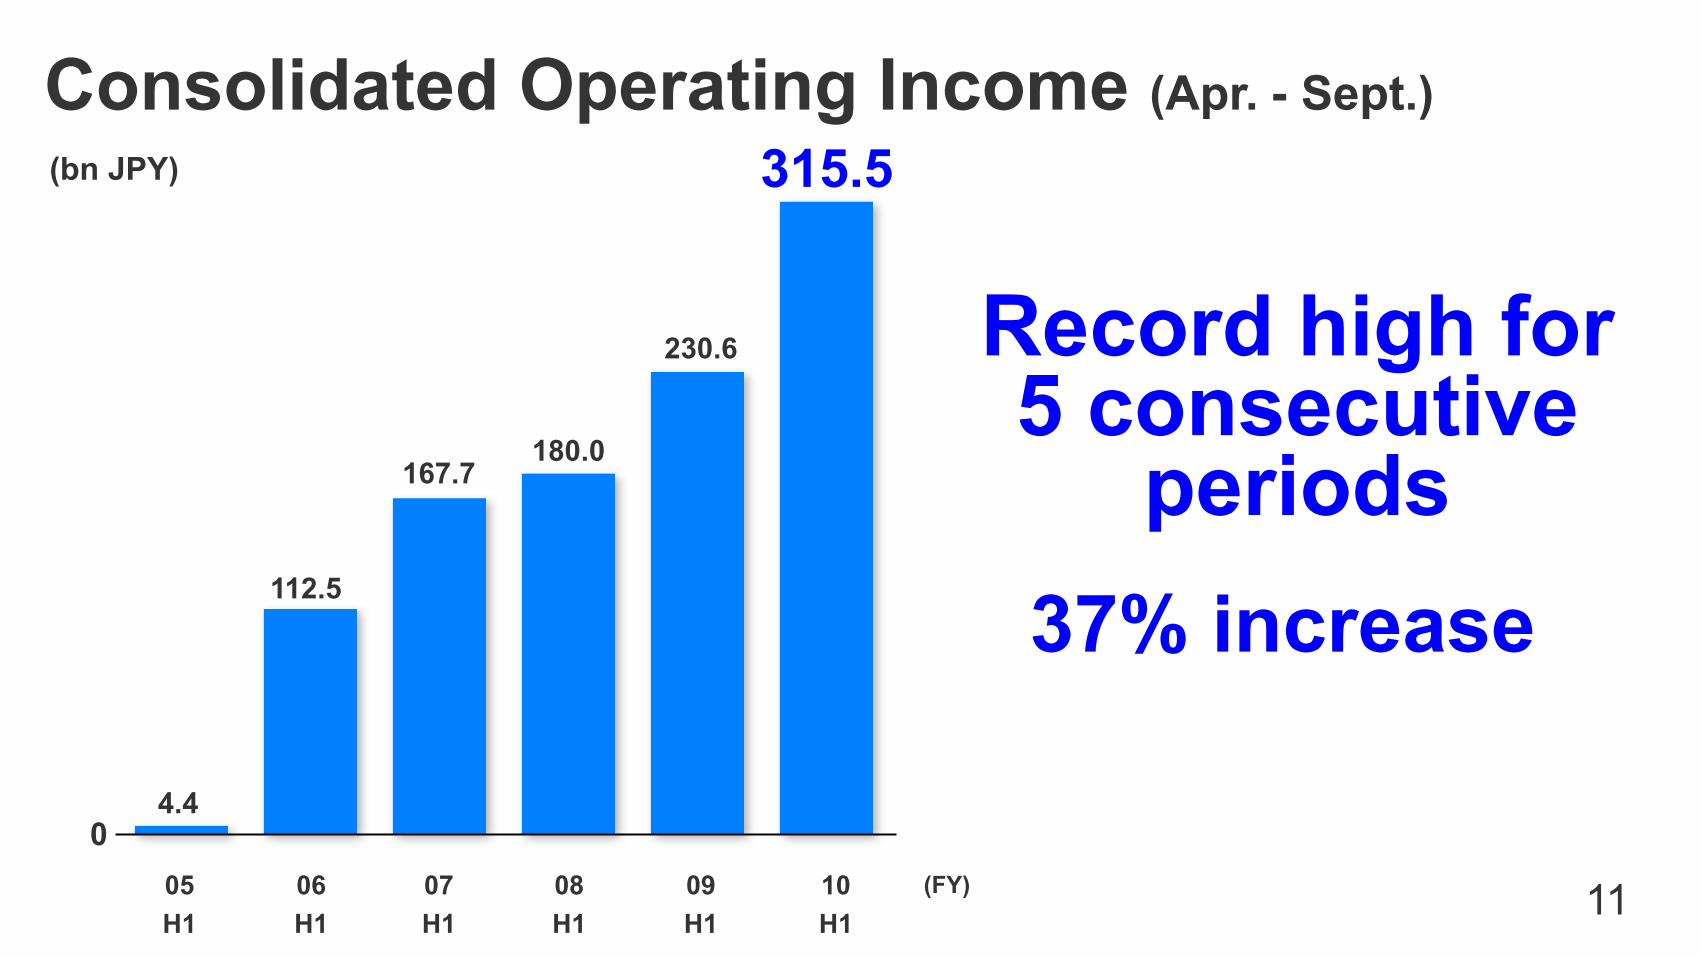
315.5
230.6
Consolidated Operating Income (Apr. - Sept.)
Record high
Others
37% increase
10
(bn JPY)
0
315.5
(FY)05H1
06H1
07H1
08H1
09H1
10H1
112.5
167.7180.0
230.6
4.4
37% increase
Record high for5 consecutive
periods
11
Consolidated Operating Income (Apr. - Sept.)

Record high for5 consecutive
periods
(bn JPY)
0
253.8Consolidated Ordinary Income (Apr. - Sept.)
(FY)05H1
06H1
07H1
08H1
09H1
10H1
111.1 117.3
173.5
62.6
-13.4
46% increase
12

Consolidated Ordinary Income/Net Income(億円)FY09/H1
(Apr. - Sept. ‘09)FY10/H1
(Apr. - Sept. ‘10)Notes
Ordinary income 173.5 253.8Special income/loss (net) 3.2 (7.3)Income before income taxes and minority interests 176.8 246.5
Income tax: Current 48.8 95.7
Income tax: Correction - 26.4
Income tax: Deferred 34.7 18.5Net income before minority interests adjustment - 105.8
Minority interests 22.5 29.0Net income 70.7 76.8 13
Asset retirement obligations, etc.
Yahoo Japan
SOFTBANK MOBILE etc.
Yahoo Japan etc.
(bn JPY)

(bn JPY)
0
Consolidated Net Income (Apr. - Sept.)
(FY)09H1
10H1
14
70.776.8
08H1
41.1
9% increase
Record high for2 consecutive
periods

(bn JPY)
0(FY)
15
76.841.1
Impact of correction and ruling notice received by Yahoo Japan JPY 24.7bn
70.7
09H1
10H1
08H1
9% increase
Record high for2 consecutive
periods
Consolidated Net Income (Apr. - Sept.)

16
Financial Status

17
Consolidated Operating Cash Flow (Apr. - Sept.)
177.2
315.3
08H1
09H1
10H1
349.3
(FY)
(bn JPY)
0.4
07H1
Record high for2 consecutive
periods11% increase
0

18
177.2
08H1
09H1
10H1
(FY)
(bn JPY)
0.4
07H1
Consolidated Operating Cash Flow (Apr. - Sept.)
Record high for2 consecutive
periods11% increase
315.3
0
Impact of correction and ruling notice received by Yahoo Japan JPY 26.4bn
349.3

19
Consolidated CAPEX
2006 2007 2008 2009
(bn JPY) 400.0
0(FY)
Mobile Communications
Broadband InfrastructureFixed-line TelecommunicationsInternet Culture
2010*Acceptance basis, including CAPEX through finance leases.
314.8
25.1
44.9
(Plan)
No change in annual plan
389.8
293.7
259.0
222.9

20
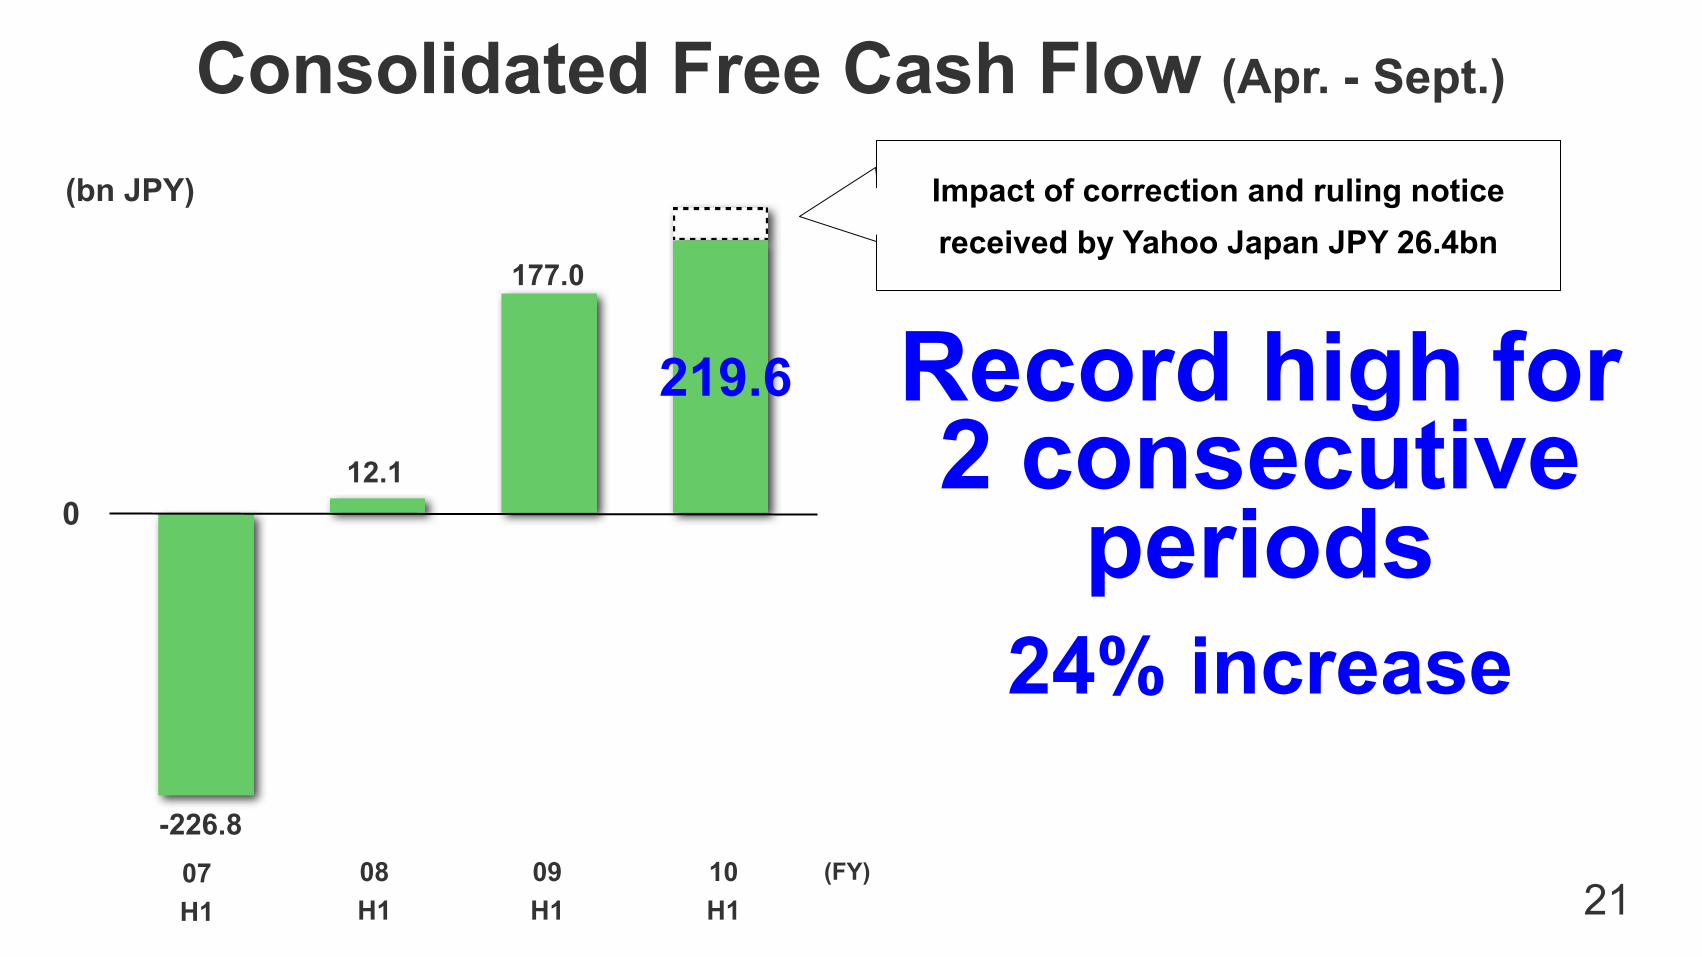
Consolidated Free Cash Flow (Apr. - Sept.)
12.1
-226.8
219.6
(FY)
(bn JPY)
08H1
09H1
10H1
07H1
177.0
0
Record high for2 consecutive
periods24% increase
21
-226.8(FY)
(bn JPY)
08H1
09H1
10H1
07H1
24% increase
Record high for2 consecutive
periods
Consolidated Free Cash Flow (Apr. - Sept.)
219.6
177.0
12.10
Impact of correction and ruling notice received by Yahoo Japan JPY 26.4bn

22
Since acquisition of Vodafone K.K.
Reduced by
approx. JPY 930.0bn
Net Interest-bearing Debt Comparison to Peak Level
1,455.0
2,387.0
2006June
(bn JPY)
2010Sept.

0
2,000
4,000
6,000
8,000
10,000
12,000
14,000
SBM Loan Balance
2008 2009 2010 2011 2012 2013 2014 2015 2016 2017 2018 (CY)
1.366t JPY
(Oct. 2010)
Minimumcase
(t JPY)
Reduced by approx. JPY 590.0bnJPY 780.0bn
23
1.0
0.5
0Inception of borrowings(Nov. 2006)

24
Commitment to Reduce Net Interest-bearing Debt Remains Unchanged
June2006
FY11(target)
FY14(target)
FY080
Zero
1.9t
2.4t
1.45t
Sept.2010
*Refers to half of the end of FY08 level.
Half
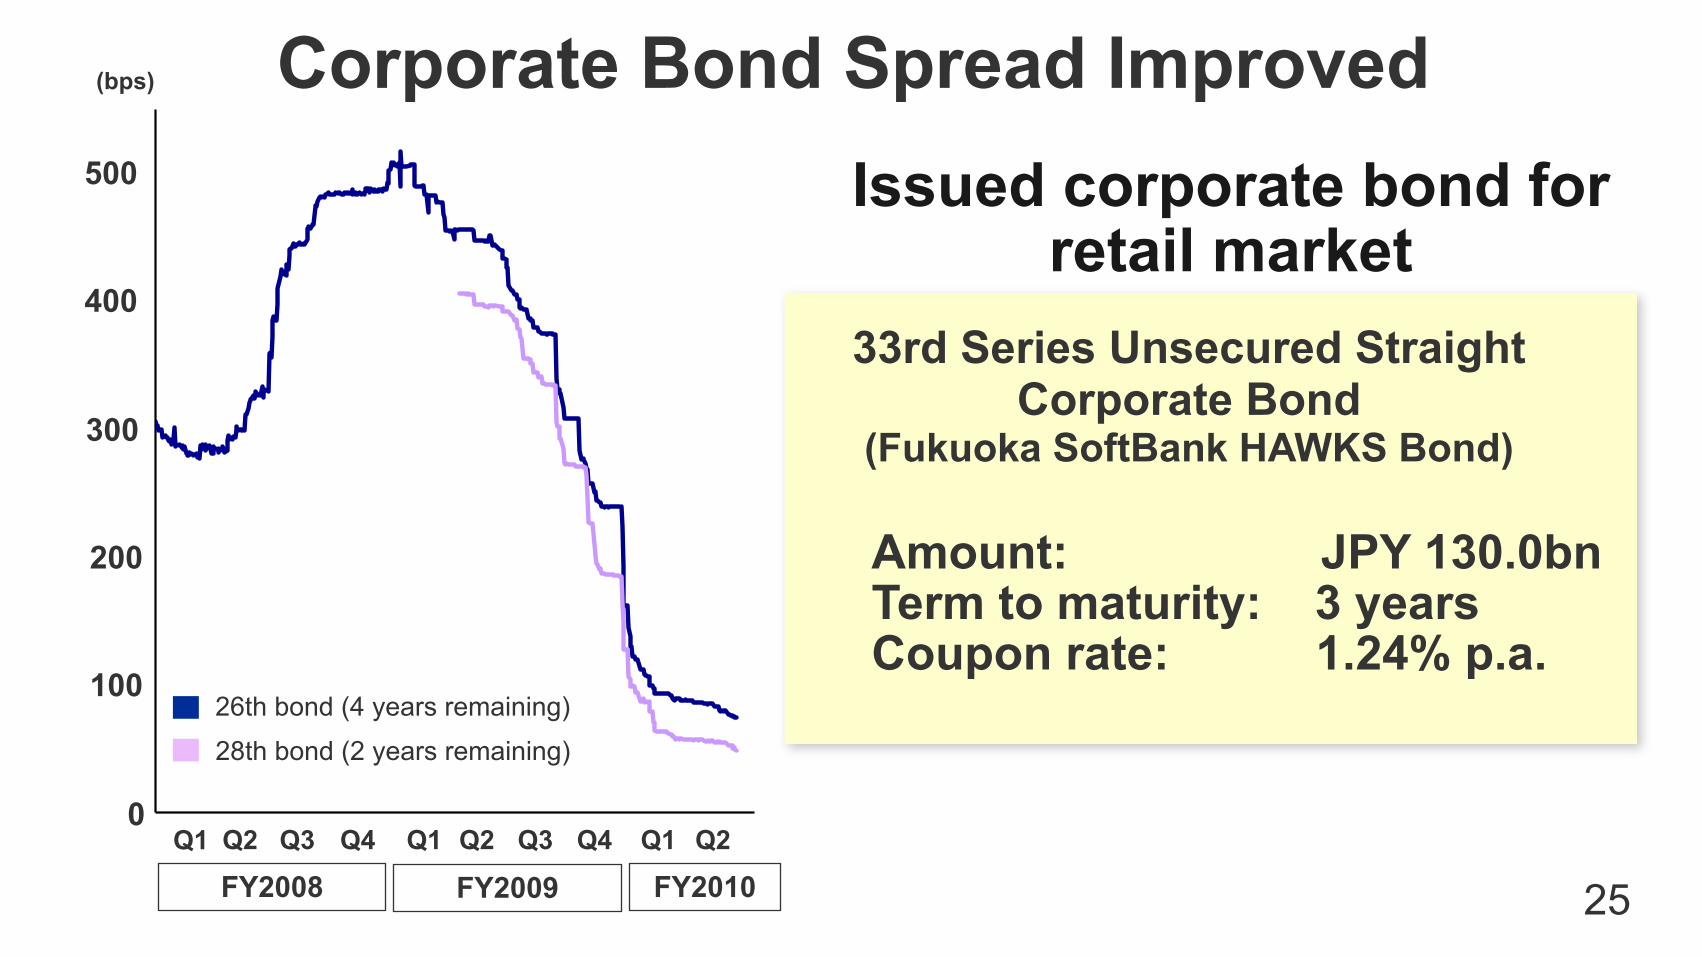
Corporate Bond Spread Improved
25
Issued corporate bond for retail market
(bps)
0
100
200
300
400
500 08/4/1
08/7/1
08/10/1
09/1/1
09/4/1
09/7/1
09/10/1
10/1/1
10/4/1
10/7/1
10/10/1
26回債(残存4年)
28回債(残存2年)
Q2Q1 Q3 Q4 Q1 Q3 Q4 Q1
FY2008 FY2009Q2 Q2
FY2010
26th bond (4 years remaining)
28th bond (2 years remaining)
200
100
0
300
400
500
Amount: JPY 130.0bnTerm to maturity: 3 yearsCoupon rate: 1.24% p.a.
33rd Series Unsecured Straight Corporate Bond
(Fukuoka SoftBank HAWKS Bond)

MobileCommunications
Business
26
27
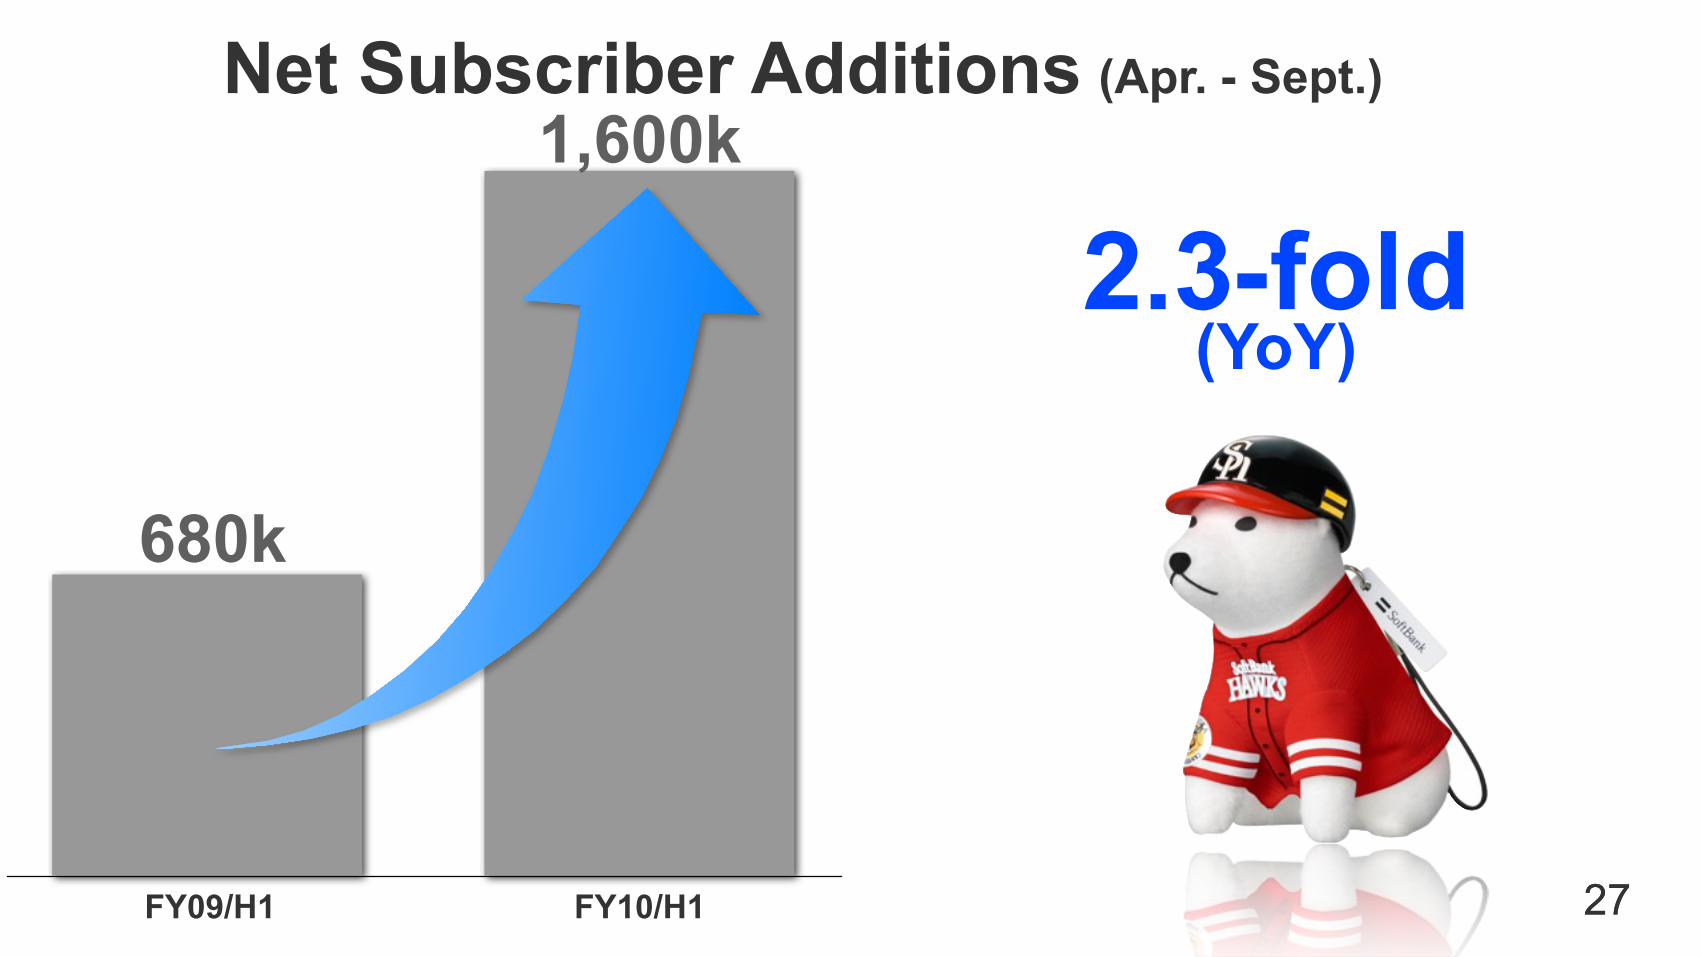
Net Subscriber Additions (Apr. - Sept.)1,600k
680k
FY09/H1 FY10/H1
2.3-fold(YoY)
27

0
50
100
150
200
250
300
350
Apr. May June July Aug. Sept. 28
FY2009
(k)
3-fold(Sept. YoY)
Monthly Net Adds
FY2010330k
110k
29
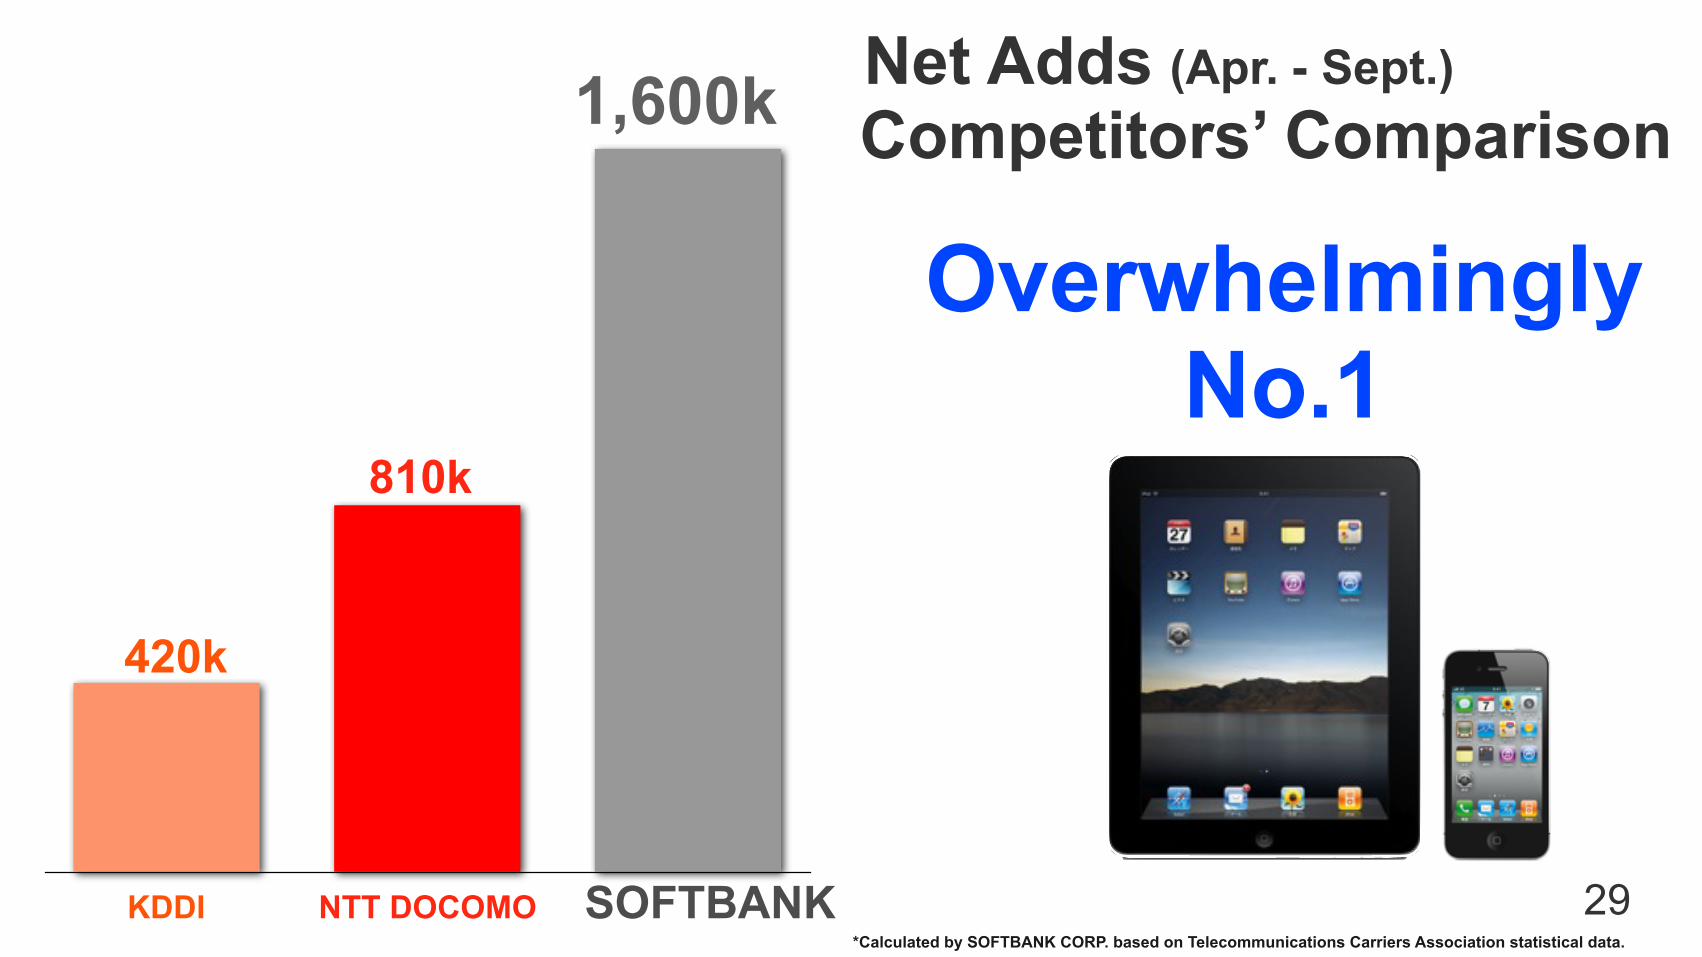
Net Adds (Apr. - Sept.)1,600k
420k
810k
NTT DOCOMOKDDI
Overwhelmingly No.1
SOFTBANK*Calculated by SOFTBANK CORP. based on Telecommunications Carriers Association statistical data.
Competitors’ Comparison

30
Churn Rate
0.96%
(%)
FY07 FY08 FY09 FY10
Improvement
*Churn rate: includes the number of prepaid mobile phones and communication module subscribers.
1
2
Q1 Q2 Q3 Q4 Q1 Q2 Q3 Q4 Q1 Q2 Q3 Q4 Q1 Q2
Termination of 2G
31
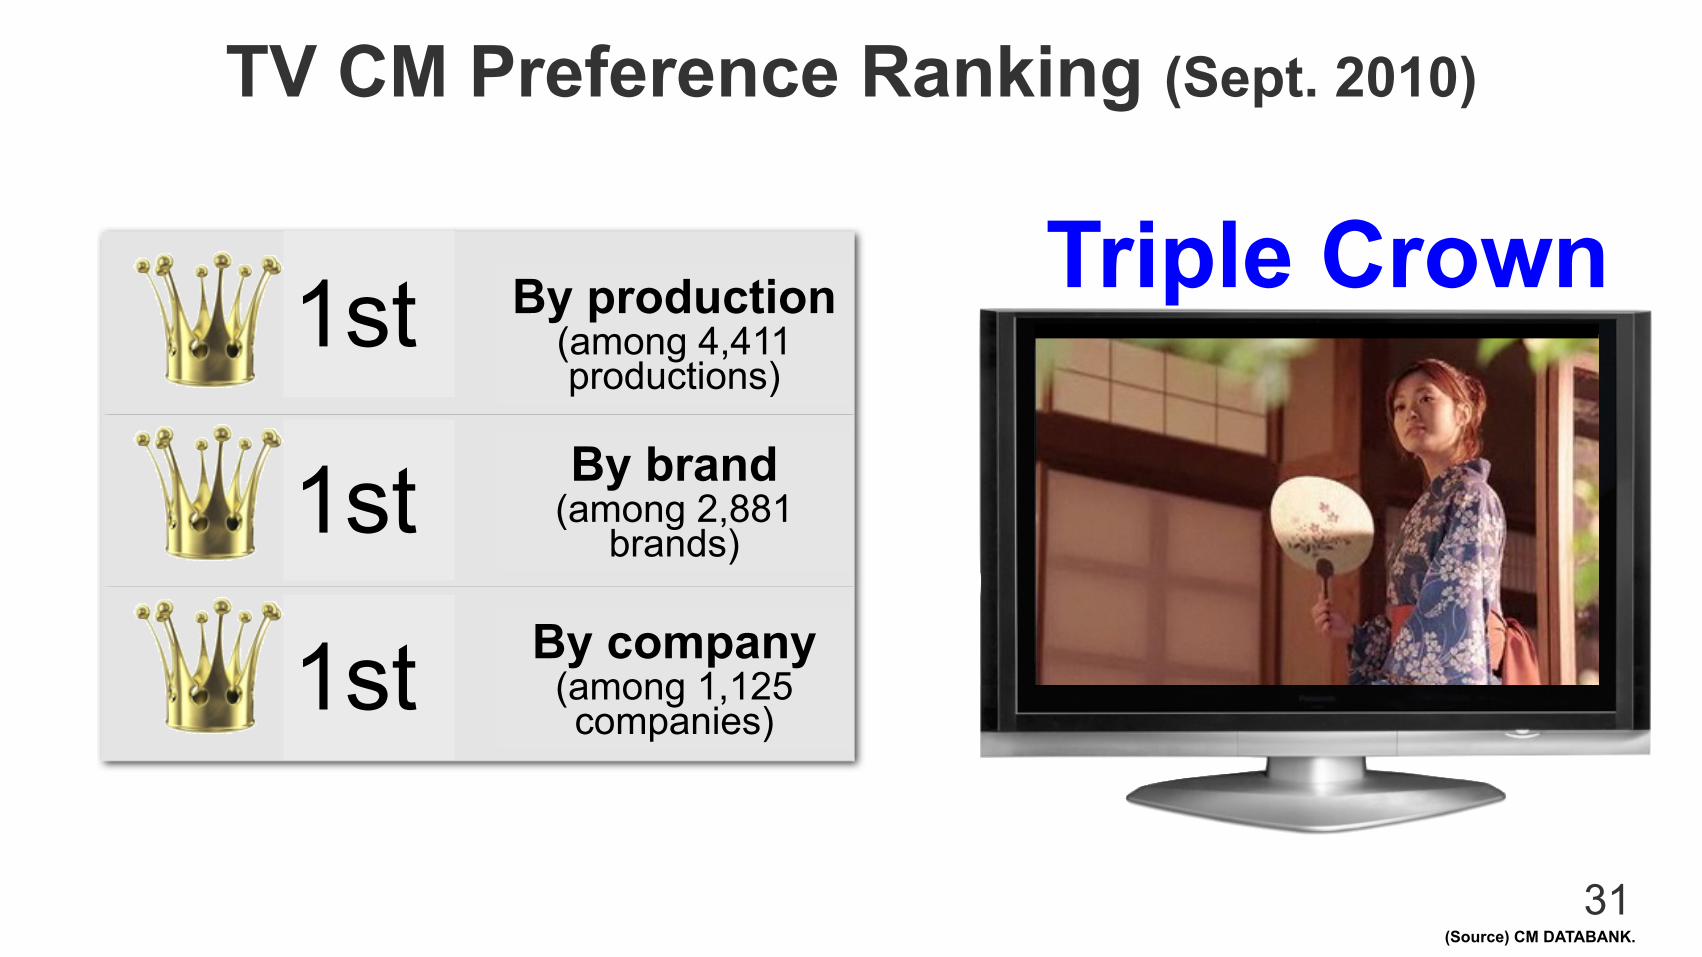
TV CM Preference Ranking (Sept. 2010)
Triple Crown1st
1st
1st By company(among 1,125 companies)
By brand(among 2,881
brands)
By production(among 4,411 productions)
(Source) CM DATABANK.

32
TV CM Came From TwitterAyumi Hamasaki x Jiro Shirato
Let’s do it. RT @xxxxxxxxWant to see that!!! !!! RT@ayu_19980408 Hello, my name is Ayumi Hamasaki. Mr. Son! I want to be on TV CM with Father Dog!
*Original text in Japanese, translated for reference only.

33
TV CM

34
NTT DOCOMOKDDI
SOFTBANK
ARPU
Turnaround
07Q2
08Q2
09Q2
10Q2
60
70
80
90
100 (Indexed at FY07/Q2 = 100)
(FY)
*Created by SOFTBANK CORP. based on respective companies’ publicly available information.

35
SOFTBANK
Data ARPU
Overwhelming increase
*Created by SOFTBANK CORP. based on respective companies’ publicly available information.
NTT DOCOMO
KDDI
(Indexed at FY07/Q2 = 100)
100
120
140
160
07Q2
08Q2
09Q2
10Q2
(FY)

36
207.2
131.7
009H1
88.194.2
56.6
10H1
08H1
06H1
07H1
131.1122.5
87.4
43.5
05H1
04H1
03H1
02H1
Mobile Communications Business Operating Income
Vodafone SoftBank(bn JPY)
(FY)
Increase
37
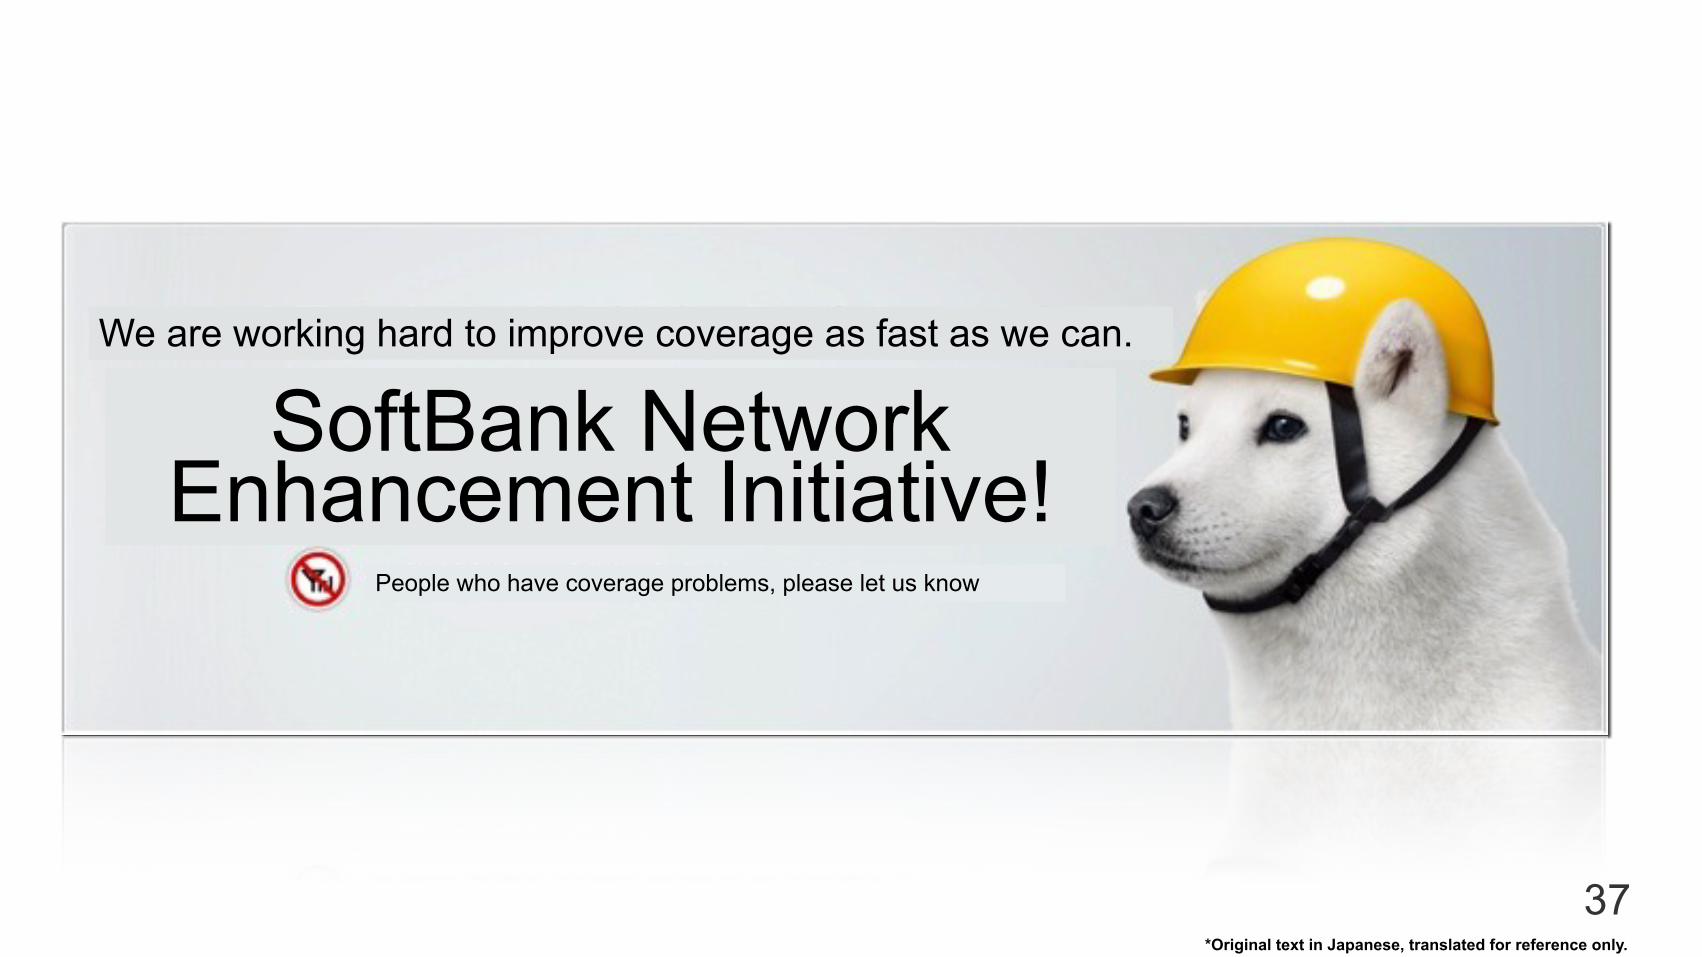
SoftBank Network Enhancement Initiative!
People who have coverage problems, please let us know
We are working hard to improve coverage as fast as we can.
*Original text in Japanese, translated for reference only.

38
Progress on Plan to Double the Number of Mobile Phone Base Stations
0
Progressas scheduled
Mar.2011
Mar.2010
Approx. 60k
Approx. 120k
30kSites finalized
100k
(plan)
70k
Sept.2010
39
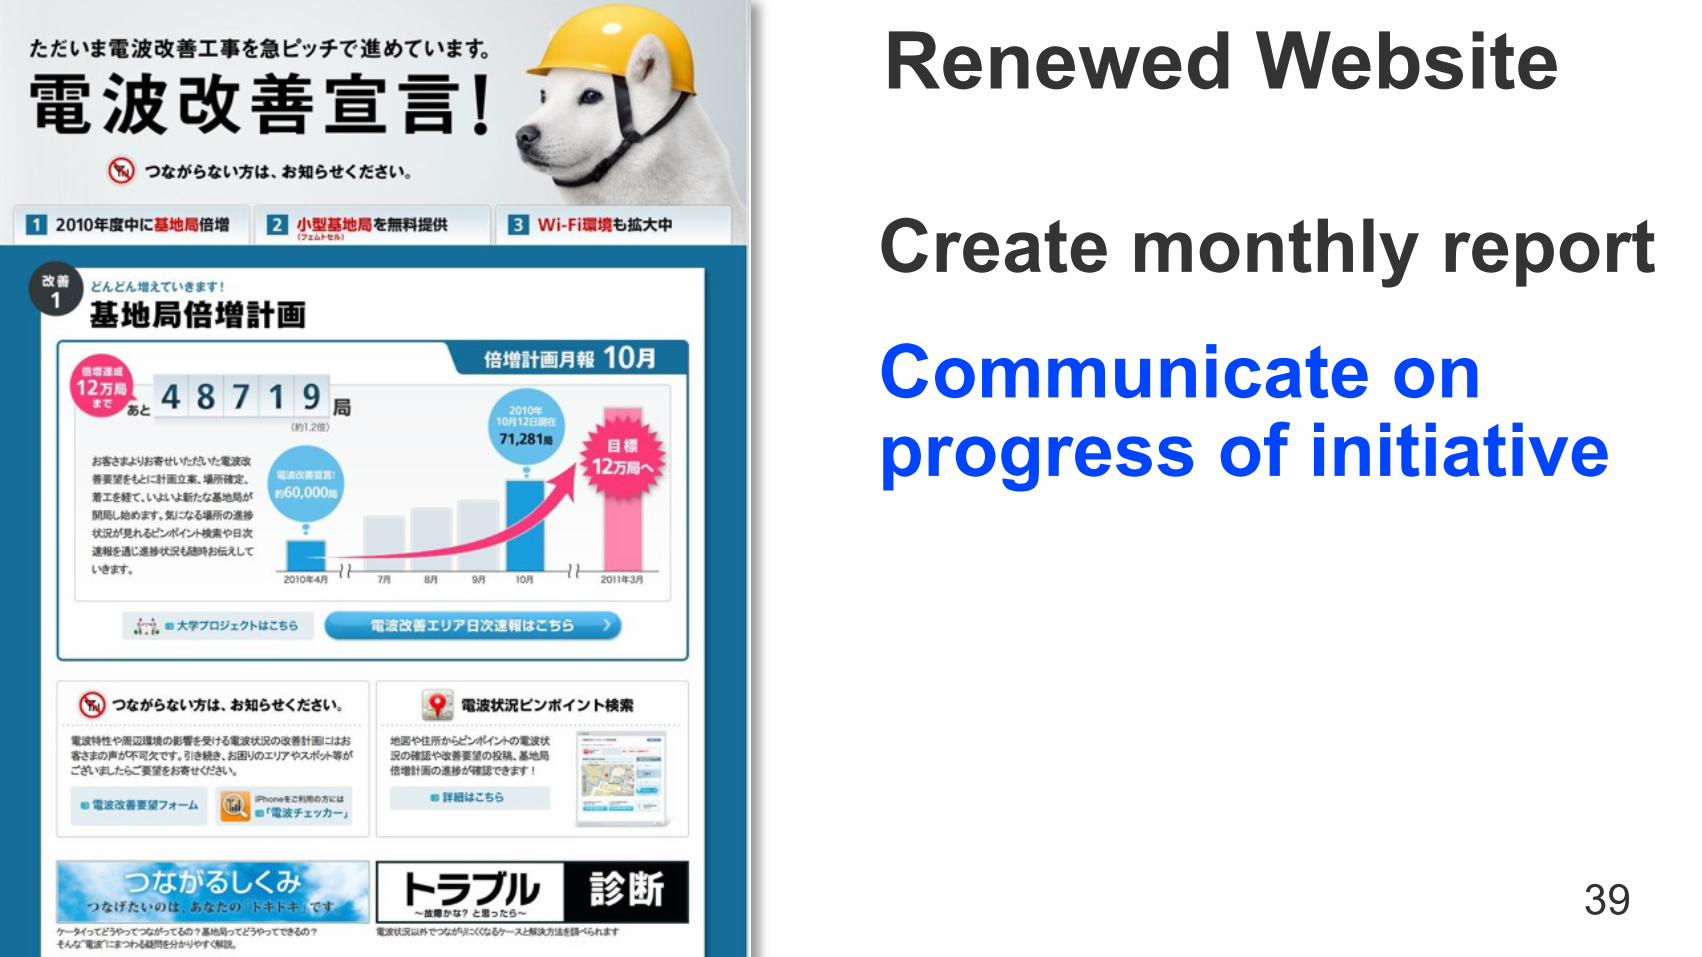
Renewed Website
Communicate on progress of initiative
Create monthly report
40
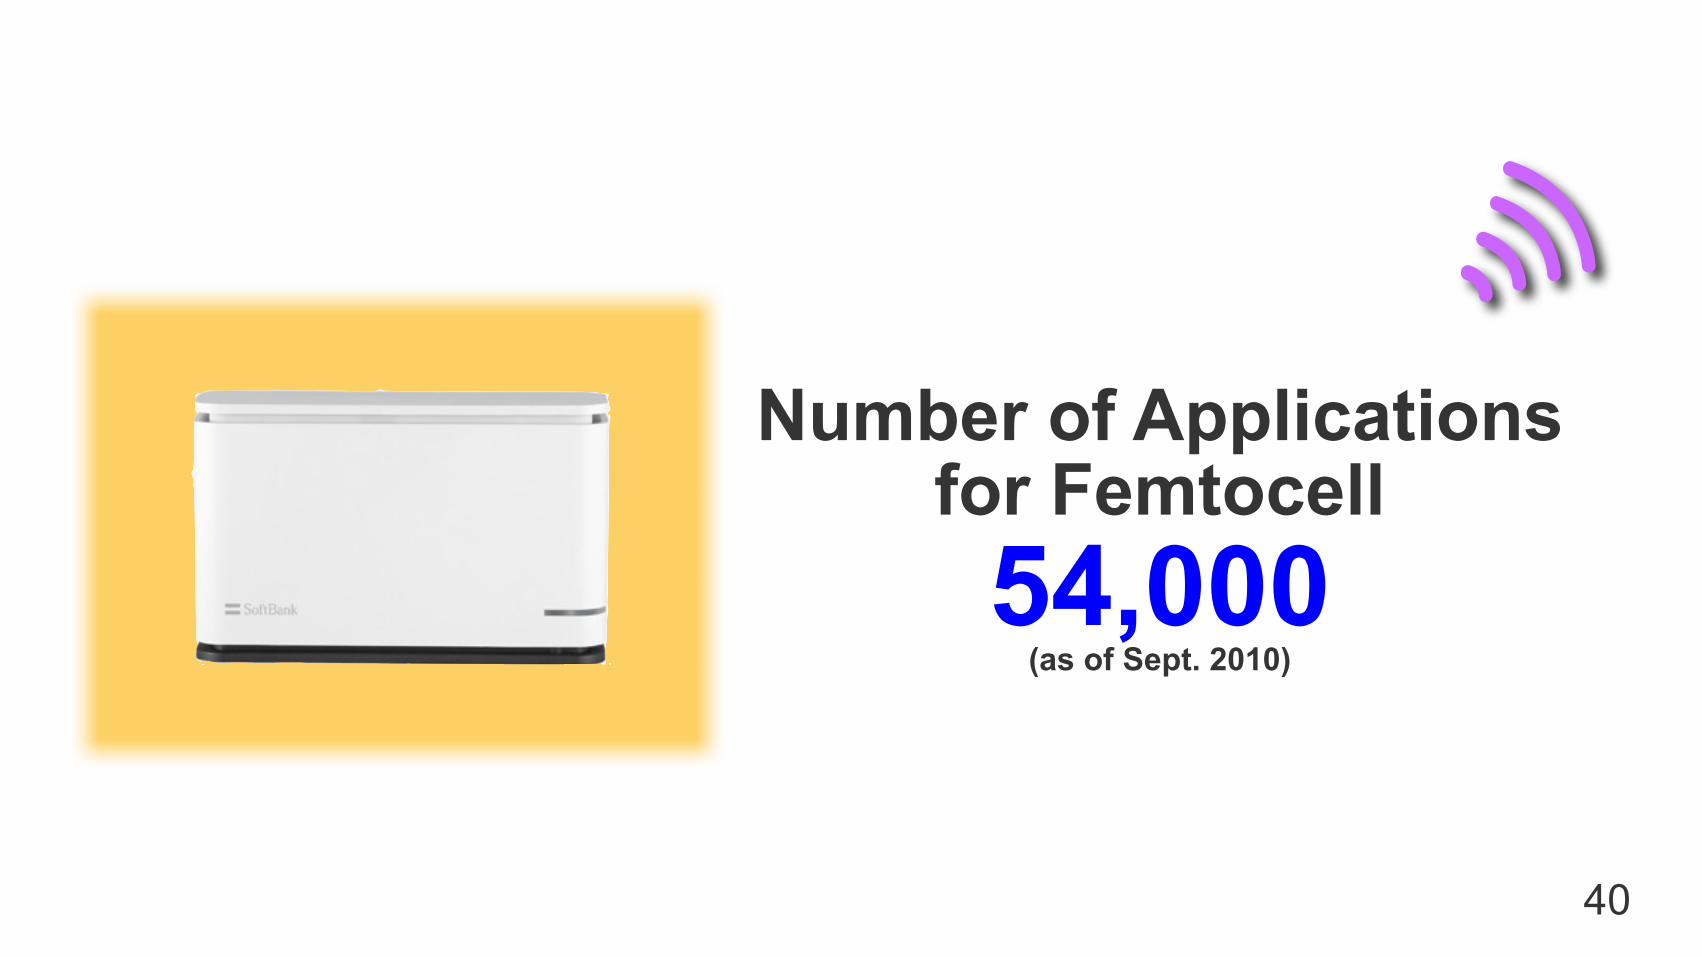
Number of Applications for Femtocell54,000
(as of Sept. 2010)

41
92%Improved
8%No change
Coverage After Installing Femtocell
*Survey conducted by 1,276 users whose femtocell is activated.

1 Rehabilitation plan expected to be approved in November 2010
2 Accelerate initiative to double the number of mobile phone base stations
42
WILLCOM Joins the SOFTBANK Group
43
ARPU positive turnaround
Net adds: overwhelmingly No.1
Revenue and profit increase to reach record high
Summary of FY2010/H1

44
Question

45
Will SOFTBANK keep winning?

46
Let’s do it.

47
Towards No. 1 Mobile Internet Company

Equation Towards Victory
48

Conventional terminal
PC
49
Smartphone SoftBankSmartpad
Competitors
Equation Towards Victory
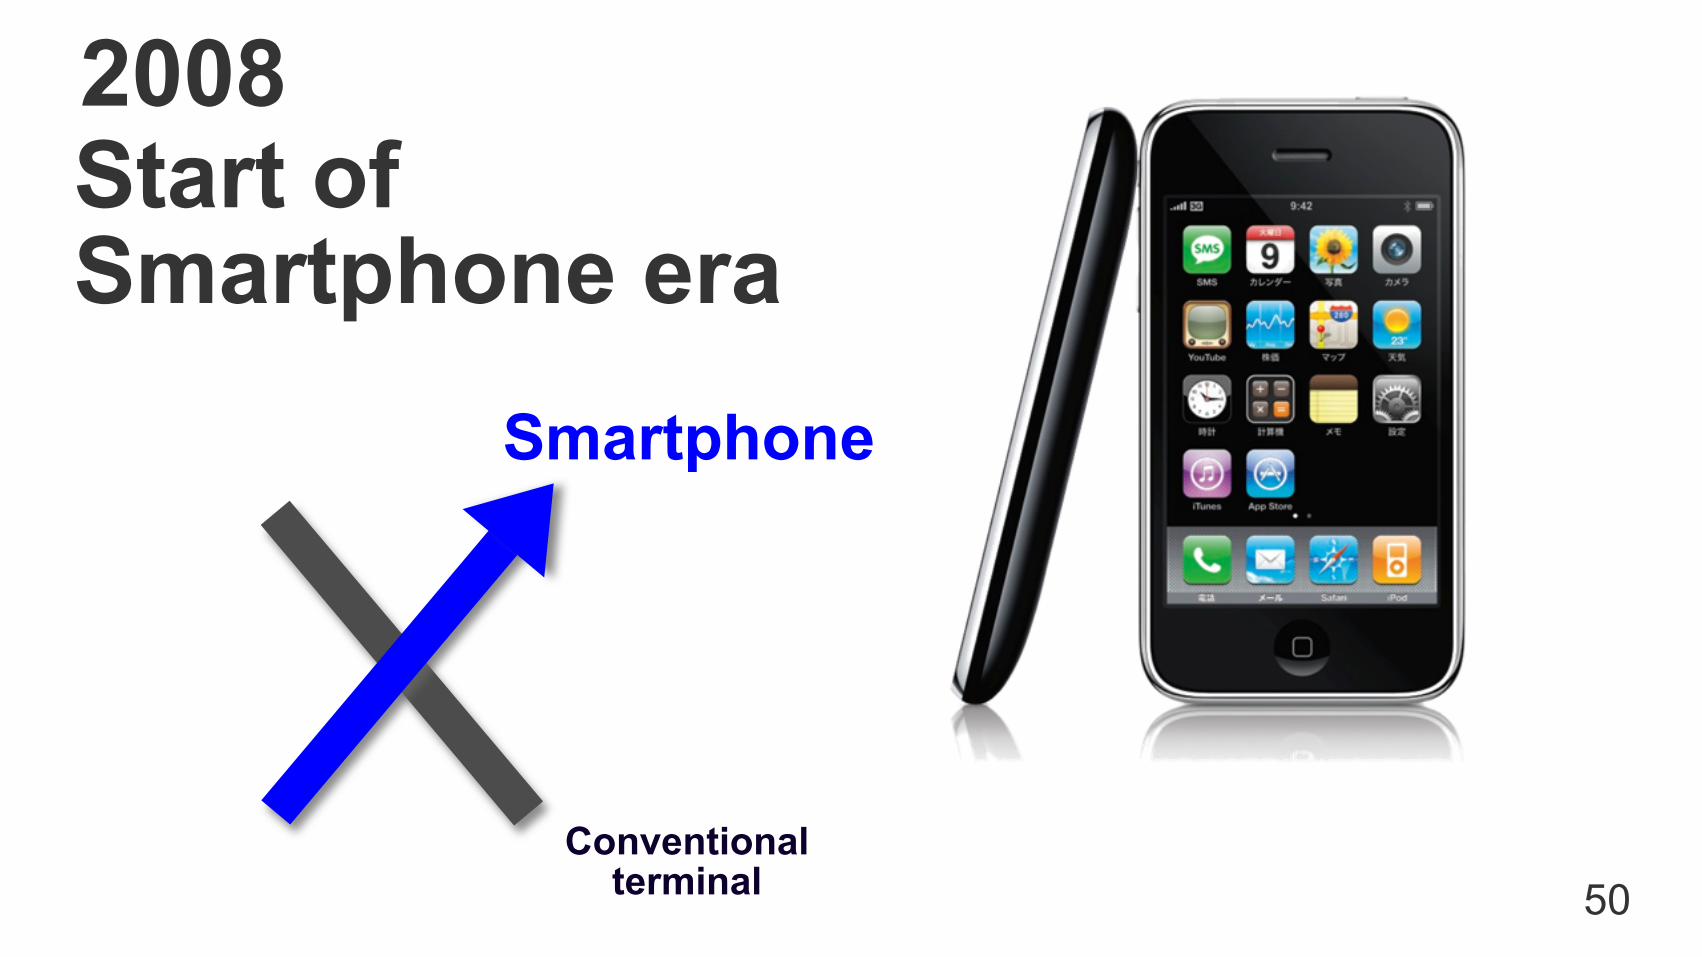
Start of Smartphone era
2008
Smartphone
Conventional terminal 50

51
July 2008Launched iPhone 3G
2010
June 2010Launched iPhone 4
June 2009Launched iPhone 3GS
2008*External data.
Overwhelmingly the No.1 smartphone
Cumulative number of iPhones sold
2009

52*External data (Apr. - Sept. 2010).
80%
5%
11%
4%
iPhone
Xperia
OthersIS01
Percentage of Smartphones Within Total New Smartphones Sold
Overwhelmingly No.1 smartphone
(FY10/H1)
10%
20%
30%
40%
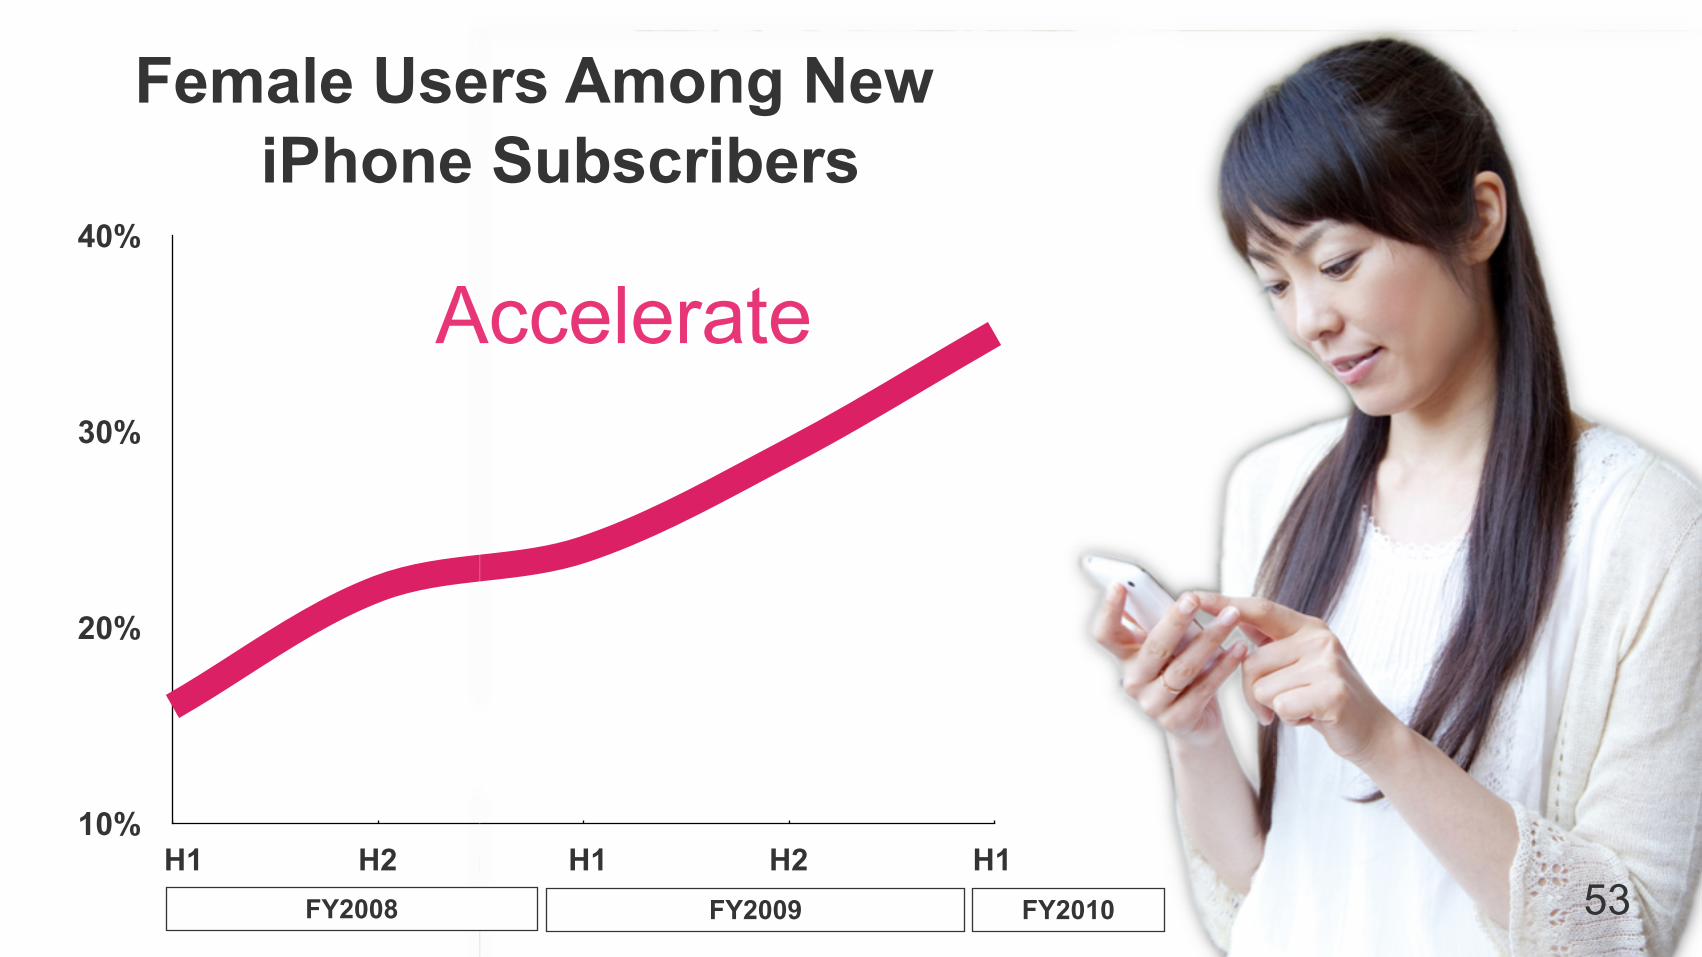
Female Users Among New iPhone Subscribers
Accelerate
53FY2009 FY2010
H1FY2008
H2 H1 H2 H1
10
20
30
40
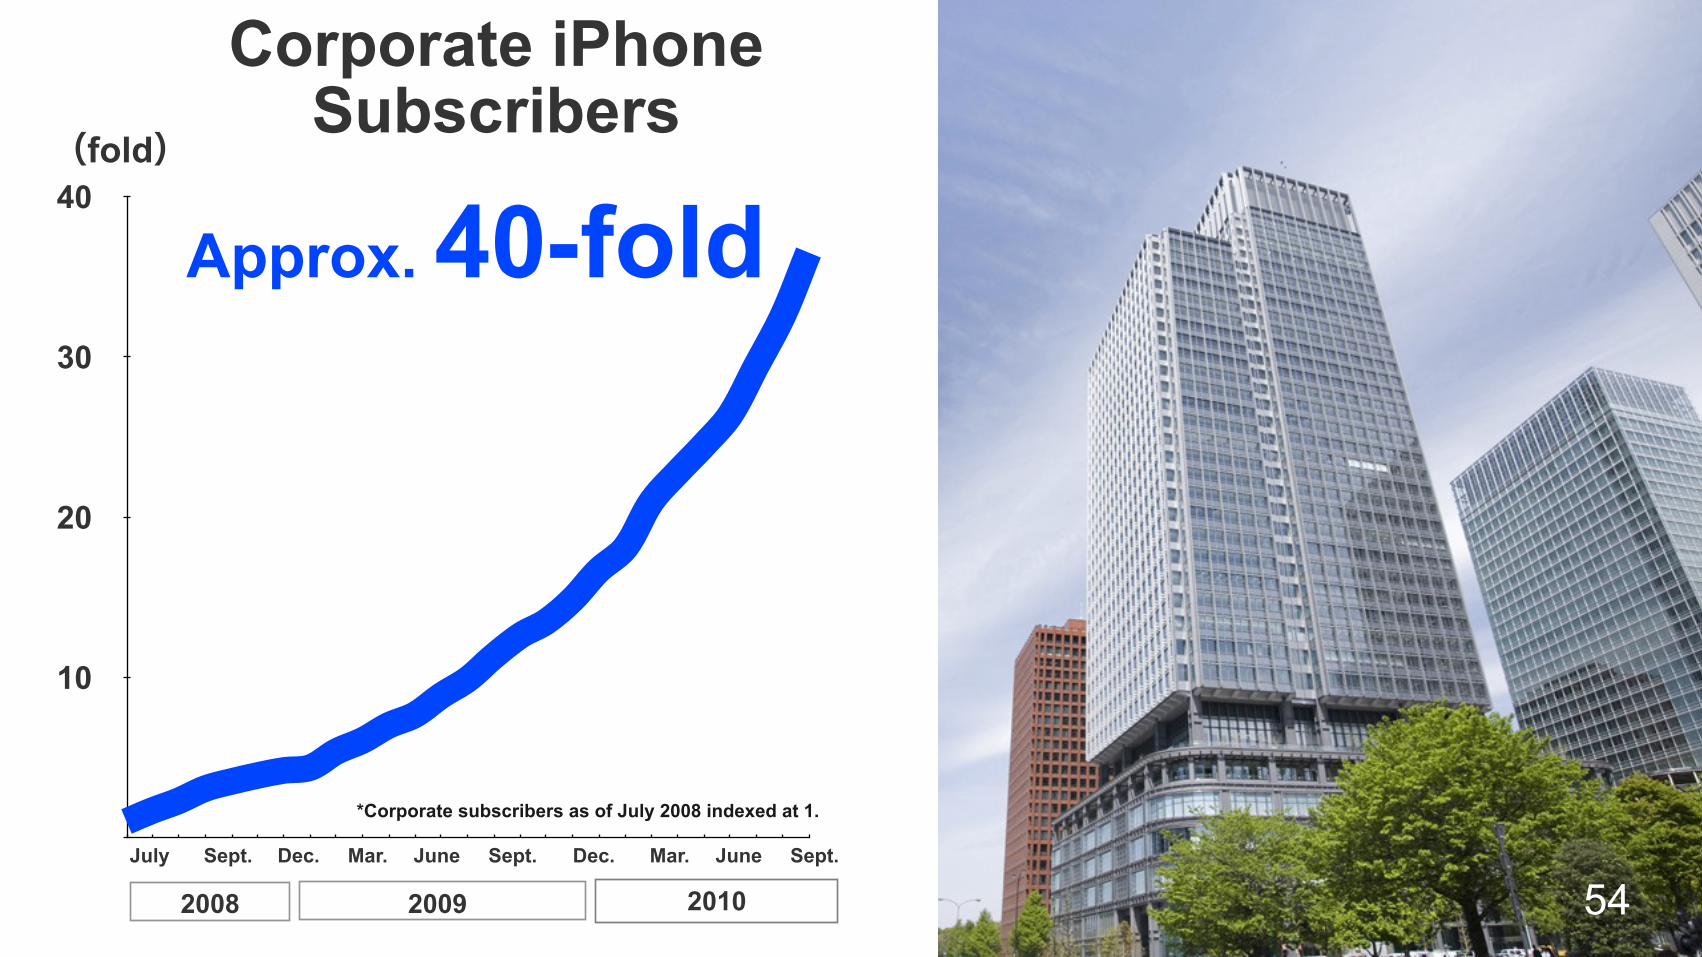
2008 2009 2010
Corporate iPhone Subscribers
Dec. Mar. June Sept.
(fold)
*Corporate subscribers as of July 2008 indexed at 1.
Approx. 40-fold
54Sept.JuneMar.Dec.July Sept.

55
HTCDesire II
More Smartphones With Android
HTCDesire HD
Android 2.2 Android 2.2
. . .
TM

56
SOFTBANK PREMIUM SHOP
・Staffed by IT skilled employees・Exceeds 400 shops nationwide (as of Oct. 1)
Cutting-edge Shop for Smartphone Era

Smartphone Becomes the Center of One’s Lifestyle
57

0
10
20
30
40
2008 2009 2010 2011 2012 2013 2014 2015
(mil)
Smartphone
Entering the smartphone era
Mobile Handsets Sold (Japan)
*Calculated by SOFTBANK CORP. based on material disclosed by MM Research Institute (Aug. 31, 2010).
Conventional terminal
58(FY)
(forecast)
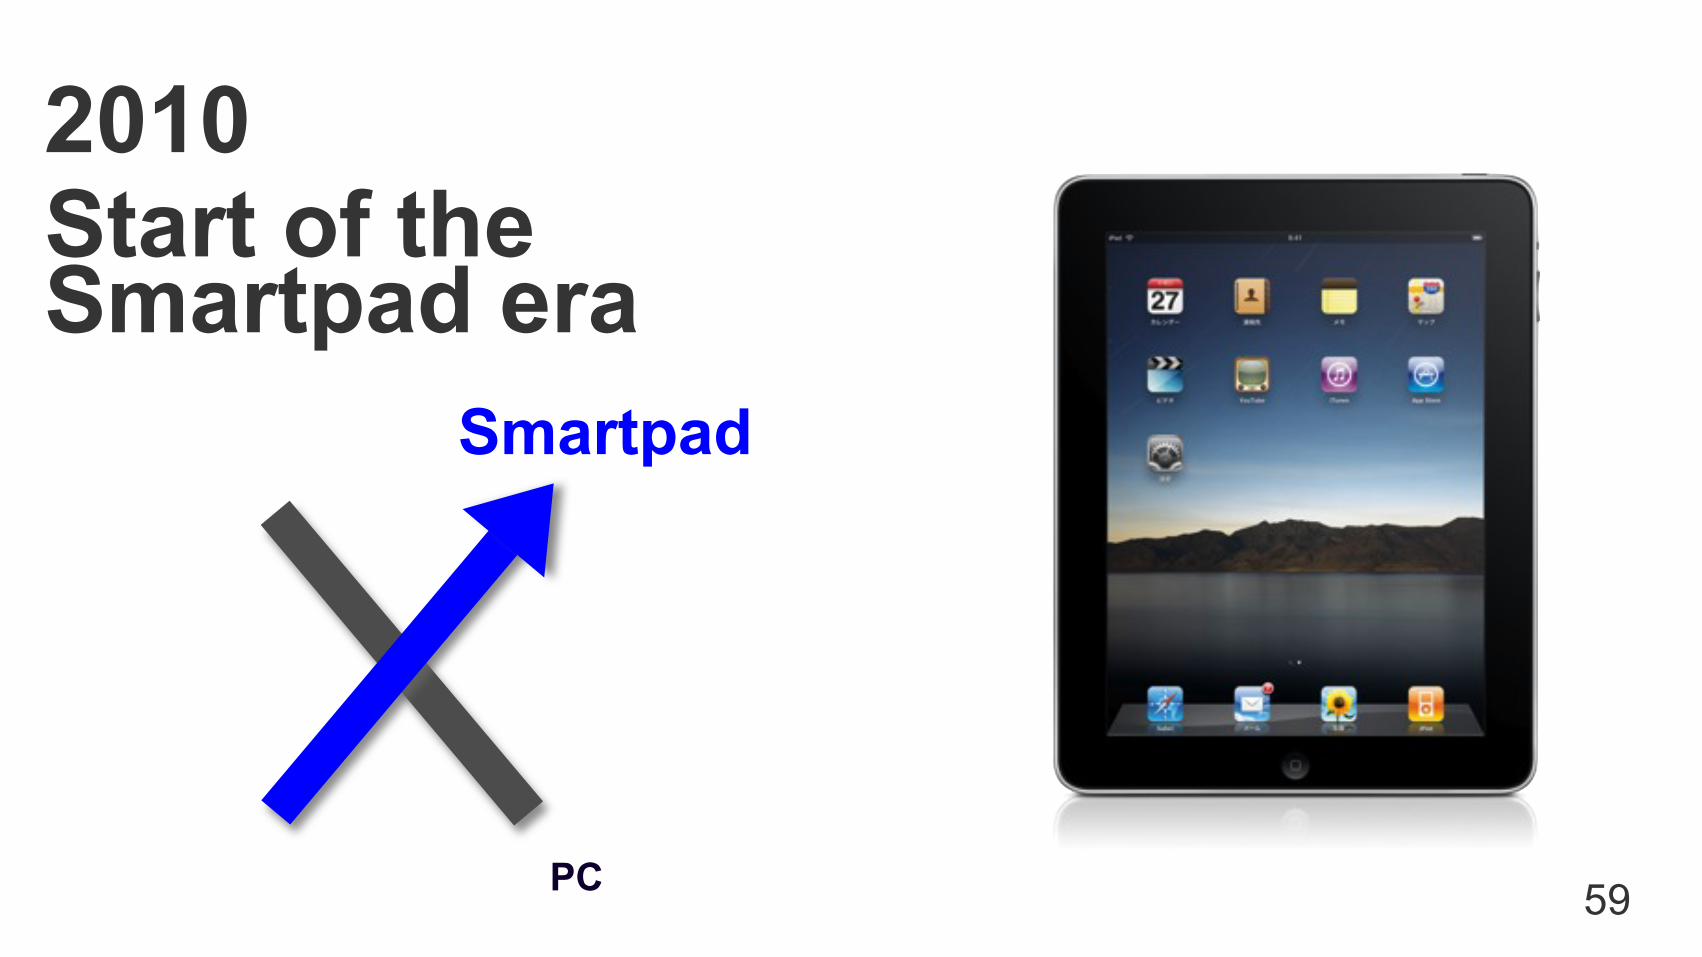
59
Start of the Smartpad era
2010
Smartpad
PC
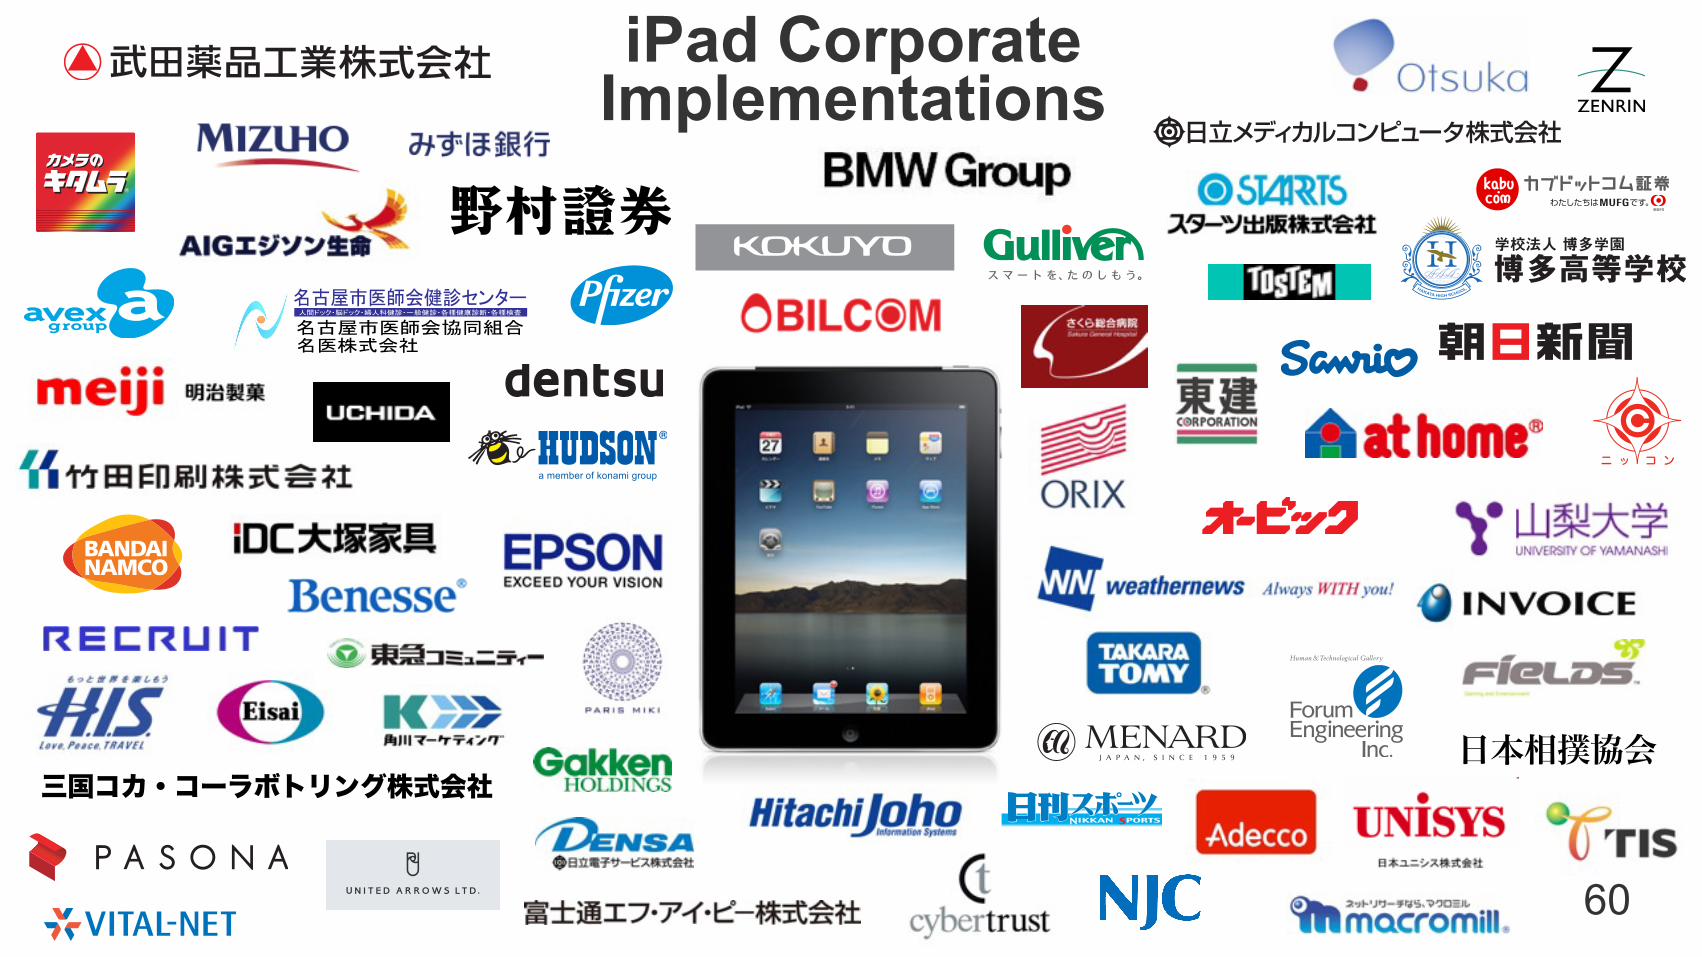
三国コカ・コーラボトリング株式会社日本相撲協会
05
7 ブランドスローガンとブランドロゴの組み合わせ
本事業の主旨を表現するメッセージがブランドスローガンです。
、
基本レイアウト
補足レイアウト
Gulliver VI manual
ブランドスローガンとブランドシンボル ロックアップ(組み合わせ)
60
iPad Corporate Implementations
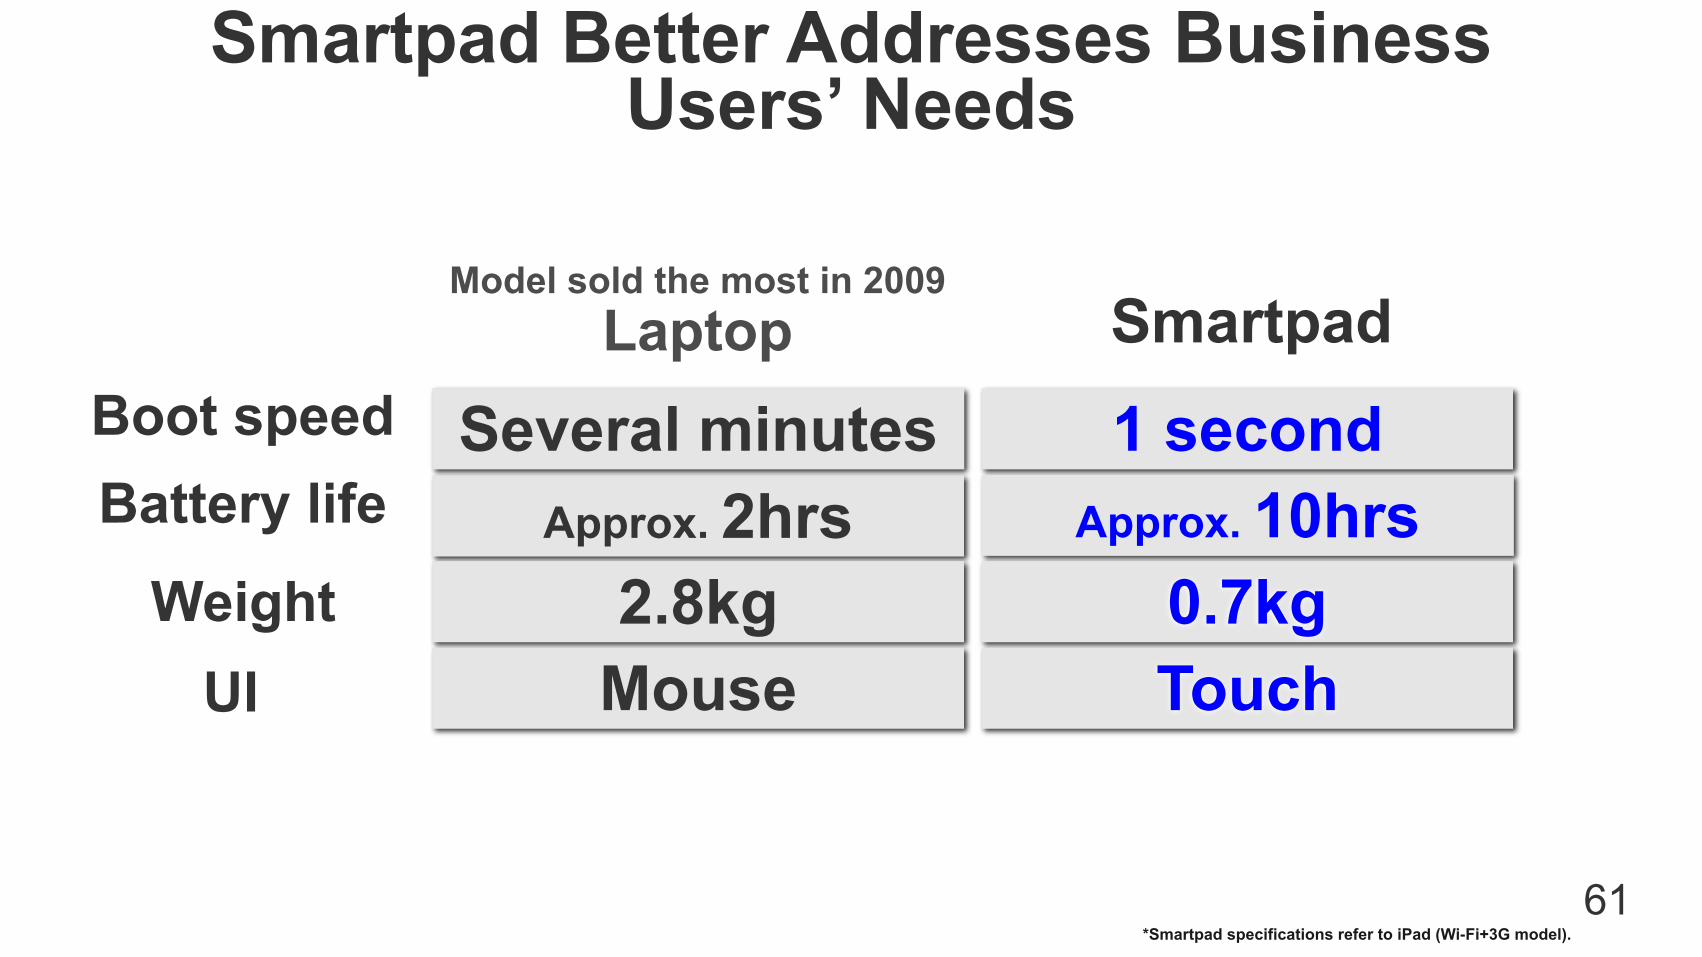
Several minutes 1 secondApprox. 2hrs Approx. 10hrs
2.8kg 0.7kgMouse Touch
Model sold the most in 2009Laptop
*Smartpad specifications refer to iPad (Wi-Fi+3G model).
Smartpad Better Addresses Business Users’ Needs
Boot speedSmartpad
Battery life
WeightUI
61

One for Each Business Person
62

Shops Selling iPad Expanding(SoftBank shops)
16 shops
7-fold
114 shops
As of Oct. 22 63Before Oct. 21
640
500
1,000
1,500
2005 2006 2007 2008 2009 2010 2011 2012 2013 2014 2015
(予想)
(年度)
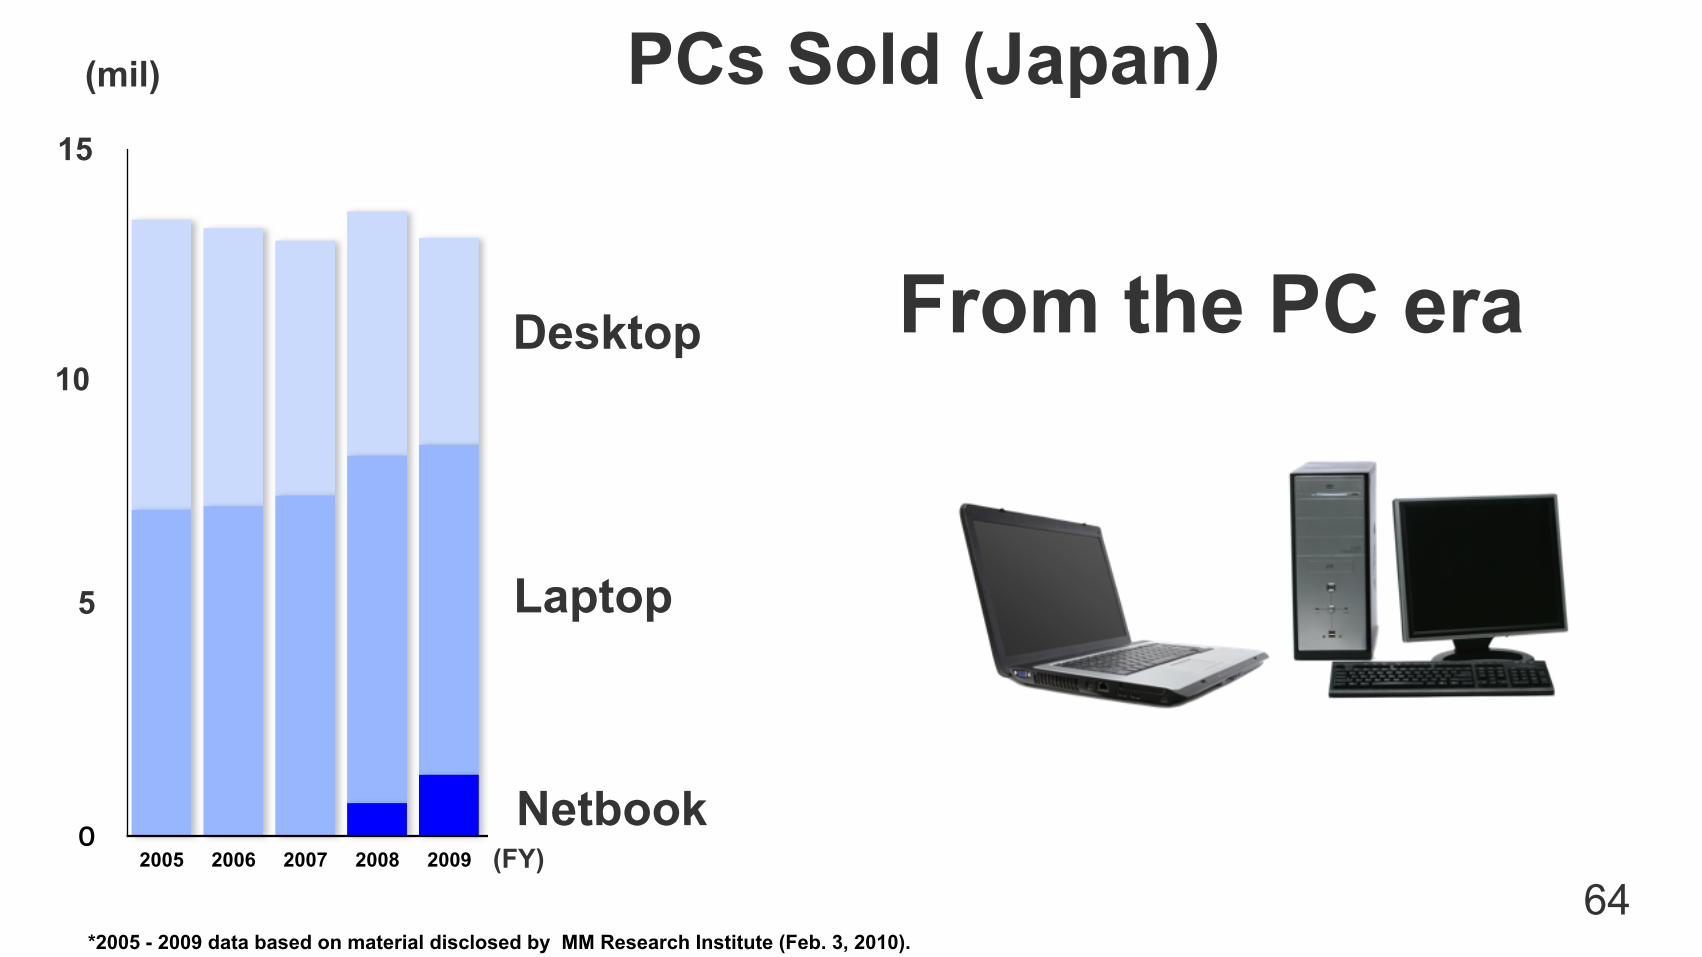
Desktop
Laptop
Netbook
(mil)
5
10
15
From the PC era
PCs Sold (Japan)
(FY)
*2005 - 2009 data based on material disclosed by MM Research Institute (Feb. 3, 2010).

0
500
1,000
1,500
2005 2006 2007 2008 2009 2010 2011 2012 2013 2014 2015
Smartpad
Desktop
PCs Sold (Japan)
Entering the smartpad era
Laptop
65
5
10
15
(mil)
(FY)
Forecast*2005 - 2009 data based on material disclosed by MM Research Institute (Feb. 3, 2010). After 2010 estimated by SOFTBANK CORP.
Netbook

iPhoneiPadWi-FiTwitter
66
100%100%100% 96%
Penetration in the SOFTBANK Group
*Penetration rate in employees of three telecommunications companies and SOFTBANK CORP. Penetration rate of Twitter based on internal company survey results (as of Oct. 2010).
Mobile Internet No.1
Smartphone No.1
Smartpad No.1
67
40 Million Lines New Milestone:
68
SOFTBANK MOBILE
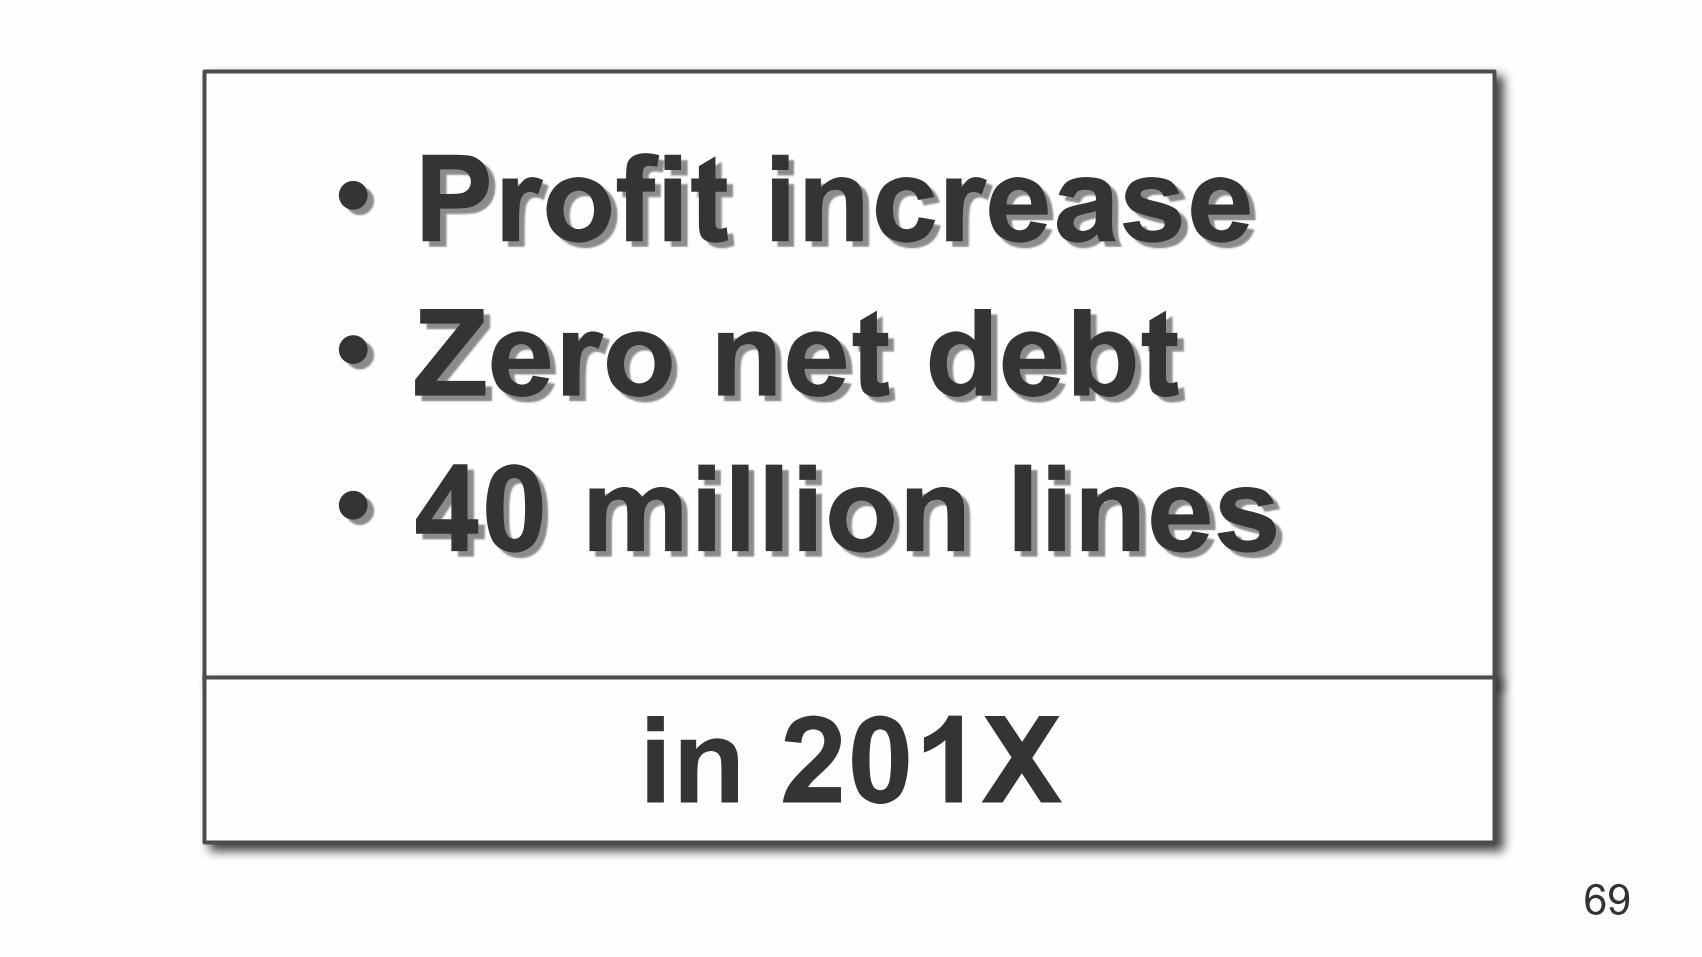
・Profit increase・Zero net debt・40 million lines
in 201X69
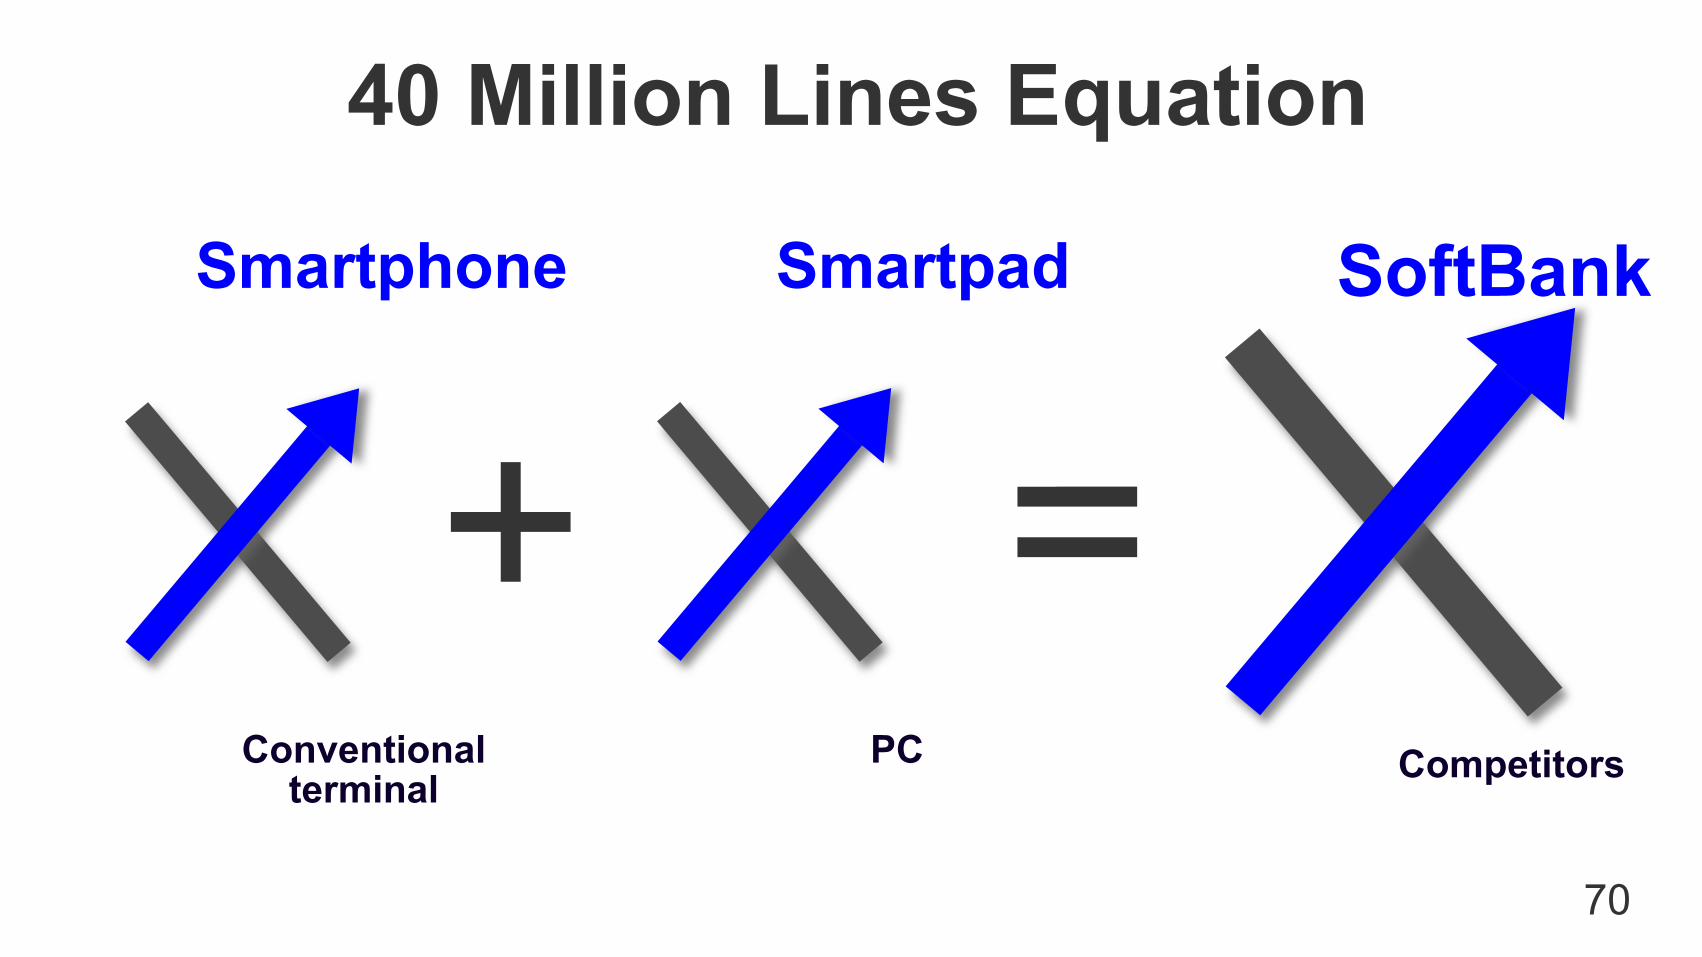
Conventional terminal
PC
70
Smartphone SoftBankSmartpad
Competitors
40 Million Lines Equation

Towards No. 1 Mobile Internet Company
71

Make People Happy Through Information Revolution
72

73

1. Application of accounting standard for disclosure on segmentsThe “Accounting Standard for Disclosures about Segments of an Enterprise and Related Information” and related “Guidance on the Accounting Standard for Disclosures about Segments of an Enterprise and Related Information” are applied from FY2010/Q1. Financial results for FY2009 are shown based on the new standard for comparison purposes only and have neither been audited nor reviewed by our independent auditors. All financial information for FY2009 presented herein based on the new standard are subject to our audited and reviewed financial reports for the relevant corresponding periods.
2. Definition of terms in this materialFree cash flow (FCF): cash flows from operating activities + cash flows from investing activities.
EBITDA: operating income (loss) + depreciation and amortization (including amortization of goodwill), and loss on disposal of fixed assets included in operating expenses.
Net interest-bearing debt: interest-bearing debt - cash positionInterest-bearing debt: short-term borrowings + commercial paper + current portion of corporate bonds + corporate bonds + long-term borrowings. Lease obligations are not included. This excludes the corporate bonds (WBS Class B2 Funding Notes, issued by J-WBS Funding K.K.) with a face value of JPY 27.0bn acquired by SOFTBANK CORP. during FY2009 that were issued under the whole business securitization financing scheme associated with the acquisition of Vodafone K.K. Cash position: cash & cash deposits + marketable securities recorded as current assets. (excludes Yahoo! Inc. shares held by a subsidiary of SOFTBANK CORP. in the United States of America).
SBM loan: the funds procured for the acquisition of Vodafone K.K. were refinanced in November 2006 via a whole business securitization program. This excludes the corporate bonds (WBS Class B2 Funding Notes, issued by J-WBS Funding K.K.) with a face value of JPY 27.0bn acquired by SOFTBANK CORP. during FY2009 that were issued under the whole business securitization financing scheme associated with the acquisition of Vodafone K.K.
Record high, record high revenue: since SOFTBANK CORP. applied consolidated accounting in FY1994 (Apr. - Sept. basis).
The mobile communications business operating income from FY2002 - 2005 is based on Vodafone K.K. (current SOFTBANK MOBILE Corp.)’s semi-annual report. For FY2002 - 2003 this material is based on Vodafone K.K. (at the time Nippon Telecom Holdings)‘s mobile communications segment’s operating income (Apr. - Sept. basis).
3. Trademarks and registered trademarksThe names of other companies, other logos, product names, service names, brands, etc., mentioned in this material are registered trademarks or trademarks of SOFTBANK CORP. or the applicable companies. Unauthorized copying of this material and use of the information or the data in this material in whole or in part are not permitted.
- Apple, the Apple logo, iPhone and iPad are trademarks of Apple.- The trademark “iPhone” is used with a license from Aiphone K.K.- Android is a trademark of Google Inc.
ARPU (Average Revenue Per User): Revenue and number of mobile phone subscribers include prepaid mobile phones and communication modules.
Net subscriber additions: number of new subscribers minus cancellations. Includes the number of prepaid mobile phones and communication module subscribers.


