

Earth Observing System Data
and Information System
2015 Customer Satisfaction Results
November 2015
2 © 2015 CFI Group. All rights reserved.
Contents
About CFI Group
Introduction and Methodology
Survey and Data Collection Summary
Executive Summary
Survey Results
Customer Satisfaction Model Results
CSI by DAAC and Other Segments
Satisfaction Driver Detail

3 © 2015 CFI Group. All rights reserved.
About CFI Group
Founded in 1988
Founding partner of the ACSI
Patent holder of the modeling engine used to compute the ACSI
Predictive analytics software and professional services
Serving a global list of clients from 6 offices on 4 continents
Providing “actionable” customer feedback insights based on the science of the ACSI
CFI GROUP WORLDWIDE
USA - Ann Arbor, MI
ENGLAND – London
ITALY – Milan
CHINA - Shanghai
SWEDEN – Stockholm
BRAZIL - Porto Alegre

Introduction & Methodology

5 © 2015 CFI Group. All rights reserved.
Introduction and Methodology
Measure customer satisfaction with NASA Earth Observing System Data and
Information System (EOSDIS) at a national level for each Distributed Active Archive
Center (DAAC).
Identify the key areas that NASA can leverage across the DAACs to continuously
improve its service to its customers.
Assess the trends in satisfaction with NASA EOSDIS specifically in the following areas:
Customer Support
Product Selection and Order
Product Search
Product Documentation
Product Quality
Delivery
Survey and Data Collection

7 © 2015 CFI Group. All rights reserved.
Survey and Data Collection Summary
Questionnaire developed by NASA EOSDIS and CFI Group.
Measured respondent satisfaction with their experiences with a specific DAAC
The survey was designed to allow users to skip over the questions not related to
their experience with the specified DAAC.
Each DAAC was allowed the opportunity to utilize their own unique supplemental
questions (outside of the ACSI model questions).
Data collection performed via the web.
NASA EOSDIS provided a list of email addresses, which after cleaning the sample
list, CFI Group sent out 109,485 email invitations.
A total of 5,346 responses were received, for a response rate of 4.9%.
The online survey was available September 14th through October 6th, 2015
Two survey reminder announcements sent by CFI Group (September 22nd &
September 29th ).
Executive Summary

9 © 2015 CFI Group. All rights reserved.
Executive Summary: CSI and Performance Outcomes
The 2015 Customer Satisfaction Index (CSI) for NASA EOSDIS is 77, representing
performance that is generally strong and consistent with results since 2008.
All drivers of satisfaction, with the exception of Product Documentation (78), were
rated at 80 or above on aggregate, a good indicator of consistency across the spectrum
of the customer experience.
At the DAAC level, ORNL DAAC (80) and CDDIS (79) were rated highest by respondents in this
year’s study.
Respondents’ Likelihood to Recommend the DAAC they dealt with to a colleague (86),
and Likelihood to Use the Services Provided by the DAAC in the future (88)
remained very high, though are down two and one points, respectively, from 2014.
10 © 2015 CFI Group. All rights reserved.
Executive Summary: Customer Support
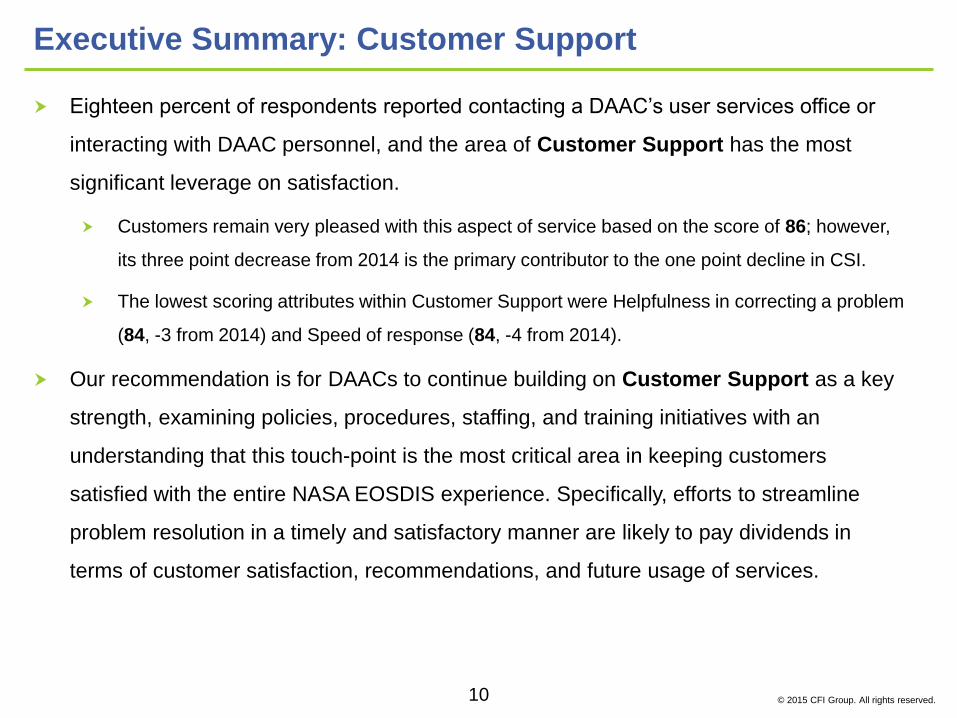
Eighteen percent of respondents reported contacting a DAAC’s user services office or
interacting with DAAC personnel, and the area of Customer Support has the most
significant leverage on satisfaction.
Customers remain very pleased with this aspect of service based on the score of 86; however,
its three point decrease from 2014 is the primary contributor to the one point decline in CSI.
The lowest scoring attributes within Customer Support were Helpfulness in correcting a problem
(84, -3 from 2014) and Speed of response (84, -4 from 2014).
Our recommendation is for DAACs to continue building on Customer Support as a key
strength, examining policies, procedures, staffing, and training initiatives with an
understanding that this touch-point is the most critical area in keeping customers
satisfied with the entire NASA EOSDIS experience. Specifically, efforts to streamline
problem resolution in a timely and satisfactory manner are likely to pay dividends in
terms of customer satisfaction, recommendations, and future usage of services.

11 © 2015 CFI Group. All rights reserved.
Executive Summary: Other Key Drivers
Product Selection and Order (82) and Product Search (80) both continue to earn
strong ratings from customers and have noticeable leverage on satisfaction.
DAACs’ ability to maintain this level of performance and make incremental improvements to the
user experience in terms of selecting and requesting/ordering data products, as well as
continuing to refine internet search terms and criteria, will contribute towards maintaining and
improving overall customer satisfaction.
Product Documentation is the lowest scoring driver (78), though it has less influence
on CSI than Customer Support, Product Selection and Order, and Product Search.
To the extent that continuous improvements can be made to overall document quality, this
aspect of the customer experience can work in conjunction with other measured areas to boost
aggregate satisfaction for users.

Customer Satisfaction Model Results
13 © 2015 CFI Group. All rights reserved.13
Product Search80 1.0
Customer Support86 2.0
Product Selection
and Order82 1.3
Product
Documentation78 0.7
Product Quality82 0.6
Likelihood to
Recommend863.9
Use Services in
Future883.3
Delivery85 0.3
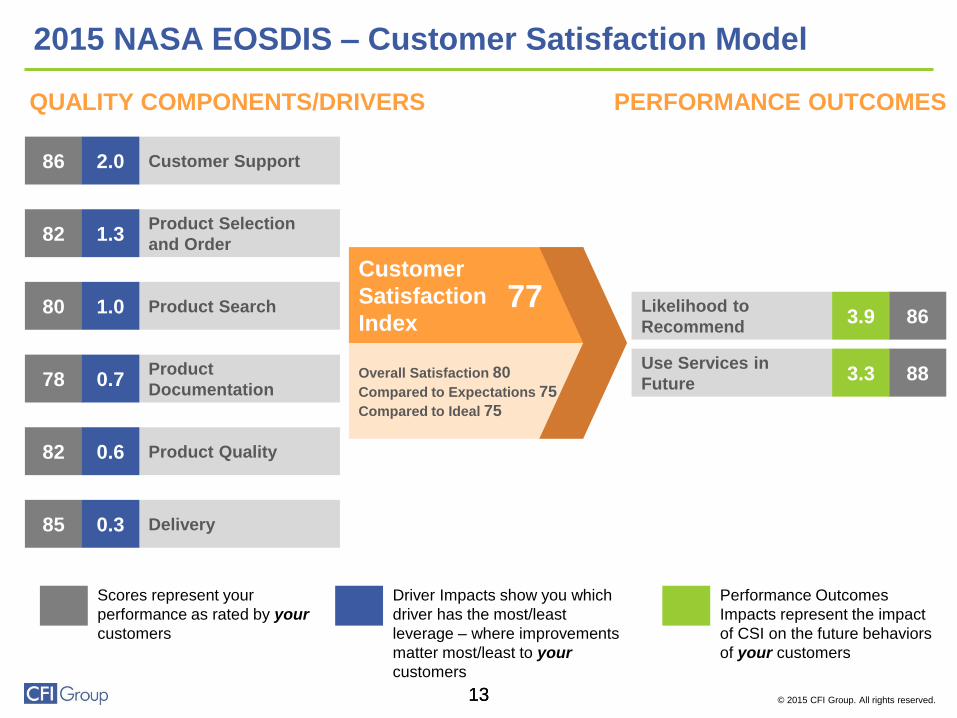
QUALITY COMPONENTS/DRIVERS PERFORMANCE OUTCOMES
Scores represent your
performance as rated by your
customers
Driver Impacts show you which
driver has the most/least
leverage – where improvements
matter most/least to your
customers
Performance Outcomes
Impacts represent the impact
of CSI on the future behaviors
of your customers
Overall Satisfaction 80
Compared to Expectations 75
Compared to Ideal 75
Customer
Satisfaction
Index77
2015 NASA EOSDIS – Customer Satisfaction Model
14 © 2015 CFI Group. All rights reserved.
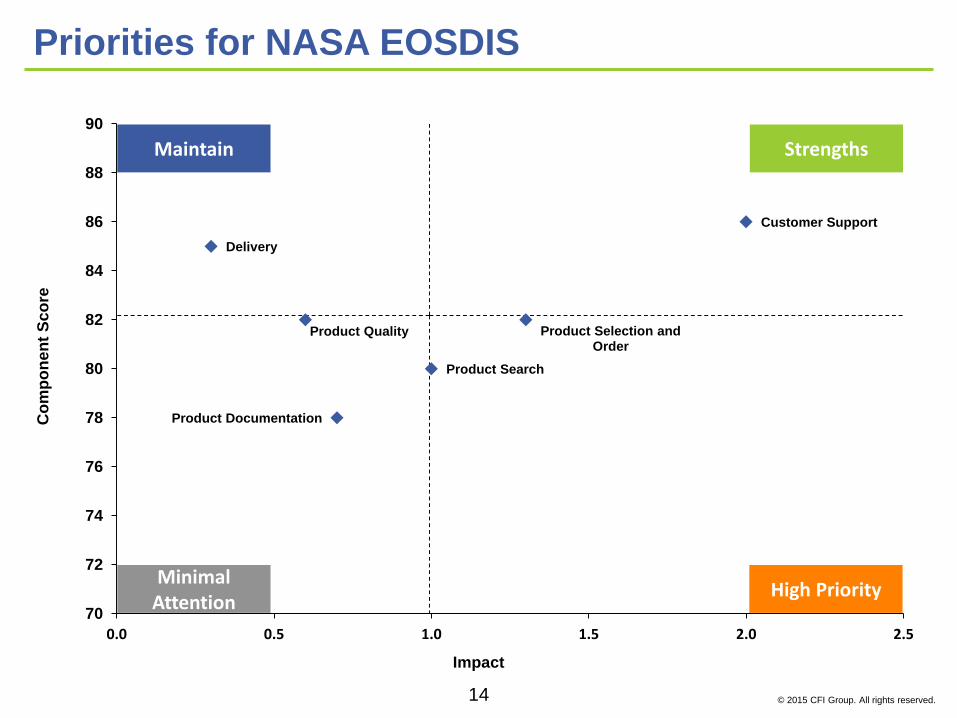
Product Search
Product Selection and Order
Delivery
Product Quality
Product Documentation
Customer Support
70
72
74
76
78
80
82
84
86
88
90
0.0 0.5 1.0 1.5 2.0 2.5
Priorities for NASA EOSDIS
Impact
Co
mp
on
en
t S
co
re
Maintain Strengths
High PriorityMinimal
Attention

15 © 2015 CFI Group. All rights reserved.
While CSI and both
Performance
Outcomes saw slight
declines in 2015,
scores have
remained generally
steady over time.
CSI and Performance Outcomes: Four-year Trending
77
86
88
78
88
89
76
86
87
77
87
88
Customer Satisfaction Index
Likelihood to Recommend
Likelihood to Use Services in Future
2015 2014 2013 2012

16 © 2015 CFI Group. All rights reserved.
CSI for NASA
EOSDIS is three
points above the
National ACSI
average (74), and 13
points above the
Federal Government
average (64).
Scores in green
represent CSI for
other Federal
Government Agency
information providers
measured by CFI.
Benchmarks
82
80
79
77
74
70
64
USDA Rural Development - 2015
National Weather Service - 2015
FEMA BSB Publications - 2015
NASA EOSDIS - Aggregate 2015
National ACSI - Q2 2015
USDA Agricultural Marketing Services -2015
Federal Government - Overall 2015
CSI by DAAC and Other Segments

18 © 2015 CFI Group. All rights reserved.
CSI and Frequency by DAAC
% N CSI % N CSI
DAAC
ASDC-LaRC 6% 267 75 10% 530 77
ASF SAR DAAC 4% 159 73 4% 198 77
CDDIS 4% 161 81 3% 185 79
GES DISC 7% 303 78 10% 543 76
GHRC 2% 99 78 5% 269 71
LP DAAC 42% 1,746 78 38% 2,050 78
MODAPS LAADS 10% 428 78 13% 713 74
NSIDC DAAC 8% 322 78 5% 250 77
OB.DAAC 5% 219 80 2% 116 78
ORNL DAAC 5% 206 79 2% 125 80
PO DAAC-JPL 3% 122 81 3% 175 78
SEDAC 3% 115 72 4% 191 72
Number of Respondents 5,3454,147
20152014
LP DAAC was again the most frequently cited DAAC for evaluation (38%).
ORNL DAAC (80) and CDDIS (79) were the highest scoring DAACs.
ASF SAR DAAC realized most improvement over 2014 (+4 to 77), while GHRC
saw the biggest decline (-7 to 71).

19 © 2015 CFI Group. All rights reserved.
74
77
78
80
78
72
78
78
80
79
81
72
76
75
77
79
80
71
75
79
81
77
78
74
MODAPS LAADS
NSIDC DAAC
OB.DAAC
ORNL DAAC
PO DAAC-JPL
SEDAC
2015 2014 2013 2012
CSI: Four-year Comparison by DAAC
77
77
79
76
71
78
75
73
81
78
78
78
72
76
76
77
75
77
79
79
78
76
82
76
ASDC-LaRC
ASF SAR DAAC
CDDIS
GES DISC
GHRC
LP DAAC
CSI moved only zero
to two points for
eight of the twelve
DAACs since 2014.

20 © 2015 CFI Group. All rights reserved.
CSI is two points
higher for domestic
respondents, driven
primarily by higher
scores in Customer
Support and
Delivery.
CSI and Driver Scores: USA vs. All Other Countries
* indicates a Significant Difference between scores at 90% confidence level
Sample Size
Product Search 80 79 -1
Product Selection and Order 82 81 -1
Delivery 87 84 -3 *
Product Quality 83 82 -1
Product Documentation 78 78 0
Customer Support 90 84 -6 *
Customer Satisfaction Index 78 76 -2 *
Likelihood to Recommend 88 86 -2 *
Likelihood to Use Services in Future 90 87 -3 *
Significant
Difference
All Others
1,025
USA
4,321Scores
Difference
21 © 2015 CFI Group. All rights reserved.
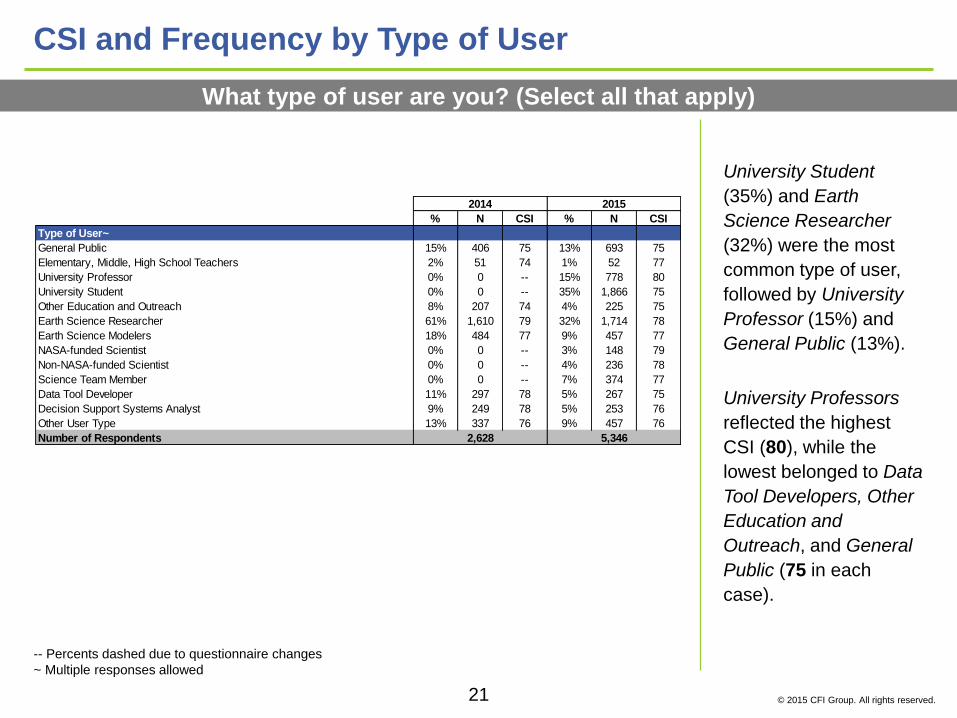
CSI and Frequency by Type of User
What type of user are you? (Select all that apply)
-- Percents dashed due to questionnaire changes
~ Multiple responses allowed
University Student
(35%) and Earth
Science Researcher
(32%) were the most
common type of user,
followed by University
Professor (15%) and
General Public (13%).
University Professors
reflected the highest
CSI (80), while the
lowest belonged to Data
Tool Developers, Other
Education and
Outreach, and General
Public (75 in each
case).
% N CSI % N CSI
Type of User~
General Public 15% 406 75 13% 693 75
Elementary, Middle, High School Teachers 2% 51 74 1% 52 77
University Professor 0% 0 -- 15% 778 80
University Student 0% 0 -- 35% 1,866 75
Other Education and Outreach 8% 207 74 4% 225 75
Earth Science Researcher 61% 1,610 79 32% 1,714 78
Earth Science Modelers 18% 484 77 9% 457 77
NASA-funded Scientist 0% 0 -- 3% 148 79
Non-NASA-funded Scientist 0% 0 -- 4% 236 78
Science Team Member 0% 0 -- 7% 374 77
Data Tool Developer 11% 297 78 5% 267 75
Decision Support Systems Analyst 9% 249 78 5% 253 76
Other User Type 13% 337 76 9% 457 76
Number of Respondents
2014 2015
5,3462,628
22 © 2015 CFI Group. All rights reserved.
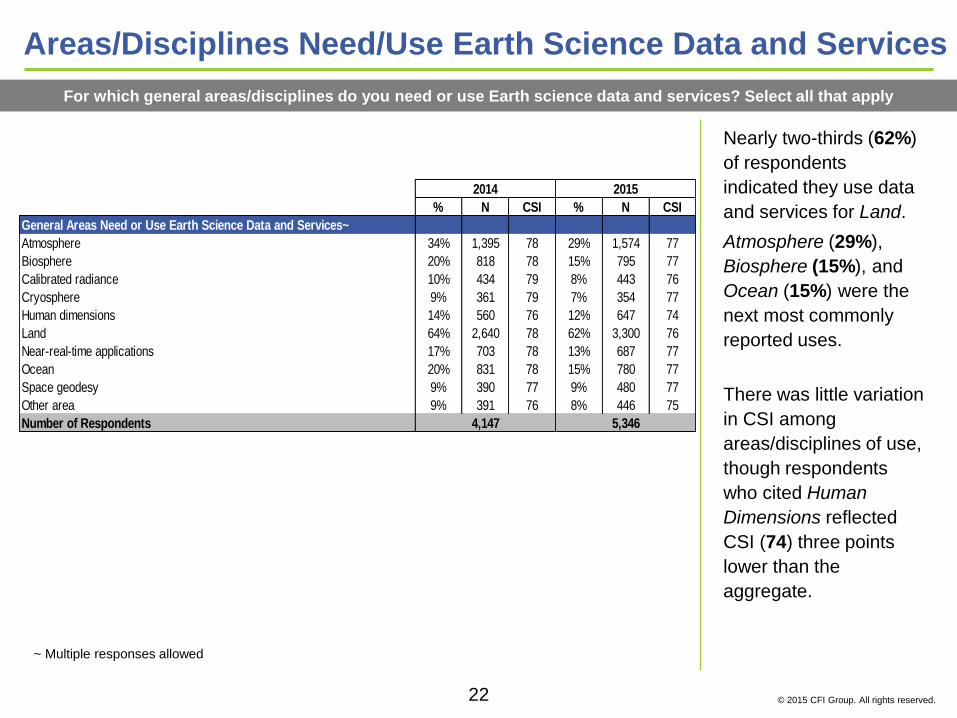
Nearly two-thirds (62%)
of respondents
indicated they use data
and services for Land.
Atmosphere (29%),
Biosphere (15%), and
Ocean (15%) were the
next most commonly
reported uses.
There was little variation
in CSI among
areas/disciplines of use,
though respondents
who cited Human
Dimensions reflected
CSI (74) three points
lower than the
aggregate.
Areas/Disciplines Need/Use Earth Science Data and Services
For which general areas/disciplines do you need or use Earth science data and services? Select all that apply
~ Multiple responses allowed
% N CSI % N CSI
General Areas Need or Use Earth Science Data and Services~
Atmosphere 34% 1,395 78 29% 1,574 77
Biosphere 20% 818 78 15% 795 77
Calibrated radiance 10% 434 79 8% 443 76
Cryosphere 9% 361 79 7% 354 77
Human dimensions 14% 560 76 12% 647 74
Land 64% 2,640 78 62% 3,300 76
Near-real-time applications 17% 703 78 13% 687 77
Ocean 20% 831 78 15% 780 77
Space geodesy 9% 390 77 9% 480 77
Other area 9% 391 76 8% 446 75
Number of Respondents
2014 2015
4,147 5,346

Driver Detail: Customer Support

24 © 2015 CFI Group. All rights reserved.
Eighteen percent of
respondents reported
contacting a DAAC’s
user services office or
interacting with DAAC
personnel in the past
year (up 2 percentage
points from 2014).
Though down three
points from 2014, this
area is still rated very
highly and has the most
leverage on CSI.
Timeliness of response
is the area that showed
the largest score
decrease (-4 to 84).
Customer Support
Impact = 2.0
86
87
87
84
84
89
90
89
87
88
89
91
90
88
87
87
88
87
85
85
Customer Support
Professionalism
Technical knowledge
Helpfulness incorrecting a problem
Timeliness of response
2015 2014 2013 2012

25 © 2015 CFI Group. All rights reserved.
At 93, CDDIS
recorded the highest
score for Customer
Support, while
SEDAC saw the
biggest improvement
(+7 to 87).
Most DAACs scored
in the high-80s.
Customer Support: Four-year Comparison by DAAC
82
89
87
88
89
87
86
91
90
89
93
80
87
88
91
90
84
82
84
88
88
90
88
69
MODAPS LAADS
NSIDC DAAC
OB.DAAC
ORNL DAAC
PO DAAC-JPL
SEDAC
2015 2014 2013 2012
84
89
93
86
83
85
86
87
95
88
88
88
89
90
93
91
96
88
84
89
93
87
84
86
ASDC-LaRC
ASF SAR DAAC
CDDIS
GES DISC
GHRC
LP DAAC

Driver Detail: Product Selection and Order

27 © 2015 CFI Group. All rights reserved.
Seventy-eight
percent of
respondents
requested/acquired
data products from a
DAAC in the past
year.
This aspect of the
customer experience
has relatively strong
influence on CSI,
and with a score of
82 it is an area that
is performing well.
Product Selection and Order
Impact = 1.3
82
81
82
82
82
82
81
80
81
79
79
79
Product Selectionand Order
Ease of selectingdata products
Ease of requesting orordering data products
2015 2014 2013 2012

28 © 2015 CFI Group. All rights reserved.
CDDIS (86) and PO
DAAC-JPL (84) were
the highest rated
DAACs for Product
Selection and
Order.
GHRC and
MODAPS LAADS
each experienced
significant decreases
since the prior year.
Eleven of the twelve
DAACs scored 80 or
higher, just as in
2014.
Product Selection and Order: Four-year Comparison by DAAC
79
81
83
82
84
81
83
80
84
83
84
77
82
80
85
85
82
79
79
79
82
80
81
73
MODAPS LAADS
NSIDC DAAC
OB.DAAC
ORNL DAAC
PO DAAC-JPL
SEDAC
2015 2014 2013 2012
82
82
86
81
80
82
81
84
87
80
86
82
81
82
81
81
85
80
79
81
79
78
83
78
ASDC-LaRC
ASF SAR DAAC
CDDIS
GES DISC
GHRC
LP DAAC

Driver Detail: Product Search
30 © 2015 CFI Group. All rights reserved.
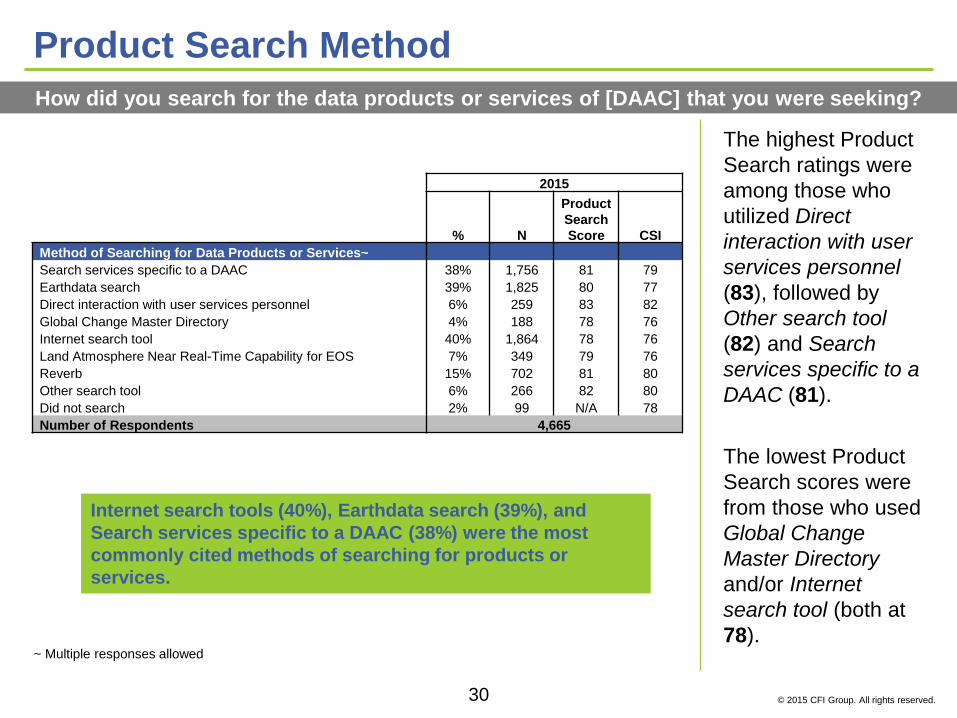
The highest Product
Search ratings were
among those who
utilized Direct
interaction with user
services personnel
(83), followed by
Other search tool
(82) and Search
services specific to a
DAAC (81).
The lowest Product
Search scores were
from those who used
Global Change
Master Directory
and/or Internet
search tool (both at
78).
Product Search Method
How did you search for the data products or services of [DAAC] that you were seeking?
~ Multiple responses allowed
Internet search tools (40%), Earthdata search (39%), and
Search services specific to a DAAC (38%) were the most
commonly cited methods of searching for products or
services.
2015
% N
Product
Search
Score CSI
Method of Searching for Data Products or Services~
Search services specific to a DAAC 38% 1,756 81 79
Earthdata search 39% 1,825 80 77
Direct interaction with user services personnel 6% 259 83 82
Global Change Master Directory 4% 188 78 76
Internet search tool 40% 1,864 78 76
Land Atmosphere Near Real-Time Capability for EOS 7% 349 79 76
Reverb 15% 702 81 80
Other search tool 6% 266 82 80
Did not search 2% 99 N/A 78
Number of Respondents 4,665
31 © 2015 CFI Group. All rights reserved.
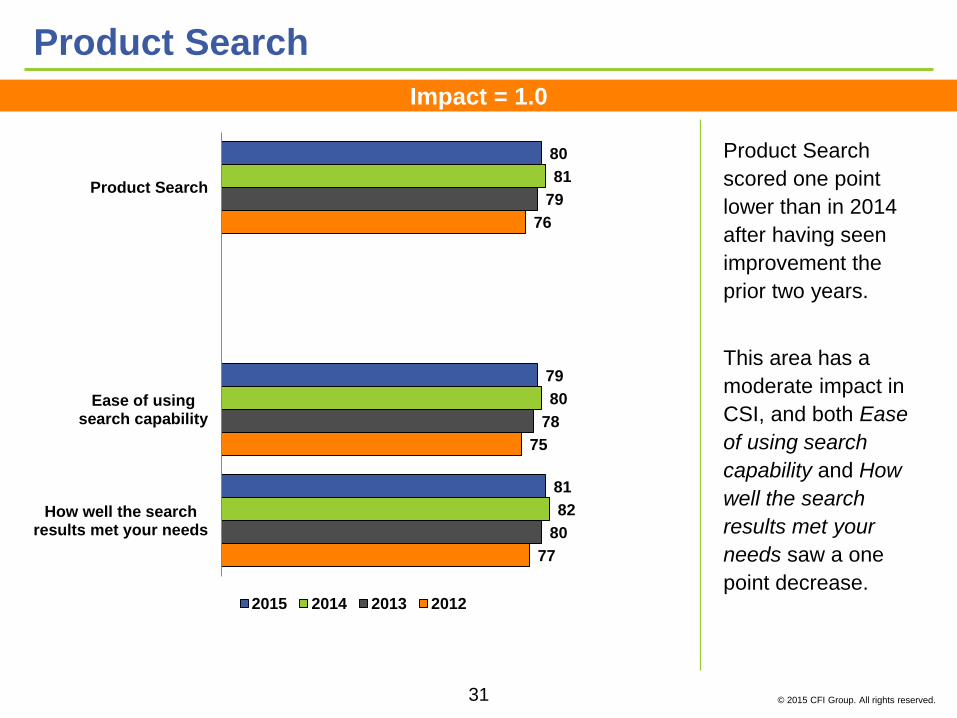
Product Search
scored one point
lower than in 2014
after having seen
improvement the
prior two years.
This area has a
moderate impact in
CSI, and both Ease
of using search
capability and How
well the search
results met your
needs saw a one
point decrease.
Product Search
Impact = 1.0
80
79
81
81
80
82
79
78
80
76
75
77
Product Search
Ease of usingsearch capability
How well the searchresults met your needs
2015 2014 2013 2012

32 © 2015 CFI Group. All rights reserved.
Customers
evaluating CDDIS
reported the highest
Product Search
score (82), and has
improved this area
each of the past
three years.
MOADAPS LAADS
saw a five point
decline to 77.
Product Search: Four-year Comparison by DAAC
77
77
81
81
81
75
82
78
83
81
83
75
78
78
81
81
83
72
76
74
81
76
77
71
MODAPS LAADS
NSIDC DAAC
OB.DAAC
ORNL DAAC
PO DAAC-JPL
SEDAC
2015 2014 2013 2012
80
81
82
79
77
81
79
78
81
79
80
81
78
79
78
80
79
79
80
78
73
76
80
75
ASDC-LaRC
ASF SAR DAAC
CDDIS
GES DISC
GHRC
LP DAAC
Driver Detail: Product Documentation

34 © 2015 CFI Group. All rights reserved.
Seventy-two
percent of
respondents looked
for or obtained
documentation
related to the data.
Scores have
remained consistent
at 78 since 2013 for
Product
Documentation,
and this driver has
low to moderate
leverage on CSI.
Product Documentation
Impact = 0.7
78
78
78
78
78
78
78
78
78
77
77
78
Product Documentation
Overall quality of the document
Data documentation helpedyou use the data
2015 2014 2013 2012

35 © 2015 CFI Group. All rights reserved.
Those evaluating
CDDIS posted the
highest scores for
Product
Documentation (82).
Scores are very
consistent across
DAACs for this
driver, most scores
ranging from 76-79.
Product Documentation: Four-year Comparison by DAAC
77
77
74
81
77
76
78
77
76
79
80
76
78
76
76
78
80
78
78
77
77
78
77
77
MODAPS LAADS
NSIDC DAAC
OB.DAAC
ORNL DAAC
PO DAAC-JPL
SEDAC
2015 2014 2013 2012
76
78
83
78
77
79
77
76
81
78
78
78
77
78
79
79
80
77
76
79
81
78
80
77
ASDC-LaRC
ASF SAR DAAC
CDDIS
GES DISC
GHRC
LP DAAC

Driver Detail: Product Quality

37 © 2015 CFI Group. All rights reserved.
Respondents rated
the Ease of using the
data product in the
delivered format at
82 for the third
straight year.
This driver has low
to moderate
influence on CSI.
Product Quality – Ease of Use
Impact=0.6
82
82
82
82
82
82
81
81
Product Ease of Use
Ease of using the data productin the delivered format
2015 2014 2013 2012

38 © 2015 CFI Group. All rights reserved.
While this driver has
remained static at
the aggregate level
(82) for the past
three years, scores
for Product Quality
at the DAAC level
ranged from 77 to 88
in 2015.
Product Quality: Four-year Comparison by DAAC
79
78
78
81
82
77
79
75
80
85
82
81
83
77
81
80
85
83
77
76
77
84
84
83
MODAPS LAADS
NSIDC DAAC
OB.DAAC
ORNL DAAC
PO DAAC-JPL
SEDAC
2015 2014 2013 2012
78
84
88
79
83
81
79
84
86
81
87
83
81
79
88
79
83
83
82
84
89
82
80
85
ASDC-LaRC
ASF SAR DAAC
CDDIS
GES DISC
GHRC
LP DAAC

39 © 2015 CFI Group. All rights reserved.
Of those who
downloaded data,
more than two-thirds
(68%) reported using
software tools or
packages (down
eight percentage
points from 2014).
Python was the most
commonly cited
preferred
programming
language.
Software Tools/Packages Used to Work with Data
Did you use software tools/packages to work with the data?
Used a Software Tool to Work with the Data % N CSI % N CSI
Yes, used software tools 76% 2,157 80 68% 2,330 80
Yes, made my own using programming language 19% 543 82 20% 686 79
No, I couldn´t find what I needed 1% 29 63 2% 76 66
No, I couldn´t understand how to use it 1% 26 63 3% 88 66
No, I did not need software tools 3% 82 83 8% 261 80
Number of Respondents
Preferred Programming Language % N CSI % N CSI
C 7% 144 81 3% 101 81
C++ 11% 238 80 7% 219 80
C# 3% 56 79 1% 45 77
Fortran 77 2% 42 82 2% 51 77
Fortran 90 7% 142 81 6% 167 82
Java 10% 222 81 10% 291 80
Perl 1% 30 86 1% 32 84
PHP 1% 27 81 1% 26 78
Python 35% 757 80 35% 1,055 79
Other 23% 499 80 34% 1,029 80
Number of Respondents
3,441
2,157 3,016
2,837
20152014

Driver Detail: Delivery
41 © 2015 CFI Group. All rights reserved.
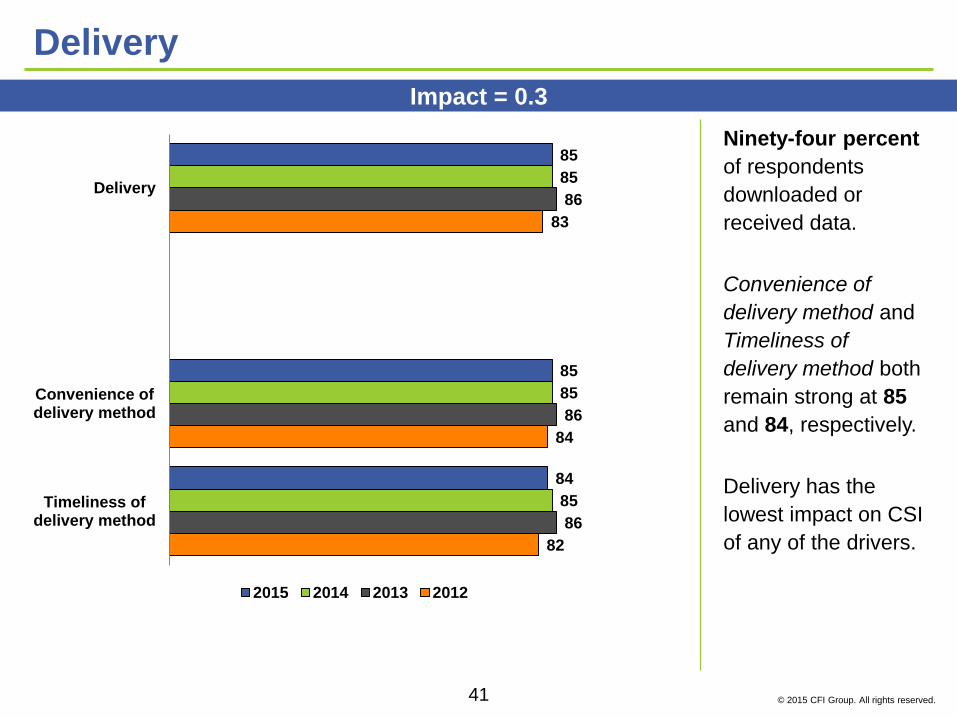
Ninety-four percent
of respondents
downloaded or
received data.
Convenience of
delivery method and
Timeliness of
delivery method both
remain strong at 85
and 84, respectively.
Delivery has the
lowest impact on CSI
of any of the drivers.
Delivery
Impact = 0.3
85
85
84
85
85
85
86
86
86
83
84
82
Delivery
Convenience ofdelivery method
Timeliness ofdelivery method
2015 2014 2013 2012
42 © 2015 CFI Group. All rights reserved.
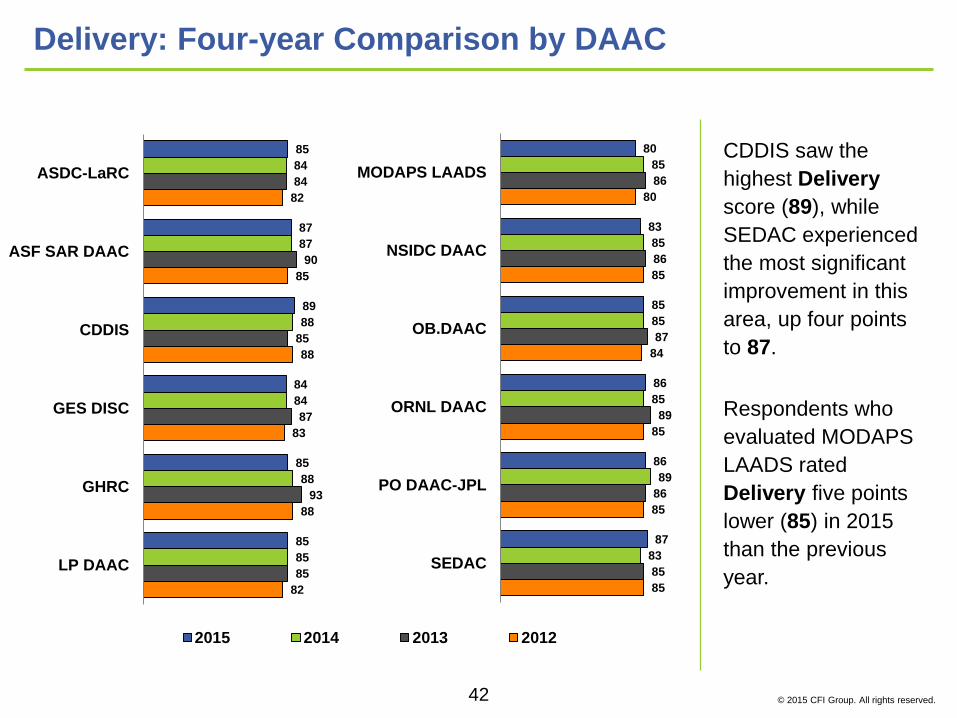
CDDIS saw the
highest Delivery
score (89), while
SEDAC experienced
the most significant
improvement in this
area, up four points
to 87.
Respondents who
evaluated MODAPS
LAADS rated
Delivery five points
lower (85) in 2015
than the previous
year.
Delivery: Four-year Comparison by DAAC
85
87
89
84
85
85
84
87
88
84
88
85
84
90
85
87
93
85
82
85
88
83
88
82
ASDC-LaRC
ASF SAR DAAC
CDDIS
GES DISC
GHRC
LP DAAC
80
83
85
86
86
87
85
85
85
85
89
83
86
86
87
89
86
85
80
85
84
85
85
85
MODAPS LAADS
NSIDC DAAC
OB.DAAC
ORNL DAAC
PO DAAC-JPL
SEDAC
2015 2014 2013 2012

Thank you
Federal Consulting Group
Joshua Labazzetta
Contracting Officer’s Representative
202-208-2790
CFI GROUP WORLDWIDE
MICHIGAN (USA) - Ann Arbor
ENGLAND (UK) – London
SWEDEN - Stockholm
ITALY - Milan
CHINA - Shanghai
BRAZIL - Porto Alegre


