

Technological University Dublin Technological University Dublin
ARROW@TU Dublin ARROW@TU Dublin
Doctoral Science
2011-3
Eco and In Vitro Mammalian Toxicological Assessment of Eco and In Vitro Mammalian Toxicological Assessment of
Polymeric Nanomaterials Polymeric Nanomaterials
Pratap Naha Technological University Dublin
Follow this and additional works at: https://arrow.tudublin.ie/sciendoc
Recommended Citation Recommended Citation Naha, P. (2011). Eco and In Vitro Mammalian Toxicological Assessment of Polymeric Nanomaterials. Doctoral Thesis. Technological University Dublin. doi:10.21427/D7VS31
This Theses, Ph.D is brought to you for free and open access by the Science at ARROW@TU Dublin. It has been accepted for inclusion in Doctoral by an authorized administrator of ARROW@TU Dublin. For more information, please contact [email protected], [email protected].
This work is licensed under a Creative Commons Attribution-Noncommercial-Share Alike 4.0 License
Eco and In Vitro Mammalian Toxicological Assessment of Polymeric nanomaterials
By
Pratap C. Naha (M. Pharm; Pharmacology)
A thesis submitted to the Dublin Institute of Technology for the degree of Doctor of Philosophy (Ph.D)
RESC & NanoLab; FOCAS research Institute School of Physics
Dublin Institute of Technology
Kevin Street, Dublin 8
Supervisor
Prof. Hugh J. Byrne
March 2011
Abstract
i
Abstract
Eco and in vitro mammalian toxicological assessment of N-isopropylacrylamide
(NIPAM) / N-tert-butylacrylamide (BAM) copolymer nanoparticles and Poly-
amidoamine (PAMAM) dendrimers were performed in a range of test models. The
particle sizes of the copolymer nanoparticles and PAMAM dendrimers (G4, G5 and G6)
were measured in Milli-Q water, Algae Media, Daphnia Media, Microtox Diluent and
cell culture media. The zeta potential of PNIPAM (Poly- N-isopropylacrylamide) and
NIPAM/BAM copolymer nanoparticles measured in the different media was seen to
correlate well with the ratio of BAM monomer and therefore the hydrophobicity of the
particles. Ecotoxicological studies of the NIPAM/BAM copolymer nanoparticles and
PAMAM dendrimers was performed using four test species; Vibrio fischeri,
Pseudokirchneriella subcapitata, Daphnia magna, Thamnocephalus platyurus. The
cytotoxicity of PNIPAM, NIPAM/BAM 85:15 copolymer nanoparticles and PAMAM
dendrimers (G4, G5 and G6) was evaluated in RTG-2 (rainbow trout gonadal cells) and
PLHC-1 (hepatocellular carcinoma in an adult female topminnow (Poeciliopsis lucida)
cells. The generation of intracellular reactive oxygen species, genotoxicity and
apoptosis was evaluated upon the exposure of PLHC-1 cells to PAMAM dendrimers.
The mammalian cyto- and geno- toxicity of PNIPAM nanoparticles were analysed in
HaCaT (an immortal non-cancerous human keratinocyte cell line) and SW 480 (a
primary adenocarcinoma cell line of the colon) cells. The immunotoxicity of PAMAM
dendrimers was evaluated in mouse macrophages (J774A.1 cells). Inflammatory
markers like IL-6 (Interleukin-6), TNF-α (Tumour necrosis factor-α) and MIP-2
(Macrophage inflammatory protein-2) expression were measured by ELISA (Enzyme
linked immuno sorbent assay). In the case of the NIPAM/BAM series of nanoparticles,
Abstract
ii
the ecotoxicological response was seen to vary systematically with the ratio of BAM
monomer and therefore with the zeta potential of the nanoparticles. The toxic response
in Daphnia magna was seen to also vary systematically with the reduction in zeta
potential pointing towards a contribution of secondary effects due to modification of the
medium. PNIPAM nanoparticles show excellent biocompatibility in HaCaT
(immortalised non-cancerous human keratinocyte) and SW480 (primary
adenocarcinoma of colon) cells, as no significant cyto or genotoxicity response has been
observed even at high dose, although the particles were internalised by the cells within
24h.
In the case of PAMAM dendrimers, a significant eco and cytotoxicological response
was recorded at particle concentrations from 0.129 µM (7.4 mg l-1) to 16.55 µM (235.1
mg l-1) and Daphnia magna was found to be the most sensitive test species, the RTG-2
fish cell line the least sensitive. Consistent with the results of the cytotoxicity assays, a
generation dependent intracellular ROS, DNA damage and apoptosis was observed in
PLHC-1 cells upon exposure to PAMAM dendrimers. The immunotoxicity of PAMAM
dendrimers was investigated in mouse macrophage cells (J774A.1) in vitro within a
concentration range of 0.013 to 6 µM. A generation dependent immunotoxicological
response of PAMAM dendrimer was observed (G6 > G5 > G4). A similar generation
dependence of the increased production of intracellular ROS and inflammatory
mediators was observed. The toxicological response of PAMAM dendrimers varied
systematically with the dendrimer generation and therefore with the number of surface
amino groups per particle. The mechanism of the toxic response is proposed to be one
of localisation of the cationic particles in the mitochondria, leading to significant
increase in ROS generation, induction of cytokines production, DNA damage, apoptosis
and ultimately cell death. For the cell lines, although spectroscopic studies indicated an

Abstract
iii
interaction with the serum supplement, trends for this interaction do not correlate to
those observed for the toxic response. The clear and systematic variations of the
observed toxic response with the measured physico-chemical properties point towards
underlying structure activity relationships.
Declaration
iv
Declaration
I certify that this thesis which I now submit for examination for the award Doctor of
Philosophy (Ph.D), is entirely my own work and has not been taken from the work of
others, and to the extent that such work has been cited and acknowledged within the text
of my work.
This thesis was prepared according to the regulations for postgraduate study by research
of the Dublin Institute of Technology and has not been submitted in whole or in part for
an award in any other Institute or University.
The work reported in this thesis conforms to the principles and requirements of the
Institiute’s guidelines for ethics in research.
The Institute has permission to keep, or lend or to copy this thesis in whole or in part,
on condition that any such use of the material or the thesis be duly acknowledged.
Signature ___________________________________ Date ____/____/____ Candidate
Acknowledgement
v
Acknowledgements
I would like to sincerely thank the following people without whom the completion of
this thesis would not have been possible. First of all, I would like to thank my
supervisor Prof. Hugh. J. Byrne. It wouldn’t have been possible to do this work without
all his supervision and constructive ideas. His compassionate nature and great
knowledge in every aspect of life are the qualities to be emulated. I would also like to
present my gratitude to Dr. Maria Davoren who guided and encouraged me at the initial
stage of my Ph.D. I would like to specially thank them both for letting me develop my
skill in taking initiative of difficult endeavour and see through its end.
Special thanks to Prof. Kenneth A. Dawson and Dr. Iseult Lynch from the Centre for
BioNano Interactions (CBNI) University College Dublin, Belfield, Dublin 4, Ireland for
provide us NIPAM/BAM series of nanoparticles for my toxicological study under the
INSPIRE collaboration.
I would like to present my gratitude to Dr. Fiona Lyng, manager RESC for providing
me with the lab space and helping me with experiments. I also thank to Dr. Kunal
Bhattacharya and Dr. Alan Casey for their help in performing nanoparticles
genotoxicity and metrology studies. I would present my thanks to the technical staff of
RESC Mrs. Amaya Gracia and Karina Carey for their help with experiments. Finally, a
huge thanks to all the postdoctoral and postgraduate fellows in RESC and NanoLab
research centre, Focas Institute for making my time fruitful and enjoyable here.
At every step of my venture my beloved Mother, Father and Brother shared with me all
the moments of different colours with immense of love and ever available patience. My
respect and profound affection for them is beyond the range of inscription of words.
They are really emblems of love and care.

Abbreviation
vi
Abbreviations
AB Alamar Blue™
ABTS 2,2’-Azino-Bis(3-Ethylbenzthiazolin-6-Sulfonic acid)
AFM Atomic force microscopy
AK Adenylate kinase
AM Algae media
ANOVA Analysis of variances
AP-1 Activator protein 1
ApoE Apolipoprotein E
Apop Apoptotic cells
ATCC American type culture collection
BAM N-tert-butylacrylamide
BEAS-2B Normal human bronchial epithelial cell line
BSA Bovine serum albumin
Ca Calcium
Carboxy-H2DCFDA 6-carboxy-2',7'-dichlorodihydrofluorescein diacetate
CLSM Confocal laser scanning microscope
CO2 Carbon dioxide
CI Confidence interval
COX-2 Cyclooxygenase-2
DLS Dynamic light scattering
DM Daphnia media
DMEM-F12 Dubecco’s modified essential medium-F12 nutrient mix
DMSO Dimethylsulfoxide

Abbreviation
vii
DNA Deoxyribonucleic acid
EC European Commission
EC50 Effective concentration leading to a 50% response
ECACC European collection of cell cultures
EDTA Ethylenediaminetetraacetic acid
ELISA Enzyme linked immunosorbant assay
ENU Ethyl Nitrosourea
EPA Environmental Protection Agency
EtOH Ethanol
FACS Fluorescence associated cell sorter
FBS Foetal bovine serum
Fe Iron
FITC Fluorescein isothiocyanate
FP7 7th Research Framework Programme
FU Fluorescent units
GSH glutathione
h Hours
H2O2 Hydrogen peroxide
HaCaT Normal human keratinocyte cell line
HRP Horseradish peroxidise
IgG Immunoglobulin G
IL Interleukin
iNOS Inducible nitric oxide synthase
J774A.1 Mouse macrophage cells
LPS Lipopolysaccharide
Abbreviation
viii
mA milliampere
MCP-1 Macrophage-chemoattractant protein-1
MD Microtox diluents
Mg Magnesium
MIP Macrophage inflammatory protein
mM millimolar
ml millilitre
µM Micromolar
µl microliter
mRNA Messenger RNA
Mt Mitochondria
MTT 3-(4,5-Dimethylthiazol-2-yl)-2,5diphenyltetrazoliumbromid
mV millivolt
NADPH reduced nicotinamide adenine dinucleotide phosphate
Nec Necrotic cell
NIPAM N-isopropylacrylamide
NF-Κb Nuclear factor-κ-B
nm Nanometer
NPs Nanoparticles
NR Neutral Red
Nuc Nucleus
OECD Organisation for Economic Development
8-OHdG 8-hydroxy-2'-deoxyguanosine
OTM Olive Tail Moment
PAMAM Poly (amido)amine
Abbreviation
ix
PBS Phosphate buffered saline
PBS-T Phosphate buffer saline with 0.05% of Tween 20
PCR Polymerase chain reaction
PGE2 Prostaglandin E2
PI Propidium iodide
PLHC-1 Hepatocellular carcinoma cells (Poeciliopsis lucida)
PNIPAM Poly-N-isopropylacrylamide
ppm Parts per million
RNA Ribonucleic acid
ROS Reactive oxygen species
RT Room temperature
RTG-2 Rainbow trout gonadal cells
RT-PCR Reverse transcriptase PCR
RRR Reduction, Replacement and Refinement
SD Standard deviation
SDS Sodium dodecylsulphate
SW 480 Primary adenocarcinoma cell line of colon
TEM Transmission electron microscopy
TiO2 Titanium dioxide
TNF-α Tumour-necrosis-factor-α
TM Thamnocephallus media
Tween Polysorbate
UV ultraviolet
Table of contents
x
Table of Contents
Abstract ..............................................................................................................................i Declaration .......................................................................................................................iv Acknowledgements ...........................................................................................................v Abbreviations ...................................................................................................................vi Table of Contents ..............................................................................................................x List of Tables..................................................................................................................xiii List of Figures .................................................................................................................xv Chapter 1 ...........................................................................................................................1
1. Introduction ...............................................................................................................2 1.1 Introduction to Nanotechnology .........................................................................2 1.2 Polymeric nanoparticles ......................................................................................3
1.2.1 PNIPAM and NIPAM/BAM nanoparticles .................................................5 1.2.2 PAMAM dendrimers....................................................................................7
1.3 Nanotoxicology...................................................................................................9 1.4 Eco (Nano) Toxicology.....................................................................................11 1.5 Aims, Objectives and Methodology..................................................................12
References ...................................................................................................................21 Chapter 2 .........................................................................................................................32
2. Materials and Experimental protocols ....................................................................33 2.1 Materials............................................................................................................33
2.1.1 PNIPAM and NIPAM/BAM co-polymer nanoparticles ............................33 2.1.2 PAMAM (Poly amidoamine) dendrimers..................................................33
2.2 Experimental protocol.......................................................................................34 2.2.1 Particle Characterisation ............................................................................34
2.2.1.1 Particle size measurement ...................................................................34 2.2.1.2 Zeta potential measurement ................................................................36 2.2.1.3 Spectroscopic analysis ........................................................................36 2.2.1.4 Surface Area measurement .................................................................37 2.2.1.5 Transmission electron microscopy (TEM) study................................38
2.2.2 Ecotoxicity tests .........................................................................................38 2.2.2.1 Microtox® test .....................................................................................38 2.2.2.2 Microalgae growth inhibition assay....................................................40 2.2.2.3 Thamnotoxkit FTM...............................................................................43 2.2.2.4 Daphnia magna acute immobilisation assay .......................................45 2.2.2.5 Cell culture ..........................................................................................47 2.2.2.6 Cytotoxicity assays. ............................................................................49 2.2.2.7 Internalisation study of fluorescently labelled PNIPAM nanoparticles.........................................................................................................................52 2.2.2.8 Study of Co-localisation of the fluorescently labelled PNIPAM nanoparticles with lysosomes..........................................................................53 2.2.2.9 Intracellular Reactive Oxygen Species (ROS)....................................54 2.2.2.10 Cytokines assay.................................................................................57 2.2.2.11 Oxidative DNA damage....................................................................59 2.2.2.12 Alkaline Comet assay........................................................................63 2.2.2.13 Apoptosis assay.................................................................................64 2.2.2.14 Statistics ............................................................................................65
Table of contents
xi
References ...................................................................................................................67 Chapter 3 .........................................................................................................................70
3.1. Introduction ..........................................................................................................71 3.2 Experimental methods...........................................................................................72 3.3 Results ...................................................................................................................72
3.3.1 Nanoparticles characterisation .......................................................................72 3.3.1.1 Particle size measurement .......................................................................72 3.3.1.2 Zeta potential measurement ....................................................................75 3.3.1.3 Surface Area measurement .....................................................................76
3.3.2 Ecotoxicity .....................................................................................................77 3.3.2.1 Ecotoxicity test results with PNIPAM ....................................................83 3.3.2.2 Ecotoxicity test results with NIPAM/BAM 85:15..................................84 3.3.2.3 Ecotoxicity tests with NIPAM/BAM 65:35............................................85 3.3.2.4 Ecotoxicity tests with NIPAM/BAM 50:50............................................86
3.4 Discussion .............................................................................................................87 3.5 Conclusions ...........................................................................................................94 References ...................................................................................................................96
Chapter 4 .......................................................................................................................101 4.1 Introduction .........................................................................................................102 4.2 Experimental methods.........................................................................................103 4.3 Results .................................................................................................................103
4.3.1 Characterisation of PNIPAM nanoparticles.................................................103 4.3.2 Intracellular uptake study.............................................................................106 4.3.3 Cytotoxicity assessment of PNIPAM nanoparticles ....................................112 4.3.4 Genotoxicity assessment of PNIPAM nanoparticles ...................................114
4.4 Discussion ...........................................................................................................117 4.4.1 Characterisation of PNIPAM nanoparticles.................................................117 4.4.2 Intracellular uptake study.............................................................................118 4.4.3 Cytotoxicity..................................................................................................118 4.4.4 Genotoxicity.................................................................................................119
4.5 Conclusion ..........................................................................................................121 References .................................................................................................................122
Chapter 5 .......................................................................................................................129 5.1 Introduction .........................................................................................................130 5.2 Experimental methods.........................................................................................131 5.3 Results .................................................................................................................132
5.3.1 Characterisation of particles.........................................................................132 5.3.1.1 Particle size ...........................................................................................132 5.3.1.2 Zeta potential.........................................................................................133 5.3.1.3 Spectroscopic analysis ..........................................................................134
5.3.2 Ecotoxicity ...................................................................................................136 5.3.2.1 Ecotoxicity tests with PAMAM Dendrimer G4, G5 and G6 ................137
5.4 Discussion ...........................................................................................................144 5.5 Conclusion ..........................................................................................................149 References .................................................................................................................150
Chapter 6 .......................................................................................................................156 6.1 Introduction .........................................................................................................157 6.2 Experimental methods.........................................................................................159 6.3 Results .................................................................................................................159
6.3.1 Particle characterization and Cytotoxicity ...................................................159

Table of contents
xii
6.3.2 Intracellular reactive oxygen species (ROS)................................................159 6.3.3 Genotoxicity response of PAMAM dendrimers ..........................................165 6.3.4 8-OHdG assay ..............................................................................................170 6.3.5 Apoptosis Assay...........................................................................................171
6.4 Discussion ...........................................................................................................176 6.5 Conclusion ..........................................................................................................180 References .................................................................................................................181
Chapter 7 .......................................................................................................................184 7.1 Introduction .........................................................................................................185 7.2 Experimental methods.........................................................................................187 7.3 Results .................................................................................................................187
7.3.1 Characterisation of PAMAM dendrimers ....................................................187 7.3.2 Cytotoxicity assay ........................................................................................188 7.3.3 Intracellular Reactive oxygen species (ROS) ..............................................191 7.3.4 Cytokines production ...................................................................................196
7.3.4.1 Macrophage inflammatory protein-2 (MIP-2) ......................................196 7.3.4.2 Interleukin-6 (IL-6) ...............................................................................198 7.3.4.3 Tumour necrosis factor-α (TNF-α) ......................................................199
7.4 Discussion ...........................................................................................................202 7.5 Conclusions .........................................................................................................209 Reference...................................................................................................................210
Chapter 8 .......................................................................................................................217 References .................................................................................................................224
Appendices....................................................................................................................225 Appendix I: Supporting Information.........................................................................226
1.1 PNIPAM and NIPAM/BAM co-polymer nanoparticles .............................226 1.2 Transmission electron microscopy (TEM) study....................................227
Appendix II: Publications .........................................................................................229 Appendix III: Presentations.......................................................................................231 Appendix IVI: Conference and Workshop Attendance ............................................232
Curriculum Vitae...........................................................................................................233
List of Table
xiii
List of Tables
Table 2.1. Composition of stock solutions for Jaworskis algal media.
Table 3.1. Hydrodynamic diameter of PNIPAM and NIPAM/BAM copolymer
nanoparticles in different test media and temperature.
Table 3.2. Ecotoxicity data for poly-N-isopropylacrylamide P(NIPAM) nanoparticles on
selected test species and endpoints.
Table 3.3. Ecotoxicity data for N-isopropylacrylamide-co-N-tert-butylacrylamide
(NIPAM/BAM 85:15) copolymer nanoparticles on selected test species and
endpoints.
Table 3.4. Ecotoxicity data for N-isopropylacrylamide-co-N-tert-butylacrylamide
(NIPAM/BAM 65:35) copolymer nanoparticles on selected test species and
endpoints.
Table 3.5. Ecotoxicity data for N-isopropylacrylamide-co-N-tert-butylacrylamide
(NIPAM/BAM 50:50) copolymer nanoparticles on selected test species and
endpoints
Table 4.2. Zeta potential of NIPAM nanoparticles in different media
Table 5.1. Hydrodynamic diameter of PAMAM dendrimers in different test media.
Table 5.2: Ecotoxicity of PAMAM dendrimer G4.
Table 5.3 :Ecotoxicity of PAMAM dendrimer G5.
Table 5.4: Ecotoxicity of PAMAM dendrimer G6.
Table 6.1. Level of 8-OHdG formation upon the exposure of PAMAM dendrimers to
PLHC-1 cells.

List of Table
xiv
Table 6.2. Percentage of cell population in different stages of apoptosis upon the
exposure of PAMAM dendrimers in PLHC-1 cells at 6h exposure.
Table 6.3. Percentage of cell population in different stages of apoptosis upon the
exposure of PAMAM dendrimers in PLHC-1 cells at 12h exposure.
Table 6.4. Percentage of cell population in different stages of apoptosis upon the
exposure of PAMAM dendrimers in PLHC-1 cells at 24h exposure
Table 7.1. Zeta potential of PAMAM dendrimers in different media
Table 7.2. EC50 data of PAMAM dendrimer G4, G5 and G6 in Alamar blue (AB) and
MTT assay for 24 hour exposure in J774A.1 cells.
List of Figures
xv
List of Figures
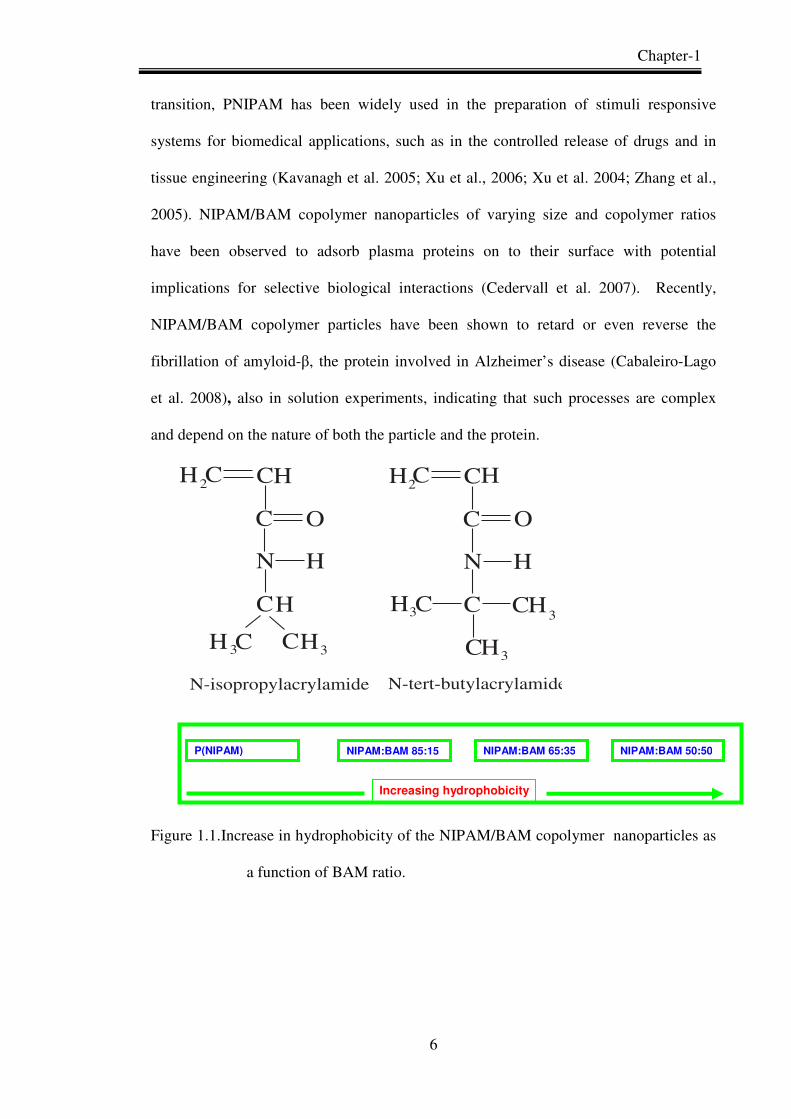
Figure 1.1. Increase in hydrophobicity of the NIPAM/BAM copolymer nanoparticles as
a function of BAM ratio.
Figure 1.2. PAMAM dendrimer G4
Figure 1.3. Fresh water ecosystem representing different trophic levels.
Figure 2.1. PAMAM dendrimer G4 , G5 and G6
Figure 2. 2. Schematic diagram of a conventional dynamic light scattering instrument.
Figure 2.3. Microtox® Model 500 analyser and the Morphology of Vibrio fischeri.
Figure 2.4. Morphology of Pseudokirchneriella subcapitata.
Figure 2.5. Morphology of Thamnocephalus platyurus
Figure 2.6. Morphology of Daphnia magna
Figure 2.7. Morphology of, A. RTG-2 cells, B. PLHC-1 cells, C. HaCaT cells. D. SW
480 cells, E. J774A.1 cells.
Figure 2.8. Conversion of Caroxy H2DCFDA to DCF
Figure 2.9. Time kinetic study of ROS production with 200 µM of H2O2 exposure to
PLHC-1 cells. The concentration of Carboxyl H2DCFDA used 10 µM.
Figure 2.10. Principle of ELISA (Sandwich technique)
Figure 2.11. Schematic diagram of the conversion of Deoxyguanosine to 8-
hydroxyguanosine.
Figure 3.1. Hydrodynamic diameter of PNIPAM and NIPAM/BAM copolymer
nanoparticles. Figure a, represents for MQ water and figure b, represents
for in Microtox diluent (MD) as a function of increasing temperature.
List of Figures
xvi
Figure 3.2. Zeta potential of PNIPAM and NIPAM/BAM copolymer particles in
different media.
Figure 3.3. Effect of NIPAM and NIPAM/BAM nanoparticles on algal growth
inhibition.
Figure 3.4. Effect of PNIPAM (A); NIPAM/BAM 85:15 (B); NIPAM/BAM 65:35 (C)
and NIPAM/BAM 50:50 (D) particles on immobilisation of Daphnia
magna.
Figure 3.5. Effect of PNIPAM ( ) and NIPAM/BAM 85:15 ( ) (A); NIPAM/BAM
65:35 (B); and NIPAM/BAM 50:50 (C) particles on lethality of
Thamnocephalus platyurus.
Figure 3.6. Cytotoxicity of PNIPAM and NIPAM/BAM nanoparticles in RTG-2 cells.
Figure A. represents for PNIPAM and figure B represents for the
NIPAM/BAM 85:15 nanoparticles.
Figure 3.7. Relationship between 24 hour ( ) and 48 hour ( ) EC50 for immobilisation
of Daphnia magna following exposure to PNIPAM and different
NIPAM/BAM copolymer particles.
Figure 3.8. Effect of PNIPAM and different NIPAM/BAM copolymer nanoparticles on
24 h LC50 in Thamnocephalus platyurus.
Figure 3.9. Effect of zeta potential of different copolymer nanoparticles on
immobilisation of Daphnia magna based on the ( ) 24 hour; ( ) and 48
hour EC50 results.
Figure 3.10. Correlation between change in zeta potential and EC50 in immobilisation of
Daphnia magna with different NIPAM and NIPAM/BAM copolymer.
Figure 4.1. Representative TEM image of the labelled PNIPAM nanoparticles.
List of Figures
xvii
Figure 4.2. Confocal laser scanning micrograph (CLSM) of internalisation of
fluorescent labelled PNIPAM nanoparticles in HaCaT and SW 480 cells
after 24h of exposure. Panel 1 represents the uptake study in the HaCaT
cells and panel 2 represents the uptake study in SW 480 cells.
Figure 4.3. CLSM optical sections (z-sections) of the HaCaT and SW 480 cells showing
the localisation of the nanoparticles at different sections. Each optical
section represents a particular plane of focus and nanoparticles have a
different plane of focus indicating that they are internalised completely.
Panel 1 represents the HaCaT cells (optical section thickness is 0.41 µm),
panel.2 represents the SW 480 cells (optical section thickness is 1.0 µm)
with exposure concentration 50mg/l.
Figure 4.4. CLSM images of co-localisation of NIPAM nanoparticles with lysosomes,
by co-staining the HaCaT cells with lysotracker (green). (1) and (2) are the
24 hour exposure to labelled PNIPAM nanoparticles at concentrations of
30 and 50 mg/l respectively.
Figure 4.5. Cytotoxicological response of HaCaT cells after 24, 48, 72 and 96 h of
exposure to increasing concentrations of PNIPAM nanoparticles.
Figure 4.6. Cytotoxicological response of SW 480 cells after 24, 48, 72 and 96 h of
expo- sure to increasing concentrations of PNIPAM nanoparticles.
Figure 4.7. Genotoxicity response of PNIPAM nanoparticles to HaCaT cells. Panel A
rep- resents the % tail DNA and Panel B represents the olive tail moment
after exposure of the particles at three different time points.
Figure 4.8. Genotoxicity response of PNIPAM nanoparticles to SW 480 cells. Panel A
represents the % tail DNA and Panel B represents the olive tail moment
after exposure of the particles at three different time points.
List of Figures
xviii
Figure 5.1. Zeta potential of PAMAM dendrimer in different test media.
Figure 5.2. Medium interaction study of PAMAM (G4, G5 and G6) dendrimers in
PLHC-1 media by UV-Visible absorption spectroscopy. Figure a. represents
UV-Visible absorption spectra of DMEM F-12 HAM, PLHC-1 and RTG-2
media; Figure b. represents. UV-Visible absorption spectra of RTG-2 media
with PAMAM (G4, G5 and G6) dendrimers. Figure c. represents. UV-
Visible absorption spectra of PLHC-1 media with PAMAM (G4, G5 and
G6) dendrimers.
Figure 5.3. Dose dependent response of PAMAM dendrimers in T. platyurus , Figure A,
B and C represents for the PAMAM dendrimer G4, G5 and G6 respectively.
Figure 5.4. Dose dependent response of PAMAM dendrimers in D.magna , Figure A, B
and C represents for the PAMAM dendrimer G4, G5 and G6 respectively.
Figure 5.5. Cytotoxicity of PAMAM dendrimer in PLHC-1 cells as quantified using the
AB Assay. a, b and c represent G4, G5 and G6 respectively.
Figure 5.6. Cytotoxicity of PAMAM dendrimer in RTG-2 cells as quantified using the
AB Assay. a, b and c represent G4, G5 and G6 respectively.
Figure 5.7. Toxicity profile of PAMAM dendrimers based on EC50/LC50 values in
different test models.
Figure 5.8. Correlation between measured surface areas of PAMAM dendrimers with
EC50/LC50 in different test models
Figure 5.9. Correlation between change of zeta potential and EC50 of PAMAM
dendrimer (G4, G5 and G6) in immobilisation of Daphnia magna.
Figure 6.1 Confocal laser scanning micrograph (CLSM) of PLHC-1 cells showing
intracellular ROS production upon exposure of PAMAM dendrimers to the
PLHC-1 cells.

List of Figures
xix
Figure 6.2 Concentration and time dependent intracellular ROS generation, upon the
exposure of PAMAM dendrimers (A) G4 (B) G5 and (C) G6.
Figure 6.3: Plot showing the generation dependent intracellular ROS production at a
concentration of 0.6µM for G6.
Figure 6.4 (A) Plot showing the relationship between the intracellular ROS production
and the number of surface primary amino group of the PAMAM dendrimers
at 2 hour exposure time period of 0.6µM concentration; (B) relationship
between maximum surface amino group and the intracellular ROS
production in PLHC-1 cells.
Figure 6.5. Representative micrograph showing comets of PLHC-1 cells after 24 hour
exposure of PAMAM dendrimers.
Figure 6.6.Genotoxicity response of PAMAM dendrimers at 6h, 12h and 24h exposure,
Panel A, B and C represents for PAMAM G4, G5 and G6.
Figure 6.7. Generation dependent genotoxicity response of PAMAM dendrimers at 6h,
12h and 24h exposure.
Figure 6.8. Correlation between the % Tail DNA and number of primary surface amino
groups of the PAMAM dendrimers.
Figure 6.9. Correlation between maximum DNA damage and maximum intracellular
ROS production upon the exposure of PAMAM dendrimer G4, G5 and G6.
Figure 6.10.Generation dependent different stages of apoptosis upon the exposure of
PAMAM dendrimers for G4, G5 and G6 at concentration of 5.2, 2 and 1.2
µM respectively in PLHC-1 cells.
Figure 7.1. Comparison of cytotoxicity assay between AB and MTT of (a) G4, (b) G5
and (c) G6 PAMAM dendrimers in J774A.1 cells after 24h exposure. The
data shown in mean ± SD (n=3).
List of Figures
xx
Figure 7.2. (a) Time and generation dependence of toxic response of PAMAM
dendrimers (G4, G5, G6). (b) Correlation between number of surface amino
group and the toxic response of PAMAM dendrimers at 24h exposure (AB
assay).
Figure 7.3. Confocal fluorescence and phase contrast micrographs of intracellular ROS
generation following exposure to (a) negative control, (b) positive control
(H2O2), (c) PAMAM G4, (d) PAMAM G5 and (e) PAMAM G6. The data
are shown after 2h exposure of PAMAM dendrimers.
Figure 7.4. Concentration and time dependent intracellular ROS generation by G4, G5
and G6 at (a) 1, (b) 2, (c) 4 and (d) 6 h exposure time points.
Figure 7.5. (a) generation dependent intracellular reactive oxygen species (ROS)
production following exposure to PAMAM dendrimers (G4, G5 and G6) in
J774A.1 cells at an exposure concentration of 1µM. (b) correlation between
the production of intracellular ROS and number of surface primary amino
groups.
Figure 7.6. The level of MIP-2 secreted after exposure of J774A.1 cells to (a)G4, (b) G5
and (c) G6 PAMAM dendrimers for 6h, 12h, 24h, 48h and 72h.
Figure 7.7. Secretion of IL-6 following exposure of (a) G4, (b) G5 and (c) G6 in
J774A.1 cells at 6, 12, 24and 48 h time points.
Figure 7.8. Secretion of TNF-α upon the exposure of (a) G4, (b) G5 and (c) G6 in
J774A.1 cells at 6, 12, 24 and 48 h time points.
Figure 7.9. Generation dependent MIP-2, IL-6 and TNF-α secretion after 24h exposure
of PAMAM dendrimers (G4, G5 and G6) in J774A.1 cells.
Figure 7.10. Correlation between inflammatory mediator (a) MIP-2, (b) IL-6 and (c)
TNF-α response and the surface area of PAMAM dendrimers (G4, G5 and

List of Figures
xxi
G6). Figure 7.11. Schematic of the systematic sequence of events in
J774A.1 cells following exposure to PAMAM dendrimers.
Figure 7.12. Graphical representation of the of different responses as a function of time
upon the exposure of PAMAM dendrimers( for the case of G4) in J774A.1
cells.

Chapter-1
1
Chapter 1
Introduction, Aims and Objective
Chapter-1
2
1. Introduction
1.1 Introduction to Nanotechnology
Nanotechnology is a new and fast emerging field that involves the design, production,
and explotation of structures at the nanoscale. A nanomaterial is a material that has one
or more external dimensions in the nanoscale or which is nanostructured. A nano-object
with all three external dimensions in the nanoscale is defined as a nanoparticle
(http://www.nanoimpactnet.eu/index.php?page=nomenclature, accessed on 16th June
2011). Nanotechnology can also be defined as the design, synthesis and application of
materials and devices whose size and shape have been engineered at the nanoscale. It
exploits unique chemical, physical, electrical and mechanical properties that emerge
when materials are structured at the nanoscale. Nanotechnology is a highly promising
and exciting technology that spans many areas of science and technological applications
and is one of the hitherto unexplored frontiers of science. It offers a broad range of
exciting prospects for technological innovation. Nanoscience has exploded in the last
decade, primarily as the result of the development of new tools that have made the
characterization and manipulation of nanostructures practical, and also as a result of
new methods for preparation of these physical and chemical structures. Nanotechnology
is a sector of the materials manufacturing industry that has already created a multibillion
market which is widely expected to grow to 1 trillion $US by 2015 (Lux Research).
Numerous applications of nanoparticles are already on the market, in products such as
paints, sunscreens, cosmetics, self-cleaning glass, industrial lubricants, advance tyres,
semiconductor devices and food (Garland 2009, Mueller and Nowack 2008,
Jaroenworaluck, 2006). In the biomedical field, nanotechnology is also projected to
have a significant impact. For example, polymeric nanomaterials such as poly
Chapter-1
3
aminoamide (PAMAM) dendrimers have already been explored for applications such as
targeted drug delivery in cancer therapy, gene delivery and also the mannosylated form
of PAMAM dendrimers are already used in vaccine delivery systems (Sheng et al.,
2008).
Optimisation of nanoparticle design and delivery strategies for such biomedical
applications requires however a detailed understanding of how such nanoparticles
interact with biological fluids, tissues and cells. Cellular uptake mechanisms,
intracellular trafficking, oxidative stress and inflammatory responses have already been
widely explored (see for example the review by Nel et al., 2009), but there is much to be
learned about the dependences on the physico-chemical properties of the particles.
Furthermore, the proliferation of nanotechnology in general has prompted concerns over
the safety of engineered nanoparticles, as exposure to humans and/or the environment
may occur intentionally or accidentally. Therefore it is important to understand the
interaction of nanomaterials with living organisms in terms of potential toxicological
impacts on both the environment and human health. Well characterised, chemically and
physically well defined materials are critical in this respect and, ultimately, quantitative
structure activity relationships (QSARS) governing the interaction of engineered
nanoparticles with organisms and the resultant biological responses are desirable.
The aim of this study was to explore structure activity relationships governing the
toxicological responses model eco and mammalian cell culture systems to polymeric
nanoparticles of systematically varied physico-chemical properties.
1.2 Polymeric nanoparticles
Polymeric nanoparticles have been proposed for a wide range of medical applications in
terms of diagnosis, tissue engineering and as drug delivery devices (Storrie and
Mooney, 2006). Several polymeric micro- and nanoparticles have been used for the
Chapter-1
4
delivery of drugs and therapeutic proteins. In particular, polylactic-co-glycolic acid
(PLGA) and poly-lactic acid (PLA) polymers, which are biodegradable in nature, show
great potential and have been widely used in drug delivery systems (Ito et al., 2008;
Naha et al., 2008 and 2009). Currently, four other nanoparticles, namely polymer
coated iron oxide nanoparticles, PEGylated (process of covalent attachment of
polyethylene glycol) liposomes, dendritic fullerenes, and fullerene derivative
nanoparticles, are being investigated in clinical trials for their anticancer activity
(Dobrovolskaia and McNeil, 2007).
Poly N-isopropylacrylamide (PNIPAM), N-isopropylacrylamide-co- N-tert-
butylacrylamide (NIPAM/BAM) nanoparticles, and Poly (amido) amine (PAMAM)
dendritic nanoparticles have been used in this study. These nanomaterials have
systematically varied physico-chemical properties and were so chosen in an attempt to
explore structure activity relationships governing the toxicological responses. PAMAM
dendrimers also have potential applications as intracellular drug, protein and vaccine
delivery systems.
Poly N-isopropylacrylamide (PNIPAM) nanoparticles have been developed and
proposed for controlled release of ophthalmic drops for glaucoma therapy (Hsiue et al.,
2003; Hsiue et al. 2002). Polyamidoamine (PAMAM) dendrimers are widely used in the
field of biomedical applications, such as drug delivery, targeted drug delivery in cancer
therapy, gene delivery, and also the mannosylated form of PAMAM dendrimers is used
in vaccine delivery systems (Sheng et al., 2008). There was no complete report on
ecotoxicity of PAMAM dendrimers, PNIPAM and NIPAM/BAM series of
nanoparticles are available in the literature.
PAMAM dendrimers are molecularly defined, in that they have a precise molecular
structure and molecular weight. NIPAM/BAM particles are less well defined and have
Chapter-1
5
an average molecular weight, depending on particle size. Although PAMAM
dendrimers may more accurately be defined as macromolecules, throughout this work
they are considered polymeric nanoparticles, for simplicity.
1.2.1 PNIPAM and NIPAM/BAM nanoparticles
Poly N-isopropylacrylamide (PNIPAM) is a well known thermoresponsive polymer
(Hsiue et al. 2002). Thermoresponsive is a general term which means a material
changes its properties as a function of temperature, above or below its Lower Critical
Solution Temperature (LCST), defined as the temperature below which the component
of a mixture are miscible for all components. PNIPAM exhibits a LCST of ~ 32 oC in
aqueous media (Xu et al., 2006). Copolymerisation of NIPAM with the more
hydrophobic monomer N-tert-butylacrylamide (BAM) reduces the LCST of the
resultant co-polymer compared to that of PNIPAM, increasingly so as the ratio of the
BAM monomer in the co-polymer is increased. As the ratio of BAM increases, the
amount of N-H groups exposed at the surface decreases, and the amount of -C-(CH3)3
groups increases, reducing the hydrophillicity of the resulting copolymer (Figure 1.1).
For example, LCSTs for the polymers with monomer ratios NIPAM/BAM 85:15,
NIPAM/BAM 65:35, NIPAM/BAM 50:50 are 25oC, 17oC and 12oC respectively
(Lynch et al., 2005). Adjustment of the LCST to near body temperature (Zhang and
Misra 2007) is essential, particularly for ‘smart’ drug delivery applications (Peppas et
al. 2000; Lin and Metters 2006). Above its LCST, the polymer particles form large
agglomerates and this could be affect to release of the drug from this composite
polymer. As a result, the concentration of the released drug will not reach the minimum
effective concentration (MEC) level in the blood. Thus, it is always necessary to
maintain the LCST near to normal body temperature. Because of this reversible phase
Chapter-1
6
transition, PNIPAM has been widely used in the preparation of stimuli responsive
systems for biomedical applications, such as in the controlled release of drugs and in
tissue engineering (Kavanagh et al. 2005; Xu et al., 2006; Xu et al. 2004; Zhang et al.,
2005). NIPAM/BAM copolymer nanoparticles of varying size and copolymer ratios
have been observed to adsorb plasma proteins on to their surface with potential
implications for selective biological interactions (Cedervall et al. 2007). Recently,
NIPAM/BAM copolymer particles have been shown to retard or even reverse the
fibrillation of amyloid-β, the protein involved in Alzheimer’s disease (Cabaleiro-Lago
et al. 2008), also in solution experiments, indicating that such processes are complex
and depend on the nature of both the particle and the protein.
Figure 1.1.Increase in hydrophobicity of the NIPAM/BAM copolymer nanoparticles as
a function of BAM ratio.
H
C C
C
N
C
33
2 HH
O
C
H
H
CH
H
C C
C
N
C33
2 H
C
H
C
H
O
CH
H3
N,N-dimethylacrylamide N-isopropylacrylamide N-tert-butylacrylamide
P(NIPAM) NIPAM:BAM 50:50 NIPAM:BAM 65:35 NIPAM:BAM 85:15
Increasing hydrophobicity
Chapter-1
7
Notably, in addition to their potential biomedical applications, the variable size and
surface chemistry of such polymeric particles renders them valuable probes of the
underlying structure activity relationships determining biological responses.
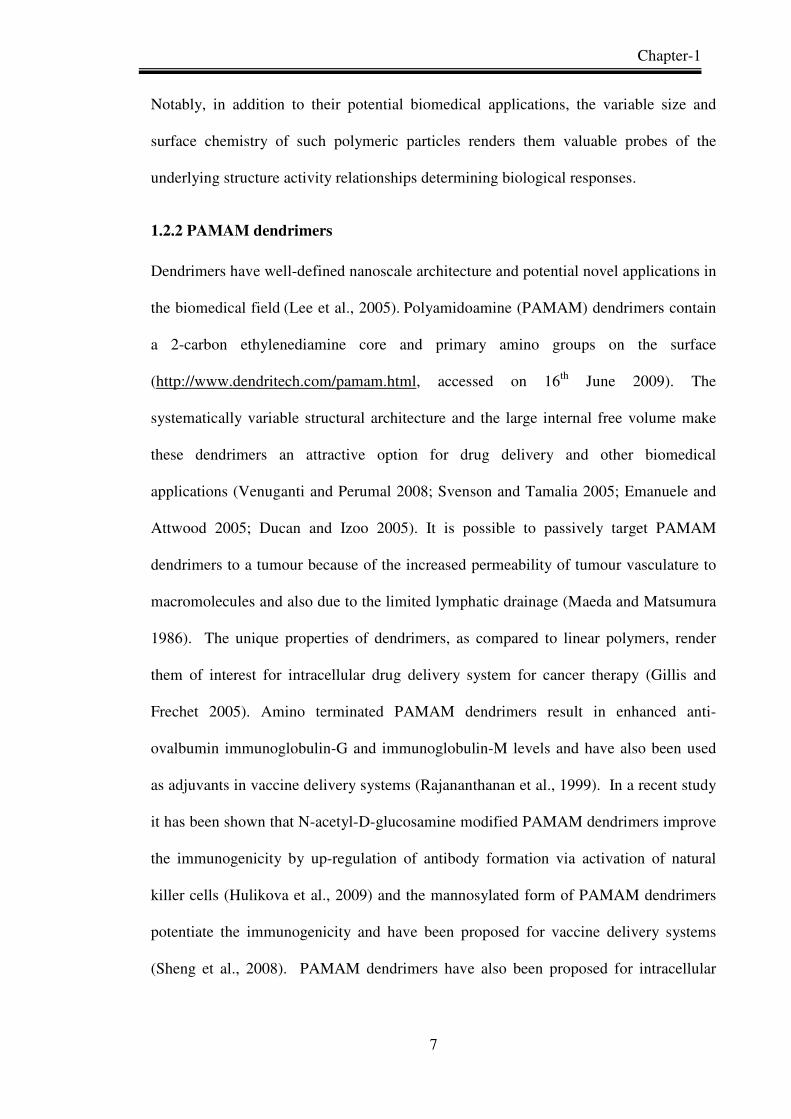
1.2.2 PAMAM dendrimers
Dendrimers have well-defined nanoscale architecture and potential novel applications in
the biomedical field (Lee et al., 2005). Polyamidoamine (PAMAM) dendrimers contain
a 2-carbon ethylenediamine core and primary amino groups on the surface
(http://www.dendritech.com/pamam.html, accessed on 16th June 2009). The
systematically variable structural architecture and the large internal free volume make
these dendrimers an attractive option for drug delivery and other biomedical
applications (Venuganti and Perumal 2008; Svenson and Tamalia 2005; Emanuele and
Attwood 2005; Ducan and Izoo 2005). It is possible to passively target PAMAM
dendrimers to a tumour because of the increased permeability of tumour vasculature to
macromolecules and also due to the limited lymphatic drainage (Maeda and Matsumura
1986). The unique properties of dendrimers, as compared to linear polymers, render
them of interest for intracellular drug delivery system for cancer therapy (Gillis and
Frechet 2005). Amino terminated PAMAM dendrimers result in enhanced anti-
ovalbumin immunoglobulin-G and immunoglobulin-M levels and have also been used
as adjuvants in vaccine delivery systems (Rajananthanan et al., 1999). In a recent study
it has been shown that N-acetyl-D-glucosamine modified PAMAM dendrimers improve
the immunogenicity by up-regulation of antibody formation via activation of natural
killer cells (Hulikova et al., 2009) and the mannosylated form of PAMAM dendrimers
potentiate the immunogenicity and have been proposed for vaccine delivery systems
(Sheng et al., 2008). PAMAM dendrimers have also been proposed for intracellular
Chapter-1
8
drug, protein and vaccine delivery systems. Because of the potential widespread use of
these systems, a complete evaluation of their toxicology to humans is required.
Furthermore, although not yet in widespread use, future uses may result in significant
environmental exposure, notably in fresh water via industrial effluent and domestic
waste, warranting a comprehensive ecotoxicological study in a model freshwater
ecosystem.
Figure 1.2. PAMAM dendrimer G4 (Lubic, 2009. Environ. Sci. Technol. 43, 1247–
1249).
For the purpose of this work, similar to the NIPAM/BAM based structures, the
structurally well defined and variable macromolecules can also provide a further basis
upon which to establish structure activity relationships governing eco- and mammalian
toxicological responses which may serve to develop a fundamental understanding of
their interactions and as guidelines for the future prediction of responses.

Chapter-1
9
1.3 Nanotoxicology Nanotoxicology is an evolving sub-specialty of particle toxicology. It addresses the
toxicology of nanoparticles, which in general appear to elicit toxic effects that are
peculiar and not seen with larger particles. The important mechanistic toxicity pathways
of different nanoparticles are intracellular reactive oxygen species (ROS) production,
expression of inflammatory markers, DNA adduct formation, DNA damage,
chromosomal aberration, mutation, apoptosis and finally cell death. To date, typical
nanoparticles that have been studied are titanium dioxide, alumina, zinc oxide, carbon
black, carbon nanotubes, and "nano-C60" (Brown et al., 2001, 2004; Vevers etal., 2008;
Jeng et al., 2006; Colvin et al., 2003; Herzog et al., 2007; Davoren et al., 2007). Surface
area is also an important factor in the toxicity of a nanoparticle, as the greater the
surface area, the more reactive centers are exposed to the cellular environment, and the
more pro-inflammatory and toxic effects’ (Brown et al., 2001; Stoeger et al., 2009). In
addition, some nanoparticles seem to be able to translocate from their site of deposition
to more remote sites such as the blood and the brain (Wang et al., 2008). This has
resulted in a dramatic change in how particle toxicology is viewed. Instead of being
confined to the lungs, nanoparticle toxicologists now study the brain, blood, liver, skin
and gut. Nanotoxicology has therefore revolutionised and rejuvenated the field of
particle toxicology. The smaller a particle is, the larger its surface area to volume ratio
and thus the associated chemical and biological activity of the material is increased. The
greater chemical reactivity of nanomaterials results, for example, in increased
production of reactive oxygen species (ROS) (Nel et al., 2006; Stoeger et al., 2009),
including free radicals.
Reactive Oxygen species in mammalian cells include Hydroxyl radicals (•OH),
Hydroxyl ion (OH-), Superoxide anion (O2-), Singlet oxygen (1O2), Hydrogen peroxide

Chapter-1
10
(H2O2) and Hypochlorite ion (OCl-) and increased production acts to suppress the
antioxidant system and results in oxidative stress. Oxidative stress is an imbalance of
the intracellular redox equilibrium and can cause localised degradation of organelles.
Oxidative stress leads to inflammation, a biological response of tissues to harmful
stimuli, such as pathogens, damaged cells, or irritants (pollutant, nanomaterials etc) and
genotoxicity effects, in which the genetic material (DNA) is damaged. The effects are
likely to be DNA damage, micronucleus formation, chromosomal aberrations or the
formation of DNA adducts. An excess of ROS can cause oxidation of lipids, proteins,
DNA etc and the adverse effects depend upon the different species of ROS. For
example, hydroxyl radical can lead to adduct formation in the base pairs of DNA, such
as 8-OHdG (8-hydroxy2’-deoxyguanosine), which mediates the pathophysiology of a
wide variety of diseases including cancer, atherosclerosis, neurodegenerative disorders
and the aging process (Halliwell and Gutteridge, 1999). In the case of nanotoxicology,
increased levels of intracellular ROS as a result of nanoparticle exposure has been
identified as a fundamental precursor to inflammation, genotoxicity and apoptosis (Xia
et al., 2006). Oxidative stress induces signaling pathways of MAPK and transcription
factors such as NFkB, AP-1. These transcription factors induce mRNA expression of
pro-inflammatory mediators, finally causing inflammation. Persistent inflammation can
lead to cell damage, induced by chemical/physical injury, anoxia or nanoparticles. Cell
damage means leakage of cell contents into the adjacent tissues, resulting in the
capillary transmigration of granulocytes to the injured tissue. The accumulation of
neutrophils and release of enzymes and oxygen radicals enhances the inflammatory
reaction which will lead to apoptotic cell death.
Increased ROS production has been found for a diverse range of nanomaterials
including fullerenes, carbon nanotubes and metal oxide nanoparticles. ROS and free
Chapter-1
11
radical production is one of the primary mechanisms of nanoparticle toxicity, it may
result in oxidative stress, inflammation and consequent damage to proteins, membranes
and DNA (Risom et al., 2005).
Despite the increasing body of literature relating to the toxicity of nanoparticles, there
remains a dearth of systematic studies in which the physic-chemical properties of the
nanoparticles are systematically varied and the toxicological response and mechanism
monitored and related to the particle variations. In this study, the toxicological response
to systematically varied polymeric nanoparticle exposure is monitored in mammalian
cell lines in vitro. Although in vitro cell lines are only an approximation of in vivo
studies, it is anticipated that the systematic variation of the polymeric nanoparticle
properties can point towards structure activity relationships governing the responses and
help elucidate underlying mechanisms. Mouse macrophage, as well as human skin and
intestinal models are used.
1.4 Eco (Nano) Toxicology In addition to potential hazards to humans, those to the environment should also be
considered. The assessment of environmental effects of nanoparticles requires an
understanding, for example, of their mobility, reactivity, ecotoxicity and persistency
(Nowack and Buchelli, 2007). Recently reports on the ecotoxicity of various
nanomaterials have started to emerge in the literature. Of the studies conducted to date,
the majority have focused on carbon based materials (Lovern and Klaper, 2006; Zhu et
al., 2006; Cheng et al., 2007; Lin and Xing, 2007; Smith et al., 2007; Baun et al., 2008;
Lovern et al., 2007) but there have also been reports of ecotoxicological studies of
various metal based nanoparticulate materials (Lovern et al., 2007; Federici et al., 2007;
Heinlaan et al., 2008; Gagńe et al., 2008; Mortimer et al., 2008) as well as polymeric
dendrimers (Mortimer et al., 2008). A recent study has explored the toxicity of

Chapter-1
12
PAMAM dendrimers (G 3.5 and G4) in a zebra fish embryo model (Heiden et al.,
2007).
1.5 Aims, Objectives and Methodology Due to the potential widespread use of both series of polymeric nanomaterials
(PAMAM dendrimers, PNIPAM and NIPAM/BAM copolymer nanoparticles), there is
an increasing need for information regarding the human health and environmental
implications of exposure to these polymeric nanomaterials. The structurally well
defined and variable macromolecules can also provide a further basis upon which to
establish structure activity relationships governing eco and mammalian-toxicological
responses which may serve to develop a fundamental understanding of their interactions
and as guidelines for the future prediction of responses. However, the field of eco-
(nano) toxicology is still relatively new and there is a dearth of quantitative structure
activity relationships established for nanomaterials.
To date, little is known about the metabolism and excretion, ecotoxicity and in vitro
mammalian toxicity for the case of PNIPAM and the NIPAM/BAM series of NPs.
These particles were chosen under the INSPIRE collaborative programme as model
particles due to their variable physico-chemical properties. For the case of the PAMAM
dendrimers, no complete ecotoxicity data set is available, although a recent study has
explored the toxicity of PAMAM dendrimers (G 3.5 and G-4) in a zebra fish embryo
model (Heiden, et al., 2007). In this study, ecotoxicological assessment is performed in
a range of fresh water ecological organisms, constituting a multi-trophic model eco-
system. In comparison, there are several reports on the mammalian toxicity of PAMAM
dendrimers. They have been shown to reduce the transmembrane potential and hinder
the influx of Ca2+ ions to the mitochondria (Labieniec and Gabryelak 2008).
Mitochondrial Ca2+ overload in combination with oxidative stress and ATP depletion

Chapter-1
13
induces mitochondrial permeability which results in ischemia reperfusion, oxidative
stress and apoptosis (Vergun and Reynolds, 2005). The toxicity of PAMAM
dendrimers in mammalian cells has been demonstrated to depend upon the generation
and surface functional groups (Roberts et al., 1996; Malik et al., 2000). They have been
shown to induce membrane disruption, including the formation of holes and membrane
erosion in supported lipid bilayers (Leroueil et al., 2007 and 2008; Hong et al., 2004). A
recent study shows that the pathway of the toxic response induced by PAMAM
dendrimers is by apoptosis mediated by mitochondrial dysfunction. (Lee et al., 2009).
However, despite their proposed applications, the pharmacokinetics i.e ADME
(Absorption, Distribution, Metabolism and Excretion) of PAMAM dendrimers is still
unclear.
PAMAM dendrimers are chemically stable and soluble in water, and thus it can
reasonably be expected that they will remain in an intact form in the environment, at
least in the earlier stages. In order to assess the potential environmental and human
impact of these materials, a systematic battery of bioassays representing multitrophic
levels of a fresh water ecosystem was employed for the ecotoxicological study, while in
vitro cell models were employed for the mammalian toxicological study.
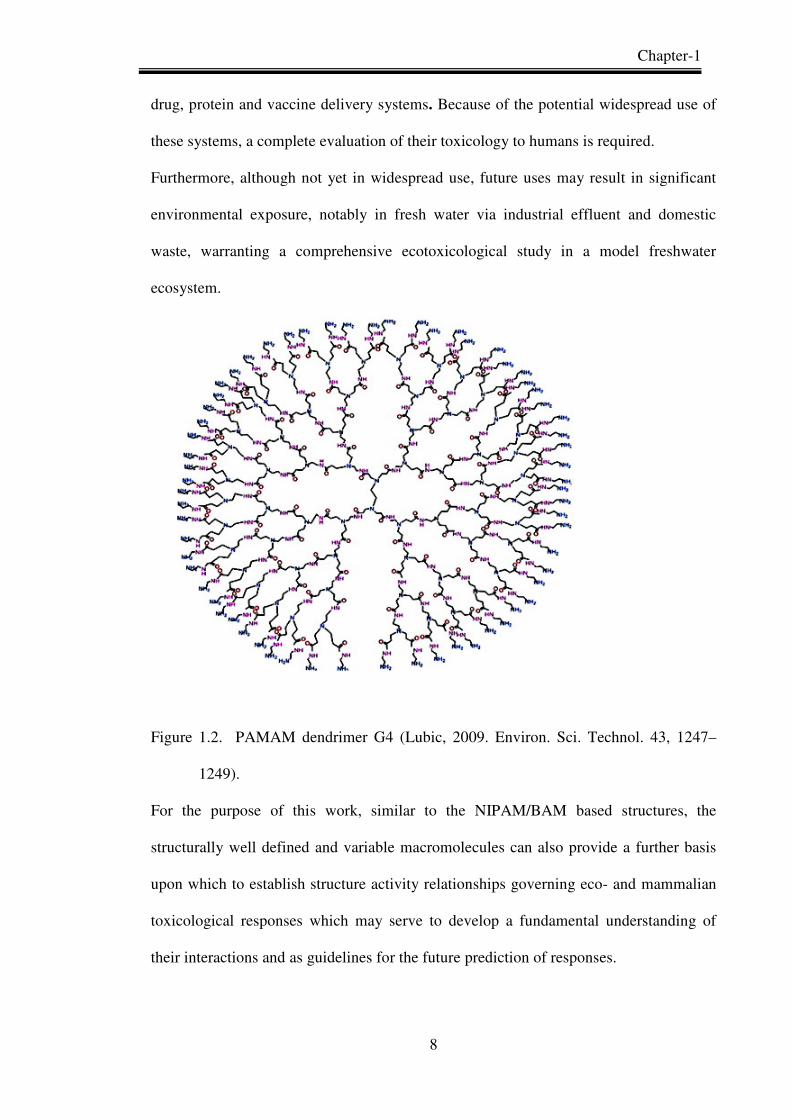
In this study, ecotoxicological assessment of nanoparticles is probed using various
aquatic species representing the different trophic levels (decomposer, primary producer,
invertebrates and vertebrates), as shown in figure 1.3. Assessment of the toxicological
response to nanoparticle exposure of all the fresh water ecological test models is carried
out according to international guide lines, described in section 2.2.2, of chapter 2. In
brief, Vibrio fischeri is a marine bacterium which acts as a decomposer;
Pseudokirchneriella subcapitata acts as a primary producer; Thamnocephalus platyurus
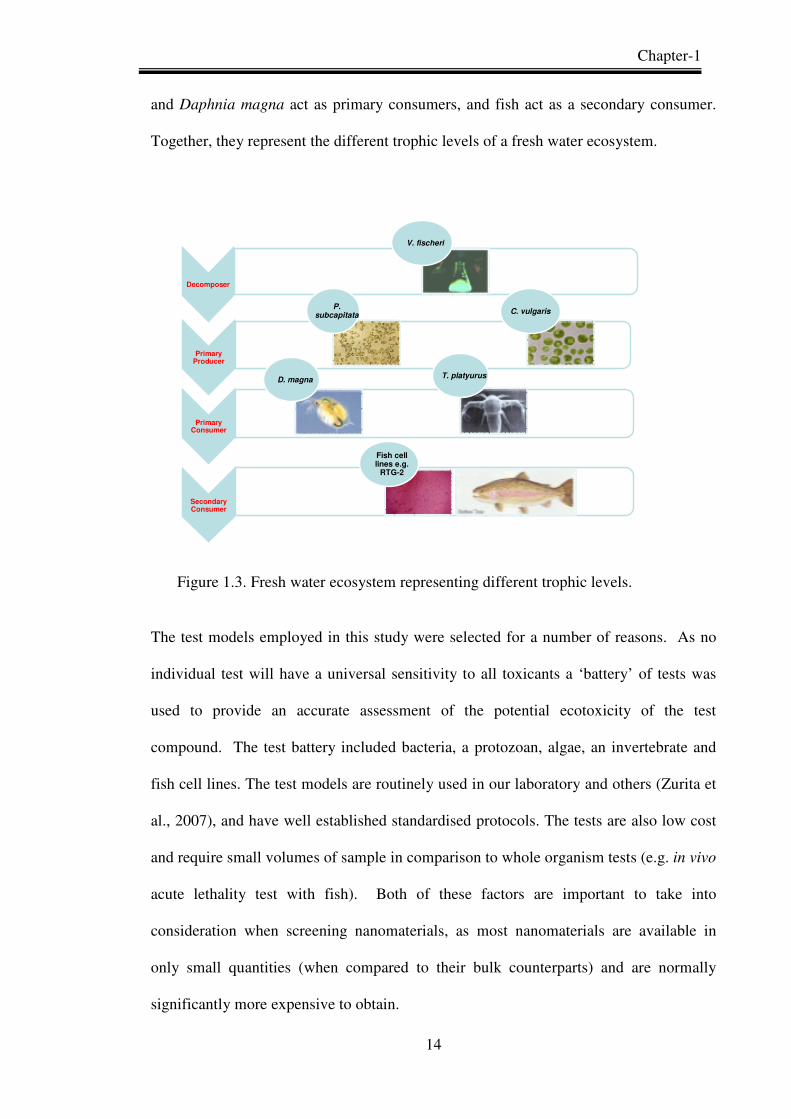
Chapter-1
14
and Daphnia magna act as primary consumers, and fish act as a secondary consumer.
Together, they represent the different trophic levels of a fresh water ecosystem.
Decomposer
Primary Producer
Primary Consumer
Secondary Consumer
V. fischeri
P.
subcapitataC. vulgaris
D. magnaT. platyurus
Fish cell lines e.g.
RTG-2
Figure 1.3. Fresh water ecosystem representing different trophic levels.
The test models employed in this study were selected for a number of reasons. As no
individual test will have a universal sensitivity to all toxicants a ‘battery’ of tests was
used to provide an accurate assessment of the potential ecotoxicity of the test
compound. The test battery included bacteria, a protozoan, algae, an invertebrate and
fish cell lines. The test models are routinely used in our laboratory and others (Zurita et
al., 2007), and have well established standardised protocols. The tests are also low cost
and require small volumes of sample in comparison to whole organism tests (e.g. in vivo
acute lethality test with fish). Both of these factors are important to take into
consideration when screening nanomaterials, as most nanomaterials are available in
only small quantities (when compared to their bulk counterparts) and are normally
significantly more expensive to obtain.

Chapter-1
15
In accordance with the EU policy of Reduction, Replacement and Refinement (RRR), in
vitro models rather than animal studies have been employed to explore the cytotoxicity
of these materials. (Directive 86/609/EEC on the protection of animals used for
experimental and scientific purposes). The fish cells lines were chosen to represent a
vertebrate model and have the advantage of requiring the smallest volume of sample
when compared to the other test models. Both cells lines have routinely been used for
the assessment of toxic effects of chemicals and evaluation of environmental samples in
our laboratory and it has been found that in vitro cytotoxicity is positively correlated
with acute toxicity in vivo. (Fent, 2001; Davoren and Fogarty. 2006). The RTG-2 cell
line, derived from the Rainbow trout, has direct environmental relevance to an Irish
freshwater system. The PLHC-1 cell line was chosen to test alongside, as it has been
shown to have increased sensitivity to toxicants compared to the RTG-2 cell line and
while this particular species is not as environmentally relevant its inclusion does allow a
comparison of different test species and different fish organs.
For the mammalian study, three different cell lines have been selected for the
toxicological evaluation. In the case of PNIPAM nanoparticles, HaCaT (Skin model)
and SW480 (intestinal model) cell lines were chosen, to compare the in vitro toxicity
profile of the nanoparticles. These two cells are isolated from the different organs of the
human, and also have different morphology, metabolism and also antioxidant defence
mechanisms. The choice of skin and intenstinal cell models is also influenced by
proposed applications of polymeric nanoparticles for drug delivery, likely to be applied
transdermally of by ingestion.
In the case of PAMAM dendrimers, the immunotoxicity was investigated in mouse
macrophages, as several studies have shown that N-acetyl-D-glucosamine modified
Chapter-1
16
PAMAM dendrimers improve the immunogenicity by up-regulation of antibody
formation via activation of natural killer cells (Hulikova et al., 2009) and the
mannosylated form of PAMAM dendrimers potentiate the immunogenicity and have
been proposed for vaccine delivery systems (Sheng et al., 2008) and also employed for
the intracellular drug and gene delivery system.
When nanoparticles enter into the bloodstream, they immediately encounter a complex
environment of plasma proteins and immune cells. The interaction of nanoparticles with
immune cells may occur both in the blood stream via monocytes, platelets, leukocytes,
and dendritic cells (DC) and in tissues by resident phagocytes, e.g., Kupffer cells in
liver, DC in lymph nodes, macrophages and B cells in the spleen (Dobrovolskaia et al.,
2008). As PAMAM dendrimers are potentially proposed for vaccine and intracellular
gene delivery applications, and macrophages are the main target cells to
produce/improve the immunogenicity of the different antigens, this study explores the
understanding of the interaction with and toxicity to macrophages cells of PAMAM (G-
4, G-5 and G-6) dendrimers. J774A.1 cells, derived from the blood of female BALB/c
mouse, are chosen for the in vitro model.
For each toxicological evaluation, a range finding study was performed to establish the
dose range resulting in a mortality/toxicity between 10 % - 90 %, allowing the
calculation of EC50/LD50. The calculated EC50s indicate that the materials are at most
mildly toxic.
In the cases of the PNIPAM and NIPAM/BAM series of nanoparticles, concentrations
employed were based on extensive range finding tests which revealed the PNIPAM and
NIPAM/BAM copolymers to have low acute toxicity to the chosen battery of test
species. However, the results are of merit as there is currently no ecotoxicity data
available for these nanoparticles and these results therefore address this lack of
Chapter-1
17
environmental data by providing acute toxicity data (5 min – 72 h) for these
nanoparticles to a range of test models.
In the case of PAMAM dendrimers, intracellular ROS generation, concentrations were
kept constant (0.031 to 3 µM of PAMAM dendrimers) for the three generations of
PAMAM dendrimers to observe any generation dependent ROS production. In the case
of cytokine production, concentrations were chosen (for G-4 - 0.08 to 6µM; for G-5 -
0.03 to 2 µM; and for G-6 - 0.013 to 1 µM) on the basis of the cytotoxicity assay, to
establish the point of maximum production of TNF-α, MIP-2 and IL-6.
Furthermore, the concentration range selected for the dendrimers is of therapeutic
relevance for their potential applications, according to the study of Kukowska-Latallo et
al., 2005, which indicated that the therapeutically relevant concentrations are ≤ 3 µM.
Potentially the greatest value of the study, independent of relevance of dose, is the
emphasis on relating the observed responses to the systematically varied physico-
chemical properties of the two polymer nanoparticle series. In this field, establishing
structure activity relationships upon which a greater understanding of relevant materials
parameters is of critical importance.
For the ecotoxicity study, the endpoints are the inhibition of Vibrio fischeri, growth
inhibition of Pseudokirchneriella subcapitata, immobilisation of Daphnia magna,
mortality of Thamnocephallus platyurus, and cytotoxicity of RTG-2 and PLHC-1 cells.
In the case of mammalian toxicity, in vitro cytotoxicity assessment was investigated in
HaCaT, SW480 and J774A.1 cells.
The aim of the present investigation was thus the particle characterisation, and
toxicological assessment (of both environmental and human effects) of these polymeric
nanomaterials. PNIPAM and NIPAM/BAM (Poly N-isopropylacrylamide and N-
isopropylacrylamide-co-N-tert-butylacrylamide) copolymer nanoparticles (provided by

Chapter-1
18
University College Dublin under the Integrated NanoScience Platform for Ireland
(http://www.inspirenano.ie/) and the commercially available PAMAM
(Polyamidoamine) dendrimers (G4, G5 and G6) were chosen. Variation of the co-
polymerisation ratio from 100% PNIPAM through NIPAM/BAM 85:15, NIPAM/BAM
65:35 and NIPAM/BAM 50:50 allowed a systematic variation of the surface chemistry
which manifested as changes in the zeta potential, facilitating the establishment of
structure-activity relationships. In the case of the PAMAM dendrimers, the surface
chemistry was kept constant, while the size, molecular weight and number of surface
primary amino groups were systematically varied. Particle characterisation, in terms of
hydrodynamic diameter, zeta potential and specific surface area (BET) measurement
was performed. Since PNIPAM and NIPAM/BAM nanoparticles are thermosensitive,
the particle size was measured as a function of temperature. The prime aim of the thesis
was to elucidate and understand correlations between the physicochemical properties
and the observed toxicological responses, followed by the underlying mechanism of the
toxicity due to these nanomaterials.
Investigation of the acute ecotoxicological effects of PNIPAM and NIPAM/BAM
copolymer particles and PAMAM dendrimers (G4, G5 and G6) was conducted using a
battery of bioassays representing different trophic levels. The tests employed included a
bacterial species, a unicellular algae species and two crustaceans. In addition, the
cytotoxicity of PNIPAM, and NIPAM/BAM (85:15) copolymer particles and PAMAM
dendrimers (G4, G5 and G6) was investigated in two fish cell lines. UV/visible
spectroscopic analysis of PAMAM dendrimers (G4, G5 and G6) in two different cell
culture media was performed to investigate any potential changes to the effective
medium composition which could contribute to an indirect or secondary toxicity. The
Chapter-1
19
intracellular reactive oxygen species (ROS), genotoxicity, DNA adduct (8-OHdG),
apoptosis assay was performed to understand the underlying mechanism of toxicity
upon the exposure of PAMAM dendrimers in PLHC-1 cells.
The mammalian toxicological assessment of PNIPAM nanoparticles was carried out in
human skin and gastrointestinal cell lines. The uptake and co-localisation study was
performed using fluorescently labelled nanoparticles. The geno-toxicological
assessment was performed using the alkaline comet assay in both the cell lines, to
understand the fate, biodistribution, biocompatibility/cytotoxicological response to the
PNIPAM nanoparticles. Due to the lower LCST of the copolymer nanoparticles
(NIPAM/BAM 85:15, NIPAM/BAM 65:35, NIPAM/BAM 50:50 are 25oC, 17oC and
12oC respectively) it was not possible to assess their toxicity in the mammalian cell
culture systems (37 oC).
Due to potential applications in intracellular drug, gene and also in vaccine delivery
system, the immunotoxicity assessment of PAMAM dendrimers was performed in a
mouse macrophage cell line (J774A.1 cells). This was followed by the cytotoxicological
assessment, and the generation of intracellular reactive oxygen species (ROS), and the
inflammatory markers IL-6 (Interleukin-6), TNF-α (Tumour necrosis factor alpha) and
MIP-2 (Macrophage inflammatory protein-2) were monitored to understand the origin
of the toxic response by the PAMAM dendrimer in these cells.
In the case of the PAMAM dendrimers, by keeping the surface chemistry (functional
group) constant while increasing the molecular weight, and consequently the number of
surface amino groups and the particle surface area, a systematic variation of toxic
response was observed. As the generation increases the toxic responses increases. Also,
in the case of PNIPAM and NIPAM/BAM copolymer nanoparticles, a clear structurally
dependent toxic response has been observed. However the PNIPAM nanoparticles show

Chapter-1
20
excellent biocompatibility to the mammalian cells. The systematic increase in the
intracellular reactive oxygen species (ROS), inflammatory markers (IL-6, TNF-α, and
MIP-2), genotoxicity and apoptosis was observed with the increase in generation of
PAMAM dendrimers. By systemically changing the surface chemistry and particle size,
the foundations of structure activity relationships determining the toxic response have
been established.
The study aims to identify and elucidate the underlying mechanisms of biological
responses which vary systematically as a function of the systematically varied physico-
chemical properties of the polymeric nanoparticles. Such empirical or qualitative
correlations may lay the foundation of quantitative structure-activity relationships. As
such, although it can have specific quantitative meaning in a statistical context, the
concept of correlation is evoked throughout this work in a purely qualitative context.

Chapter-1
21
References
Baun, A., Sorensen, S.N., Rasmussen, R.F., Hartmann, N.B., Koch, C.B., 2008.
Toxicity and bioaccumulation of xenobiotic organic compounds in the presence
of aqueous suspensions of aggregates of nano-C60. Aquat. Toxicol. 86, 379-387.
Brown, D. M., Donaldson, K., Borm, P. J., Schins, R. P., Dehnhardt, P., Gilmour, M.,
Jimenez, L. A., Stone, V. 2004. Calcium and ROS-mediated activation of
transcription factors and TNF- cytokine gene expression in macrophages
exposed to ultrafine particles. Am. J. Physiol. Lung Cell. Mol. Physiol. 286,
344-353.
Brown, D. M., Wilson, M. R., MacNee, W., Stone, V., Donaldson, K. 2001. Size-
Dependent Proinflammatory Effects of Ultrafine Polystyrene Particles: A Role for
Surface Area and Oxidative Stress in the Enhanced Activity of Ultrafines.
Toxicology and Applied Pharmacology, 175, 191–199.
Cabaleiro-Lago, C., Quinlan-Pluck, F., Lynch, I., Lindman, S., Minogue, A.M., Thulin,
E., Walsh, D.M., Dawson, K.A., Linse, S. 2008. Inhibition of amyloid β protein
fibrillation by polymeric nanoparticles. JACS, 19; 15437-43.
Cedervall, T., Lynch, I., Foy, M., Berggård, T., Donnelly, S.C., Cagney, G., Linse, S.,
Dawson, K.A., 2007. Detailed identification of plasma proteins adsorbed on
copolymer nanoparticles. Angew. Chem. Int. Ed. Engl. 46, 5754-5756.
Cheng, J., Flahaut, E., Cheng, S.H., 2007. Effect of carbon nanotubes on developing
zebrafish (Danio rerio) embryos. Environmental Toxicology and Chemistry. 26,
708-716.
Cheng, Y., Xu, Z., Ma, M., Xu, T. 2008. Dendrimers as drug carrier: applications in
different routes of drug administration. J. Pharm. Sci. 97, 123-143.
Chapter-1
22
Colvin, V. L. 2003. The potential environmental impact of engineered nanomaterials.
Nat. Biotechnol. 21, 1166–70.
Davoren, M., Herzog, E., Casey, A., Cottineau, B., Chambers, G., Byrne, H.J., Lyng,
F.M. 2007. In vitro toxicity evaluation of single walled carbon nanotubes on
human A549 lung cells. Toxicol In vitro, 21, 438-48.
Davoren, M. and Fogarty, A.M. 2006. In vitro cytotoxicity assessment of the biocidal
agents sodium o-phenylphenol, sodium o-benzyl-p-chlorophenol, and sodium p-
tertiary amylphenol using established fish cell lines. Toxicology in vitro, 7, 1190-
1201.
Dendritech, Inc. http://www.dendritech.com/pamam.html, accessed on 16th June 2009.
Dobrovolskaia, M.A., McNeil, SC., 2007, Immunological properties of engineered
nanomaterials. Nat. Nanotechnol. 2, 469-478.
Duncan, R., Izzo, L. 2005. Dendrimer biocompatibility and toxicity. Adv. Drug
Delivery Rev. 57, 2215–2237
Emanuele, A. D., Attwood, D. 2005. Dendrimer-drug interactions. Adv. Drug Delivery
Rev. 57, 2147–2162.
Federici, G., Shaw, B.J., Handy, R.D., 2007. Toxicity of titanium dioxide nanoparticles
to rainbow trout (Oncorhynchus mykiss): Gill injury, oxidative stress, and other
physiological effects. Aquat. Toxicol. 84, 415-430.
Fent, K. 2001. Fish cell lines as versatile tools in ecotoxicology: assessment of
cytotoxicity, cytochrome P4501A induction potential and estrogenic activity of
chemicals and environmental samplesToxicology in vitro, 15, 477-488.
Chapter-1
23
Gagńe, F., Auclair, J., Turcotte, P., Fournier, M., Gagnon, C., Sauve, S., Blaise, C.,
2008. Ecotoxicity of CdTe quanum dots to fresh water mussels: Impacts on
immune system, oxidative stress and genotoxicity. Aquat. Toxicol. 86, 333-340.
Gillies, E.R., Frechet, J.M.J. 2005. Dendrimers and dendritic polymers in drug delivery.
Drug Discovery Today 10, 35-43.
Garland, A. 2009. The Global market for carbon nanotubes to 2015:
(http://www.nanoposts.com/indx.php?mod=nanotube accessed on 20th March
2011).
Gillies, E.R., Frechet, J.M.J. 2005. Dendrimers and dendritic polymers in drug delivery.
Drug Discovery Today 10, 35-43.
Heiden, T. C., Dengler, E., Kao, W. J., Heideman, W., Peterson, R. E. 2007.
Developmental toxicity of low generation PAMAM dendrimers in zebrafish.
Toxicol Appl Pharmacol. 225, 70-79.
Heinlaan, M., Ivask, A., Blinova, I., Dubourguier, H.C., Kahru, A., 2008. Toxicity of
nanosized and bulk ZnO, CuO and TiO2 to bacteria Vibrio fischeri and
crustaceans Daphnia magna and Thamnocephalus platyurus. Chemosphere. 71,
1308-1316.
Herzog, E., Casey, A., Lyng, F.M., Chambers, G., Byrne, H. J., Davoren, M. 2007. A
new approach to the toxicity testing of carbon-based nanomaterials--the
clonogenic assay. Toxicol Lett. 2007, 174, 49-60.
Hong, S. P., Bielinska, A. U., Mecke, A., Keszler, B., Beals, J. L., Shi, X. Y., Balogh,
L., Orr, B. G., Baker, J. R., Holl, M. M. B. 2004. Interaction of poly(amidoamine)
dendrimers with supported lipid bilayers and cells: hole formation and the relation
to transport. Bioconjugate Chem. 15, 774-782.
Chapter-1
24
Hsiue, G. H., Chang, R. W., Wang, C. H ., Lee. S. H. 2003. Development of in situ
thermosensitive drug vehicles for glaucoma therapy. Biomaterials, 24 , 2423-30.
Hsiue, G. H., Hsu, S. H., Yang, C. C., Lee, S. H., Yang. I. K. 2002. Preparation of
controlled release ophthalmic drops, for glaucoma therapy using thermosensitive
poly-N-isopropylacrylamide. Biomaterials 23, 457-62.
Huang, R.Q., Qu, Y.H., Ke, W.L., Zhu, J.H., Pei, Y.Y., Jiang, C. 2007. Efficient gene
delivery targeted to brain using a transferrin conjugated polyethylene glycol
modified polyamidoamine dendrimer. FASEB J. 21, 1117-1125.
Hulikova, K., Benson, V., Svoboda, J., Sima, P., Fiserova, A. 2009. N-Acetyl-D-
glucosamine-coated polyamidoamine dendrimer modulates antibody formation
via natural killer cell activation. International Immunopharmacology 9, 792–
799.
Ito, F., Fujimori, H., Honnami, H., Kawakami, H., Kanamura, K.,. Makino, K. 2008.
Effect of polyethylene glycol on preparation of rifampicin-loaded PLGA
microspheres with membrane emulsification technique. Colloids Surf B
Biointerfaces 66, 65-70.
Jaroenworaluck, A., Sunsaneeyametha, W., Kosachan, N., Stevens, R. 2006.
Characteristics of silica coated TiO2 and its UV absorption for sunscreen
cosmetics applications. Surface and Interface Analysis, 38, 473-477.
Jeng, H. A., Swanson, J. 2006. Toxicity of Metal Oxide Nanoparticles in Mammalian
Cells. J. Environ. Sci. Health A. 41, 2699–2711
Kang, H., De-Long, R., Fisher, MH., Juliano, R.L. 2005. Tat-conjugated PAMAM
Dendrimers as delivery agents for antisense and siRNA oligonucleotides.
Pharmaceutical research 22, 2099-2106.

Chapter-1
25
Kavanagh, C.A., Gorelova, T.A., Selezneva, I.I., Rochev, Y.A., Dawson, K.A.,
Gallagher, W.M., Gorelov, A.V., Keenan, A.K. 2005. Poly(N-
isopropylacrylamide) copolymer films as vehicles for the sustained delivery of
proteins to vascular endothelial cells. J. Biomed. Mater. Res. A. 72, 25-35.
Kukowska-Latallo, J.F., Candido, K.A., Cao, Z., Nigavekar, S.S., Majoros, I.J.,
Thomas, T.P., Balogh, L.P., Khan, M.K., Baker, J.R. 2005. Nanoparticle
targeting of anticancer drug improves therapeutic response in animal model of
human epithelial cancer. Cancer Res. 65, 5317-24.
Labieniec, M., Gabryelak, T. 2008. Preliminary biological evaluation of
poli(amidoamine) (PAMAM) dendrimer G3.5 on selected parameters of rat liver
mitochondria. Mitochondrion, 8, 305–312
Lee, J.H., Cha, K.E., Kim, M.S., Hong, H.W., Chung, D.J., Ryu, G., Myung, H. 2009.
Nanosized polyamidoamine (PAMAM) dendrimer-induced apoptosis mediated
by mitochondrial dysfunction. Toxicol Lett. 190 , 202–207.
Lee, C.C., MacKay, J.A., Frechet, J.M.J., Szoka, F.C., 2005. Designing dendrimers for
biological applications. Nat. Biotechnol. 23, 1517–1526.
Leroueil, P. R., Berry, S. A., Duthie, K., Han, G., Rotello, V. M., McNerny, D. Q.,
Baker, J. R., Orr, B. G., Holl, M. M. B. 2008. Wide varieties of cationic
nanoparticles induce defects in supported lipid bilayers. Nano Letters. 8, 420-
424.
Leroueil, P. R., Hong, S. Y., Mecke, A., Baker, J. R., Orr, B. G., Holl, M. M. B. 2007.
Nanoparticle interaction with biological membranes: Does nanotechnology
present a janus face? Acc. Chem. Res. 40, 335-342.
Lin, C. C., and Metters. A. T. 2006. Hydrogels in controlled release formulations:
network design and mathematical modeling. Adv Drug Deliv Rev 58, 1379-408.
Chapter-1
26
Lin, D., Xing, B., 2007. Phytotoxicity of nanoparticles: Inhibition of seed germination
and root growth. Environ. Pollut.150, 243-50.
Lovern, S.B., Klaper, R., 2006. Daphnia magna mortality when exposed to titanium
dioxide and fullerene (C60) nanoparticles. Environmental Toxicology and
Chemistry. 25, 1132-1137.
Lovern, S.B., Strickler J.R., Klaper, R., 2007. Behavioral and physiological changes in
Daphnia magna when exposed to nanoparticle suspensions (titanium dioxide,
nano-C60, and C60HxC70Hx). Environ. Sci. Technol. 41, 4465-7.
Lubick, N. 2009. Promising Green Nanomaterials. Environ. Sci. Technol. 43, 1247–
1249
Lux Research 2008. Nanomaterial state of the market Q3 2008: Stealth success, Board
Impact, LRNI-SMR-08-01, Lux Research, New York, US.
Lynch, I., Blute, I.A., Zhmud, B., MacArtain, P., Tosetto, M., Allen, L.T., Byrne, H.J.,
Farrell, G.F., Keenan, A.K., Gallagher, W.M., Dawson, K.A. 2005. Correlation
of the Adhesive Properties of Cells to N-Isopropylacrylamide/N-tert-
Butylacrylamide Copolymer Surfaces with Changes in Surface Structure Using
Contact Angle Measurements, Molecular Simulations, and Raman
Spectroscopy. Chem. Mater. 17, 3889 - 3898.
Maeda, H., Matsumura, Y. 1986. A new concept on macromolecular therapeutics in
cancer chemotherapy: mechanism of tumouritropic accumulation of proteins and
the antitumour agents SMANCS. Cancer Res. 46, 6387-6392.
Malik, N., Wiwattanapatapee, R., Klopsch, R., Lorenz, K., Frey, H., Weener, J. W.,
Meijer, E. W., Paulus, W., Duncan, R. 2000. Dendrimers: relationship between
structure and biocompatibility in vitro, and preliminary studies in the biodistribution
Chapter-1
27
of 125I-labelled polyamidoamine dendrimers in vivo. Journal of Controlled Release.
65, 133-148.
Meng, H., Chen, Z., Xing, G., Yuan, H., Chen, C., Zhao, F., Zhang, C., Zhao, Y.,
2007.Ultrahigh reactivity provokes nanotoxicity: Explanation of oral toxicity
of nano-copper particles. Toxicology Letters, 175, 102-110
Mortimer, M., Kasemets, K., Heinlaan, M., Kurvet, I., Kahru, A., 2008. High
throughput kinetic Vibrio fischeri bioluminescence inhibition assay for study of
toxic effects of nanopartcles. Toxicol. In Vitro, 22, 1412-1417.
Muller, N. C and Nowack B. 2008. Exposure modelling of engineered nanoparticles to
the environment. Environ. Sci Technol. 42, 4447-4453.
Naha, P. C., Kanchan, V., Manna, P. K., and Panda. A. K. 2008. Improved
bioavailability of orally delivered insulin using Eudragit-L30D coated PLGA
microparticles. J Microencapsul. 25 , 248-56.
Naha, P. C.,. Kanchan, V., and A. K. Panda. 2009a. Evaluation of parenteral depot
insulin formulation using PLGA and PLA microparticles. J Biomater Appl. 24,
309-25.
Nel, A.E., Mädler, L., Velegol, D., Xia, T., Hoek, E.M.V., Somasundaran, P.,
Klaessig, F., Castranova V., and Thompson, M. 2009. Understanding
biophysicochemical interactions at the nano–bio interface. Nature materials, 8,
543-557.
Nel, A., Xia, T., Madler, L., Li, N. 2006. Toxic potential of materials at the nanolevel.
Science 311, 622-7.
Nowack, B., Bucheli, T.D., 2007. Occurence, behavior and effects of nanoparticles in
the environment. Environmental Pollution. 150, 5-22.

Chapter-1
28
Peppas, N. A., Bures, P., Leobandung, W., Ichikawa. H., 2000. Hydrogels in
pharmaceutical formulations. Eur J Pharm Biopharm 50, 27-46.
Perinotto, A. C., Caseli, L., Hayasaka, C. O., Riul, A., Oliveira, O. N., Zucolotto,
V. 2008. Dendrimer-assisted immobilization of alcohol dehydrogenase in
nanostructured films for biosensing: Ethanol detection using electrical
capacitance measurements, Thin Solid Films, 516, 9002–9005.
Rajananthanan, P., Attard, G. S., Sheikh, N. A., Morrow, W. J. 1999. Evaluation of
novel aggregate structures as adjuvants: composition, toxicity studies and
humoral responses. Vaccine 17, 715–730.
Risom, L., Moller, P., Loft, S. 2005. Oxidative stress-induced DNA damage by
particulate air pollution. Mutat Res. 592, 119-137.
Rothschild, A., Cohen, S.R., Tenne, R. 1999. WS2 nanotube as tips in scanning probe
microscopy, Applied Physics Letters, 25, 4025-4027.
Roberts, J. C., Bhalgat, M. K., Zera, R. T. 1996. Preliminary biological evaluation of
polyamidoamine (PAMAM) Starburst™ dendrimers. J. Biomed. Material Research,
30, 53-65.
Sheng, K. C., Kalkanidis, M., Pouniotis, D.S., Esparon, S., Tang, C.K.,
Apostolopoulos, V., Geoffrey, A., Pietersz, G.A. 2008. Delivery of antigen
using a novel mannosylated dendrimer potentiates immunogenicity in vitro and
in vivo Eur. J. Immunol. 38, 424–436.
Smith, C.J., Shaw, B.J., Handy, R.D., 2007. Toxicity of single walled carbon nanotubes
to rainbow trout, (Oncorhynchus mykiss): respiratory toxicity, organ
pathologies, and other physiological effects. Aquat. Toxicol. 82, 94-109.
Storrie, H., Mooney, D. J., 2006. Sustained delivery of plasmid DNA from polymeric
scaffolds for tissue engineering. Adv. Drug. Del. Rev. 58, 500-514.
Chapter-1
29
Stoeger, T., Takenaka, S., Frankenberger, B., Ritter, B., Karg, E., Maier, K., Schulz, H.,
Schmid O. 2009. Deducing in vivo Toxicity of Combustion-Derived
Nanoparticles from a Cell-Free Oxidative Potency Assay and Metabolic
Activation of Organic Compounds. Environmental Health Perspectives, 117, 54-
60.
Svenson, S., Tomalia, D. A. 2005. Dendrimers in biomedical applications-reflections on
the field. Adv. Drug Delivery Rev. 57, 2106–2129.
Venuganti, V. V. K., Perumal, O. P. 2008. Effect of Poly(amidoamine) (PAMAM)
dendrimer on skin permeation of 5-fluorouracil. Int. J. Pharm. 361, 230–238.
Vergun, O., Reynolds, I. J. 2005. Distinct characteristics of Ca2+ induced
depolarization of isolated brain and liver mitochondria. Biochim. Biophys. Acta.
1709, 127–137.
Vevers, W.F., Jha, A.N. 2008. Genotoxic and cytotoxic potential of titanium dioxide
nanoparticles on fish cell in vitro. Ecotoxicology, 17, 410-420.
Wang, J., Liu, Y., Jiao, F., Lao, F., Li, W., Gu, Y., Li,Y., Ge, C., Zhou, G., Li, B., Zhao,
Y., Chai, Z., Chen, C. 2008. Time-dependent translocation and potential
impairment on central nervous system by intranasally instilled TiO(2)
nanoparticles. Toxicology. 254, 82-90.
Xia, T., Kovochich, M., Brant, J., Hotze, M., Sempf, J., Oberley, T., Sioutas, C., Yeh, J.
I., Wiesner, M. R., Nel, A. E. 2006. Comparison of the Abilities of Ambient and
Manufactured Nanoparticles to Induce Cellular Toxicity According to an Oxidative
Stress Paradigm. Nano Lett. 6, 1794–1807.
Xu, F.J., Kang, E.T., Neoh, K.G., 2006. pH and temperature responsive hydrogel from
crosslinked triblock copolymers prepared via consecutive atom transfer radical
polymerization. Biomaterials. 27, 2787-2797.
Chapter-1
30
Xu, F.Z., Zhong, S.P., Yung, L.Y.L., Kang, E.T., Neoh, K.G., 2004. Surface-active and
stimuli-response polymer-Si(100) hybrid from surface-initiated atom transfer
radical polymerization for control of cell adhesion. Biomacromolecules. 5,
2392-2403.
Xu, Y. H., Zhao, D.Y. 2005. Removal of copper from contaminated soil by use of
poly(amidoamine) dendrimers. Environ. Sci. Technol. 39, 2369-2375
Xu, Y. H., Zhao, D. Y. 2006. Removal of lead from contaminated soils using poly
(amidoamine) dendrimers. Ind. Eng. Chem. Res. 45, 1758-1765
Yoo, H., Juliano, R.L. 2000. Enhanced delivery of antisense oligonucleotides with
fluorophore-conjugated PAMAM dendrimers. Nucleic acid Research. 28, 4225-
4231.
Yang, Y., Gupta, M.C., Dudley, K.L. 2007. Studies on electromagnetic interference
shielding characteristics of metal nanoparticles and carbon nanostructure field
polymer composits in the Ku-band frequency. Micro and Nano Letters, 2, 85-89.
Yoo, H., Juliano, R.L. 2000. Enhanced delivery of antisense oligonucleotides with
fluorophore-conjugated PAMAM dendrimers. Nucleic acid Research. 28, 4225-
4231.
Zhang, J., Misra, R.D.K. 2007. Magnetic drug-targeting carrier encapsulated with
thermosensitive smart polymer: Core–shell nanoparticle carrier and drug release
response. Acta Biomaterialia 3, 838–850
Zhang, X.Z., Lewis, P.J., Chu, C.C., 2005. Fabrication and characterization of a smart
drug delivery system: microsphere in hydrogel. Biomaterials. 26, 3299-3309.
Zhu, Y., Zhao, Q., Li, Y., Cai, X., Li,W., 2006. The interaction and toxicity of multi-
walled carbon nanotubes with Stylonychia mytilus. J. Nanosci. Nanotechnol. 6,
1357-1364.
Chapter-1
31
Zurita, J. L., Repetto, G., Jos, A., Salguero, M., López-Artíguez, M., Cameán, A. M.
2007. Toxicological effects of the lipid regulator gemfibrozil in four aquatic
systems Aquatic Toxicology, 2007, 81, 106-115.
Chapter 2
32
Chapter 2
Materials and Experimental protocols
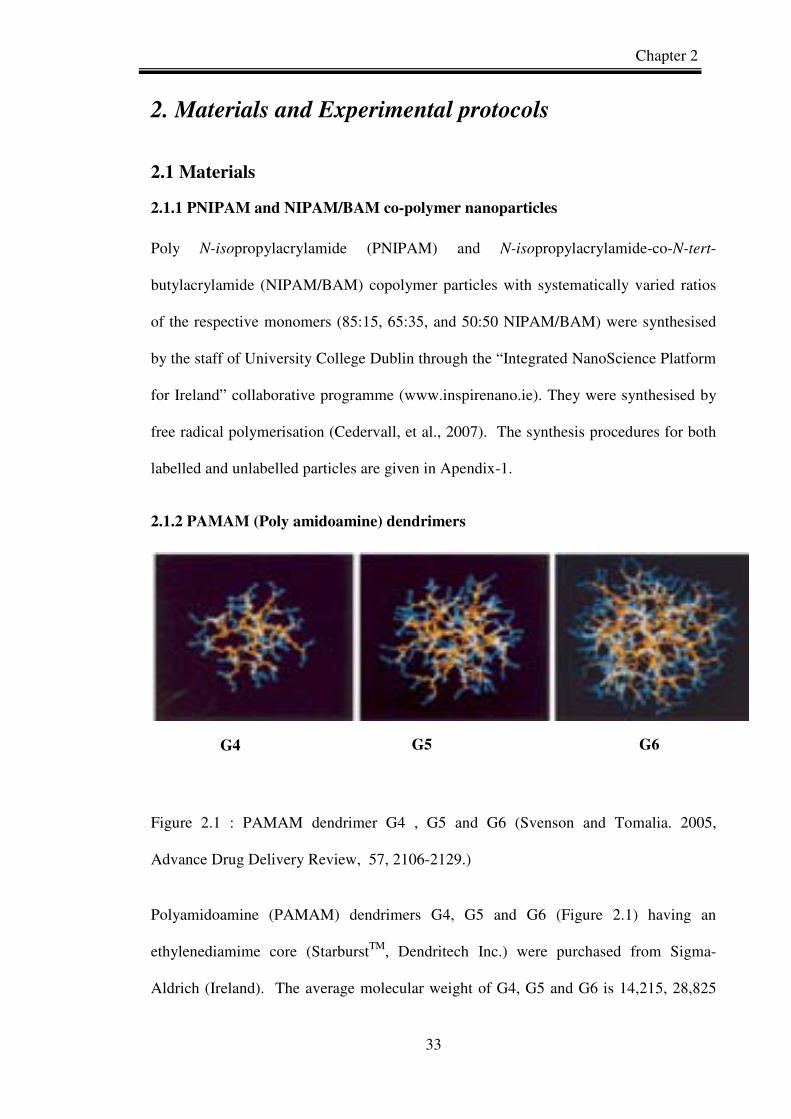
Chapter 2
33
2. Materials and Experimental protocols
2.1 Materials
2.1.1 PNIPAM and NIPAM/BAM co-polymer nanoparticles
Poly N-isopropylacrylamide (PNIPAM) and N-isopropylacrylamide-co-N-tert-
butylacrylamide (NIPAM/BAM) copolymer particles with systematically varied ratios
of the respective monomers (85:15, 65:35, and 50:50 NIPAM/BAM) were synthesised
by the staff of University College Dublin through the “Integrated NanoScience Platform
for Ireland” collaborative programme (www.inspirenano.ie). They were synthesised by
free radical polymerisation (Cedervall, et al., 2007). The synthesis procedures for both
labelled and unlabelled particles are given in Apendix-1.
2.1.2 PAMAM (Poly amidoamine) dendrimers
Figure 2.1 : PAMAM dendrimer G4 , G5 and G6 (Svenson and Tomalia. 2005,
Advance Drug Delivery Review, 57, 2106-2129.)
Polyamidoamine (PAMAM) dendrimers G4, G5 and G6 (Figure 2.1) having an
ethylenediamime core (StarburstTM, Dendritech Inc.) were purchased from Sigma-
Aldrich (Ireland). The average molecular weight of G4, G5 and G6 is 14,215, 28,825
G4 G5 G6
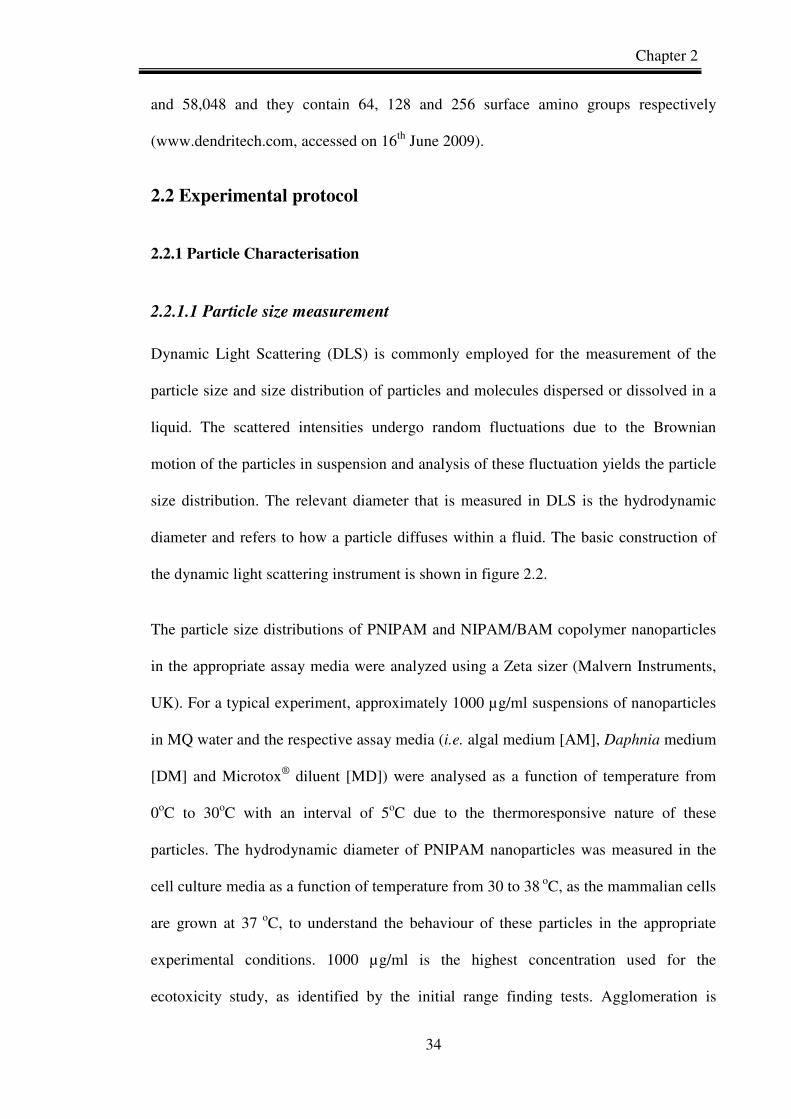
Chapter 2
34
and 58,048 and they contain 64, 128 and 256 surface amino groups respectively
(www.dendritech.com, accessed on 16th June 2009).
2.2 Experimental protocol
2.2.1 Particle Characterisation
2.2.1.1 Particle size measurement
Dynamic Light Scattering (DLS) is commonly employed for the measurement of the
particle size and size distribution of particles and molecules dispersed or dissolved in a
liquid. The scattered intensities undergo random fluctuations due to the Brownian
motion of the particles in suspension and analysis of these fluctuation yields the particle
size distribution. The relevant diameter that is measured in DLS is the hydrodynamic
diameter and refers to how a particle diffuses within a fluid. The basic construction of
the dynamic light scattering instrument is shown in figure 2.2.
The particle size distributions of PNIPAM and NIPAM/BAM copolymer nanoparticles
in the appropriate assay media were analyzed using a Zeta sizer (Malvern Instruments,
UK). For a typical experiment, approximately 1000 µg/ml suspensions of nanoparticles
in MQ water and the respective assay media (i.e. algal medium [AM], Daphnia medium
[DM] and Microtox® diluent [MD]) were analysed as a function of temperature from
0oC to 30oC with an interval of 5oC due to the thermoresponsive nature of these
particles. The hydrodynamic diameter of PNIPAM nanoparticles was measured in the
cell culture media as a function of temperature from 30 to 38 oC, as the mammalian cells
are grown at 37 oC, to understand the behaviour of these particles in the appropriate
experimental conditions. 1000 µg/ml is the highest concentration used for the
ecotoxicity study, as identified by the initial range finding tests. Agglomeration is

Chapter 2
35
generally known to be a concentration dependent phenomenon, and thus this
concentration represents the extreme agglomeration behaviour. To confirm this,
PNIPAM nanoparticles were measured at concentrations of 100 µg/ml and 1000 µg/ml
in the cell culture media for the mammalian toxicity assessment.
Figure 2.2. Schematic diagram of a conventional dynamic light scattering instrument.
(http://www.malvern.com/LabEng/technology/dynamic_light_scattering/classical_90_d
egree_scattering.htm accessed on 16th June 2009).
In the case of PAMAM dendrimers, approximately 20 µM suspensions of dendrimer
nanoparticles in the respective assay media DM, MD and Thamnocephalus medium
(TM), and the cell culture medium, Dulbecco’s Modified Medium Nutrient Mixture/F-
12 Ham [DMEM], with 5% foetal calf serum (FCS) supplement (PLHC-1) and 10%
serum supplement (RTG-2) were analysed at 20oC. The pH of the various test media,
before and after exposure to G4, G5 and G6 dendrimers was measured using a HQ11d
Single-Input pH meter (Hach Company, Colorado).
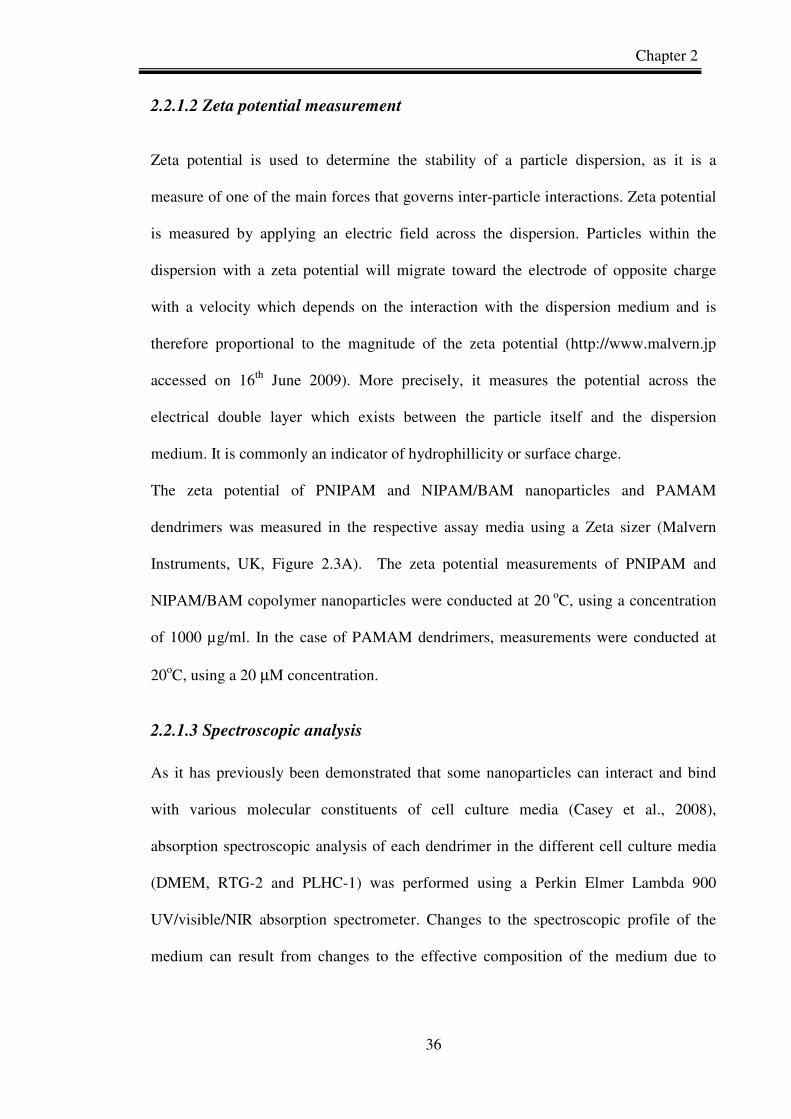
Chapter 2
36
2.2.1.2 Zeta potential measurement
Zeta potential is used to determine the stability of a particle dispersion, as it is a
measure of one of the main forces that governs inter-particle interactions. Zeta potential
is measured by applying an electric field across the dispersion. Particles within the
dispersion with a zeta potential will migrate toward the electrode of opposite charge
with a velocity which depends on the interaction with the dispersion medium and is
therefore proportional to the magnitude of the zeta potential (http://www.malvern.jp
accessed on 16th June 2009). More precisely, it measures the potential across the
electrical double layer which exists between the particle itself and the dispersion
medium. It is commonly an indicator of hydrophillicity or surface charge.
The zeta potential of PNIPAM and NIPAM/BAM nanoparticles and PAMAM
dendrimers was measured in the respective assay media using a Zeta sizer (Malvern
Instruments, UK, Figure 2.3A). The zeta potential measurements of PNIPAM and
NIPAM/BAM copolymer nanoparticles were conducted at 20 oC, using a concentration
of 1000 µg/ml. In the case of PAMAM dendrimers, measurements were conducted at
20oC, using a 20 µM concentration.
2.2.1.3 Spectroscopic analysis
As it has previously been demonstrated that some nanoparticles can interact and bind
with various molecular constituents of cell culture media (Casey et al., 2008),
absorption spectroscopic analysis of each dendrimer in the different cell culture media
(DMEM, RTG-2 and PLHC-1) was performed using a Perkin Elmer Lambda 900
UV/visible/NIR absorption spectrometer. Changes to the spectroscopic profile of the
medium can result from changes to the effective composition of the medium due to
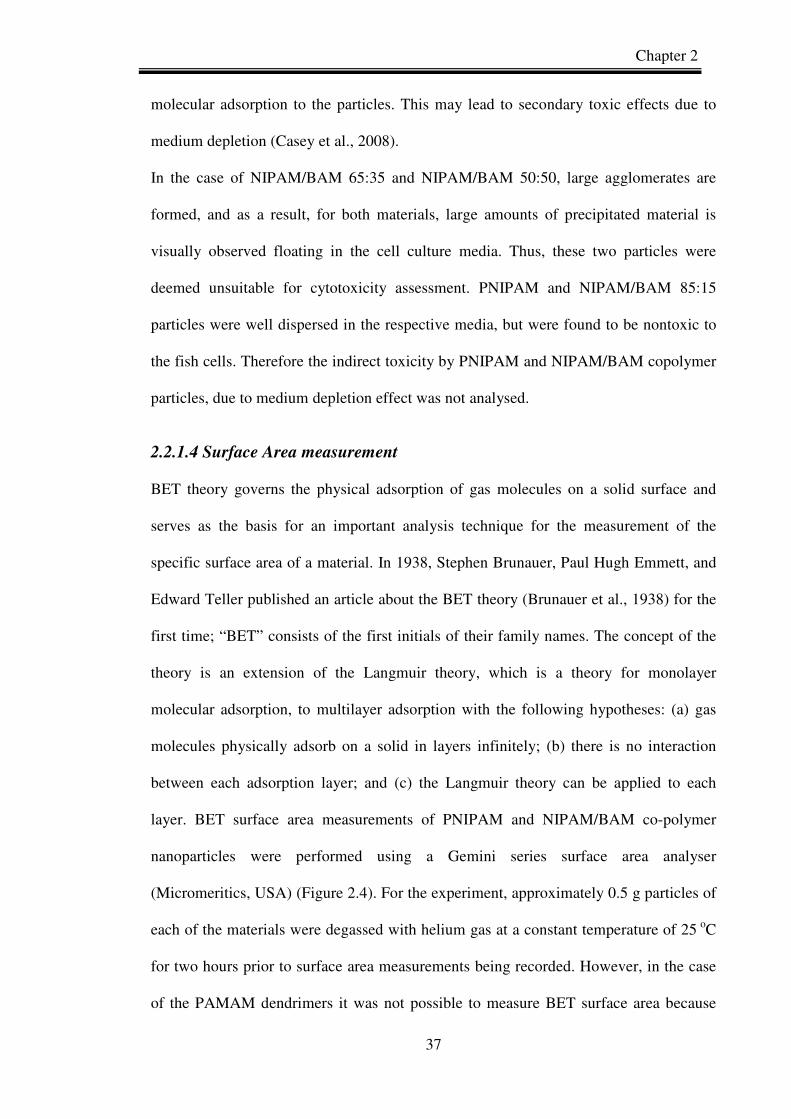
Chapter 2
37
molecular adsorption to the particles. This may lead to secondary toxic effects due to
medium depletion (Casey et al., 2008).
In the case of NIPAM/BAM 65:35 and NIPAM/BAM 50:50, large agglomerates are
formed, and as a result, for both materials, large amounts of precipitated material is
visually observed floating in the cell culture media. Thus, these two particles were
deemed unsuitable for cytotoxicity assessment. PNIPAM and NIPAM/BAM 85:15
particles were well dispersed in the respective media, but were found to be nontoxic to
the fish cells. Therefore the indirect toxicity by PNIPAM and NIPAM/BAM copolymer
particles, due to medium depletion effect was not analysed.
2.2.1.4 Surface Area measurement
BET theory governs the physical adsorption of gas molecules on a solid surface and
serves as the basis for an important analysis technique for the measurement of the
specific surface area of a material. In 1938, Stephen Brunauer, Paul Hugh Emmett, and
Edward Teller published an article about the BET theory (Brunauer et al., 1938) for the
first time; “BET” consists of the first initials of their family names. The concept of the
theory is an extension of the Langmuir theory, which is a theory for monolayer
molecular adsorption, to multilayer adsorption with the following hypotheses: (a) gas
molecules physically adsorb on a solid in layers infinitely; (b) there is no interaction
between each adsorption layer; and (c) the Langmuir theory can be applied to each
layer. BET surface area measurements of PNIPAM and NIPAM/BAM co-polymer
nanoparticles were performed using a Gemini series surface area analyser
(Micromeritics, USA) (Figure 2.4). For the experiment, approximately 0.5 g particles of
each of the materials were degassed with helium gas at a constant temperature of 25 oC
for two hours prior to surface area measurements being recorded. However, in the case
of the PAMAM dendrimers it was not possible to measure BET surface area because
Chapter 2
38
the dendrimers are supplied by the manufacturer in methanol (in suspension form) and
for BET surface area measurement, powdered samples are required.
2.2.1.5 Transmission electron microscopy (TEM) study
In the case of PNIPAM particles, particle size was also determined by Electron
Microscopy by the staff of UCD and the detailed procedure is described in Appendix-1.
2.2.2 Ecotoxicity tests
Each ecotoxicity test was performed in two stages. A preliminary or range finding test
was conducted which determined the range of concentrations of interest for the
definitive test. The definitive test used a concentration range (at least five
concentrations) in which effects were likely to occur, thereby permitting the calculation
of the respective Effective Concentrations (EC50 is the concentration at which 50%
effect was observed) or Lethal Concentrations (LC50 is the concentration at which 50%
mortality was observed), No Observed Effect Concentration (NOEC), and Lowest
Observed Effect Concentration (LOEC). The acute toxicity of each dendrimer was
investigated in the four test systems representing different trophic levels. The
cytotoxicity of the dendrimers was also evaluated in two fish cell lines, RTG-2 and
PLHC-1, to represent vertebrate species. The details of each of the cell lines are given in
sections 2.2.2.5.1 and 2.2.2.5.2, respectively.
2.2.2.1 Microtox® test
The acute toxicity of each dendrimer and NIPAM/BAM series of nanoparticles to the
marine bacterium Vibrio fischeri was determined using the 90% basic test for aqueous
extract protocol (Azur Environmental, 1998). Lyophilised Vibrio fischeri bacteria
(NRRL B-11177) and all Microtox® reagents were obtained from SDI Europe,
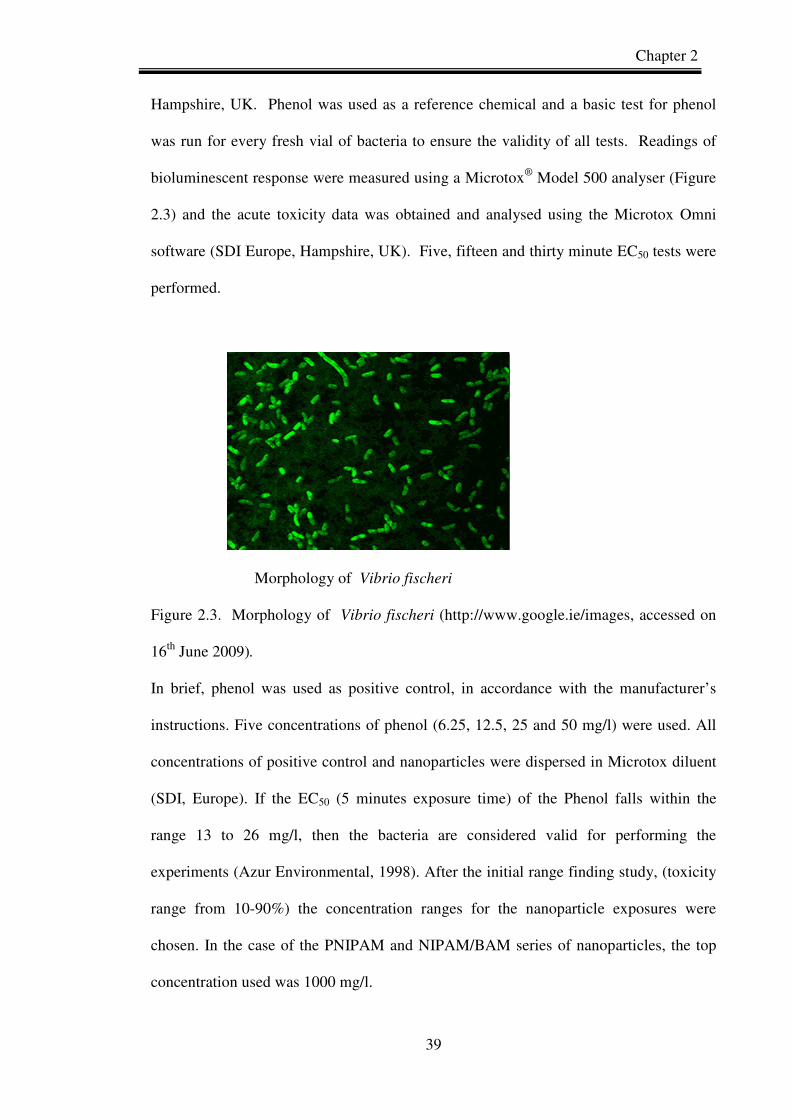
Chapter 2
39
Hampshire, UK. Phenol was used as a reference chemical and a basic test for phenol
was run for every fresh vial of bacteria to ensure the validity of all tests. Readings of
bioluminescent response were measured using a Microtox® Model 500 analyser (Figure
2.3) and the acute toxicity data was obtained and analysed using the Microtox Omni
software (SDI Europe, Hampshire, UK). Five, fifteen and thirty minute EC50 tests were
performed.
Morphology of Vibrio fischeri
Figure 2.3. Morphology of Vibrio fischeri (http://www.google.ie/images, accessed on
16th June 2009).
In brief, phenol was used as positive control, in accordance with the manufacturer’s
instructions. Five concentrations of phenol (6.25, 12.5, 25 and 50 mg/l) were used. All
concentrations of positive control and nanoparticles were dispersed in Microtox diluent
(SDI, Europe). If the EC50 (5 minutes exposure time) of the Phenol falls within the
range 13 to 26 mg/l, then the bacteria are considered valid for performing the
experiments (Azur Environmental, 1998). After the initial range finding study, (toxicity
range from 10-90%) the concentration ranges for the nanoparticle exposures were
chosen. In the case of the PNIPAM and NIPAM/BAM series of nanoparticles, the top
concentration used was 1000 mg/l.
Chapter 2
40
After the positive control experiments, the bacteria were exposed to nanoparticle
suspensions of 9 different concentrations and the readings were taken at 5, 15 and 30
minutes after exposure. For PNIPAM and NIPAM/BAM nanoparticles, the top
concentration of 1000 mg/l was serially diluted (1:2) with the Microtox diluents to
produce the range of concentrations (900, 450 225, 112.5, 56.25, 28.13, 14.06, 7.031
and 3.516 mg/l). For the case of PAMAM dendrimers, a maximum concentration of 50
µM for G4 was used to generate 1:2 serially diluted concentrations (50, 25, 12.5, 6.25,
3.125, 1.56, 0.78, 0.39, 0.19 µM). For G-5, the maximum concentration used was 25
µM, which was 1:2 serially diluted (25, 12.5, 6.25, 3.125, 1.56, 0.78, 0.39, 0.19, 0.097
µM). For G-6, the maximum concentration used was 12.5 µM, serially diluted to
produce a similar range (12.5, 6.25, 3.125, 1.56, 0.78, 0.39, 0.19, 0.097, 0.048 µM). The
end point is the determination of inhibition of luminescence of the bacteria after 5, 15
and 30 minutes exposure time.
2.2.2.2 Microalgae growth inhibition assay
Assessment of the acute toxicity of the materials to the freshwater algae
Pseudokirchneriella subcapitata (Figure 2.6) was conducted in accordance with OECD
Guideline 201 (2002). Pseudokirchneriella subcapitata CCAP 278/4 was obtained
from the Culture Collection of Algae and Protozoa (CCAP) Argyll, Scotland. All
microalgae growth inhibition tests were conducted at 20 ± 1oC with continuous shaking
at 100 rpm and continuous illumination of 10,000 lx (OECD Guideline 201 (2002)).
The initial algal density of all flasks was 1x10⁴ cell ml-1 in a final volume of 20 ml.
Negative controls were incorporated for each test containing only algal growth media
and algal inoculum. The composition of the growth medium is described in table 2.1.
The cell density of each replicate was measured after 72 h using a Neubauer Improved
Chapter 2
41
(Bright-Line) chamber (Brand, Germany). The concentrations of PNIPAM and
NIPAM/BAM nanoparticles studied were 10, 50, 100, 500 and 1000 mg/l. In brief, the
experiments were carried out in 20 ml conical flasks. 10,000 algal cells were seed in
each flask, whereupon they were exposed to the nanoparticles and the final volume was
made up to 20 ml with Jaworskis Algal Media. The flask was incubated in an incubator
shaker with continuous shaking at 100 rpm and continuous illumination of 10,000 lx at
20 ± 1oC according to the OECD Guideline 201 (2002). After a 72 hour exposure
period, the algal cells were counted and the mean inhibition was calculated by using the
formulae below. Each experiment was run with three duplicates and three individual
experiments were performed for each nanoparticle concentration (n=3).
Average growth rate = [LN (Number of Algal cells after exposure to nanoparticles) -
LN (10000)]/72.
Growth rate % of Control = (Average growth rate after nanoparticle exposure / Average
growth rate of control)* 100.
Mean Inhibition = 100 - Growth rate % of Control.
Average specific growth rate (µ) and percentage inhibition of average specific growth
rate (%Ir) relative to controls were calculated for each concentration. The reference
chemical potassium dichromate was employed as a positive control to ensure validity of
the test method and the 72 hour EC50 for algal growth inhibition was found to be 1.3
mg/l.

Chapter 2
42
Figure 2.4. Pseudokirchneriella subcapitata. (http://www.google.ie/images, accessed on
16th June 2009)
Table 2.1 Stock Solutions for Jaworskis Algal Media.
Stocks Concentrations ( g / 200ml) Calcium nitrate tetrahydrate 4.0
Potassium phosphate monobasic 2.48 Magnesium sulfate heptahydrate 10.0
Sodium Bicarbonate 3.18 Ethylenediaminetetraacetic acid 0.45
Ethylenediaminetetraacetic acid tetrasodium salt 0.45
Boric acid 0.496 Manganese chloride tetrahydrate 0.278
Ammonium molybdate tetra hydrate 0.2 Cyanocobalamine 0.008
Thiamin HCl 0.008 Biotin 0.008
Sodium Nitrate 16.0 Sodium phosphate dibasic dihydrate 7.2
• Prepare Stock solutions as per Table 1, store @ 4oC. Label stock bottles with
preparation date, initials and give an expiry appropriate for the stock e.g. 6
months.
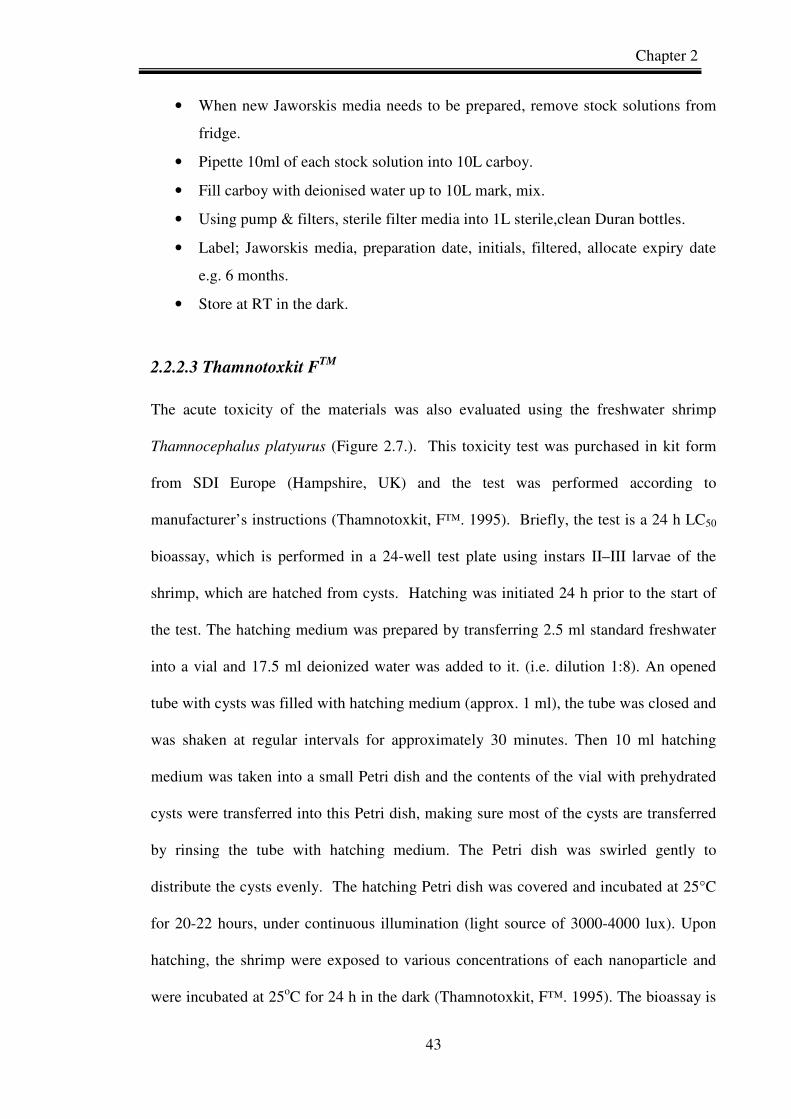
Chapter 2
43
• When new Jaworskis media needs to be prepared, remove stock solutions from
fridge.
• Pipette 10ml of each stock solution into 10L carboy.
• Fill carboy with deionised water up to 10L mark, mix.
• Using pump & filters, sterile filter media into 1L sterile,clean Duran bottles.
• Label; Jaworskis media, preparation date, initials, filtered, allocate expiry date
e.g. 6 months.
• Store at RT in the dark.
2.2.2.3 Thamnotoxkit FTM
The acute toxicity of the materials was also evaluated using the freshwater shrimp
Thamnocephalus platyurus (Figure 2.7.). This toxicity test was purchased in kit form
from SDI Europe (Hampshire, UK) and the test was performed according to
manufacturer’s instructions (Thamnotoxkit, F™. 1995). Briefly, the test is a 24 h LC50
bioassay, which is performed in a 24-well test plate using instars II–III larvae of the
shrimp, which are hatched from cysts. Hatching was initiated 24 h prior to the start of
the test. The hatching medium was prepared by transferring 2.5 ml standard freshwater
into a vial and 17.5 ml deionized water was added to it. (i.e. dilution 1:8). An opened
tube with cysts was filled with hatching medium (approx. 1 ml), the tube was closed and
was shaken at regular intervals for approximately 30 minutes. Then 10 ml hatching
medium was taken into a small Petri dish and the contents of the vial with prehydrated
cysts were transferred into this Petri dish, making sure most of the cysts are transferred
by rinsing the tube with hatching medium. The Petri dish was swirled gently to
distribute the cysts evenly. The hatching Petri dish was covered and incubated at 25°C
for 20-22 hours, under continuous illumination (light source of 3000-4000 lux). Upon
hatching, the shrimp were exposed to various concentrations of each nanoparticle and
were incubated at 25oC for 24 h in the dark (Thamnotoxkit, F™. 1995). The bioassay is

Chapter 2
44
conducted in a disposable 24 well plate. 1 ml standard freshwater was added to the four
wells of control group. This procedure (1ml) was repeated for the other wells with the
respective nanoparticle concentrations. Using a dissection microscope, 10 larvae were
transferred to each well. Care was taken, during this operation, to minimize the transfer
of medium along with the larvae. The 24 well plate was covered with aluminum foil and
incubated at 25°C in dark. After 24 hours, the dead larvae in each test well were
counted under the microscope and the % mortality was calculated. Concentrations of
PNIPAM and NIPAM/BAM 85/15 nanoparticles of 500, 800, 1000, 1250 and 1500
mg/l were studied. For NIPAM/BAM 65/35 nanoparticles, concentrations of 200, 400,
600, 800 and 1000 mg/l were used, and for NIPAM/BAM, 50/50 nanoparticles,
concentrations of 200, 300, 400, 500, and 600 mg/l were used after range finding
experiments. For the case of PAMAM dendrimers G-4 (1, 2, 3, 5 and 7 µM), G-5 (0.5,
1, 2, 4 and 6 µM) and G-6 (0.5, 1, 2, 3 and 4 µM) were used after range finding
experiments. The test endpoint was mortality. The number of dead shrimp for each
concentration was recorded and the respective LC50 was determined. The 24 hour EC50
was determined to be 0.1 mg/l for potassium dichromate which was used as a positive
control to validate the experimental protocol. Each experiment was run with three
duplicates and three individual experiments were performed for each nanoparticle
concentration (n=3).
Potassium dichromate was used as positive control in different assays as recommended
by manufacture’s guideline (Thamnotoxkit, F™. 1995) and also reported in the
literature (Minagh et al., 2009, ).

Chapter 2
45
Figure 2.5. Thamnocephalus platyurus . (http://www.google.ie/images,accessed on 16th
June 2009)
2.2.2.4 Daphnia magna acute immobilisation assay
Acute toxicity immobilization tests were performed on each of the dendrimers
according to the British standard (BS EN ISO 6341, 1996). Daphnia magna (Figure
2.8) were originally obtained from TNO laboratories (the Netherlands) and were
cultured in static conditions at 20 ± 1oC over a 16 h/8 h light/dark photoperiod. The
culture was maintained by using daphnia growth media, which is composed of Calcium
chloride-11.76 g/l, sodium bicarbonate-2.59 g/l, potassium chloride-0.23 g/l and
Magnesiun sulphate-4.93 g/l. The media was changed twice in a week and algae were
given to daphnia as food for their growth. Daphnia were separated according to those
carrying eggs, which were placed in a separate vessel to collect the neonates of same
age. Acute toxicity tests were performed on Daphnia magna neonates that were less
than 24 h old. In brief, the Immobilisation (no independent movement after gentle
agitation of the test liquid for 15 seconds) was carried out in 10 ml tubes. For each

Chapter 2
46
independent experiment, five different concentrations of nanoparticles and one control
group was run with four replicates and three independent experiments were performed.
The control group contains only the daphnia medium whereas the other tubes contained
different concentration of nanoparticles, and the nanoparticles were dispersed in the
daphnia medium. Then five daphnia neonates were transferred to each control and tubes
containing different concentrations of nanoparticles. After 24 and 48 hour, the
immobilisation of daphnia neonates was observed visually and the percentage of
immobilization was calculated. There was no feeding during the tests. Daphnid
sensitivity was verified by determining the 24 h EC50 using potassium dichromate. The
24 h EC50 of potassium dichromate on immobilization of Daphnia magna was observed
to be 0.1 mg/l. The concentrations of PNIPAM nanoparticles were 250, 500, 750, 1000,
and 1250 mg/l, for NIPAM/BAM 85/15 nanoparticles 100, 250, 500, 750 and 1000
mg/l, for NIPAM/BAM 65/35 nanoparticles 100, 200, 300, 400 and 500 mg/l, for
NIPAM/BAM 50/50 nanoparticles 50, 100, 150, 200 and 250 mg/l. The concentrations
used in the case of PAMAM dendrimers were (0.25, 0.5, 1, 2 and 3 µM) for G4, 0.1,
0.25, 0.75, 1 and 1.5 µM for G-5 , and 0.05, 0.1, 0.25, 0.5 and 0.75 µM for G-6, as
established by respective range finding studies.
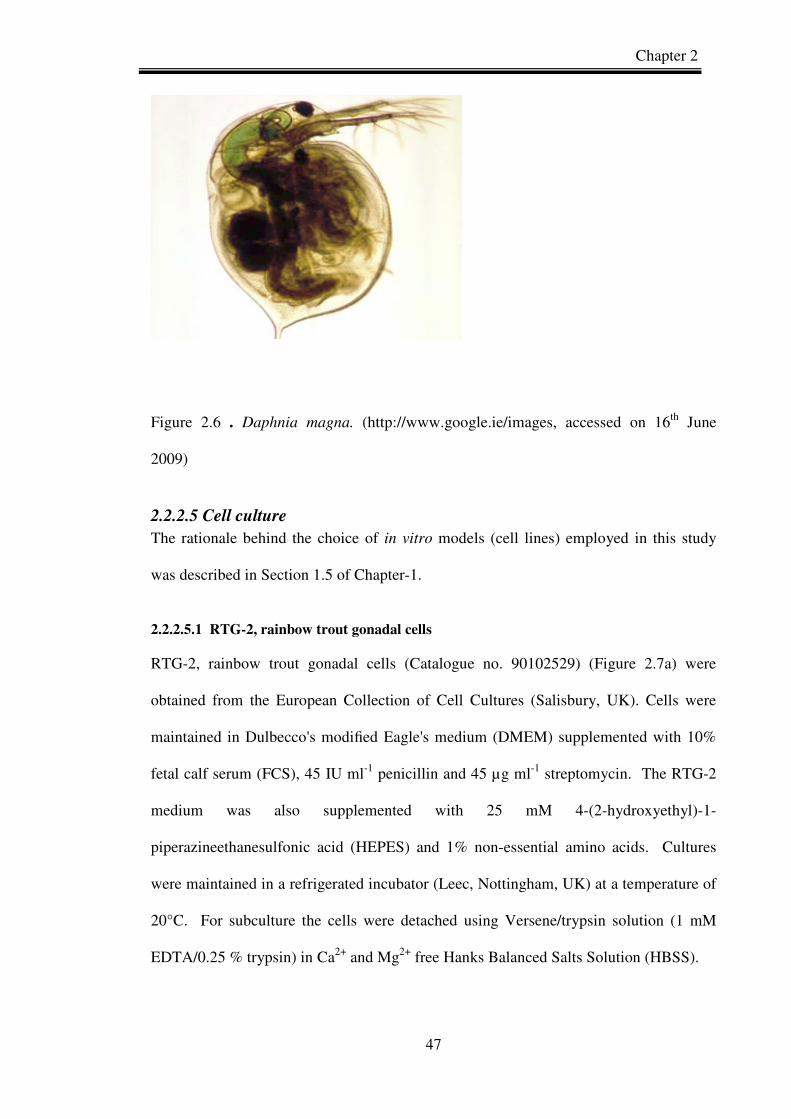
Chapter 2
47
Figure 2.6 . Daphnia magna. (http://www.google.ie/images, accessed on 16th June
2009)
2.2.2.5 Cell culture
The rationale behind the choice of in vitro models (cell lines) employed in this study
was described in Section 1.5 of Chapter-1.
2.2.2.5.1 RTG-2, rainbow trout gonadal cells
RTG-2, rainbow trout gonadal cells (Catalogue no. 90102529) (Figure 2.7a) were
obtained from the European Collection of Cell Cultures (Salisbury, UK). Cells were
maintained in Dulbecco's modified Eagle's medium (DMEM) supplemented with 10%
fetal calf serum (FCS), 45 IU ml-1 penicillin and 45 µg ml-1 streptomycin. The RTG-2
medium was also supplemented with 25 mM 4-(2-hydroxyethyl)-1-
piperazineethanesulfonic acid (HEPES) and 1% non-essential amino acids. Cultures
were maintained in a refrigerated incubator (Leec, Nottingham, UK) at a temperature of
20°C. For subculture the cells were detached using Versene/trypsin solution (1 mM
EDTA/0.25 % trypsin) in Ca2+ and Mg2+ free Hanks Balanced Salts Solution (HBSS).

Chapter 2
48
2.2.2.5.2 PLHC-1 cells
PLHC-1 cells (CRL-2406) (Figure 2.7b) were derived from a hepatocellular carcinoma
in an adult female topminnow (Poeciliopsis lucida) and were obtained from the
American Type Culture Collection (ATCC). Cells were maintained in DMEM
supplemented with 5 % FCS, 45 IU ml-1 penicillin, and 45 µg ml-1 streptomycin.
Cultures were maintained in a refrigerated incubator (Leec, Nottingham, UK) at a
temperature of 30°C under normoxic atmosphere. For subculture the cells were
detached using Versine/trypsin solution (1 mM EDTA/0.25 % trypsin) in Ca2+ and Mg2+
free Hanks Balanced Salts Solution (HBSS).
2.2.2.5.3 SW4 80 cells
SW480 cells (ATCC, CCL-228) (Figure 2.7c) a primary adenocarcinoma cell line of the
colon, were cultured in DMEM F-12 HAM with 2mM L-glutamine supplemented with
10% FCS, 45 IU ml-1 penicillin and 45 IU ml-1 streptomycin at 37ºC in 5% CO2 . For
subculture, the cells were detached using Versene/trypsin solution (1 mM EDTA/0.25
% trypsin) in Ca2+ and Mg2+ free Hanks Balanced Salts Solution (HBSS).
2.2.2.5.4 HaCaT cells
HaCaT cells, an immortal non-cancerous human keratinocyte cell line (Figure 2.7d)
(Kindly provided by Prof. Dr. Boukamp, Heidelberg), were also cultured in DMEM F-
12 HAM with the addition of 1µg/ml hydrocortisone (Smola et al., 1993). For
subculture, the cells were detached using Versene/trypsin solution (1 mM EDTA/0.25
% trypsin) in Ca2+ and Mg2+ free Hanks Balanced Salts Solution (HBSS).
2.2.2.5.5 J774A.1 cells
J774A.1 is a mouse macrophage cell line, (ECACC, 91051511) (Figure 2.7e) derived
from a tumour in a female BALB/c mouse. J774A.1 cells were cultured in DMEM with
2mM L-glutamine supplemented with 10% FCS, 45 IU ml-1 penicillin and 45 IU ml-1
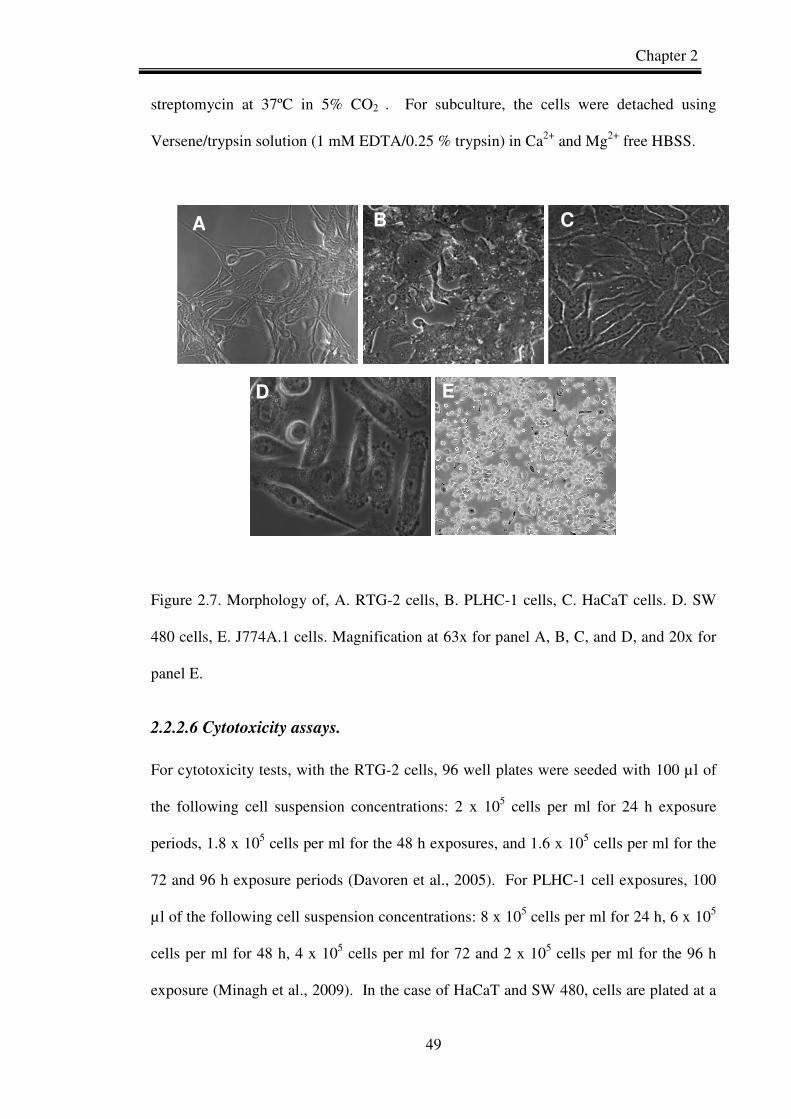
Chapter 2
49
streptomycin at 37ºC in 5% CO2 . For subculture, the cells were detached using
Versene/trypsin solution (1 mM EDTA/0.25 % trypsin) in Ca2+ and Mg2+ free HBSS.
Figure 2.7. Morphology of, A. RTG-2 cells, B. PLHC-1 cells, C. HaCaT cells. D. SW
480 cells, E. J774A.1 cells. Magnification at 63x for panel A, B, C, and D, and 20x for
panel E.
2.2.2.6 Cytotoxicity assays.
For cytotoxicity tests, with the RTG-2 cells, 96 well plates were seeded with 100 µl of
the following cell suspension concentrations: 2 x 10⁵ cells per ml for 24 h exposure
periods, 1.8 x 10⁵ cells per ml for the 48 h exposures, and 1.6 x 10⁵ cells per ml for the
72 and 96 h exposure periods (Davoren et al., 2005). For PLHC-1 cell exposures, 100
µl of the following cell suspension concentrations: 8 x 10⁵ cells per ml for 24 h, 6 x 10⁵
cells per ml for 48 h, 4 x 10⁵ cells per ml for 72 and 2 x 10⁵ cells per ml for the 96 h
exposure (Minagh et al., 2009). In the case of HaCaT and SW 480, cells are plated at a
C B
D E
A

Chapter 2
50
seeding density of 1 x 10⁵ cells/ml for the 24 hour test, 6 x 10⁴ cells/ml for the 48 hour
test, 4 x 10⁴ cells/ml for the 72 hour and 2 x 10⁴ cells/ml for the 96 hours in 96 well
plates. Note that, due to the nature of the assay, and the need for lower cell numbers for
the longer duration exposure experiments (to allow sufficient room for the cells to
proliferate), for each exposure concentration the ratio of particles: cells (and hence the
exposure dose) was different for each time-point, with the dose per cell being a factor of
2.5 different between the 24 and 96 hour exposures initially, and the dose being
distributed among the daughter cells during proliferation. The cell numbers were
determined according to previous literature, (Davoren et al., 2005, Casey et al., 2008,
Minagh et al., 2009). An alternative protocol is the clonogenic assay (Herzog et al.
2007). For the J774A.1 tests, cells were plated at a seeding density of 1 x 10⁵ cells/ml
for 24 hour exposure experiments. The plates were kept in a CO2 incubator for 24 hours
for proper attachment of cells on the surface of the 96 well plates.
Particles were prepared in reduced serum medium (5%), following the protocol of
Casey et al 2008. It should be noted, however, that at even at reduced serum levels, the
nanoparticles are likely to bind to the proteins (Lynch et al., 2007). For the cytotoxicity
of all test particles, a range of concentrations of nanoparticles was tested to establish a
preliminary range (within 10 to 90 % cytotoxic response) with each cell line. Six
replicate wells were used for each control and test concentration per microplate and
three individual experiments were performed. After each incubation period (24, 48, 72,
or 96 h), the test medium was removed, cell monolayers washed with phosphate
buffered saline (PBS) and prepared for the cytotoxicity assays. In the case of
NIPAM/BAM copolymer nanoparticles, the cytotoxicity of PNIPAM and
NIPAM/BAM 85:15 was studied in RTG-2 cells. NIPAM/BAM 65:35 and
NIPAM/BAM 50:50 were demonstrated to form large aggregates at this temperature,

Chapter 2
51
due to the low LCST, which led to both materials floating in the cell culture media. For
a cytotoxicity assessment the particles should be fully dispersed and capable of
interaction with the cells so in this case it was not considered practical to test these
particles with the cell line.
2.2.2.6.1 Alamar blue (AB) assay
Alamar blue (AB) is a water-soluble dye which is frequently employed for in vitro
quantification of the viability of cells (Fields and Lancaster, 1993; Ahmed et al., 1994).
When added to cell cultures, the dye diffuses into the cytosol and the oxidised form is
reduced by the mitochondrial enzyme activity (Al-Nasiry et al., 2007). This conversion
results in a change in colour of the dye from indigo blue to fluorescent pink, which can
be easily measured by its absorption or fluorescence (Al-Nasiry et al., 2007). Reduced
conversion compared to controls is a measure of reduced cellular viability. Alamar Blue
(AB) uptake and conversion was therefore used throughout this work as a cytotoxicity
assay. The assay was carried out according to the manufacturer’s instructions. Briefly,
control media or test exposures were removed, the cells were rinsed once with PBS and
100µl of AB medium (5% v/v solution of AB) prepared in fresh media (without FCS or
supplements) were added to each well. After 3 h of incubation, AB fluorescence was
measured at the excitation and emission wavelengths of 540 nm and 595 nm
respectively, in a microplate reader (TECAN GENios, Grodig, Austria). The percentage
of cell viability was determined by comparison with cells which were not exposed to
nanoparticles i.e. the control group. Interference of nanoparticles with colorometric
assays has been documented for the case of carbon nanotubes (Casey et al., 2007). It
should be noted, however, that this is the case for insoluble nanoparticles, which were
seen to adhere strongly to the cell surfaces, even after repeated washing (Davoren et al.,
2007). In the case of highly soluble polymeric nanoparticles, such effects are likely to
Chapter 2
52
be much less dramatic. In order to confirm this, the fluorescence intensity of AB media
in the absence and presence of PNIPAM particles was compared, and no difference was
observed, which indicates that the PNIPAM nanoparticles do not interact or interfere
with the AB assay.
2.2.2.6.2 MTT Assay
The MTT test is a colorimetric assay that measures the reduction of yellow 3-(4,5-
dimethythiazol-2-yl)-2,5-diphenyl tetrazolium bromide (MTT) by mitochondrial
succinate dehydrogenase. A parallel set of plates was set up for the MTT assay and
seeded and exposed in an identical manner to that described in the AB assay. After the
desired exposure time the control medium or test exposures was removed, the cells were
washed with PBS and 100 µl of freshly prepared MTT in media (0.5 mg/ml of MTT in
un-supplemented media) were added to each well. The MTT enters the cells and passes
into the mitochondria where it is reduced to an insoluble dark purple formazan product.
After 3 h incubation, the medium was discarded and the cells were rinsed with PBS and
100 µl of DMSO were added to each well to extract the dye. The plates were shaken at
240 rpm for 10 min and the absorbance was measured at 595 nm in a microplate reader
(TECAN GENios, Grodig, Austria). Since reduction of MTT can only occur in
metabolically active cells the level of activity is a measure of the viability of the cells.
2.2.2.7 Internalisation study of fluorescently labelled PNIPAM nanoparticles
Fluorescently labelled particles were not evaluated for their toxicity but rather were
employed to visualise the particle uptake and localisation. Methacryloxyethyl
thiocarbamoyl rhodamine B labelled PNIPAM nanoparticles were used for the uptake
study in the HaCaT and SW480 cells. HaCaT and SW480 cells were seeded at a
density of 25,000 in glass-bottomed petri dishes. The Petri dishes were kept in a CO2
incubator at 37 oC for 24 h. After attachment, the cells were exposed to different
Chapter 2
53
concentrations of fluorescent nanoparticles and after a 24 hour exposure the monolayer
of cells was washed with PBS to remove external particles. The particles in the cells
were visualised by excitation at 543 nm and fluorescence emission was collected above
560 nm using a confocal laser scanning microscope (LSM 510 META, Zeiss,
Germany). Fluorescence and phase contrast images were recorded from a minimum of 3
areas per sample. The internalisation of the PNIPAM nanoparticles was confirmed by
taking optical sections (z-sections) of the HaCaT and SW 480 cells. Each optical section
represents a particular plane of focus and it is clear that the nanoparticles have been
internalised completely, rather than being accumulated in or at the cell membrane. For
HaCaT cells 18 z section and for SW 480 cells 21 z sections were taken. Each section is
separated by 0.41 and 1µm for HaCaT and SW 480 cell respectively.
2.2.2.8 Study of Co-localisation of the fluorescently labelled PNIPAM
nanoparticles with lysosomes
Co-localisation studies of the labelled PNIPAM nanoparticles to lysosome were
performed on the HaCaT cells using lysotracker green (http://probes.invitrogen.com
accessed on 16th June 2009). LysoTracker® probes are fluorescent acidotropic probes
for labelling and tracking acidic organelles in live cells. These probes have several
important features, including high selectivity for acidic organelles and effective
labelling of live cells at nanomolar concentrations (http://products.invitrogen.com). In
this study, lysotracker green was used for staining lysosomes as the particles were
labelled with the red rhodamine B dye.
Methacryloxyethyl thiocarbamoyl Rhodamine B is the fluorescent label used to track
the particle within the cells and this fluorescent labels is stable in the pH conditions and

Chapter 2
54
has previously been used for both in vitro and in vivo imaging of expansile
nanoparticles in murine models (Colson et al., 2010).
HaCaT cells were seeded at a density of 25,000 in glass-bottomed petri dishes. The
Petri dishes were kept in a CO2 incubator at 37 oC for 24 h to attach the cells on the
glass surface. After attachment, the cells were exposed to different concentrations (30
and 50 mg/l) of fluorescent nanoparticles and after 24 h exposure the monolayer of cells
was washed with PBS. The cells were then incubated for 30 minutes with 75nM
concentration of lysotracker in a CO2 incubator at 37 oC. The particles in the cells were
visualised using excitation at 543 nm and fluorescence emission was collected above
560 nm, whereas fluorescence from lysosomes was recorded using 488 nm excitation,
emission being measured through a 505-530 nm bandpass filter in both cases using a
confocal microscope (LSM 510 META, Zeiss, Germany). Fluorescence and phase
contrast images were recorded from a minimum of 3 areas per sample.
2.2.2.9 Intracellular Reactive Oxygen Species (ROS)
Intracellular reactive oxygen species were measured by a fluorimetric assay using
Carboxy H2DCFDA [5 (and-6)-Carboxy-2′, 7′-dichloro-dihydroflourescein diacetate)]
as the probe (http://probes.invitrogen.com) Carboxy H2DCFDA was used because it
carries an additional negative charge that improves its retention compared to non-
carboxylated forms (http://probes.invitrogen.com/media/pis/g002.pdf, accessed on 16th
June 2009). Intracellular oxidation of (6-carboxy-2',7'-dichlorodihydrofluorescein
diacetate (Carboxy H2DCFDA) to 2’, 7’-di-chlorofluorescein (DCF) (Figure 2.11) was
monitored according to the increase in fluorescence as measured by a plate reader and
using confocal fluorescence microscopy.

Chapter 2
55
Figure 2.8. Conversion of Carboxy H2DCFDA to DCF.
The optimal loading time for the Carboxyl H2DCFDA was determined to be 40 minutes
by a kinetic study of the response to H2O2 as a control (Figure 2.9). This time point was
found to be substantially below the saturation point of the assay for exposure to 200 µM
H2O2. Thus increase in ROS levels as a result of nanoparticle exposure to this level and
beyond can be measured.
Carboxy-H2DCFDA Oxidised product DCF
Oxidative stress

Chapter 2
56
0
10
20
30
40
50
60
5 10 15 20 25 30 35 40 45 50 55 60
Time in minutes
% o
f fl
ou
resc
ence
as
com
pa
re t
o c
on
tro
l
Figure 2.9. Time kinetic study of ROS production with 200 µM of H2O2 exposure to
PLHC-1 cells. The concentration of Carboxyl H2DCFDA used 10 µM.
In brief, the assay was performed in black 96 well microplates (Nunc, Denmark). The
J774A.1 cells were seeded in 100 µl of cell suspension in each well at a density of 4 x
105 cells/ml and at 8 x 10⁵ cells/ml for PLHC-1 cells. After 24 h of cell attachment,
plates were washed with 100 µl/well PBS and the cells were treated with increasing
concentrations of each generation of dendrimer prepared in 5% FCS containing media.
Hydrogen peroxide (400 µM) was used as positive control to validate the protocol. All
incubations were performed at 37°C in a 5% CO2 humidified incubator. Six replicate
wells were used for each control and test concentrations per 96 well microplates. After
the specified incubation time period (1, 2, 4 and 6 h) the plates were washed with 100
Chapter 2
57
µl/well PBS and then 100 µl/well of 10 µM Carboxy H2DCFDA was added to each
well. The plates were incubated at 37°C for a period of 40 minutes. The fluorescence
was quantified using a plate reader, which provides an average of the statistically
variable response of individual cells (Elbekai and El-Kadi, 2005). Fluorescence was
measured using an excitation of 485nm and emission of 530nm, in a TECAN GENios
(Grodig, Austria) microplate reader. For visualisation of the intracellular fluorescence,
carboxy H2DCFDA was excited at 488 nm and fluorescence emission at 520 nm (with a
505 nm long pass filter) was recorded using a confocal laser scanning microscope (LSM
510 META, Zeiss, Germany). Fluorescence and phase contrast images were recorded
from a minimum of 3 areas per sample.
2.2.2.10 Cytokines assay
An enzyme linked immunosorbant assay (ELISA) was performed to quantify the
proinflammatory mediators (IL-6, TNF-α and MIP-2) after the exposure of the J774A.1
cells to PAMAM dendrimers. The basic principle of ELISA is shown in figure 2.10.
LPS (lipo-polysaccharide) was used as positive control to stimulate the TNF-α and
MIP-2 and validate the ELISA protocol. After the exposure period, the supernatant was
collected, and then centrifuged and stored at -80 °C for ELISA. Although some loss of
protein due to adsorption onto the nanoparticles may have occurred, the extent was not
measured. The principle of the ELISA is based on the sandwich technique, in which the
capture antibody (primary antibody) at concentrations of 1µg/ml (TNF-α), 2 µg/ml (IL-
6) and 0.5 µg/ml (MIP-2) in PBS (pH -7.4), was coated in the 96 well plate (Nunc-
immuno plate, Denmark).
The plates were incubated overnight at room temperature. The wells were aspirated to
remove the liquid and the plates were washed four times with PBS-T (phosphate buffer
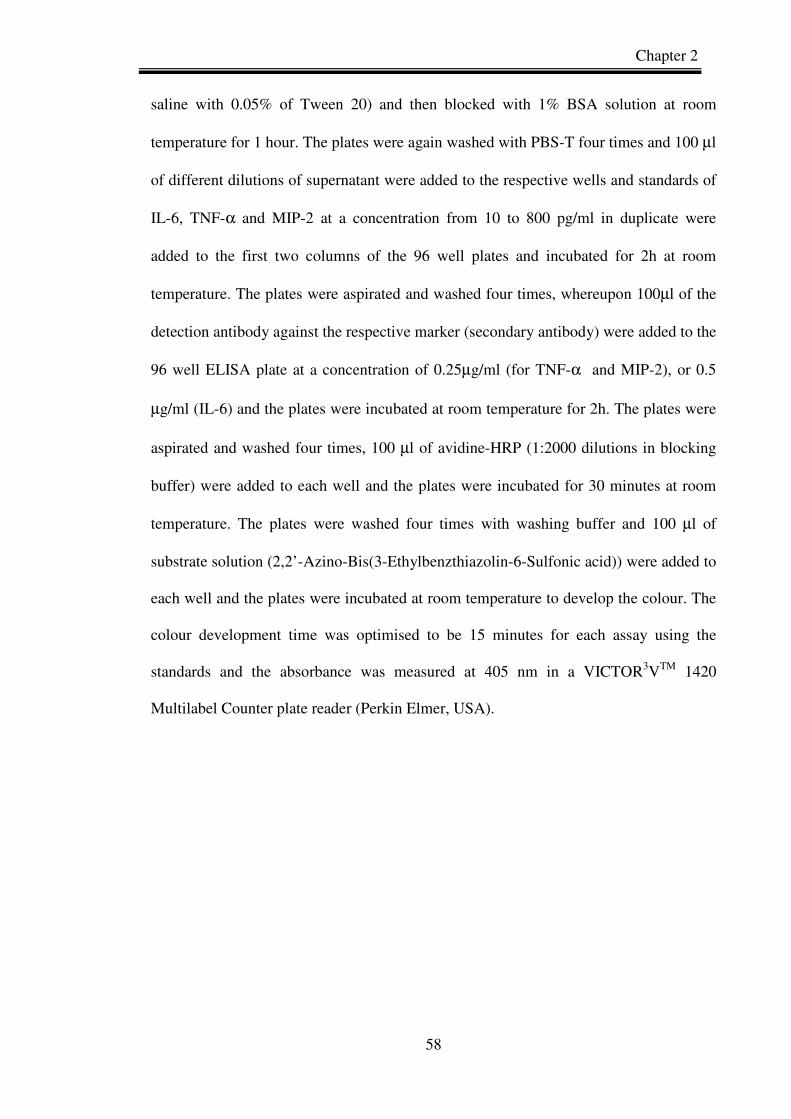
Chapter 2
58
saline with 0.05% of Tween 20) and then blocked with 1% BSA solution at room
temperature for 1 hour. The plates were again washed with PBS-T four times and 100 µl
of different dilutions of supernatant were added to the respective wells and standards of
IL-6, TNF-α and MIP-2 at a concentration from 10 to 800 pg/ml in duplicate were
added to the first two columns of the 96 well plates and incubated for 2h at room
temperature. The plates were aspirated and washed four times, whereupon 100µl of the
detection antibody against the respective marker (secondary antibody) were added to the
96 well ELISA plate at a concentration of 0.25µg/ml (for TNF-α and MIP-2), or 0.5
µg/ml (IL-6) and the plates were incubated at room temperature for 2h. The plates were
aspirated and washed four times, 100 µl of avidine-HRP (1:2000 dilutions in blocking
buffer) were added to each well and the plates were incubated for 30 minutes at room
temperature. The plates were washed four times with washing buffer and 100 µl of
substrate solution (2,2’-Azino-Bis(3-Ethylbenzthiazolin-6-Sulfonic acid)) were added to
each well and the plates were incubated at room temperature to develop the colour. The
colour development time was optimised to be 15 minutes for each assay using the
standards and the absorbance was measured at 405 nm in a VICTOR3VTM 1420
Multilabel Counter plate reader (Perkin Elmer, USA).
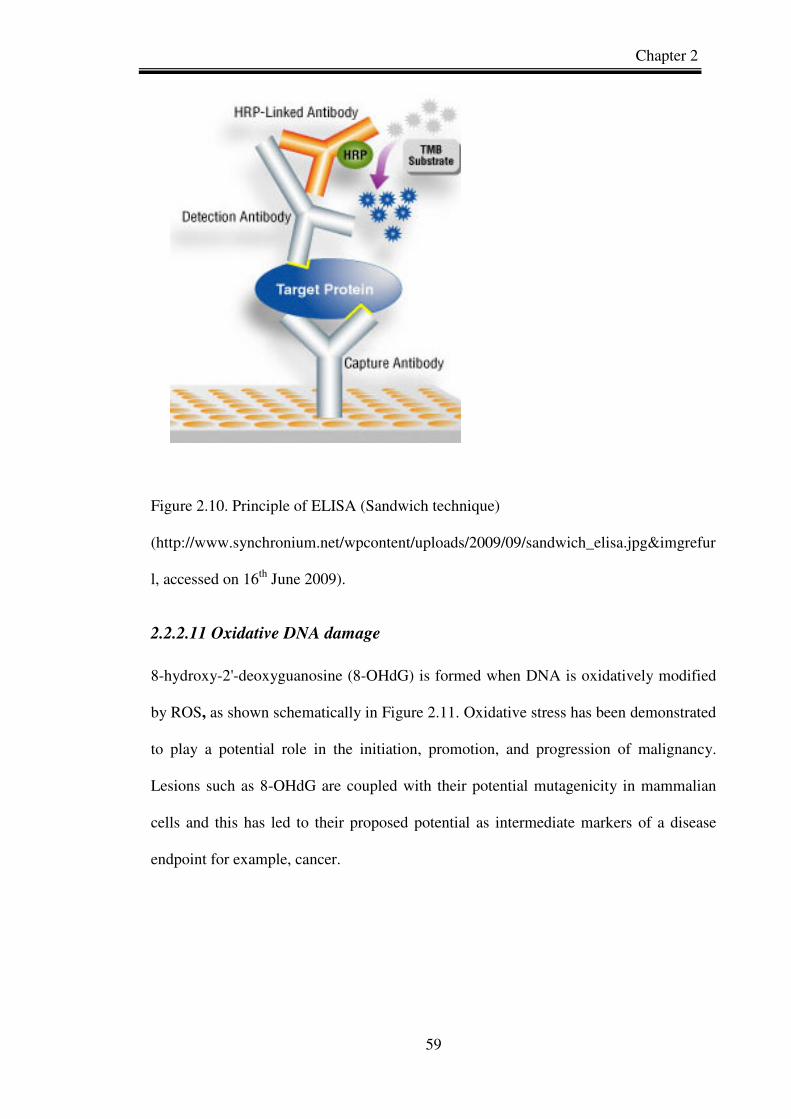
Chapter 2
59
Figure 2.10. Principle of ELISA (Sandwich technique)
(http://www.synchronium.net/wpcontent/uploads/2009/09/sandwich_elisa.jpg&imgrefur
l, accessed on 16th June 2009).
2.2.2.11 Oxidative DNA damage
8-hydroxy-2'-deoxyguanosine (8-OHdG) is formed when DNA is oxidatively modified
by ROS, as shown schematically in Figure 2.11. Oxidative stress has been demonstrated
to play a potential role in the initiation, promotion, and progression of malignancy.
Lesions such as 8-OHdG are coupled with their potential mutagenicity in mammalian
cells and this has led to their proposed potential as intermediate markers of a disease
endpoint for example, cancer.
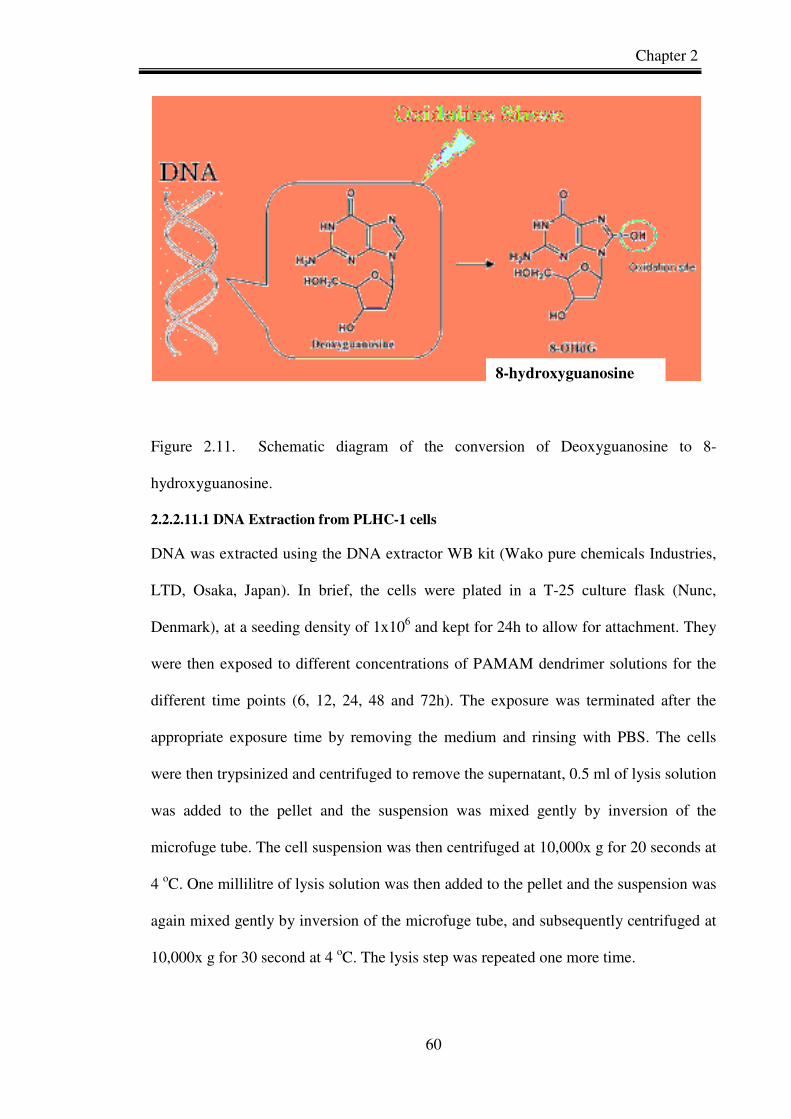
Chapter 2
60
Figure 2.11. Schematic diagram of the conversion of Deoxyguanosine to 8-
hydroxyguanosine.
2.2.2.11.1 DNA Extraction from PLHC-1 cells
DNA was extracted using the DNA extractor WB kit (Wako pure chemicals Industries,
LTD, Osaka, Japan). In brief, the cells were plated in a T-25 culture flask (Nunc,
Denmark), at a seeding density of 1x10⁶ and kept for 24h to allow for attachment. They
were then exposed to different concentrations of PAMAM dendrimer solutions for the
different time points (6, 12, 24, 48 and 72h). The exposure was terminated after the
appropriate exposure time by removing the medium and rinsing with PBS. The cells
were then trypsinized and centrifuged to remove the supernatant, 0.5 ml of lysis solution
was added to the pellet and the suspension was mixed gently by inversion of the
microfuge tube. The cell suspension was then centrifuged at 10,000x g for 20 seconds at
4 oC. One millilitre of lysis solution was then added to the pellet and the suspension was
again mixed gently by inversion of the microfuge tube, and subsequently centrifuged at
10,000x g for 30 second at 4 oC. The lysis step was repeated one more time.
8-hydroxyguanosine
Chapter 2
61
The resultant pellet was suspended in 200 µl of enzyme reaction solution and 10 µl of
protease solution was added and the suspension was mixed gently by inversion. The
reaction mixture was incubated at 37 oC for 1 hour and the solution was mixed several
times by inversion. After the incubation time, 0.3 ml of sodium iodide followed by 0.5
ml of isopropyl alcohol was added to the reaction mixture and the solution was mixed
by inversion of the microfuge tube until a whitish material appears. It was then
centrifuged at 10,000 g for 10 minutes at room temperature. The pellet was rinsed with
washing solution A and then washing solution B. The pellet was reconstituted in MQ
water and maintained at 4 oC. The purity of the extracted DNA was determined by UV-
visible spectroscopy at 260 and 280 nm. The absorbance (the ratio of 260/280 nm) value
was obtained ~ 1.8, which indicates that the extracted DNA is pure.
After DNA extraction, the DNA was digested for the determination of 8-OHdG by the
ELISA method. The DNA was converted to single strand by incubating the sample at 95
oC for 5 minutes and then rapidly chilling on ice. The DNA sample was then digested to
nucleotides by incubating the denatured DNA with 5 units of nuclease P1 for 2 hour at
37 oC in 20 mM Sodium Acetate, pH 5.2. Subsequently it was treated with 5 units of
alkaline phosphatase for 1 hour at 37 oC in 100 mM Tris buffer, pH 7.5. The reaction
mixture was centrifuged for 5 minutes at 6000 g and the supernatant was used for the 8-
OHdG assay.
2.2.2.11.2 Measurement of 8-OHdG by ELISA
The 8-OHdG ELISA kit is a competitive in vitro enzyme linked immuno-sorbent assay
for quantitative measurement of the oxidative DNA adduct 8-hydroxy, 2’
deoxyguanosine (8-OHdG). All reagents and samples were equilibrated to room
temperature before use (20-25oC). The ELISA was carried out according to the

Chapter 2
62
manufacturer’s instructions. In brief, the primary antibody was reconstituted with the
primary antibody solution and allowed to dissolve completely.
Fifty microlitres of sample (extracted DNA) or standard was added per well, and then
50µl of reconstituted primary antibody was added per well. The plate was shaken from
side to side and the solution mixed fully. The container was covered with adhesive strip,
making sure it was sealed tightly, and incubated at 4 oC overnight. The contents of the
plate were removed. 250 µl of washing solution were pipetted into each well. After
washing thoroughly by shaking the plate from side to side, the washing solution was
removed. The plate was inverted and blotted using a clean paper towel to remove any
remaining washing buffer. The washing process was repeated twice more.
The secondary antibody was reconstituted with the secondary antibody solution. 100 µl
of constituted secondary antibody was added per well. The plate was shaken from side
to side to mix fully. The plate was covered with an adhesive strip and incubated at room
temperature for 1 hour. At the end of the incubation period, the plates were washed
twice with washing buffer. The chromatic solution (enzyme substrate solution) was
reconstituted with 100 times the volume of the diluting solution. 100 µl of the
reconstituted enzyme substrate was added per well. The plate was shaken from side to
side to mix fully and incubated at room temperature for 15 minutes in the dark.
100 µl of the reaction terminating solution was added per well. The plate was shaken
from side to side to mix fully. After terminating the reaction, the absorbance at 450 nm
was measured. A standard curve was used to determine the amount of 8-OHdG present
in test samples.
Chapter 2
63
2.2.2.12 Alkaline Comet assay
The alkaline comet assay, also known as single cell gel electrophoresis (SCGE), is a
rapid and sensitive technique for analysis and quantification of DNA damage in
individual living cells. It probes damage such as single and double strand breaks and
alkali-labile sites (Collins et al., 2004). Individual cells are embedded in a thin agarose
gel on a microscope slide. All cellular proteins are then removed from the cells by
lysing and the sample is stained with a DNA specific fluorescent dye. The DNA is then
allowed to denature under alkaline/neutral conditions. Under an applied voltage,
damaged DNA or DNA fragments migrate and thus the process produces an image with
a pronounced head and tail, resembling a comet. The head consists of remaining
undamaged DNA, while the tail consists of damaged (single stranded or double stranded
breaks) or fragments of DNA. The gel is analysed fluorescence in the head and tail and
the length of tail. The extent of DNA liberated from the head of the comet is directly
proportional to the amount of DNA damage.
The olive tail moment (OTM) is one of the most important parameters and is calculated
as the product of two factors: the percentage of DNA in the tail (tail percentage DNA)
and the distance between the intensity centroid of the head (head mean) and the tail (tail
mean) along the x-axis of the comet. It is calculated by the formula-
Olive Tail Moment (OTM) = (Tail.mean - Head.mean) X %Tail DNA/100.
The genotoxicity of NIPAM nanoparticles was assessed using the micro-comet assay
technique in three cell lines (HaCaT, SW480 and PLHC-1 cells). For a typical
experiment, 100 µl of 1x10⁵ cells/ml for 24h; 8×10⁴ cells/ml for 48h; 6×10⁴ cells/ml for
72h exposure of nanoparticles were plated in 96 well microplate and incubated at 37ºC
in 5% CO2 for 24 hours to ensure cell attachment. The PLHC-1 cells were incubated at

Chapter 2
64
30 ºC during the whole experimental time period. The cell monolayers were then
washed with PBS and exposed to varying particle concentrations (12.5 mg/l, 25 mg/l,
100 mg/l, 200 mg/l, 400 mg/l, and 800 mg/l) for different time intervals (24, 48 and
72h). For PAMAM dendrimers, cells were exposed to different concentrations (0.125,
0.25, 0.5, 0.75 and 1 µM) of G4, G5 and G6 for 6, 12 and 24h. After the appropriate
exposure time, cells were washed once with PBS, trypsinized and suspended in low
melting point agarose and cast onto a gel bond film fixed with chamber slides. After the
agarose solidified, it was suspended in freshly prepared and pre-cooled cell lysis buffer
overnight. The following day, electrophoresis was conducted in alkaline electrophoresis
buffer (pH 12.7) for 15 mins (conditions: 300 mA, 1.5 V/cm at 4°C). After completion
of the electrophoresis run time, the Gelbond™ film was treated with neutralisation
buffer (pH 7.5) for 30 minutes to neutralise the DNA embedded gels and then
dehydrated in absolute ethanol for 2 h. Gels were stored in the dark overnight at 4°C,
allowed to dry completely, and were then stained with SYBR-Green nucleic acid stain.
Image analysis was performed using Komet 5.5 software (ANDOR™, UK) and a Nikon
Eclipse E600 microscope attached to a CCD camera. 50 comets were imaged per slide
and 4 slides per each concentration were prepared. Three independent experiments were
performed. Values of OTM and percentage of tail DNA were automatically calculated
by the software. Ethyl Nitrosourea (ENU) 100 µM was used as a positive control to
validate the experimental protocol.
2.2.2.13 Apoptosis assay
Apoptosis is a programmed cell death process, and during apoptosis the cytoplasmic
membrane increases slightly in permeability. The increase of apoptosis induced cell
death as a result of exposure to nanoparticles was investigated by using a kit containing
Chapter 2
65
both YO-PRO®-1 and PI dyes. YO-PRO®-1, is a green fluorescent dye which can enter
apoptotic cells. Propidium iodide (PI), a red fluorescent dye, on the other hand cannot
enter in to the cells. When employed in parallel, they provide a sensitive indicator for
apoptosis (Idziorek et al., 1995; Estaquier et al., 1996). After incubation of a cell
population with YOPRO®-1 and PI, apoptotic cells show green fluorescence, dead cells
show red and green fluorescence, and no fluorescence is observed from live cells
(http://probes.invitrogen.com/media/pis/mp13243.pdf). The relative populations can
easily be distinguished by a flow cytometer that uses the 488 nm line of an argon-ion
laser for excitation.
The PLHC-1 cells were plated in a 6 well plate at a seeding density of 1 x 10⁶ cells/ml
well. The plates were incubated at 30 oC for 24 hour to ensure proper attachment. The
cell monolayer were washed with PBS and then exposed with a range of concentrations
of PAMAM dendrimers (G4, G5 and G6) for different time points (6, 12, 24, 48 and
72h). After the appropriate exposure time, cells were washed once with PBS,
trypsinized, centrifuged, the supernatant removed and then the cell pellets were
suspended in 1 ml PBS. One microlitre of YO-PRO®-1 dye and 1µl PI were added to
the cell suspension and it was incubated on ice for 30 minutes. After the incubation
time, the fluorescence of the cell suspension was measured in flow cytometer
(CyFlow® space). The experimental protocol was validated by using camptothecin as
positive control.
2.2.2.14 Statistics
All experiments were conducted in at least triplicate (three independent experiments).
Ecotoxicity was expressed as mean percentage inhibition for the case of Microtox®
(inhibition of bioluminescence), D. magna (immobilisation) and percentage mortality
was measured for the T. platyurus assay. Fluorescence (AB assay) as fluorescent units
Chapter 2
66
(FUs) was quantified using a microplate reader (TECAN GENios, Grödig, Austria).
Raw data from cell cytotoxicity assays were collated and analyzed using Microsoft
Excel® (Microsoft Corporation, Redmond, WA). Cytotoxicity and the intracellular
ROS (Reactive oxygen species) were expressed as mean percentage inhibition relative
to the unexposed control ± standard deviation (SD). MIP-2, IL-6 and TNF-α data were
calculated from their respective standards and were expressed in mean (pg/ml) ±
standard deviation (SD). Three independent genotoxicity assay was performed, which
was expressed in terms of percentage tail DNA and OTM, and the data shown as the
mean percentage ± standard deviation (SD). The distributions of the data were checked
and found to be normal and thus the data is deemed to be suitable for analysis using one
way ANOVA. Statistical analyses were carried out using one-way analyses of variance
(ANOVA) followed by Dunnett’s multiple comparison tests. Statistical significance
was accepted at P ≤ 0.05 for all tests. Toxicity data was fitted to a sigmoidal curve and
a four parameter logistic model used to calculate EC/LC50 values. This analysis was
preformed using Xlfit3™ a curve fitting add-in for Microsoft® Excel (ID Business
Solutions, UK).
Chapter 2
67
References
Azur Environmental (1998). Microtox® acute toxicity basic test procedures, Report,
Carlsbad, CA. pp 1-13.
Batista, M.L Jr., Santos, R.V., Cunha, L.M., Mattos, K., Oliveira, E.M., Seelaender,
M.C., Costa Rosa, L.F. 2006. Changes in the pro-inflammatory cytokine
production and peritoneal macrophage function in rats with chronic heart failure.
Cytokine, 34, 284-290.
Barnden, M. J., Allison, J., Heath, W. R., Carbone, F.R. 1998. Defective TCR
expression in transgenic mice constructed using cDNA-based alpha- and beta-
chain genes under the control of heterologous regulatory elements. Immunol
Cell Biol. 76, 34-40.
Brunauer, B., Emmett, P. H., Teller. E. 1938. Adsorption of gases in Multimolecular
Layers. J. Am. Chem. Soc. 60, 309–319.
BS EN ISO 6341 (1996). Water Quality Determination of the Inhibition of the Mobility
of Daphnia magna Strauss (Cladocera, Crustacea) Acute Toxicity Test. British
Standards Institution, London.
Casey, A., Herzog, E., Lyng, F.M., Byrne, H.J., Chambers, G., Davoren, M., 2008.
Single walled carbon nanotubes induce indirect cytotoxicity by medium
depletion in A549 lung cells. Toxicol. Lett.179, 78-84.
Casey, A., Davoren, M., Herzog, E., Lyng, F. M., Byrne, H. J., Chambers, G. 2007.
Probing the interaction of single walled carbon nanotubes within cell culture
medium as a precursor to toxicity testing. Carbon, 45, 34–40.
Colson, Y. L., Liu, R., Southard, E. B., Schulz, M. D., Wade, J. E., Griset, A. P., Zubris,
K. A., Padera, R. F., Grinstaff M. W. 2010. The performance of expansile
Chapter 2
68
nanoparticles in a murine model of peritoneal carcinomatosis. Biomaterials, 32,
832-840. Davoren, M., Fogarty, M., 2006. In vitro cytotoxicity assessment of the
biocidal agents sodium o-phenylphenol, sodium o-benzyl-p-chlorophenol, and
sodium p-tertiary amylphenol using established fish cell lines. Toxicol. In Vitro,
20, 1190–1201.
Davoren, M., Ní Shúilleabháin, S., Hartl, M. G, Sheehan, D., O'Brien, N. M.,
O'Halloran, J., Van Pelt FN, Mothersill C. 2005. Assessing the potential of fish
cell lines as tools for the cytotoxicity testing of estuarine sediment aqueous
elutriates. . Toxicology In vitro, 19, 421-431.
Darzynkiewicz, Z., Juan, G., Li, X., Gorczyca, W., Murakami, T., Traganos, F.1997.
Cytometry in cell neurobiology: analysis of apoptosis and accidental cell death
(necrosis). Cytometry. 27, 1-20.
Estaquier, J., Tanaka, M., Suda, T., Nagata, S., Golstein, P., Ameisen, J. C. 1996. Fas-
mediated apoptosis of CD4+ and CD8+ T cells from human immunodeficiency
virus-infected persons: differential in vitro preventive effect of cytokines and
protease antagonists. Blood. 87, 4959-66.
Elbekai, R.H and El-Kadi, A.O.S., 2005. The role of oxidative stress in the modulation
of aryl hydrocarbon receptor-regulated genes by As3+, Cd2+, and Cr6+. Free
RadicalBiol. Med. 39, 1499–1511.
Gorelov, A.V., DuChesne, A., Dawson, KA. 1997. Phase separation in dilute solutions
of poly (N-isopropylacrylamide). Physica A. 240, 443-452.
http://probes.invitrogen.com/media/pis/g002.pdf, accessed on 16th June 2009
http://www.inspirenano.com, accessed on 16th June 2009
http://www.dendritech.com, accessed on 16th June 2009

Chapter 2
69
Idziorek, T., Estaquier, J., De Bels, F., Ameisen, J. C. 1995. YOPRO-1 permits
cytofluorometric analysis of programmed cell death (apoptosis) without
interfering with cell viability. J Immunol Methods. 185, 249-58.
Minagh, E., Hernan, R., O'Rourke, K., Lyng, F. M, Davoren, M. 2009. Aquatic
ecotoxicity of the selective serotonin reuptake inhibitor sertraline hydrochloride in a
battery of freshwater test species. Ecotoxicology and Environmental Safety, 72,
434-440.
Nyholm, N. 1990. Expression of results from growth inhibition toxicity tests with algae.
Arch. Environ. Contam. Toxicol. 19, 518-522.
OECD, 2002. Guideline for testing of chemicals. In: Freshwater Alga and
Cyanobacteria, Growth Inhibition Test, Method 201, OECD.
Osuchowski, M.F., Siddiqui, J., Copeland, S., Remick D.G. 2005. Sequential ELISA to
profile multiple cytokines from small volumes. Journal of Immunological
Methods, 302, 172–181
Osuchowski, M.F., Welch, K., Siddiqui, J., Remick, D.G. 2006. Circulating
Cytokine/Inhibitor Profiles Reshape the Understanding of the SIRS/CARS
Continuum in Sepsis and Predict Mortality. Journal of Immunology, 177, 1967-
74.
Smola, H., Thiekotter, G., Fusenig, N.E., 1993. Mutual Induction ofGrowthFactorGene
Expression by Epidermal-Dermal Cell Interaction. J. Cell Biol. 122, 417–429.
Thamnotoxkit, F™., 1995. Crustacean toxicity screening test for freshwater. Standard
Operating Procedure, Creasal, Deinze, Belgium.

Chapter 3
70
Chapter 3
Characterisation and Ecotoxicology of
PNIPAM and NIPAM/BAM Copolymer
Nanoparticles
Adapted from “Preparation, Characterization of NIPAM and NIPAM/BAM
Copolymer Nanoparticles and their Acute Toxicity Testing using an Aquatic test
battery”. Aquatic Toxicology, 2009. 92, 146-154.
Authors: Pratap C. Naha, Alan Casey, Tiziana Tenuta, Iseult Lynch, Kenneth A.
Dawson, Hugh J. Byrne, Maria Davoren
Chapter 3
71
3.1. Introduction
As nanomaterials are currently being widely used in modern technology, there is an
increasing need for information regarding the human health and environmental
implications of these nanomaterials. To date, the human health impacts of
nanomaterials have received the greatest attention and it has been demonstrated through
both in vivo and in vitro studies with mammalian test systems that the properties that
make nanomaterials so attractive from a commercial application viewpoint (e.g.
nanoparticle size and increased surface area) can also potentially be responsible for
undesirable health effects (Oberdörster et al., 2005, Meng et al., 2007; Papageorgiou et
al., 2007; Singh et al., 2007; Poland et al., 2008).
The assessment of environmental effects requires an understanding of their mobility,
reactivity, ecotoxicity and persistency (Nowack and Buchelli, 2007). Recently reports
on the ecotoxicity of various nanomaterials have started to emerge in the literature. Of
the studies conducted, the majority have focused on the carbon based materials (Lovern
and Klaper, 2006; Zhu et al., 2006; Cheng et al., 2007; Lin and Xing, 2007; Smith et al.,
2007; Baun et al., 2008; Lovern et al., 2007) but there have also been recent reports on
the ecotoxicological evaluation of various metal based nanomaterials (Lovern et al.,
2007; Federici et al., 2007; Heinlaan et al., 2008; Gagńe et al., 2008; Mortimer et al.,
2008) and dendrimers (Mortimer et al., 2008). These studies have looked at various
aquatic species representing the different trophic levels (decomposer, primary producer,
invertebrates and vertebrates).
The aim of the present investigation was therefore the preparation, characterisation and
ecotoxicological assessment of PNIPAM and NIPAM/BAM copolymer nanoparticles.
Variation of the co-polymerisation ratio from 100% NIPAM through NIPAM/BAM
85:15, NIPAM/BAM 65:35 and NIPAM/AM 50:50 allowed a systematic variation of
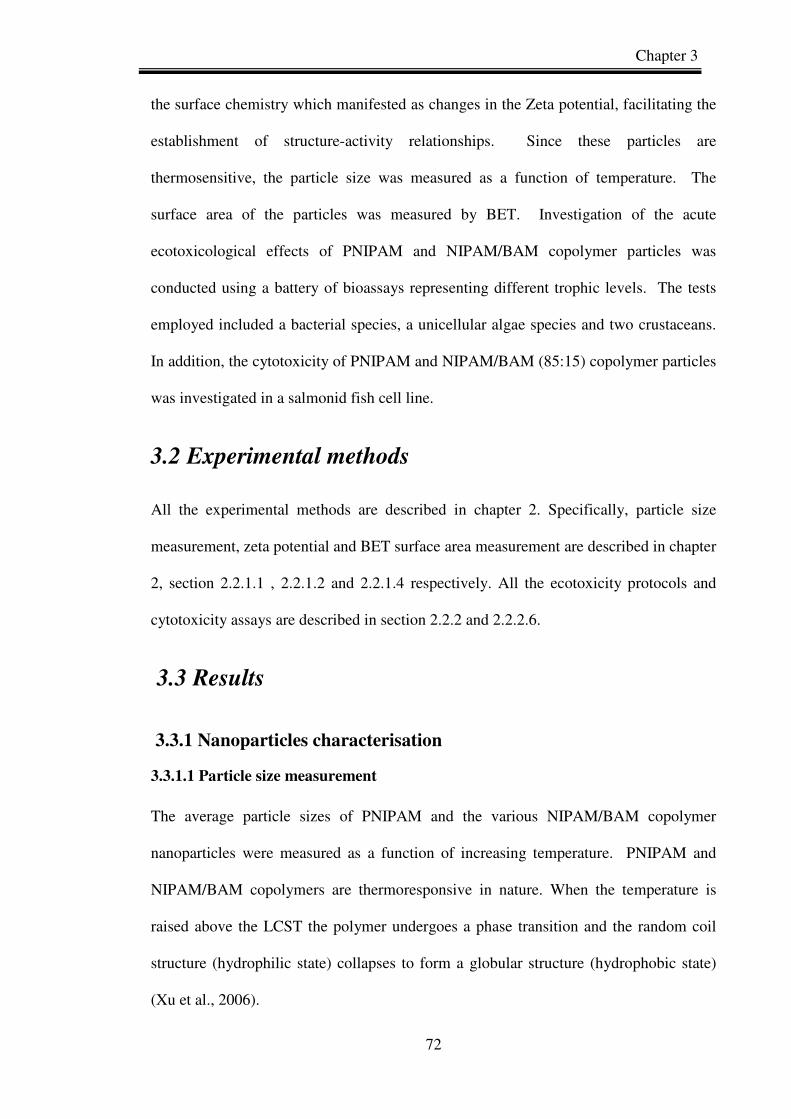
Chapter 3
72
the surface chemistry which manifested as changes in the Zeta potential, facilitating the
establishment of structure-activity relationships. Since these particles are
thermosensitive, the particle size was measured as a function of temperature. The
surface area of the particles was measured by BET. Investigation of the acute
ecotoxicological effects of PNIPAM and NIPAM/BAM copolymer particles was
conducted using a battery of bioassays representing different trophic levels. The tests
employed included a bacterial species, a unicellular algae species and two crustaceans.
In addition, the cytotoxicity of PNIPAM and NIPAM/BAM (85:15) copolymer particles
was investigated in a salmonid fish cell line.
3.2 Experimental methods
All the experimental methods are described in chapter 2. Specifically, particle size
measurement, zeta potential and BET surface area measurement are described in chapter
2, section 2.2.1.1 , 2.2.1.2 and 2.2.1.4 respectively. All the ecotoxicity protocols and
cytotoxicity assays are described in section 2.2.2 and 2.2.2.6.
3.3 Results
3.3.1 Nanoparticles characterisation
3.3.1.1 Particle size measurement
The average particle sizes of PNIPAM and the various NIPAM/BAM copolymer
nanoparticles were measured as a function of increasing temperature. PNIPAM and
NIPAM/BAM copolymers are thermoresponsive in nature. When the temperature is
raised above the LCST the polymer undergoes a phase transition and the random coil
structure (hydrophilic state) collapses to form a globular structure (hydrophobic state)
(Xu et al., 2006).
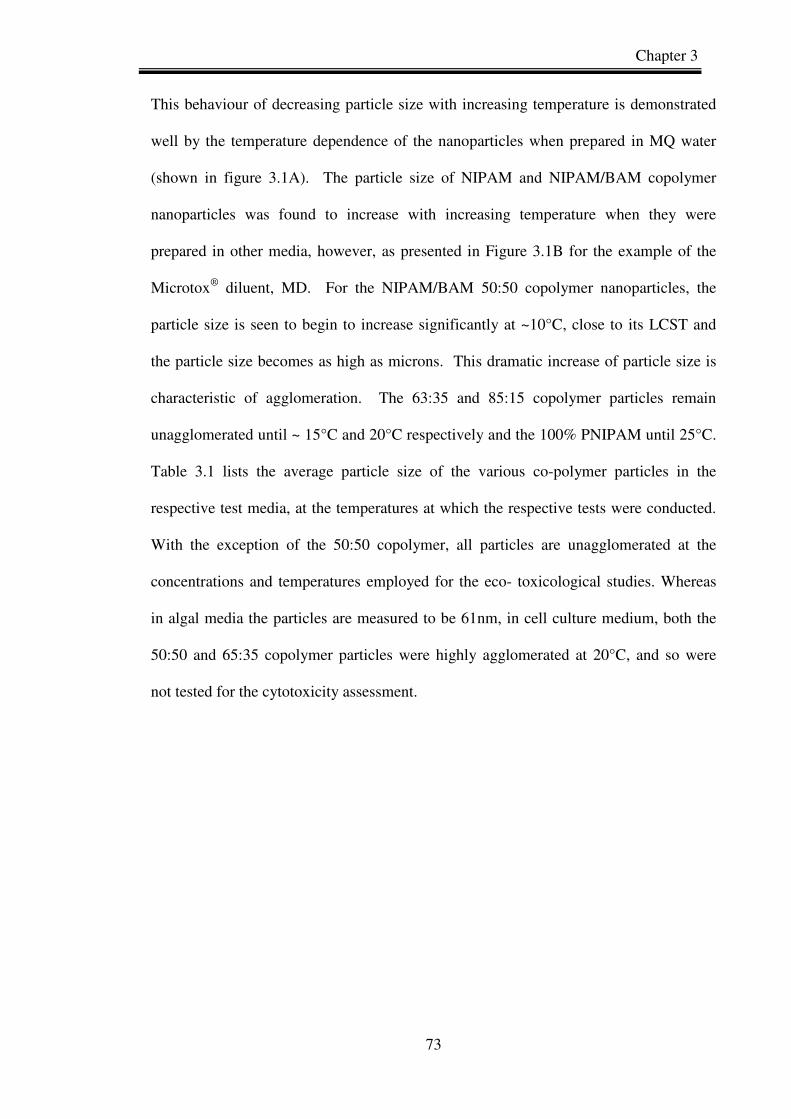
Chapter 3
73
This behaviour of decreasing particle size with increasing temperature is demonstrated
well by the temperature dependence of the nanoparticles when prepared in MQ water
(shown in figure 3.1A). The particle size of NIPAM and NIPAM/BAM copolymer
nanoparticles was found to increase with increasing temperature when they were
prepared in other media, however, as presented in Figure 3.1B for the example of the
Microtox® diluent, MD. For the NIPAM/BAM 50:50 copolymer nanoparticles, the
particle size is seen to begin to increase significantly at ~10°C, close to its LCST and
the particle size becomes as high as microns. This dramatic increase of particle size is
characteristic of agglomeration. The 63:35 and 85:15 copolymer particles remain
unagglomerated until ~ 15°C and 20°C respectively and the 100% PNIPAM until 25°C.
Table 3.1 lists the average particle size of the various co-polymer particles in the
respective test media, at the temperatures at which the respective tests were conducted.
With the exception of the 50:50 copolymer, all particles are unagglomerated at the
concentrations and temperatures employed for the eco- toxicological studies. Whereas
in algal media the particles are measured to be 61nm, in cell culture medium, both the
50:50 and 65:35 copolymer particles were highly agglomerated at 20°C, and so were
not tested for the cytotoxicity assessment.
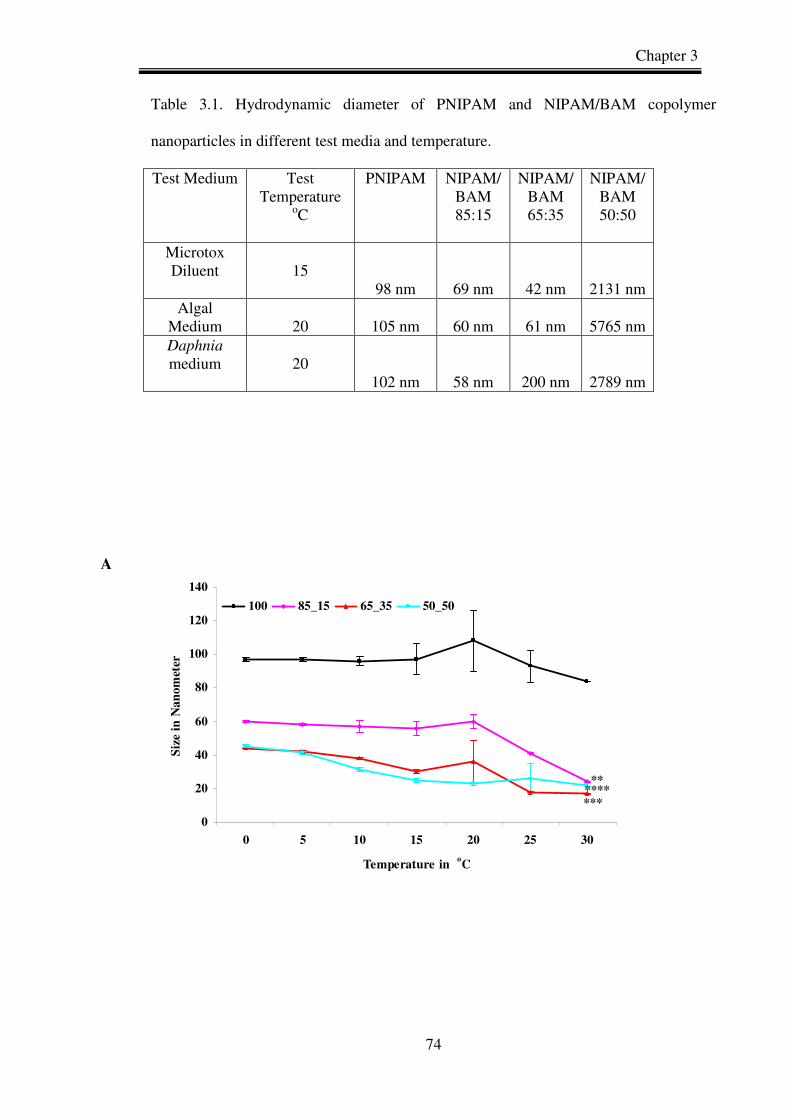
Chapter 3
74
Table 3.1. Hydrodynamic diameter of PNIPAM and NIPAM/BAM copolymer
nanoparticles in different test media and temperature.
Test Medium
Test Temperature
oC
PNIPAM NIPAM/BAM 85:15
NIPAM/BAM 65:35
NIPAM/BAM 50:50
Microtox Diluent
15
98 nm 69 nm 42 nm 2131 nm Algal
Medium
20 105 nm 60 nm 61 nm 5765 nm Daphnia
medium
20
102 nm 58 nm 200 nm 2789 nm
0
20
40
60
80
100
120
140
0 5 10 15 20 25 30
Temperature in oC
Siz
e in
Na
no
met
er
100 85_15 65_35 50_50
**
*******
A

Chapter 3
75
10
100
1000
10000
0 5 10 15 20 25 30
Temperature in oC
Siz
e in
Nan
omet
er
100
85_15
65_35
50_50
*
**
**
******
****
****
**** ****
***
Figure 3.1. Hydrodynamic diameter of PNIPAM and NIPAM/BAM copolymer
nanoparticles. (A) MQ water (There is a significant difference of decreasing of particle
size of all the series of nanoparticles except PNIPAM nanoparticles between 0 °C and
30 °C); and figure (B) Microtox diluent (MD) as a function of increasing temperature.
Data is presented as the mean ± SD (N=6). * indicate a significant difference of particle
size as compare to 0 °C (p <0.05). *, **, *** and **** denotes for PNIPAM.
NIPAM/BAM 85:15, NIPAM/BAM 65:35 and NIPAM/BAM 50:50 respectively.
3.3.1.2 Zeta potential measurement
The zeta potentials of PNIPAM and the different NIPAM/BAM copolymer particles
was measured in the various test media; MQ water, MD, AM, and DM. The results are
shown in Figure 3.2. Significant difference (p <0.05) of zeta potential in each
rersptective media as compared to milli-Q water with the PNIPAM and NIPAM/BAM
B
Chapter 3
76
series of nanoparticles was observed. For all media types, increasing the ratio of BAM
in the copolymer nanoparticles was shown to cause a decrease in their zeta potential.
No correlation between zeta potential and particle size was observed.
-50
-40
-30
-20
-10
0
10
100 85_15 65_35 50_50
Zet
a p
ote
nti
al
in m
V
** *
**
*
*
* *
*
*
Figure 3.2. Zeta potential of PNIPAM and NIPAM/BAM copolymer particles in
different media. ( ) MQ; ( ) AM; ( ) MD; ( ) DM. Data is presented as the mean ±
SD (N=6). * denotes significant difference (p <0.05) of zeta potential in different media
as compare to milli-Q water.
3.3.1.3 Surface Area measurement
The surface area of PNIPAM, NIPAM/BAM 85:15, NIPAM/BAM 65:35 and
NIPAM/BAM 50:50 particles was found to be 5.77 ± 0.07 m²/g, 9.57 ± 0.06 m²/g, 14.1
± 0.1 m²/g and 8.5 ± 0.1 m²/g respectively. With the exception of the 50:50 copolymers,
the surface areas correlate reasonably with the particle size.
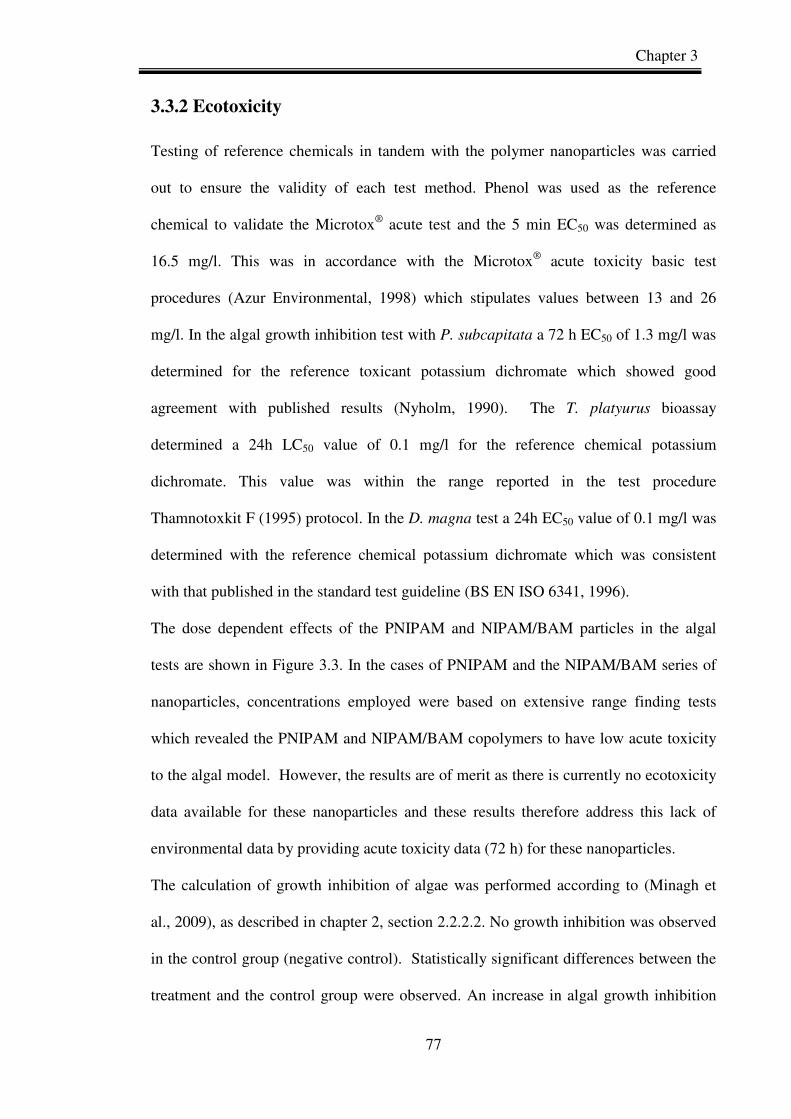
Chapter 3
77
3.3.2 Ecotoxicity
Testing of reference chemicals in tandem with the polymer nanoparticles was carried
out to ensure the validity of each test method. Phenol was used as the reference
chemical to validate the Microtox® acute test and the 5 min EC50 was determined as
16.5 mg/l. This was in accordance with the Microtox® acute toxicity basic test
procedures (Azur Environmental, 1998) which stipulates values between 13 and 26
mg/l. In the algal growth inhibition test with P. subcapitata a 72 h EC50 of 1.3 mg/l was
determined for the reference toxicant potassium dichromate which showed good
agreement with published results (Nyholm, 1990). The T. platyurus bioassay
determined a 24h LC50 value of 0.1 mg/l for the reference chemical potassium
dichromate. This value was within the range reported in the test procedure
Thamnotoxkit F (1995) protocol. In the D. magna test a 24h EC50 value of 0.1 mg/l was
determined with the reference chemical potassium dichromate which was consistent
with that published in the standard test guideline (BS EN ISO 6341, 1996).
The dose dependent effects of the PNIPAM and NIPAM/BAM particles in the algal
tests are shown in Figure 3.3. In the cases of PNIPAM and the NIPAM/BAM series of
nanoparticles, concentrations employed were based on extensive range finding tests
which revealed the PNIPAM and NIPAM/BAM copolymers to have low acute toxicity
to the algal model. However, the results are of merit as there is currently no ecotoxicity
data available for these nanoparticles and these results therefore address this lack of
environmental data by providing acute toxicity data (72 h) for these nanoparticles.
The calculation of growth inhibition of algae was performed according to (Minagh et
al., 2009), as described in chapter 2, section 2.2.2.2. No growth inhibition was observed
in the control group (negative control). Statistically significant differences between the
treatment and the control group were observed. An increase in algal growth inhibition

Chapter 3
78
with increasing nanoparticles exposure concentration is observed. The growth inhibition
was significant (p <0.05) as compared to control group. Maximum algal growth
inhibition was observed for NIPAM/BAM 50:50 particles, the least growth inhibition
being observed for PNIPAM particles.
**
***
**
***
*
*
*
*
*
*
*
*
*
0
10
20
30
40
50
60
70
80
10 50 100 500 1000
Concentration of Nanoparticles in mg/l
% G
row
th I
nh
ibit
ion
100 85_15
65_35 50_50
Figure 3.3. Effect of NIPAM and NIPAM/BAM nanoparticles on P. subcapitata growth
inhibition. Data is presented as the mean ± SD (N=3). *Denotes significant difference
from control (P ≤ 0.05).
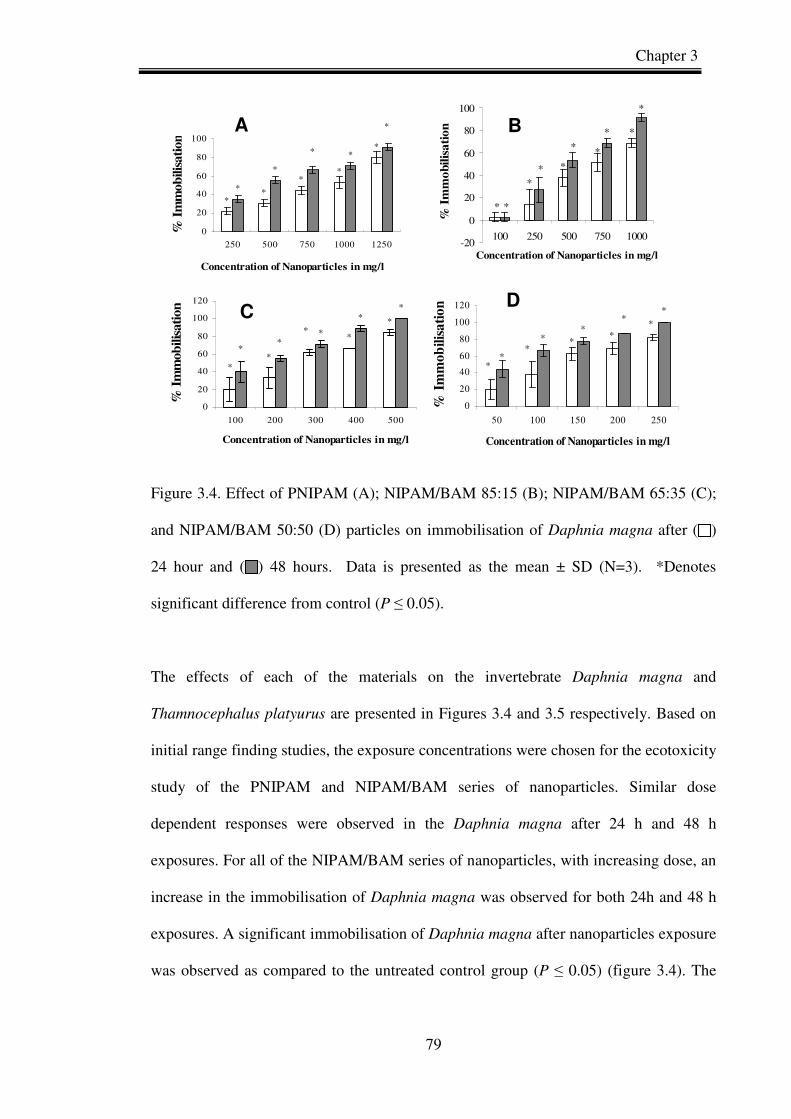
Chapter 3
79
Figure 3.4. Effect of PNIPAM (A); NIPAM/BAM 85:15 (B); NIPAM/BAM 65:35 (C);
and NIPAM/BAM 50:50 (D) particles on immobilisation of Daphnia magna after ( )
24 hour and ( ) 48 hours. Data is presented as the mean ± SD (N=3). *Denotes
significant difference from control (P ≤ 0.05).
The effects of each of the materials on the invertebrate Daphnia magna and
Thamnocephalus platyurus are presented in Figures 3.4 and 3.5 respectively. Based on
initial range finding studies, the exposure concentrations were chosen for the ecotoxicity
study of the PNIPAM and NIPAM/BAM series of nanoparticles. Similar dose
dependent responses were observed in the Daphnia magna after 24 h and 48 h
exposures. For all of the NIPAM/BAM series of nanoparticles, with increasing dose, an
increase in the immobilisation of Daphnia magna was observed for both 24h and 48 h
exposures. A significant immobilisation of Daphnia magna after nanoparticles exposure
was observed as compared to the untreated control group (P ≤ 0.05) (figure 3.4). The
*
**
**
*
**
*
*
0
20
40
60
80
100
250 500 750 1000 1250
Concentration of Nanoparticles in mg/l
% I
mm
ob
ilisa
tion
*
*
*
*
*
*
*
*
*
*
-20
0
20
40
60
80
100
100 250 500 750 1000
Concentration of Nanoparticles in mg/l
% I
mm
ob
ilis
ati
on
*
* *
**
**
**
*
0
20
40
60
80
100
120
100 200 300 400 500
Concentration of Nanoparticles in mg/l
% I
mm
obilis
atio
n
*
**
**
*
**
**
0
20
40
60
80
100
120
50 100 150 200 250
Concentration of Nanoparticles in mg/l%
Im
mob
ilisa
tio
n
A
C
B
D
Chapter 3
80
trend of toxicity of the PNIPAM and NIPAM/BAM series of nanoparticles is PNIPAM
< NIPAM/BAM 85:15 < NIPAM/BAM 65:35 < NIPAM/BAM 50:50.
In the case of Thamnocephalus platyurus, a similar dose dependent response is observed
(figure 3.5). A significant (P ≤ 0.05) mortality of Thamnocephalus platyurus after
nanoparticle exposure was observed as compared to the untreated group (figure 3.5).
The mortality of Thamnocephalus platyurus increases with increased concentration of
PNIPAM and NIPAM/BAM nanoparticles after 24 h exposure. The trend of mortality
of Thamnocephalus platyurus due exposure to the PNIPAM and NIPAM/BAM series of
nanoparticles is PNIPAM ≤ NIPAM/BAM 85:15 < NIPAM/BAM 65:35 <
NIPAM/BAM 50:50.
The cytotoxicity of PNIPAM and NIPAM/BAM 85:15 particles was tested in the
concentration range 25-1000 mg l-1in the RTG-2 cell line at four time points i.e 24 h, 48
h, 72 h and 96 h. NIPAM/BAM 65:35 and NIPAM/BAM 50:50 nanoparticles are not
stable in the cell culture media due to a high degree of agglomeration. No significant
toxicity was found for PNIAPM and NIPAM/BAM 85:15 nanoparticles at any of the
test concentrations with either of the endpoints studied at any of the time points (shown
in figure 3.6).
XlfitTM software was employed to evaluate the the EC50/LC50 values for the respective
assays and these are listed in Tables 3.2-3.5. In cases where the endpoint does not reach
a value of 50%, the software cannot calculate a value for EC50. For these cases, a return
of “not calculated” has been recorded. In tables 3.2-3.5, the Lowest Observed Effective
Concentration (LOEC) was calculated where a statistically significant (P≤ 0.05) effect
was observed at the lowest concentration. However the No Observed Effective

Chapter 3
81
Concentration (NOEC) is the concentration where no statistically significant (P≤ 0.05)
effects were observed. As in some cases, significant effects have been observed at the
lowest concentrations, the NOEC values are presented as less than (<) the LOEC value.
Figure 3.5 : Effect of PNIPAM ( ) and NIPAM/BAM 85:15 ( ) (A); NIPAM/BAM
65:35 (B); and NIPAM/BAM 50:50 (C) particles on lethality of Thamnocephalus
platyurus. Data is presented as the mean ± SD (N=3). *Denotes significant difference
from control (P≤ 0.05).
**
*
**
020406080
100120
200 300 400 500 600
Concentration of Nanoparticles in
mg/l
% M
orta
lity
*
*
*
*
*
**
*
*
*
0
20
40
60
80
100
120
500 800 1000 1250 1500Concentration of Nanoparticles in
mg/l
% M
ort
ality
**
*
**
0
20
40
60
80
100
120
200 400 600 800 1000
Concentration of Nanoparticles in
mg/l
% M
ort
ality
A
C
B
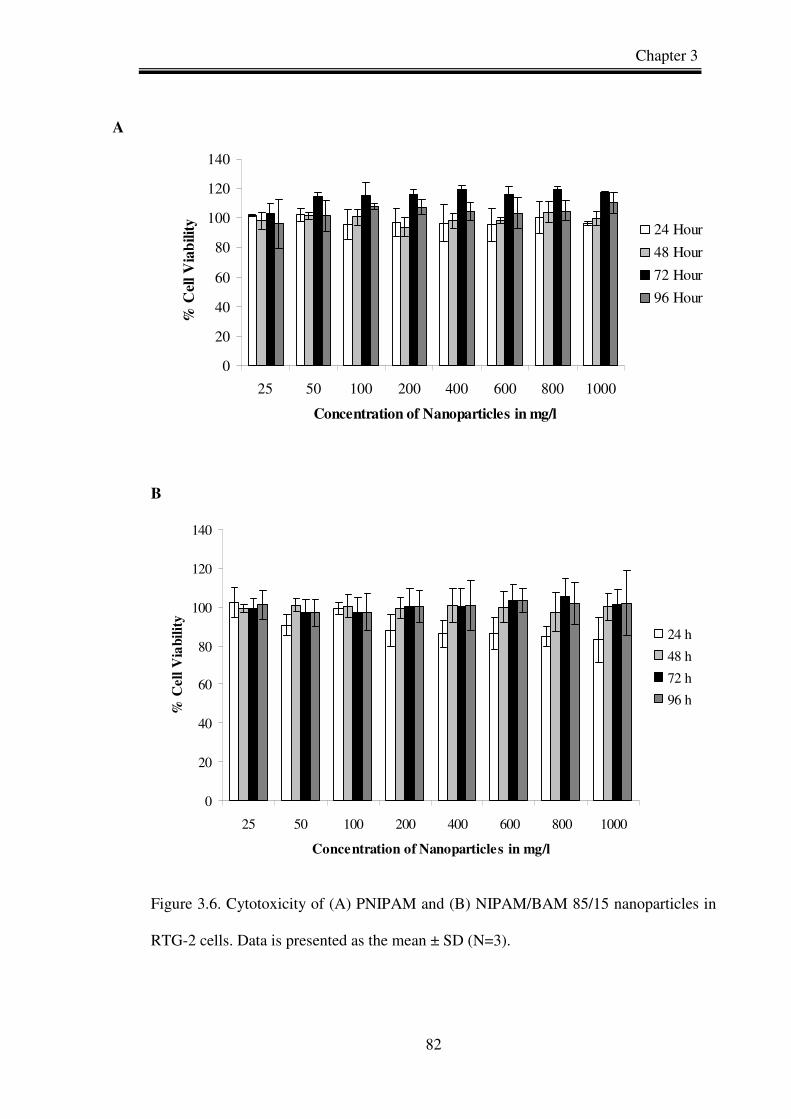
Chapter 3
82
0
20
40
60
80
100
120
140
25 50 100 200 400 600 800 1000
Concentration of Nanoparticles in mg/l
% C
ell
Via
bili
ty 24 Hour
48 Hour
72 Hour
96 Hour
B
0
20
40
60
80
100
120
140
25 50 100 200 400 600 800 1000
Concentration of Nanoparticles in mg/l
% C
ell
Via
bil
ity
24 h
48 h
72 h
96 h
Figure 3.6. Cytotoxicity of (A) PNIPAM and (B) NIPAM/BAM 85/15 nanoparticles in
RTG-2 cells. Data is presented as the mean ± SD (N=3).
A
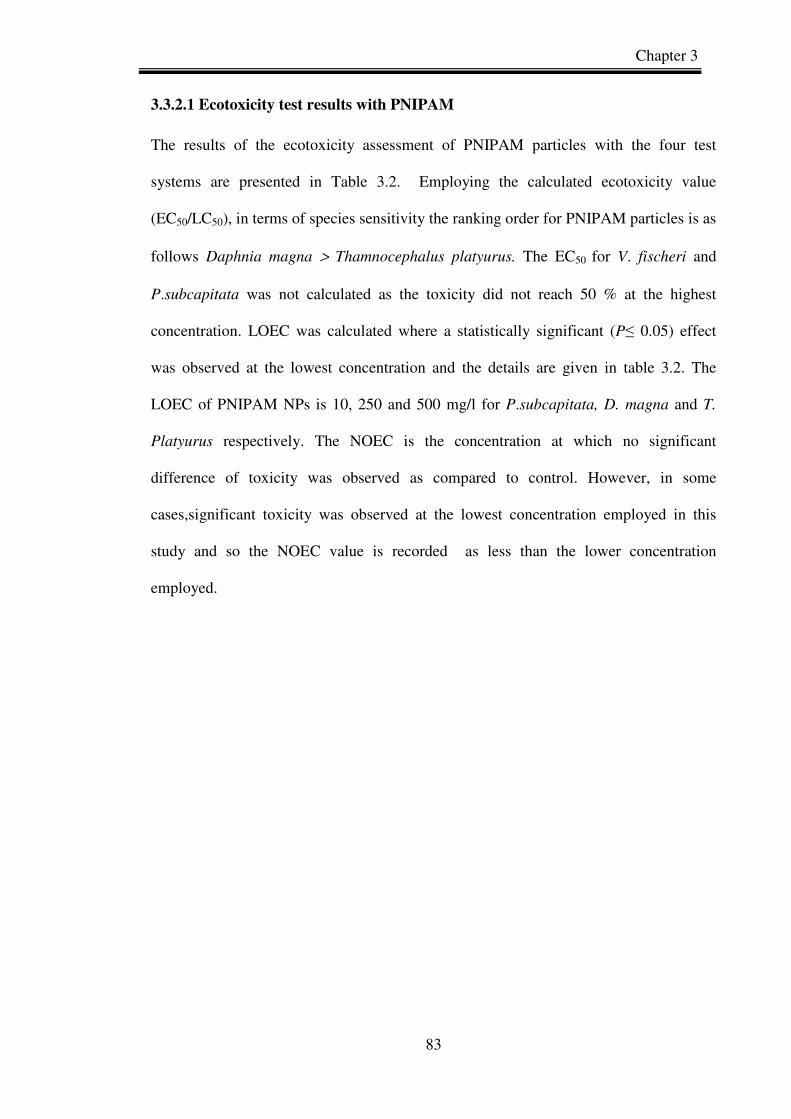
Chapter 3
83
3.3.2.1 Ecotoxicity test results with PNIPAM
The results of the ecotoxicity assessment of PNIPAM particles with the four test
systems are presented in Table 3.2. Employing the calculated ecotoxicity value
(EC50/LC50), in terms of species sensitivity the ranking order for PNIPAM particles is as
follows Daphnia magna > Thamnocephalus platyurus. The EC50 for V. fischeri and
P.subcapitata was not calculated as the toxicity did not reach 50 % at the highest
concentration. LOEC was calculated where a statistically significant (P≤ 0.05) effect
was observed at the lowest concentration and the details are given in table 3.2. The
LOEC of PNIPAM NPs is 10, 250 and 500 mg/l for P.subcapitata, D. magna and T.
Platyurus respectively. The NOEC is the concentration at which no significant
difference of toxicity was observed as compared to control. However, in some
cases,significant toxicity was observed at the lowest concentration employed in this
study and so the NOEC value is recorded as less than the lower concentration
employed.
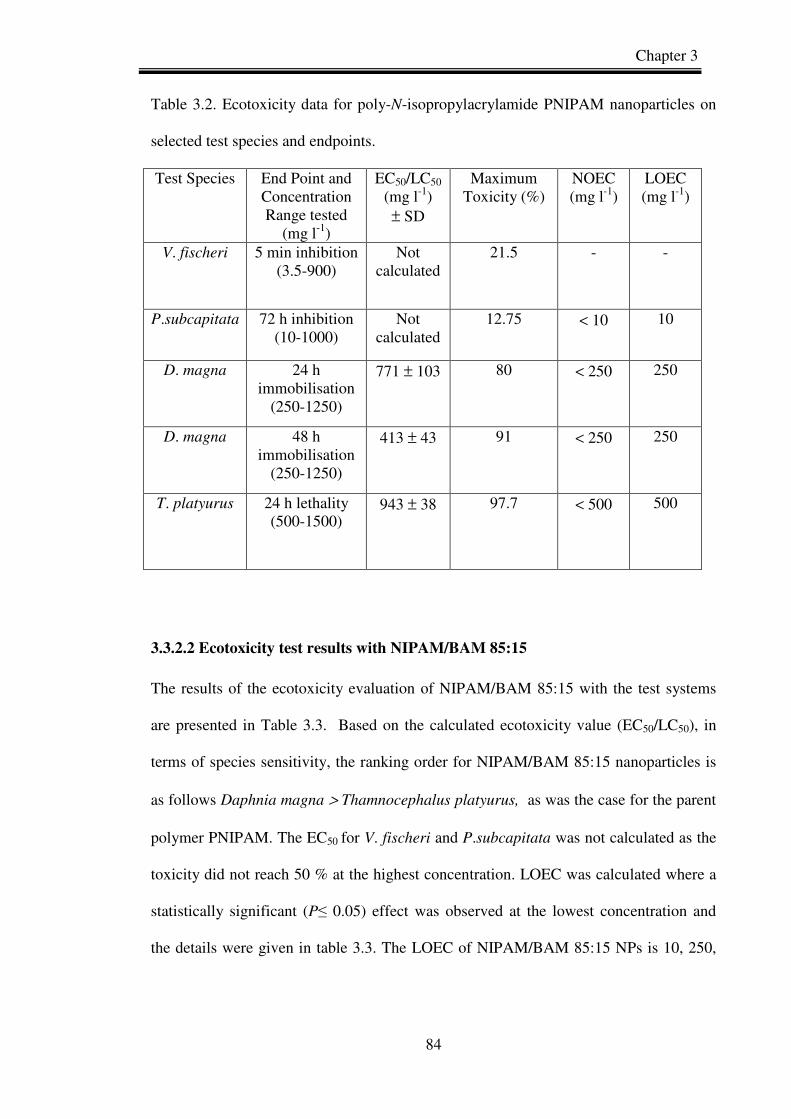
Chapter 3
84
Table 3.2. Ecotoxicity data for poly-N-isopropylacrylamide PNIPAM nanoparticles on
selected test species and endpoints.
Test Species End Point and Concentration Range tested
(mg l-1)
EC50/LC50 (mg l-1) ± SD
Maximum Toxicity (%)
NOEC (mg l-1)
LOEC (mg l-1)
V. fischeri 5 min inhibition (3.5-900)
Not calculated
21.5 - -
P.subcapitata 72 h inhibition (10-1000)
Not calculated
12.75 < 10 10
D. magna 24 h immobilisation
(250-1250)
771 ± 103 80 < 250 250
D. magna 48 h immobilisation
(250-1250)
413 ± 43 91 < 250 250
T. platyurus 24 h lethality (500-1500)
943 ± 38 97.7 < 500 500
3.3.2.2 Ecotoxicity test results with NIPAM/BAM 85:15
The results of the ecotoxicity evaluation of NIPAM/BAM 85:15 with the test systems
are presented in Table 3.3. Based on the calculated ecotoxicity value (EC50/LC50), in
terms of species sensitivity, the ranking order for NIPAM/BAM 85:15 nanoparticles is
as follows Daphnia magna > Thamnocephalus platyurus, as was the case for the parent
polymer PNIPAM. The EC50 for V. fischeri and P.subcapitata was not calculated as the
toxicity did not reach 50 % at the highest concentration. LOEC was calculated where a
statistically significant (P≤ 0.05) effect was observed at the lowest concentration and
the details were given in table 3.3. The LOEC of NIPAM/BAM 85:15 NPs is 10, 250,
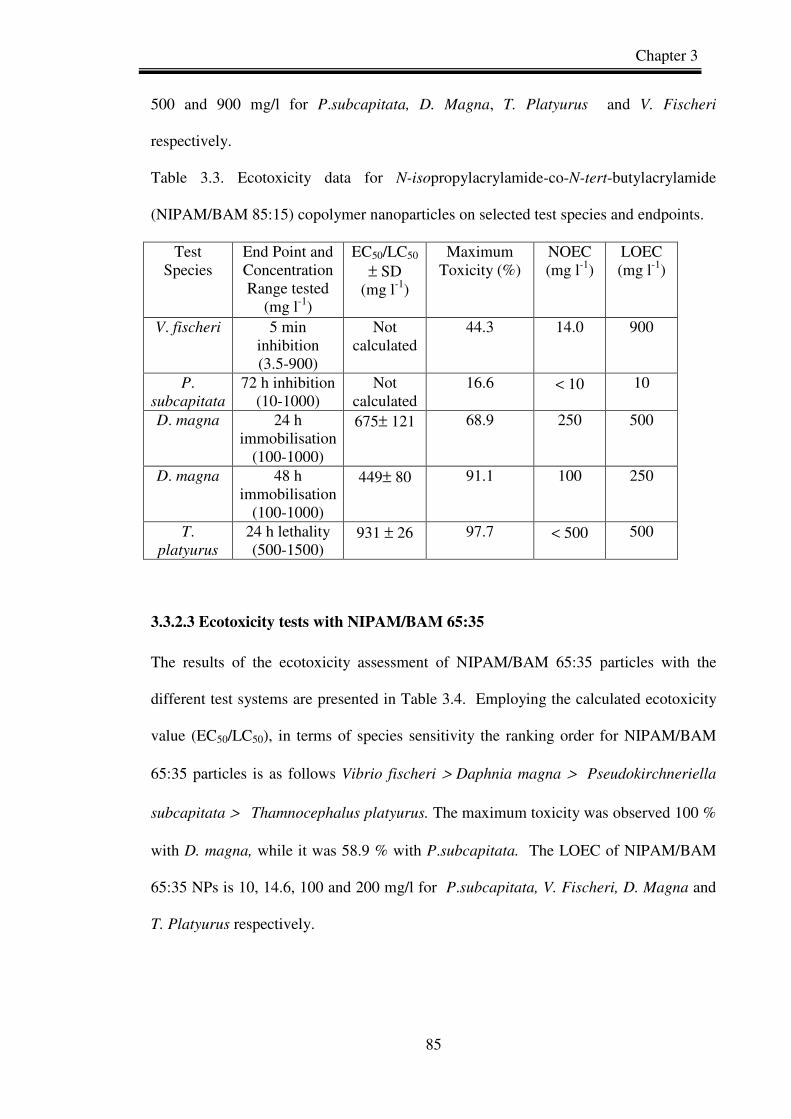
Chapter 3
85
500 and 900 mg/l for P.subcapitata, D. Magna, T. Platyurus and V. Fischeri
respectively.
Table 3.3. Ecotoxicity data for N-isopropylacrylamide-co-N-tert-butylacrylamide
(NIPAM/BAM 85:15) copolymer nanoparticles on selected test species and endpoints.
Test Species
End Point and Concentration Range tested
(mg l-1)
EC50/LC50 ± SD
(mg l-1)
Maximum Toxicity (%)
NOEC (mg l-1)
LOEC (mg l-1)
V. fischeri 5 min inhibition (3.5-900)
Not calculated
44.3 14.0 900
P. subcapitata
72 h inhibition (10-1000)
Not calculated
16.6 < 10 10
D. magna 24 h immobilisation
(100-1000)
675± 121 68.9 250 500
D. magna 48 h immobilisation
(100-1000)
449± 80 91.1 100 250
T. platyurus
24 h lethality (500-1500)
931 ± 26 97.7 < 500 500
3.3.2.3 Ecotoxicity tests with NIPAM/BAM 65:35
The results of the ecotoxicity assessment of NIPAM/BAM 65:35 particles with the
different test systems are presented in Table 3.4. Employing the calculated ecotoxicity
value (EC50/LC50), in terms of species sensitivity the ranking order for NIPAM/BAM
65:35 particles is as follows Vibrio fischeri > Daphnia magna > Pseudokirchneriella
subcapitata > Thamnocephalus platyurus. The maximum toxicity was observed 100 %
with D. magna, while it was 58.9 % with P.subcapitata. The LOEC of NIPAM/BAM
65:35 NPs is 10, 14.6, 100 and 200 mg/l for P.subcapitata, V. Fischeri, D. Magna and
T. Platyurus respectively.
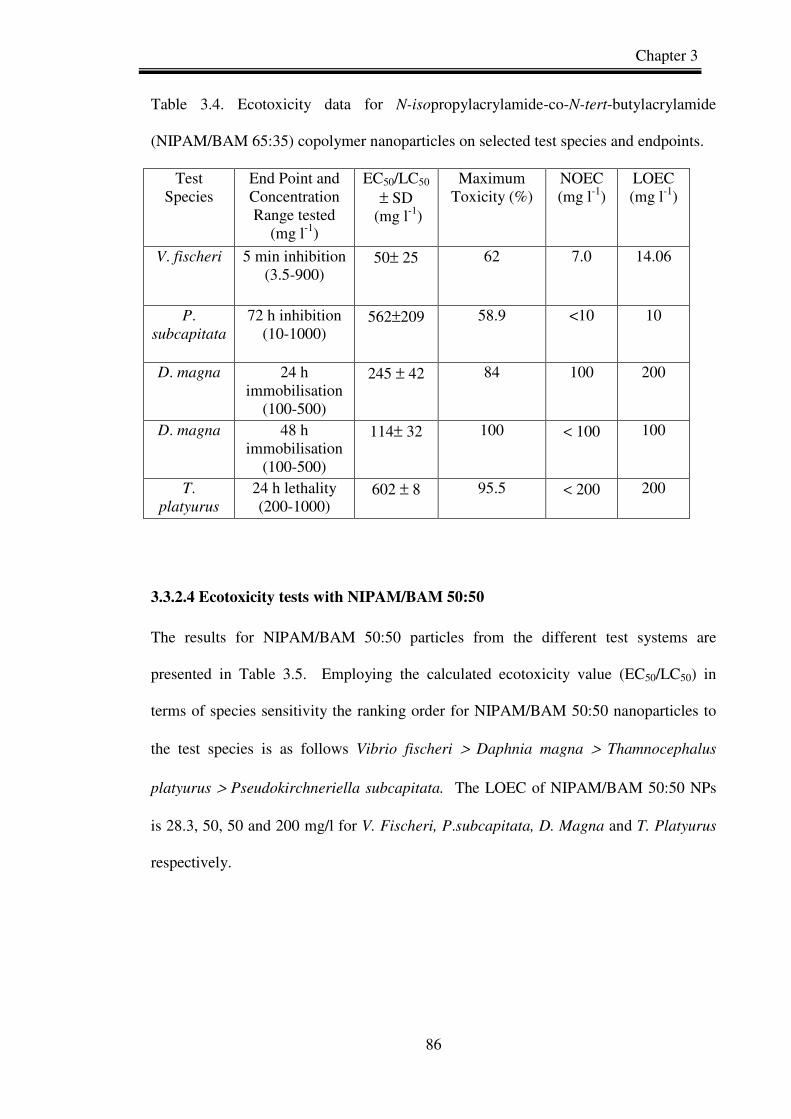
Chapter 3
86
Table 3.4. Ecotoxicity data for N-isopropylacrylamide-co-N-tert-butylacrylamide
(NIPAM/BAM 65:35) copolymer nanoparticles on selected test species and endpoints.
Test Species
End Point and Concentration Range tested
(mg l-1)
EC50/LC50 ± SD
(mg l-1)
Maximum Toxicity (%)
NOEC (mg l-1)
LOEC (mg l-1)
V. fischeri 5 min inhibition (3.5-900)
50± 25
62 7.0 14.06
P. subcapitata
72 h inhibition (10-1000)
562±209
58.9 <10 10
D. magna 24 h immobilisation
(100-500)
245 ± 42 84 100 200
D. magna 48 h immobilisation
(100-500)
114± 32 100 < 100 100
T. platyurus
24 h lethality (200-1000)
602 ± 8 95.5 < 200 200
3.3.2.4 Ecotoxicity tests with NIPAM/BAM 50:50
The results for NIPAM/BAM 50:50 particles from the different test systems are
presented in Table 3.5. Employing the calculated ecotoxicity value (EC50/LC50) in
terms of species sensitivity the ranking order for NIPAM/BAM 50:50 nanoparticles to
the test species is as follows Vibrio fischeri > Daphnia magna > Thamnocephalus
platyurus > Pseudokirchneriella subcapitata. The LOEC of NIPAM/BAM 50:50 NPs
is 28.3, 50, 50 and 200 mg/l for V. Fischeri, P.subcapitata, D. Magna and T. Platyurus
respectively.

Chapter 3
87
Table 3.5. Ecotoxicity data for N-isopropylacrylamide-co-N-tert-butylacrylamide
(NIPAM/BAM 50:50) copolymer nanoparticles on selected test species and endpoints
Test Species
End Point and Concentration Range tested
(mg l-1)
EC50/LC50 ± SD
(mg l-1)
Maximum Toxicity (%)
NOEC (mg l-1)
LOEC (mg l-1)
V. fischeri 5 min inhibition (3.5-900)
24± 0.5 71.3 14.0 28.3
P. subcapitata
72 h inhibition (10-1000)
707 ±66
65 10 50
D. magna 24 h immobilisation
(50-250)
119± 31 82.2 50 100
D. magna 48 h immobilisation
(50-250)
60± 14 100 < 50 50
T. platyurus
24 h lethality (200-600)
353± 8 95.5 < 200 200
3.4 Discussion
The particle size of the different materials was measured in different media. The
expected particle size decrease as a function of temperature expected for these
thermoresponsive polymers is observed only in the MQ environment. The particle size
of PNIPAM and NIPAM/BAM copolymer nanoparticles was found to increase with
increase in temperature in AM, DM, and MD media, however, with the average particle
size increasing to several microns as the materials undergo the phase transition. This
behaviour is characteristic of agglomeration, as a consequence of the screening effect of
the salts in the various test media. It is proposed therefore that the particles interact
with different components of the media and agglomerates when the temperature is
increased above the respective LCST.
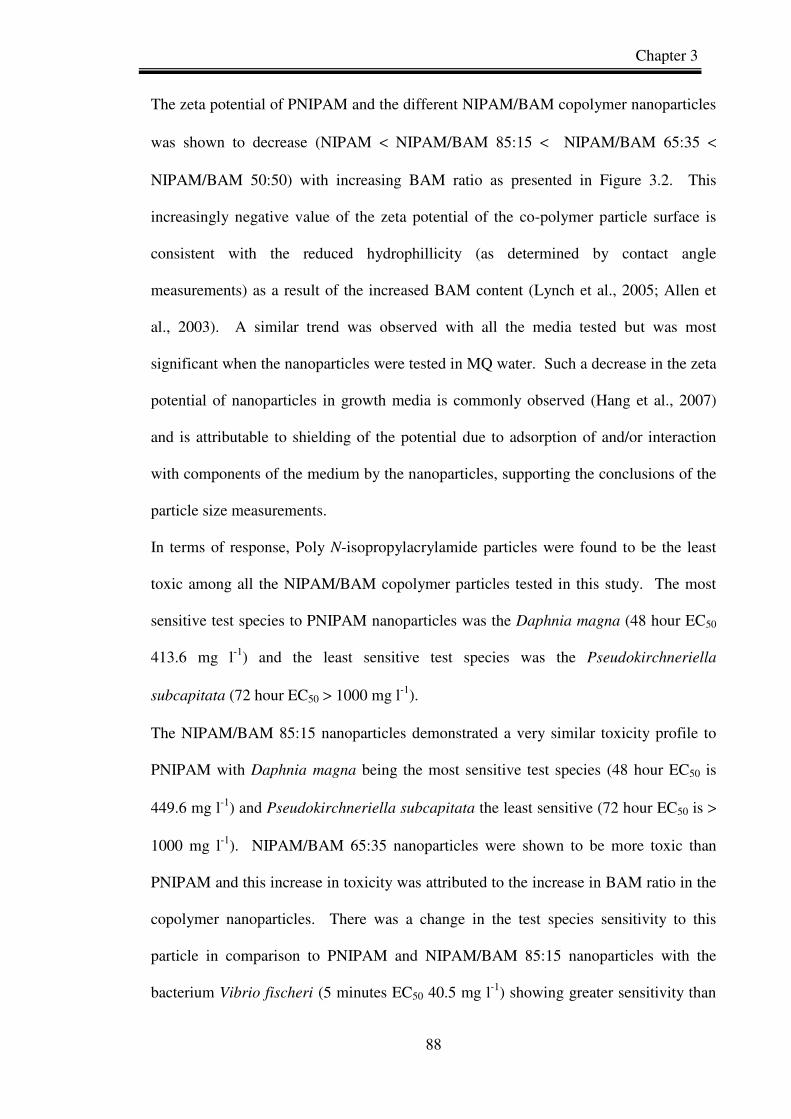
Chapter 3
88
The zeta potential of PNIPAM and the different NIPAM/BAM copolymer nanoparticles
was shown to decrease (NIPAM < NIPAM/BAM 85:15 < NIPAM/BAM 65:35 <
NIPAM/BAM 50:50) with increasing BAM ratio as presented in Figure 3.2. This
increasingly negative value of the zeta potential of the co-polymer particle surface is
consistent with the reduced hydrophillicity (as determined by contact angle
measurements) as a result of the increased BAM content (Lynch et al., 2005; Allen et
al., 2003). A similar trend was observed with all the media tested but was most
significant when the nanoparticles were tested in MQ water. Such a decrease in the zeta
potential of nanoparticles in growth media is commonly observed (Hang et al., 2007)
and is attributable to shielding of the potential due to adsorption of and/or interaction
with components of the medium by the nanoparticles, supporting the conclusions of the
particle size measurements.
In terms of response, Poly N-isopropylacrylamide particles were found to be the least
toxic among all the NIPAM/BAM copolymer particles tested in this study. The most
sensitive test species to PNIPAM nanoparticles was the Daphnia magna (48 hour EC50
413.6 mg l-1) and the least sensitive test species was the Pseudokirchneriella
subcapitata (72 hour EC50 > 1000 mg l-1).
The NIPAM/BAM 85:15 nanoparticles demonstrated a very similar toxicity profile to
PNIPAM with Daphnia magna being the most sensitive test species (48 hour EC50 is
449.6 mg l-1) and Pseudokirchneriella subcapitata the least sensitive (72 hour EC50 is >
1000 mg l-1). NIPAM/BAM 65:35 nanoparticles were shown to be more toxic than
PNIPAM and this increase in toxicity was attributed to the increase in BAM ratio in the
copolymer nanoparticles. There was a change in the test species sensitivity to this
particle in comparison to PNIPAM and NIPAM/BAM 85:15 nanoparticles with the
bacterium Vibrio fischeri (5 minutes EC50 40.5 mg l-1) showing greater sensitivity than

Chapter 3
89
the Daphnia magna bioassay in this case. The least sensitive test species are
Pseudokirchneriella subcapitata (72 hour EC50 727.1 mg l-1).
NIPAM/BAM 50:50 nanoparticles were found to be the most toxic to the test battery
compared to the other three copolymer nanoparticles. The species sensitivity to these
particles was found to be in the same order as that of the NIPAM/BAM 65:35
nanoparticles with Vibrio fischeri (5 minutes EC50 25.7 mg l-1) as the most sensitive and
Pseudokirchneriella subcapitata (72 hour EC50 706.7 mg l-1) as the least sensitive test.
The sensitivity of the test species varied as the physicochemical characteristics of the
PNIPAM and NIPAM/BAM copolymer particles changed. The most sensitive bioassay
for PNIPAM and NIPAM/BAM 85:15 particles were found to be the immobilisation of
Daphnia magna (48 hour EC50) followed by mortality of Thamnocephalus platyurus (24
hour LC50). The most sensitive test for NIPAM/BAM 65:35 and NIPAM/BAM 50:50
particles was the Microtox® assay (Vibrio fischeri, 5 minutes EC50) followed by the
immobilisation of Daphnia magna (48 hour EC50) and mortality of Thamnocephalus
platyurus (24 hour LC50). The least sensitive bioassay was the Pseudokirchneriella
subcapitata (72 hour LC50) for the four test particles. The cytotoxicity of PNIPAM and
NIPAM/BAM 85:15 were studied in RTG-2 cells and from this study it was observed
that there was no significant difference in terms of cell viability between control and
cells exposed to the polymer particles. Neither the PNIPAM nor NIPAM/BAM 85:15
particles were found to be toxic to the fish cells at the concentrations and time points
tested in this study (shown in figure 3.6). Cytotoxicity in RTG-2 was assessed at the
recommended growth temperature of 20oC. NIPAM/BAM 65:35 and NIPAM/BAM
50:50 were demonstrated to form large aggregates at this temperature, due to the low
LCST, which led to both materials floating in the cell culture media. For a cytotoxicity
assessment the particles should be fully dispersed and capable of interaction with the

Chapter 3
90
cells so in this case it was not considered practical to test these particles with the cell
line.
0
100
200
300
400
500
600
700
800
900
1000
100 85_15 65_35 50_50
PNIPAM and NIPAM/BAM copolymer nanoparticles
EC
50 i
n m
g/L
24 H
48 H
Figure 3.7. Relationship between EC50 for immobilisation of Daphnia magna following
exposure to PNIPAM and different NIPAM/BAM copolymer particles.
The toxicity of the polymer nanoparticles gradually increased in the entire test species
(except RTG-2 cells) as a function of increasing BAM ratio. This relationship with
increasing ratio of BAM is shown for the EC50 of the 24 and 48 h acute immobilisation
test with Daphnia magna in Figure 3.7. An increase in the ratio of the monomer BAM
was also shown to cause a concomitant decrease in the LC50 value (i.e. more toxic)
following 24 h exposure of the invertebrate Thamnocephalus platyurus (Figure 3.8).
The monomer ratio has, however, also been shown to be related to the measured zeta
potential and therefore the measured ecotoxicity response may be associated with the
zeta potential as indicated in Figure 3.9.
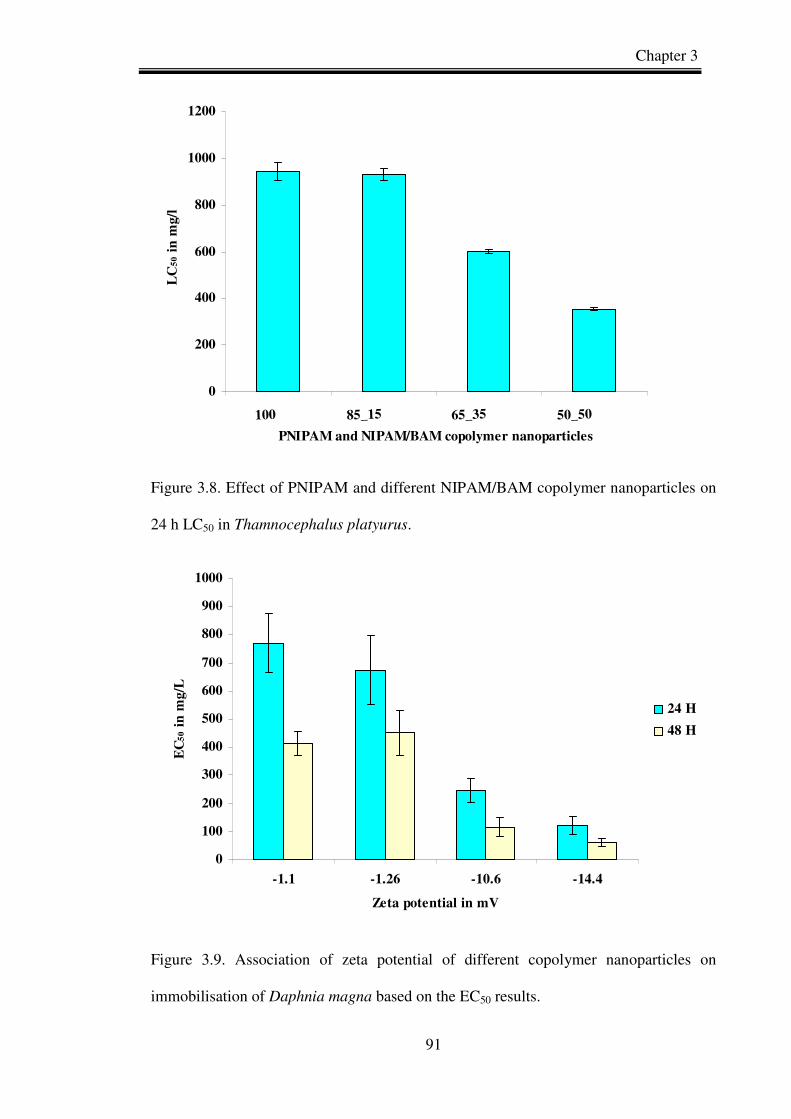
Chapter 3
91
0
200
400
600
800
1000
1200
100 85_15 65_35 50_50
PNIPAM and NIPAM/BAM copolymer nanoparticles
L
C5
0 i
n m
g/l
Figure 3.8. Effect of PNIPAM and different NIPAM/BAM copolymer nanoparticles on
24 h LC50 in Thamnocephalus platyurus.
0
100
200
300
400
500
600
700
800
900
1000
-1.1 -1.26 -10.6 -14.4
Zeta potential in mV
EC
50 i
n m
g/L
24 H
48 H
Figure 3.9. Association of zeta potential of different copolymer nanoparticles on
immobilisation of Daphnia magna based on the EC50 results.
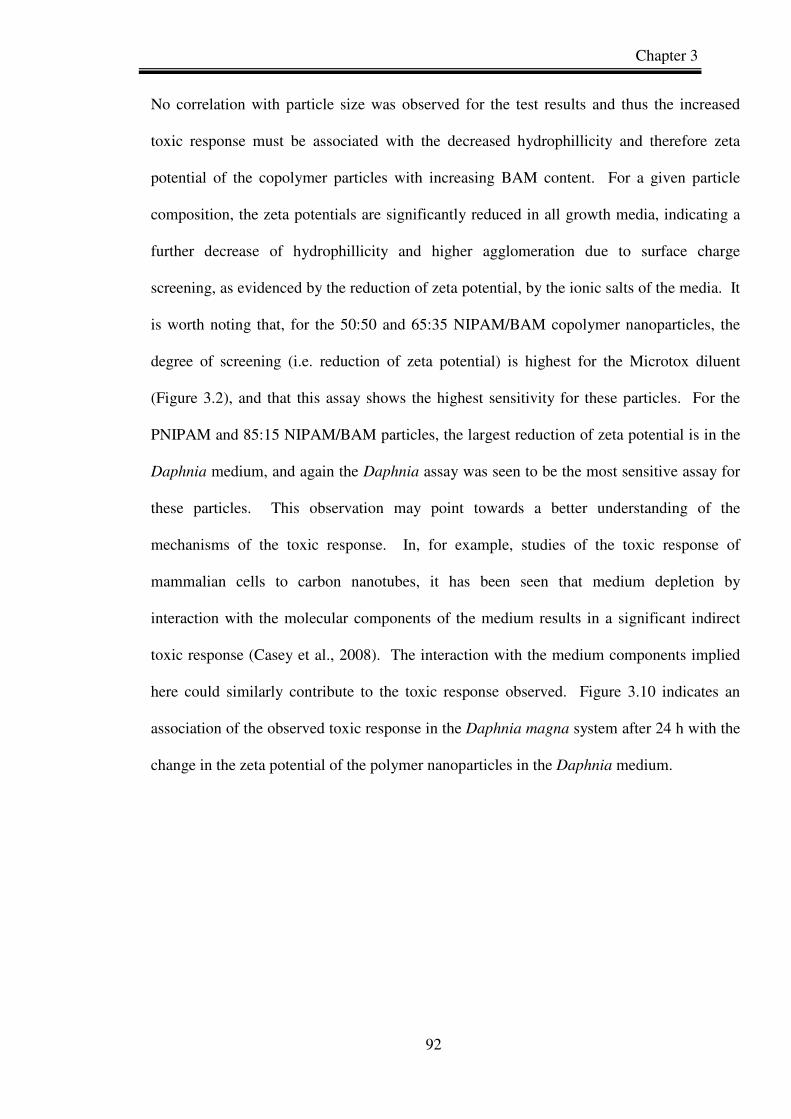
Chapter 3
92
No correlation with particle size was observed for the test results and thus the increased
toxic response must be associated with the decreased hydrophillicity and therefore zeta
potential of the copolymer particles with increasing BAM content. For a given particle
composition, the zeta potentials are significantly reduced in all growth media, indicating a
further decrease of hydrophillicity and higher agglomeration due to surface charge
screening, as evidenced by the reduction of zeta potential, by the ionic salts of the media. It
is worth noting that, for the 50:50 and 65:35 NIPAM/BAM copolymer nanoparticles, the
degree of screening (i.e. reduction of zeta potential) is highest for the Microtox diluent
(Figure 3.2), and that this assay shows the highest sensitivity for these particles. For the
PNIPAM and 85:15 NIPAM/BAM particles, the largest reduction of zeta potential is in the
Daphnia medium, and again the Daphnia assay was seen to be the most sensitive assay for
these particles. This observation may point towards a better understanding of the
mechanisms of the toxic response. In, for example, studies of the toxic response of
mammalian cells to carbon nanotubes, it has been seen that medium depletion by
interaction with the molecular components of the medium results in a significant indirect
toxic response (Casey et al., 2008). The interaction with the medium components implied
here could similarly contribute to the toxic response observed. Figure 3.10 indicates an
association of the observed toxic response in the Daphnia magna system after 24 h with the
change in the zeta potential of the polymer nanoparticles in the Daphnia medium.
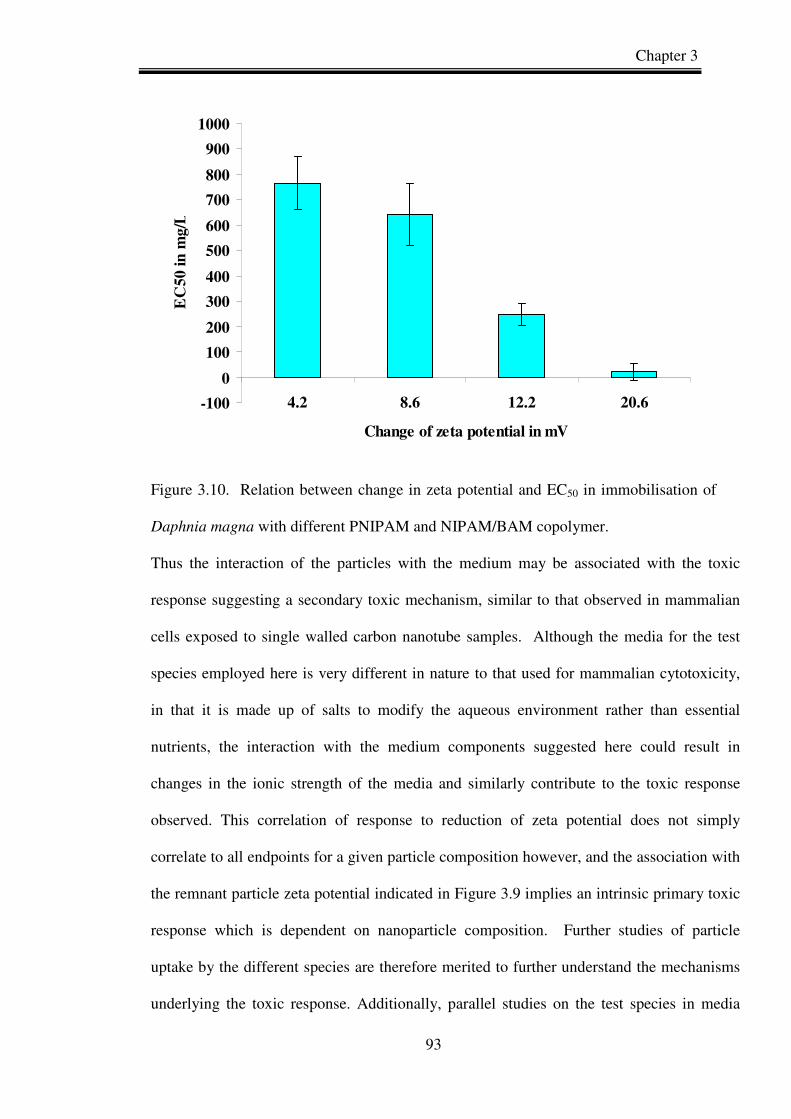
Chapter 3
93
-100
0
100
200
300
400
500
600
700
800
900
1000
4.2 8.6 12.2 20.6
Change of zeta potential in mV
EC
50
in
mg
/L
Figure 3.10. Relation between change in zeta potential and EC50 in immobilisation of
Daphnia magna with different PNIPAM and NIPAM/BAM copolymer.
Thus the interaction of the particles with the medium may be associated with the toxic
response suggesting a secondary toxic mechanism, similar to that observed in mammalian
cells exposed to single walled carbon nanotube samples. Although the media for the test
species employed here is very different in nature to that used for mammalian cytotoxicity,
in that it is made up of salts to modify the aqueous environment rather than essential
nutrients, the interaction with the medium components suggested here could result in
changes in the ionic strength of the media and similarly contribute to the toxic response
observed. This correlation of response to reduction of zeta potential does not simply
correlate to all endpoints for a given particle composition however, and the association with
the remnant particle zeta potential indicated in Figure 3.9 implies an intrinsic primary toxic
response which is dependent on nanoparticle composition. Further studies of particle
uptake by the different species are therefore merited to further understand the mechanisms
underlying the toxic response. Additionally, parallel studies on the test species in media
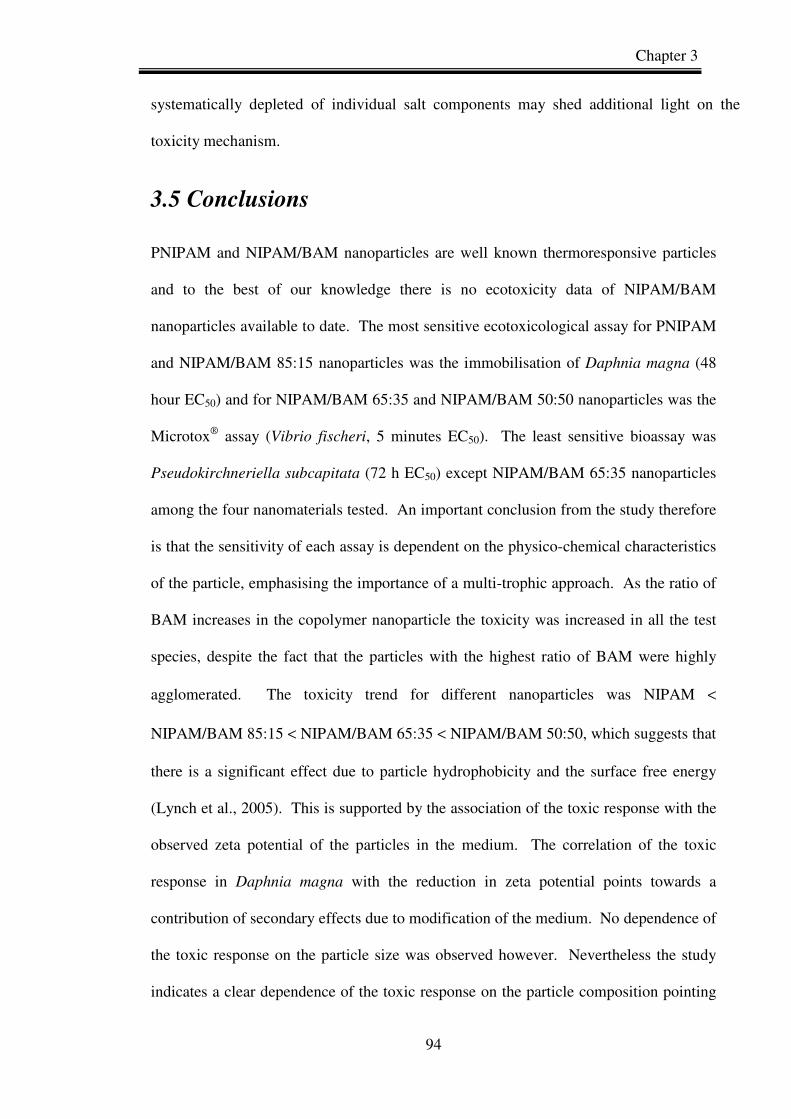
Chapter 3
94
systematically depleted of individual salt components may shed additional light on the
toxicity mechanism.
3.5 Conclusions
PNIPAM and NIPAM/BAM nanoparticles are well known thermoresponsive particles
and to the best of our knowledge there is no ecotoxicity data of NIPAM/BAM
nanoparticles available to date. The most sensitive ecotoxicological assay for PNIPAM
and NIPAM/BAM 85:15 nanoparticles was the immobilisation of Daphnia magna (48
hour EC50) and for NIPAM/BAM 65:35 and NIPAM/BAM 50:50 nanoparticles was the
Microtox® assay (Vibrio fischeri, 5 minutes EC50). The least sensitive bioassay was
Pseudokirchneriella subcapitata (72 h EC50) except NIPAM/BAM 65:35 nanoparticles
among the four nanomaterials tested. An important conclusion from the study therefore
is that the sensitivity of each assay is dependent on the physico-chemical characteristics
of the particle, emphasising the importance of a multi-trophic approach. As the ratio of
BAM increases in the copolymer nanoparticle the toxicity was increased in all the test
species, despite the fact that the particles with the highest ratio of BAM were highly
agglomerated. The toxicity trend for different nanoparticles was NIPAM <
NIPAM/BAM 85:15 < NIPAM/BAM 65:35 < NIPAM/BAM 50:50, which suggests that
there is a significant effect due to particle hydrophobicity and the surface free energy
(Lynch et al., 2005). This is supported by the association of the toxic response with the
observed zeta potential of the particles in the medium. The correlation of the toxic
response in Daphnia magna with the reduction in zeta potential points towards a
contribution of secondary effects due to modification of the medium. No dependence of
the toxic response on the particle size was observed however. Nevertheless the study
indicates a clear dependence of the toxic response on the particle composition pointing
Chapter 3
95
towards structure-activity relationships. The mammalian toxicity of PNIPAM
nanoparticles is discussed in chapter 4. Due to the lower LCST of the NIPAM/BAM
85:15, 65:35 and 50:50 nanoparticles are unstable at 37 oC and thus their mammalian
toxicity was not studied.

Chapter 3
96
References
Allen, L. T., Fox, E.J., Blute, I., Kelly, Z.D., Rochev, Y., Keenan, A.K., Dawson, K.A.,
Gallagher, W.M., 2003. Interactions of soft condensed materials with living cells:
phenotype/transcriptome correlations for the hydrophobic effect. Proc. Natl. Acad.
Sci. USA.100, 6331-6336.
Azur Environmental (1998). Microtox® acute toxicity basic test procedures, Report,
Carlsbad, CA. pp 1-13.
Baun, A., Sorensen, S.N., Rasmussen, R.F., Hartmann, N.B., Koch, C.B., 2008.
Toxicity and bioaccumulation of xenobiotic organic compounds in the presence of
aqueous suspensions of aggregates of nano-C60. Aquat. Toxicol. 86, 379-387.
BS EN ISO 6341 (1996). Water Quality Determination of the Inhibition of the Mobility
of Daphnia magna Strauss (Cladocera, Crustacea) Acute Toxicity Test. British
Standards Institution, London.
Cabaleiro-Lago, C., Quinlan-Pluck, F., Lynch, I., Lindman, S., Minogue, A.M., Thulin,
E., Walsh, D.M., Dawson, K.A., Linse, S. 2008. Inhibition of amyloid β protein
fibrillation by polymeric nanoparticles. JACS, in press.
Casey, A., Herzog, E., Lyng, F.M., Byrne, H.J., Chambers, G., Davoren, M., 2008.
Single walled carbon nanotubes induce indirect cytotoxicity by medium depletion
in A549 lung cells. Toxicol. Lett.179, 78-84.
Cedervall, T., Lynch, I., Foy, M., Berggård, T., Donnelly, S.C., Cagney, G., Linse, S.,
Dawson, K.A., 2007. Detailed identification of plasma proteins adsorbed on
copolymer nanoparticles. Angew. Chem. Int. Ed. Engl. 46, 5754-5756.

Chapter 3
97
Cheng, J., Flahaut, E., Cheng, S.H., 2007. Effect of carbon nanotubes on developing
zebrafish (Danio rerio) embryos. Environmental Toxicology and Chemistry. 26,
708-716.
Federici, G., Shaw, B.J., Handy, R.D., 2007. Toxicity of titanium dioxide nanoparticles
to rainbow trout (Oncorhynchus mykiss): Gill injury, oxidative stress, and other
physiological effects. Aquat. Toxicol. 84, 415-430.
Gagńe, F., Auclair, J., Turcotte, P., Fournier, M., Gagnon, C., Sauve, S., Blaise, C.,
2008. Ecotoxicity of CdTe quanum dots to fresh water mussels: Impacts on
immune system, oxidative stress and genotoxicity. Aquat. Toxicol. 86, 333-340.
Hang, J. Z., Zhang, Y. F., Shi, L. Y., Feng, X., 2007. Electrokinetic properties of
barite nanoparticles suspensions in different electrolyte media. Journal of
Materials Science. 42, 9611-9616.
Heinlaan, M., Ivask, A., Blinova, I., Dubourguier, H.C., Kahru, A., 2008. Toxicity of
nanosized and bulk ZnO, CuO and TiO2 to bacteria Vibrio fischeri and crustaceans
Daphnia magna and Thamnocephalus platyurus. Chemosphere. 71, 1308-1316.
Hsiue, G.H., Chang, R.W., Wang, C.H., Lee, S.H., 2003. Development of in situ
thermosensitive drug vehicles for glaucoma therapy. Biomaterials. 24, 2423-2430.
Hsiue, G.H., Hsu, S.H., Yang, C.C., Lee, S.H., Yang, I.K., 2002. Preparation of control
release ophthalmic drops, for glaucoma therapy using thermosensitive poly-N-
isopropylacrylamide. Biomaterials. 23, 457-462.
Kavanagh, C.A., Gorelova, T.A., Selezneva, I.I., Rochev, Y.A., Dawson, K.A.,
Gallagher, W.M., Gorelov, A.V., Keenan, A.K. 2005. Poly(N-
isopropylacrylamide) copolymer films as vehicles for the sustained delivery of
proteins to vascular endothelial cells. J. Biomed. Mater. Res. A. 72, 25-35.
Chapter 3
98
Lin, D., Xing, B., 2007. Phytotoxicity of nanoparticles: Inhibition of seed germination
and root growth. Environ. Pollut.150, 243-50.
Linse, S., Lago, C.C., Xue, W.F., Lynch, I., Lindman, S., Thulin, E., Radford, S.E.,
Dawson, K.A., 2007. Nucleation of protein fibrillation by nanoparticles. Proc.
Natl. Acad. Sci. USA. 104, 8691-8696.
Lovern, S.B., Klaper, R., 2006. Daphnia magna mortality when exposed to titanium
dioxide and fullerene (C60) nanoparticles. Environmental Toxicology and
Chemistry. 25, 1132-1137.
Lovern, S.B., Strickler J.R., Klaper, R., 2007. Behavioral and physiological changes in
Daphnia magna when exposed to nanoparticle suspensions (titanium dioxide,
nano-C60, and C60HxC70Hx). Environ. Sci. Technol. 41, 4465-7.
Lynch, I., Blute, I.A., Zhmud, B., MacArtain, P., Tosetto, M., Allen, L.T., Byrne, H.J.,
Farrell, G.F., Keenan, A.K., Gallagher, W.M., Dawson, K.A. 2005. Correlation of
the Adhesive Properties of Cells to N-Isopropylacrylamide/N-tert-Butylacrylamide
Copolymer Surfaces with Changes in Surface Structure Using Contact Angle
Measurements, Molecular Simulations, and Raman Spectroscopy. Chem. Mater.
17, 3889 - 3898.
Meng, H., Chen, Z., Xing, G., Yuan, H., Chen, C., Zhao, F., Zhang, C., Zhao, Y.,
2007.Ultrahigh reactivity provokes nanotoxicity: Explanation of oral toxicity of
nano-copper particles. Toxicology Letters, 175, 102-110
Mortimer, M., Kasemets, K., Heinlaan, M., Kurvet, I., Kahru, A., 2008. High
throughput kinetic Vibrio fischeri bioluminescence inhibition assay for study of
toxic effects of nanopartcles. Toxicol. In Vitro, 22, 1412-1417.
Nowack, B., Bucheli, T.D., 2007. Occurence, behavior and effects of nanoparticles in
the enironment. Environmental Pollution. 150, 5-22.

Chapter 3
99
Nyholm, N. 1990. Expression of results from growth inhibition toxicity tests with algae.
Arch. Environ. Contam. Toxicol. 19, 518-522.
Oberdörster, G., Oberdörster, E., Oberdörster, J., 2005. Nanotoxicology: an emerging
discipline evolving from studies of ultra fine particles. Environ. Health Perspect.
113, 823-839.
OECD, 2002. Guideline for testing of chemicals. In: Freshwater Alga and
Cyanobacteria, Growth Inhibition Test, Method 201, OECD.
Papageorgiou, I., Brown, C., Schins, R., Singh, S., Newson, R., Davis, S., Fisher, J.,
Ingham E., Case C.P. 2007. The effect of nano- and micron-sized particles of
cobalt–chromium alloy on human fibroblasts in vitro. Biomaterials 28, 2946-2958.
Poland, C.A., Duffin, R., Kinloch, I., Maynard, A., Wallace, W.A.H., Seaton, A., Stone,
V., Brown, S., MacNee, W., Donaldson, K., 2008. Carbon nanotubes introduced
into the abdominal cavity of mice show asbestos like pathogenicity in a pilot
study. Nat. Nanotechnol. 3, 423-428.
Singh,S., Shi, T., Duffin, R Albrecht, C., van Berlo, D., Höhr, D., Fubini, B., Martra,
G., Fenoglio, I., Borm, P.J.A., Schins, R.P.F. 2007. Endocytosis, oxidative stress
and IL-8 expression in human lung epithelial cells upon treatment with fine and
ultrafine TiO2: Role of the specific surface area and of surface methylation of the
particles. Toxicol Appl Pharmacol. 222, 141-151
Smith, C.J., Shaw, B.J., Handy, R.D., 2007. Toxicity of single walled carbon nanotubes
to rainbow trout, (Oncorhynchus mykiss): respiratory toxicity, organ pathologies,
and other physiological effects. Aquat. Toxicol. 82, 94-109.
Thamnotoxkit, F™., 1995. Crustacean toxicity screening test for freshwater. Standard
Operating Procedure, Creasal, Deinze, Belgium.

Chapter 3
100
Xu, F.J., Kang, E.T., Neoh, K.G., 2006. pH and temperature responsive hydrogel from
crosslinked triblock copolymers prepared via consecutive atom transfer radical
polymerization. Biomaterials. 27, 2787-2797.
Xu, F.Z., Zhong, S.P., Yung, L.Y.L., Kang, E.T., Neoh, K.G., 2004. Surface-active and
stimuli-response polymer-Si(100) hybrid from surface-initiated atom transfer
radical polymerization for control of cell adhesion. Biomacromolecules. 5, 2392-
2403.
Zhang, X.Z., Yang, Y.Y., Chung, T.S., Ma, K.X., 2001. Preparation and
Characterization of Fast Response Macroporous Poly(N-isopropylacrylamide)
Hydrogels. Langmuir. 17, 6094-6099.
Zhang, X.Z., Lewis, P.J., Chu, C.C., 2005. Fabrication and characterization of a smart
drug delivery system: microsphere in hydrogel. Biomaterials. 26, 3299-3309.
Zhu, Y., Zhao, Q., Li, Y., Cai, X., Li,W., 2006. The interaction and toxicity of multi-
walled carbon nanotubes with Stylonychia mytilus. J. Nanosci. Nanotechnol. 6,
1357-1364.
Chapter 4
101
Chapter 4
In vitro mammalian toxicology of PNIPAM
nanoparticles
Adapted from “Intracellular localisation, Geno- and Cytotoxic response of Poly N-
isopropylacrylamide (PNIPAM) nanoparticles to human keratinocyte (HaCaT)
and colon cells (SW 480)” Toxicology Letters, 2010. 198, 134-143.
Authors: Pratap C. Naha, Kunal Bhattacharya, Tiziana Tenuta, Kenneth A.
Dawson, Iseult Lynch, Amaya Gracia, Fiona M. Lyng, Hugh J. Byrne
Chapter 4
102
4.1 Introduction
Poly N-isopropylacrylamide (PNIPAM) is a well known thermoresponsive polymer
(Hsiue et al. 2002) which exhibits a lower critical solution temperature (LCST) of about
32oC in aqueous media (Xu et al., 2006). Adjustment of the LCST to near body
temperature (Zhang and Misra 2007) is essential, particularly for ‘smart’ drug delivery
applications (Peppas et al. 2000; Lin and Metters 2006). Because of this reversible
phase transition, PNIPAM has been widely used as stimuli responsive polymer for
biomedical applications, such as in the controlled release of drugs and in tissue
engineering (Kavanagh et al. 2005; Xu et al., 2006; Xu et al. 2004; Zhang et al., 2005).
Given their potential widespread use, there is an increasing need for information
regarding the human health and environmental implications of these polymeric
nanomaterials. To date the human health impacts of nanomaterials have received the
greatest attention, and it has been demonstrated through both in vivo and in vitro studies
with mammalian test systems that the properties that make nanomaterials so attractive
from a commercial application viewpoint (e.g. nanoparticle size and increased surface
area) can also potentially be responsible for undesirable health effects (Meng et al.
2007; Oberdorster et al., 2005; Papageorgiou et al. 2007; Poland et al. 2008; Singh et
al. 2007). However, to date, no conclusive links between engineered nanoparticles and
a biological or health impact have been observed, and insufficient data exists to make
generalisations about the biocompatibility or safety of nanomaterials in general, or even
about a specific nanoparticle type.
The aim of the present investigation, therefore, is the measurement, characterisation and
assessment of the mammalian cytotoxicity and genotoxicity of PNIPAM nanoparticles
in immortalised non-cancerous human keratinocyte (HaCaT) and a primary
adenocarcinoma of human colon (SW480) cell line, as dermal and intestinal models

Chapter 4
103
respectively, these being considered two of the potential routes of exposure to
nanomaterials. Physico-chemical characterisation of PNIPAM nanoparticles was
performed in terms of measurement of hydrodynamic diameter and zeta potential in the
appropriate cell culture media. As the particles are thermoresponsive in nature, the
particle size was measured as a function of temperature, because all exposures were
performed at 37 oC. Cellular uptake and co-localisation studies were carried out with
fluorescently-labelled PNIPAM nanoparticles, synthesised in the presence of a
fluorescent co-monomer, using Confocal Laser Scanning Microscopy (CLSM).
4.2 Experimental methods
All experimental methods and protocols are described in chapter 2. Specifically, particle
size measurement, zeta potential and BET surface area measurement are described in
chapter 2, section 2.2.1.1, 2.2.1.2 and 2.2.1.4 respectively. Intracellular uptake and co-
localisation of PNIPAM nanoparticles protocols are described in section 2.2.2.7 and
2.2.2.8. Cytotoxicity assay and genotoxicity protocols are described in section 2.2.2 and
2.2.2.12.
4.3 Results
4.3.1 Characterisation of PNIPAM nanoparticles
The hydrodynamic diameter of PNIPAM nanoparticles was measured as a function of
increasing temperature due to its thermoresponsive nature. When the temperature is
raised above the LCST, the polymer undergoes a phase transition and the random coil
structure (hydrophilic state) collapses to form a globular structure (hydrophobic state)
(Xu et al., 2006). This behaviour of decreasing particle size with increasing temperature
is demonstrated well by the temperature dependence of the nanoparticles when prepared

Chapter 4
104
in MQ water (Table 4.1). In our experiments, the measured particle size of PNIPAM
nanoparticles was found to increase with increasing temperature when they were
prepared in cell culture media (Table 4.1), although in MQ water the particle size
decreases with increasing temperature. Transmission Electron Microscopy confirmed
the as produced particles to have a dry size of 40 ± 10 nm, as shown in the
representative TEM image of Figure 4.1.
The BET surface area of the unlabelled PNIPAM nanoparticles was found previously to
be 5.77 ± 0.07 m²/g (Section 3.2.1.3 of Chapter 3 and Naha et al., 2009b). Zeta
potentials of the PNIPAM nanoparticles were measured in MQ water, DMEM and
supplemented cell culture media (Table 4.2). Zeta potential is a measure of the
electrophoretic mobility of the nanoparticles in the medium. In the absence of change of
the agglomeration state of the nanoparticles, or the content of the medium, no change in
mobility is expected as a function of concentration.
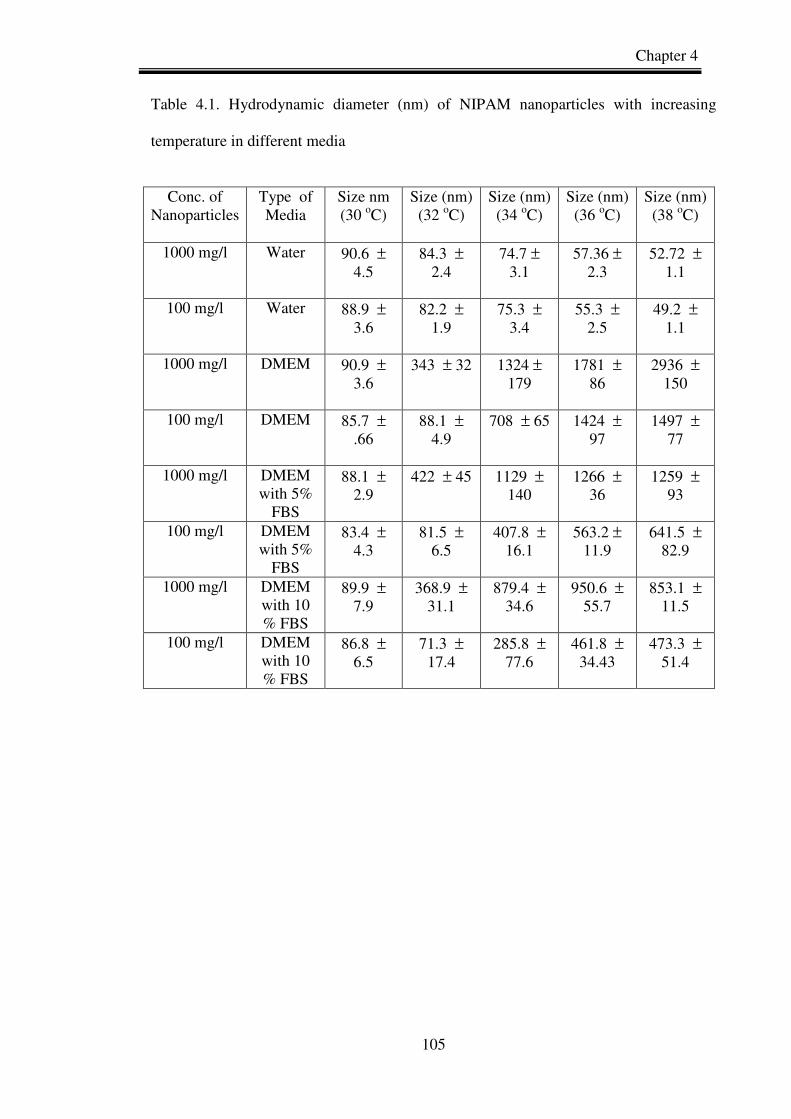
Chapter 4
105
Table 4.1. Hydrodynamic diameter (nm) of NIPAM nanoparticles with increasing
temperature in different media
Conc. of
Nanoparticles
Type of Media
Size nm (30 oC)
Size (nm) (32 oC)
Size (nm) (34 oC)
Size (nm) (36 oC)
Size (nm) (38 oC)
1000 mg/l
Water
90.6 ± 4.5
84.3 ± 2.4
74.7 ± 3.1
57.36 ± 2.3
52.72 ± 1.1
100 mg/l Water
88.9 ± 3.6
82.2 ± 1.9
75.3 ± 3.4
55.3 ± 2.5
49.2 ± 1.1
1000 mg/l DMEM
90.9 ± 3.6
343 ± 32 1324 ± 179
1781 ± 86
2936 ± 150
100 mg/l DMEM
85.7 ± .66
88.1 ± 4.9
708 ± 65 1424 ± 97
1497 ± 77
1000 mg/l DMEM with 5%
FBS
88.1 ± 2.9
422 ± 45 1129 ± 140
1266 ± 36
1259 ± 93
100 mg/l DMEM with 5%
FBS
83.4 ± 4.3
81.5 ± 6.5
407.8 ± 16.1
563.2 ± 11.9
641.5 ± 82.9
1000 mg/l DMEM with 10 % FBS
89.9 ± 7.9
368.9 ± 31.1
879.4 ± 34.6
950.6 ± 55.7
853.1 ± 11.5
100 mg/l DMEM with 10 % FBS
86.8 ± 6.5
71.3 ± 17.4
285.8 ± 77.6
461.8 ± 34.43
473.3 ± 51.4
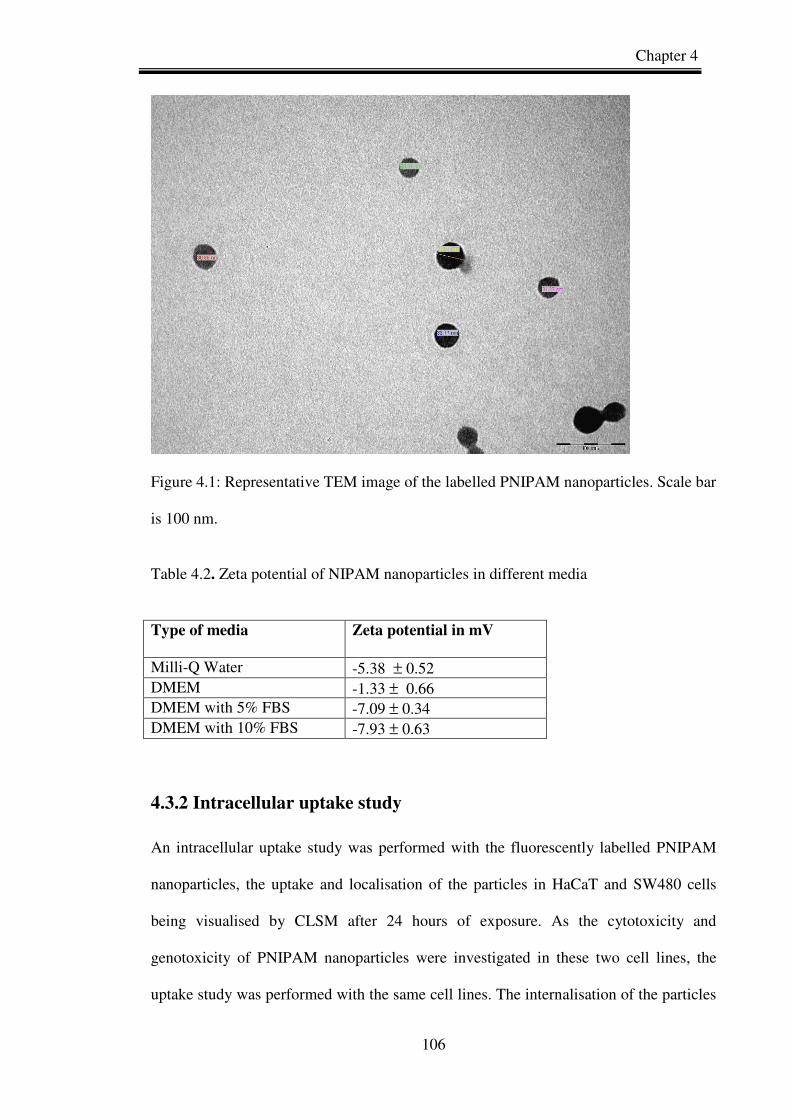
Chapter 4
106
Figure 4.1: Representative TEM image of the labelled PNIPAM nanoparticles. Scale bar
is 100 nm.
Table 4.2. Zeta potential of NIPAM nanoparticles in different media
Type of media
Zeta potential in mV
Milli-Q Water -5.38 ± 0.52 DMEM -1.33 ± 0.66 DMEM with 5% FBS -7.09 ± 0.34 DMEM with 10% FBS -7.93 ± 0.63
4.3.2 Intracellular uptake study
An intracellular uptake study was performed with the fluorescently labelled PNIPAM
nanoparticles, the uptake and localisation of the particles in HaCaT and SW480 cells
being visualised by CLSM after 24 hours of exposure. As the cytotoxicity and
genotoxicity of PNIPAM nanoparticles were investigated in these two cell lines, the
uptake study was performed with the same cell lines. The internalisation of the particles
Chapter 4
107
is illustrated in Figure 4.2 and optical sections (z-sections) of the HaCaT and SW 480
cells are shown in Figure 4.3. Each optical section represents a particular plane of focus
and it is clear that the nanoparticles have been internalised completely, rather than being
accumulated in or at the cell membrane. Washing of the cells prior to observation in the
confocal microscope also ensured that non-internalised particles were removed. Each
optical section represents a particular plane of focus and it is clear that the nanoparticles
have been internalised completely, rather than being accumulated in or at the cell
membrane. For HaCaT cells 18 z section and for SW 480 cells 21 z sections were taken.
Each section is separated by 0.41 and 1µm for HaCaT and SW 480 cell respectively.
The results demonstrate that the PNIPAM nanoparticles were taken up and distributed
throughout the cell within 24 hrs of exposure.
A common mechanism which has been identified for the cellular uptake of
nanoparticles is by endocytosis, after which the particle are trafficked through
endosomes and later lysosomes (Nel et al., 2009; Salvati, et al., 2011; Shapero et al.,
2011). In order to confirm that the PNIPAM nanoparticles are indeed taken up by the
cells, and to explore their intracellular localisation, Lysotracker was used. Lysotracker
has previously been used for tracking of the nanoparticles in the lysosomes in confocal
microscopy (Contreras et al., 2010; Shi et al., 2010; Neun and Stern. 2011).
Figure 4.4 (1D and 2D) shows an overlay of the lysotracker and PNIPAM nanoparticle
fluorescence in HaCaT cells for exposure doses of 30 and 50 mg/l respectively, after
24hrs. Although the lateral resolution does not allow a precise visualization, the
observations are consistent with a localization of the nanoparticles predominantly in
lysosomal compartments, although some nanoparticle fluorescence is distributed
elsewhere in the cytoplasm. Unfortunately a quantitative assessment of the degree of
colocalisation was not possible, as the protocol and data sheet of lysotracker dye
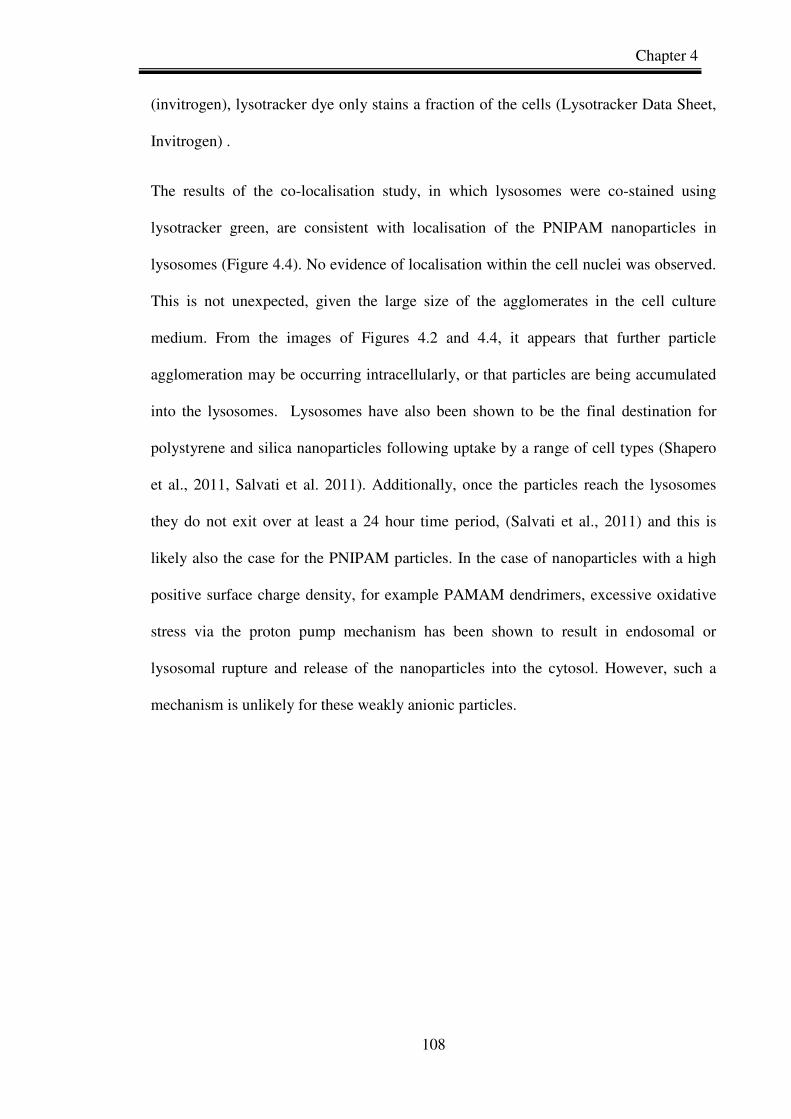
Chapter 4
108
(invitrogen), lysotracker dye only stains a fraction of the cells (Lysotracker Data Sheet,
Invitrogen) .
The results of the co-localisation study, in which lysosomes were co-stained using
lysotracker green, are consistent with localisation of the PNIPAM nanoparticles in
lysosomes (Figure 4.4). No evidence of localisation within the cell nuclei was observed.
This is not unexpected, given the large size of the agglomerates in the cell culture
medium. From the images of Figures 4.2 and 4.4, it appears that further particle
agglomeration may be occurring intracellularly, or that particles are being accumulated
into the lysosomes. Lysosomes have also been shown to be the final destination for
polystyrene and silica nanoparticles following uptake by a range of cell types (Shapero
et al., 2011, Salvati et al. 2011). Additionally, once the particles reach the lysosomes
they do not exit over at least a 24 hour time period, (Salvati et al., 2011) and this is
likely also the case for the PNIPAM particles. In the case of nanoparticles with a high
positive surface charge density, for example PAMAM dendrimers, excessive oxidative
stress via the proton pump mechanism has been shown to result in endosomal or
lysosomal rupture and release of the nanoparticles into the cytosol. However, such a
mechanism is unlikely for these weakly anionic particles.
Chapter 4
109
Figure 4.2. Confocal laser scanning micrograph (CLSM) of internalisation of
fluorescent labelled PNIPAM nanoparticles in HaCaT and SW 480 cells after 24h of
exposure (using a 63x oil immersion objective). Panel 1 represents the uptake study in
the HaCaT cells and panel 2 represents the uptake study in SW 480 cells. In each figure
Panel A represents the untreated control and Panels B, C and D, represent the
nanoparticle exposure concentrations of 30, 50 and 100 mg/l respectively. Scale bar is
10µm.

Chapter 4
110
Figure 4.3. CLSM optical sections (z-sections) of the HaCaT and SW 480 cells
showing the localisation of the nanoparticles at different sections (using a 63x oil
immersion objective). Each optical section represents a particular plane of focus and
nanoparticles have a different plane of focus indicating that they are internalised
completely. Panel 1 represents the HaCaT cells (optical section thickness is 0.41 µm).
Panel 2 represents the SW 480 cells (optical section thickness is 1.0 µm) with exposure
concentration 50mg/l. Scale bar is 10µm.

Chapter 4
111
Figure 4.4. CLSM images of co-localisation of NIPAM nanoparticles with lysosomes,
by co-staining the HaCaT cells with lysotracker green (using a 63x oil immersion
objective). (1) and (2) are the 24 hour exposure to labelled PNIPAM nanoparticles at
concentrations of 30 and 50 mg/l respectively. In each figure Panel A represents the
brightfield image; Panel B shows the green fluorescence channel showing the
localisation of the lysotracker dye and indicating the lysosomes; Panel C is the red
fluorescence channel and shows the localisation of the PNIPAM nanoparticles; and
Panel D is the overlay of Panels B and C (the green and red channels) and shows the co-
localisation of the nanoparticles with the lysosomes. Scale bar is 10µm.

Chapter 4
112
4.3.3 Cytotoxicity assessment of PNIPAM nanoparticles
The cytotoxicity of the unlabelled PNIPAM nanoparticles was studied in the HaCaT
and SW480 cell lines. As administration routes of nanoparticle based drug delivery
agents are likely to be transdermal or by ingestion, human dermal and gastrointenstinal
models were employed for this study. HaCaT is an immortalised non-cancerous human
keratinocyte cells and SW 480 is a primary adenocarcinoma of human colon cells.
These two cell lines are isolated from different organs of the human, and also have
different morphology, metabolism and also antioxidant levels (Mukherjee et al., 2010).
The assay was carried out by analysing the uptake of Alamar blue (AB), a water-soluble
dye that has been previously used for quantifying in vitro viability of various cells
(Fields and Lancaster, 1993; Ahmed et al., 1994). When added to cell cultures, the
oxidized form of the AB enters the cytosol and is converted to the reduced form by
mitochondrial enzyme activity, accepting electrons from NADPH, FADH, FMNH, and
NADH as well as from the cytochromes. This redox reaction is accompanied by a shift
in colour from indigo blue to fluorescent pink, which can be easily measured by
colorimetric or fluorometric analysis (Al-Nasiry et al., 2007). The percentage of cell
viability was determined by comparison with cells which were not exposed to
nanoparticles i.e. the control group. The results are presented in figures 4.5 and 4.6 for
HaCaT and SW 480 cell respectively. For the cytotoxicity assay, nanoparticles
concentration from 25 to 1000 mg/l were tested in both cell lines at four different
exposures times (24 h, 48 h, 72 h and 96 h). No significant cytotoxicity response has
been observed in HaCaT and SW 480 cells (figure 4.5 and 4.6), even at the highest
exposure doses and longest exposure times.

Chapter 4
113
0
20
40
60
80
100
120
25 50 100 200 400 600 800 1000
Concentration of PNIPAM NPs in mg/l
% C
ell
via
bil
ity
co
mp
are
d t
o c
on
tro
l
24h
48h
72h
96h
Figure 4.5. Cytotoxicological response of HaCaT cells after 24, 48, 72 and 96 h of
exposure to increasing concentrations of PNIPAM nanoparticles.
0
20
40
60
80
100
120
25 50 100 200 400 600 800 1000
Concentration of PNIPAM NPs in mg/l
% C
ell
via
bil
ity
co
mp
are
d t
o c
on
tro
l
24 H
48H
72H
96H
Figure 4.6. Cytotoxicological response of SW480 cells after 24, 48, 72 and 96 h of
exposure to increasing concentrations of PNIPAM nanoparticles.
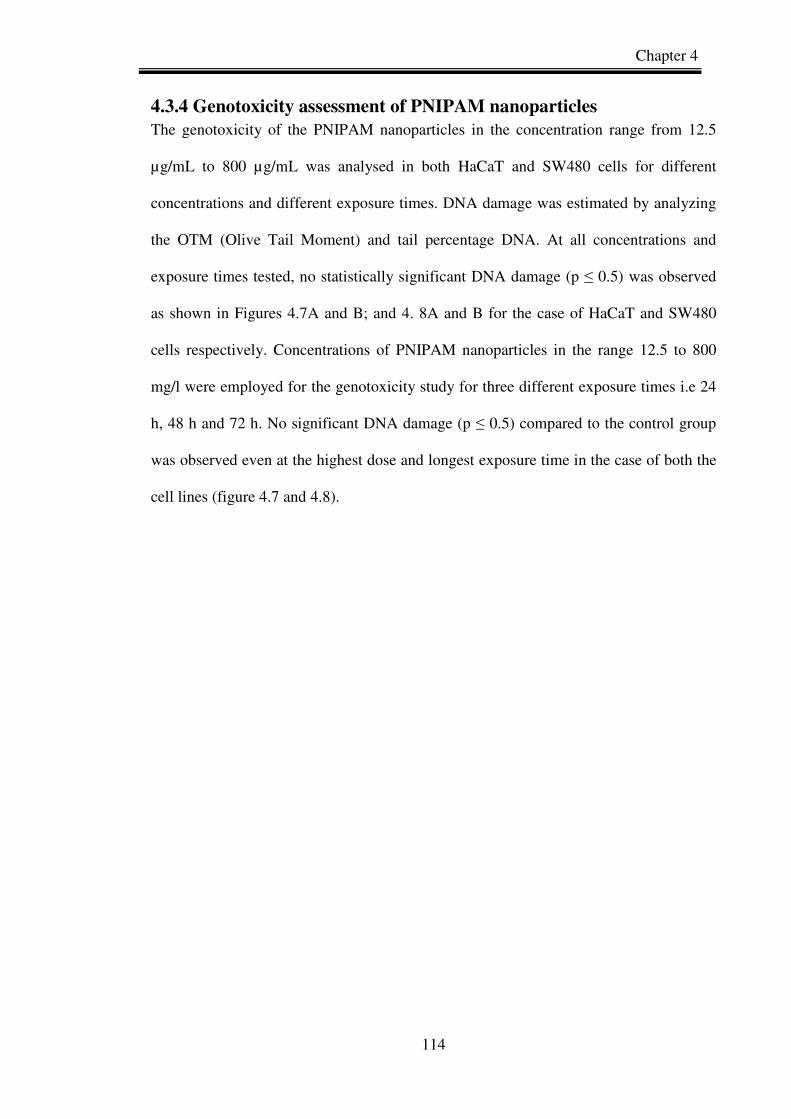
Chapter 4
114
4.3.4 Genotoxicity assessment of PNIPAM nanoparticles The genotoxicity of the PNIPAM nanoparticles in the concentration range from 12.5
µg/mL to 800 µg/mL was analysed in both HaCaT and SW480 cells for different
concentrations and different exposure times. DNA damage was estimated by analyzing
the OTM (Olive Tail Moment) and tail percentage DNA. At all concentrations and
exposure times tested, no statistically significant DNA damage (p ≤ 0.5) was observed
as shown in Figures 4.7A and B; and 4. 8A and B for the case of HaCaT and SW480
cells respectively. Concentrations of PNIPAM nanoparticles in the range 12.5 to 800
mg/l were employed for the genotoxicity study for three different exposure times i.e 24
h, 48 h and 72 h. No significant DNA damage (p ≤ 0.5) compared to the control group
was observed even at the highest dose and longest exposure time in the case of both the
cell lines (figure 4.7 and 4.8).

Chapter 4
115
A.
0
2
4
6
8
10
12
14
16
18
20
24h 48h 72h
Times in hours
% T
ail D
NA
Control
12.5mg/l
25mg/l
100mg/l
200mg/l
400mg/l
800mg/l
B.
0
0.1
0.2
0.3
0.4
0.5
0.6
0.7
0.8
0.9
24h 48h 72h
Time in hours
Oli
ve
Ta
il M
om
ent Control
12.5mg/l
25mg/l
100mg/l
200mg/l
400mg/l
800mg/l
Figure 4. 7. Genotoxicity response of PNIPAM nanoparticles to HaCaT cells. Panel A
represents the % tail DNA and Panel B represents the olive tail moment after exposure
of the particles at three different time points. Data shown mean ± SD (n=3).
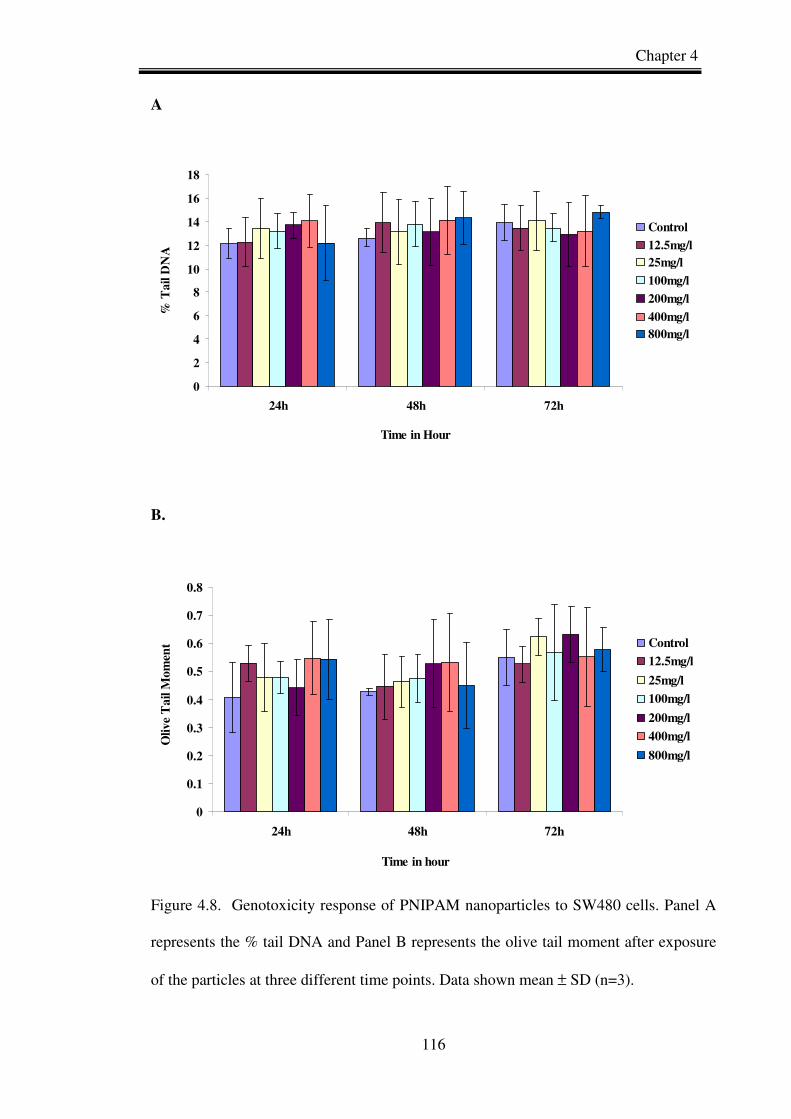
Chapter 4
116
A
0
2
4
6
8
10
12
14
16
18
24h 48h 72h
Time in Hour
% T
ail D
NA
Control
12.5mg/l
25mg/l
100mg/l
200mg/l
400mg/l
800mg/l
B.
0
0.1
0.2
0.3
0.4
0.5
0.6
0.7
0.8
24h 48h 72h
Time in hour
Oliv
e T
ail M
omen
t Control
12.5mg/l
25mg/l
100mg/l
200mg/l
400mg/l
800mg/l
Figure 4.8. Genotoxicity response of PNIPAM nanoparticles to SW480 cells. Panel A
represents the % tail DNA and Panel B represents the olive tail moment after exposure
of the particles at three different time points. Data shown mean ± SD (n=3).
Chapter 4
117
4.4 Discussion
4.4.1 Characterisation of PNIPAM nanoparticles
Due to the thermoresponsive nature of the PNIPAM nanoparticles, the hydrodynamic
diameter in the cell culture media was measured at increasing trend of temperature. This
dramatic increase of particle size is characteristic of agglomeration (Naha et al., 2009b)
and at the exposure temperature of 36oC - 38 oC, the particles in the supplemented
media had sizes ~0.5- 1µm. Similar results were obtained using the fluorescently-
labelled particles, where the presence of the covalently-linked rhodamine B did not
affect the particle size, transition temperature or agglomeration behaviour significantly,
confirming that labelled particles are representative of unlabelled ones, so that direct
comparisons of their behaviour can be made. Thus, for the rhodamine-labelled NIPAM
particles, the particle hydrodynamic diameter was confirmed by DLS as 76nm at 25°C
with a polydispersity index (PDI) around 0.239.
An increasingly negative zeta potential value was observed when the nanoparticles were
suspended in the protein supplemented cell culture media, although it must be noted that
the values are always very low, which explains the agglomeration behaviour observed,
as zeta potential values of at least ±30 mV are considered necessary for charge
stabilisation to be prominent. This increase may therefore be due to the interaction /
adsorption of proteins on to the surface of the nanoparticles yielding a protein corona
(Lynch et al., 2007). Such an increase in zeta potential towards negative values is
attributable to shielding of the surface charge due to adsorption of and/or interaction
with components of the medium by the nanoparticles, supporting the conclusions of the
particle size measurements.
Chapter 4
118
4.4.2 Intracellular uptake study
The results of the co-localisation study, in which lysosomes were co-stained using
lysotracker green, provides evidence of PNIPAM nanoparticles localised in lysosomes
(Figure 4.4). No evidence of localisation within the cell nuclei was observed. This is not
unexpected, given the large size of the agglomerates in the cell culture medium. From
the images of Figures 4.2 and 4.4, it appears that further particle agglomeration may be
occurring intracellularly, or that particles are being accumulated into the lysosomes.
Lysosomes have also been shown to be the final destination for polystyrene and silica
nanoparticles following uptake by a range of cell types (Shapero et al., 2010)
Additionally, once the particles reach the lysosomes they do not exit over at least a 24
hour time period, (Salvati et al., 2011) and this is likely also the case for the PNIPAM
particles.
4.4.3 Cytotoxicity
Although the PNIPAM nanoparticles are clearly internalised in the mammalian cells
and predominantly localised in the lysosomes, no statistically significant cytotoxicity
was observed over a broad concentration range from 12.5 to 1000 µg/ml in either cell
line (Figure 4.5 and 4.6).
In the previous chapter (Chapter 3) which reported on the ecotoxicological analysis of
PNIPAM nanoparticles, they were found to be similarly non-cytotoxic to fish cells,
although a systematic increase in the ecotoxicity response was observed with increasing
concentration of a more hydrophobic co-monomer, N-tert-butylacrylamide, BAM, in
the NIPAM/BAM co-polymer nanoparticles (Naha et al., 2009b). Some nanomaterials
such as single wall carbon nanotubes have been shown to produce toxic responses
through medium depletion even without being internalised into the cells (Davoren et al.,
Chapter 4
119
2007). More commonly, engineered nanoparticles of size ranges ≤100 nm such as
titanium dioxide and silicon dioxide (crystalline), produce toxic effects by entering into
cells causing stress, inflammation, genotoxicity and finally cell death (Nel et al., 2006;
Donaldson et al., 2006; Oberdörster et al., 2005). In this study, however, although
PNIPAM nanoparticles (~50 to 60 nm at 37 oC) are clearly internalised and localised
specifically in lysosomes, no cytotoxicological response is observed for up to 96 hours
of exposure. Similarly, Polylactic-co-glycolic acid (50:50) and Eudragit RS100
nanoparticles of size 200nm have recently been shown to elicit no cytotoxicological
response in SW480 cells, although internalised, suggesting their potential as nano-
carriers of drugs for delivery systems.
4.4.4 Genotoxicity
The Comet assay is widely accepted as a simple, sensitive, and rapid tool for assessing
DNA damage in different test models and is extensively used for chemical testing
(Dhawan et al., 2009). The assessment of nanoparticles for genotoxicity is required as
although no cytotoxicological response is observed up to 1000 µg/ml, the absence of
DNA damage is essential for biocompatibility. Although titanium dioxide nanoparticles
show no cytotoxic response in V79 cells (Chinese hamster lung fibroblasts), significant
genotoxicity has been observed. The micronucleus assay indicated both chromosome
breakage as well as aneuploidy (Bhattacharya et al., 2008) and further indications of
genotoxicity via induction of sister chromatid exchange and micronucleus formation in
human white blood cells have been reported (Turkez et al., 2007). However, in the
current study, no significant genotoxic response (p≤ 0.05) is observed, indicating
excellent biocompatibility of PNIPAM particles with mammalian cells over 72 hours of
exposure to concentrations up to 800 µg/ml in an in vitro study. In a recent study of the
genotoxicity of 34 nm amorphous silica nanoparticles, no genotoxic effects were
Chapter 4
120
observed via the Comet assay at concentrations up to 400 µg/mL (Barnes et al., 2008).
The fact that the uptake and co-localisation studies suggested that the particles are
localised in lysosomes and did not reach the nucleus would also suggest that DNA
damage should be limited. However, direct contact between nanoparticles and DNA is
not necessary in order to induce DNA damage, which can also result from inflammatory
responses to nanoparticles, or oxidative stress (Singh et al., 2009). Amongst the
polymeric nanoparticles used and proposed for various applications such as drug
delivery etc., only a few have been analysed for genotoxicity (He et al., 2009). The
chemical composition of nanomaterials has been shown to influence the mechanism of
uptake, transport and toxic responses. For example the cationic –NH2 surface coated
PAMAM dendrimers have been shown to localise in mitochondria (Lee et al., 2009),
eliciting a toxic response via production of reactive oxygen species, inflammation and
apoptosis in mouse macrophage cells (Naha et al., 2010a). Neutral pegylated quantum
dots have, however, been observed to be localised in lysosomes of HaCaT cells (Meade
et al, 2009). The studies presented here indicate cellular uptake and localisation of
PNIPAM particles in lysosomes. However, no adverse geno or cytotoxicological
responses are observed up to the highest doses in either HaCaT or SW480 cell-lines,
indicating excellent biocompatibility. It is of course noted that, although as synthesised
and dispersed in MQ water the PNIPAM particles are of a size classified as nano, in the
cell culture medium, agglomeration and interaction with the medium components
results in an effective average size of the order 0.5-1µm being presented to cells.
Nevertheless, in terms of adverse toxicological effects, it can be stated that the as
produced nanoparticles show negligible effects.
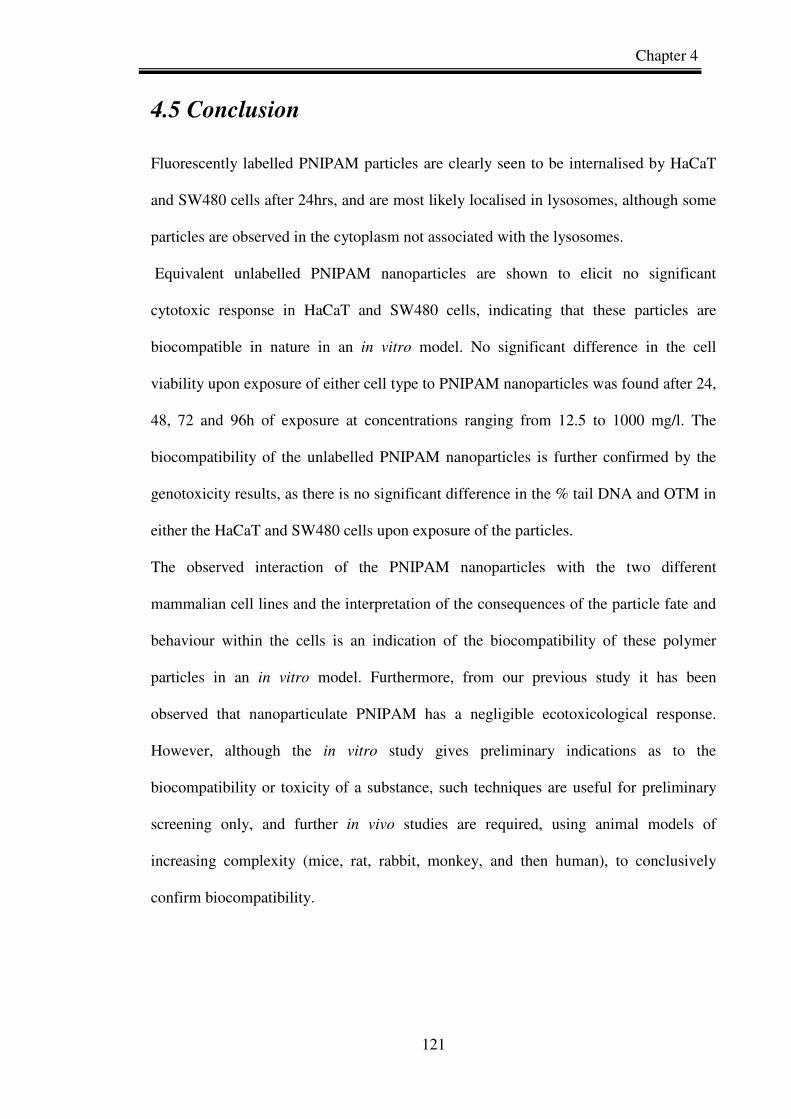
Chapter 4
121
4.5 Conclusion
Fluorescently labelled PNIPAM particles are clearly seen to be internalised by HaCaT
and SW480 cells after 24hrs, and are most likely localised in lysosomes, although some
particles are observed in the cytoplasm not associated with the lysosomes.
Equivalent unlabelled PNIPAM nanoparticles are shown to elicit no significant
cytotoxic response in HaCaT and SW480 cells, indicating that these particles are
biocompatible in nature in an in vitro model. No significant difference in the cell
viability upon exposure of either cell type to PNIPAM nanoparticles was found after 24,
48, 72 and 96h of exposure at concentrations ranging from 12.5 to 1000 mg/l. The
biocompatibility of the unlabelled PNIPAM nanoparticles is further confirmed by the
genotoxicity results, as there is no significant difference in the % tail DNA and OTM in
either the HaCaT and SW480 cells upon exposure of the particles.
The observed interaction of the PNIPAM nanoparticles with the two different
mammalian cell lines and the interpretation of the consequences of the particle fate and
behaviour within the cells is an indication of the biocompatibility of these polymer
particles in an in vitro model. Furthermore, from our previous study it has been
observed that nanoparticulate PNIPAM has a negligible ecotoxicological response.
However, although the in vitro study gives preliminary indications as to the
biocompatibility or toxicity of a substance, such techniques are useful for preliminary
screening only, and further in vivo studies are required, using animal models of
increasing complexity (mice, rat, rabbit, monkey, and then human), to conclusively
confirm biocompatibility.
Chapter 4
122
References
Ahmed, S. A., Gogal, R. M., and Walsh, J. E. 1994. A new rapid and simple non
radioactive assay to monitor and determine the proliferation of lymphocyte: an
alternative to [3H] thimidine incorporation assay J. Immunol Method, 170, 211-
224.
Al-Nasiry, S., Geusens, N., Hanssens, M., Luyte, C., and Pijnenborg, R. 2007. The
use of alamar blue assay for quantitative analysis of viability, migration and
invasion of choriocarcinoma cells Human Production, 22, 1304-1309.
Barnes, C.A., Elsaesser, A., Arkusz, J., Smok, A., Palus, J., Lesniak, A., Salvati, A.,
Hanrahan, J.P., de Jong, W.H., Dziubałtowska, E., Stępnik, M., Rydzyński, K.,
McKerr, G., Lynch, I., Dawson, K.A., Howard, C.V. 2008. Reproducible Comet
Assay of amorphous silica nanoparticles detects no genotoxicity. Nano Letters,
8, 3069-3074.
Bhattacharya, K., Cramer, H., Albrecht, C., Schins, R., Rahman, Q., Zimmermann, U.,
Dopp E. 2008. Vanadium pentoxide-coated ultrafine titanium dioxide particles
induce cellular damage and micronucleus formation in V79 cells. J Toxicol
Environ Health A.71, 976-980.
Blasi, P., S. Giovagnoli, A. Schoubben, M. Ricci, C. 2007. Solid lipid nanoparticles for
targeted brain drug delivery. Adv Drug Deliv Rev. 59, 454-77.
Cabaleiro-Lago, C., F. Quinlan-Pluck, I. Lynch, S. Lindman, A. M. Minogue, E. Thulin,
D. M. Walsh, K. A. Dawson, and S. Linse. 2008. Inhibition of amyloid beta
protein fibrillation by polymeric nanoparticles. J Am Chem Soc. 130, 15437-43.
Chapter 4
123
Cedervall, T., Lynch, I., Foy, M., Berggard, T.,. Donnelly, S. C., Cagney, G., Linse, S.,
and Dawson. K. A. 2007. Detailed identification of plasma proteins adsorbed on
copolymer nanoparticles. Angew Chem Int Ed Engl. 46 , 5754-6.
Contreras, J., Xie, J., Chen, Y. J, Pei, H., Zhang, G., Fraser, C. L., Hamm-Alvarez, S. F.
2010. Intracellular uptake and trafficking of difluoroboron dibenzoylmethane-
polylactide nanoparticles in HeLa cells. ACS Nano. 25, 2735-2747.
Davoren, M., Herzog, E., Casey, A., Cottineau, B., Chambers, G., Byrne, H.J., Lyng,
F.M. 2007. In vitro toxicity evaluation of single walled carbon nanotubes on
human A549 lung cells. Toxicol In Vitro, 21, 438-48.
Dhawan, A., Bajpayee, M., Parmar, D.2009. Comet assay: a reliable tool for the
assessment of DNA damage in different models. Cell Biol Toxicol. 25, 5-32.
Donaldson, K., Aitken, R., Tran, L., Stone, V., Duffin, R., Forrest, G., and Alexander.
A. 2006. Carbon nanotubes: a review of their properties in relation to pulmonary
toxicology and workplace safety. Toxicol Sci. 92, 5-22.
Fields R D and Lancaster M V. 1993. Dual-attribute continuous monitoring of cell
proliferation / cytotoxicity Am. Biotechnol Lab. 11, 48-50.
He, L., Yang, L., Zhang, Z. R., Gong, V., Deng, L., Gu, Z., Sun. X. 2009. In vitro
evaluation of the genotoxicity of a family of novel MeO-PEG-poly(D,L-lactic-
co-glycolic acid)-PEG-OMe triblock copolymer and PLGA nanoparticles.
Nanotechnology 20, 455102.
Hsiue, G. H., Chang, R. W., Wang, C. H ., Lee. S. H. 2003. Development of in situ
thermosensitive drug vehicles for glaucoma therapy. Biomaterials, 24 , 2423-30.
Hsiue, G. H., Hsu, S. H., Yang, C. C., Lee, S. H., Yang. I. K. 2002. Preparation of
controlled release ophthalmic drops, for glaucoma therapy using thermosensitive
poly-N-isopropylacrylamide. Biomaterials 23, 457-62.

Chapter 4
124
Ito, F., Fujimori, H., Honnami, H., Kawakami, H., Kanamura, K.,. Makino, K. 2008.
Effect of polyethylene glycol on preparation of rifampicin-loaded PLGA
microspheres with membrane emulsification technique. Colloids Surf B
Biointerfaces 66, 65-70.
Kavanagh, C. A., Gorelova, T. A.., Selezneva, I.I, Rochev, Y. A., Dawson, K. A.
Gallagher, W. M., Gorelov, A. V., Keenan. A. K. 2005. Poly(N-
isopropylacrylamide) copolymer films as vehicles for the sustained delivery of
proteins to vascular endothelial cells. J Biomed Mater Res A 72, 25-35.
Lee, J.H., Cha, K.E., Kim, M.S., Hong, H.W., Chung, D.J., Ryu, G., Myung, H. 2009.
Nanosized polyamidoamine (PAMAM) dendrimer-induced apoptosis mediated
by mitochondrial dysfunction. Toxicol Lett. 190 , 202–207.
Lin, C. C., and Metters. A. T. 2006. Hydrogels in controlled release formulations:
network design and mathematical modeling. Adv Drug Deliv Rev 58, 1379-408.
Lynch, I., Cedervall, T., Lundqvist, M., Cabaleiro-Lago, C., Linse, S., Dawson, K. A.
2007. The nanoparticle–protein complex as a biological entity; a complex fluids
and surface science challenge for the 21st century. Advances in Colloid and
Interface Science, 134-135, 167–174.
Meade, A.D., Clarke, C., Bonnier, F., Poon, K., Garcia, A., Knief, P.,. Ostrowska, K.,
Salford, L., Nawaz, H., Lyng, F.M., Byrne, H.J., 2009. Functional and
Pathological Analysis of Biological Systems using Vibrational Spectroscopy
with Chemometric and Heuristic Approaches. First Workshop on Hyperspectral
Image and Signal Processing: Evolution in Remote Sensing, Pages: 111-114
(2009)
Chapter 4
125
Meng, H., Chen, Z., Xing, G., Yuan, H., Chen, V., Zhao, F., Zhang, C., Zhao. Y. 2007.
Ultrahigh reactivity provokes nanotoxicity: explanation of oral toxicity of nano-
copper particles. Toxicol Lett. 175, 102-10.
Naha, P. C., Kanchan, V., Manna, P. K., and Panda. A. K. 2008. Improved
bioavailability of orally delivered insulin using Eudragit-L30D coated PLGA
microparticles. J Microencapsul. 25 , 248-56.
Naha, P. C.,. Kanchan, V., and A. K. Panda. 2009a. Evaluation of parenteral depot
insulin formulation using PLGA and PLA microparticles. J Biomater Appl. 24,
309-25.
Naha, P. C., Casey, A., Tenuta, T., Lynch, I., Dawson, K. A., Byrne, H. J., Davoren, M.
2009b. Preparation, Characterization of NIPAM and NIPAM/BAM Copolymer
Nanoparticles and their Acute Toxicity Testing using an Aquatic test battery.
Aquat. Toxicol. 92, 146-154.
Naha, P.C., Davoren M., Lyng F.M., Byrne, H.J. 2010a. Oxidative stress induced
inflammatory response and cytotoxicity of PAMAM dendrimers in J774A.1
cells. Toxicology and Applied Pharmacology (Accepted/ doi:
10.1016/j.taap.2010.04.014).
Nel, A., Xia, T., Madler, L., Li, N. 2006. Toxic potential of materials at the nanolevel.
Science 311, 622-7.
Nel, A.E., Mädler, L., Velegol, D., Xia, T., Hoek, E.M.V., Somasundaran, P.,
Klaessig, F., Castranova V., and Thompson, M. 2009. Understanding
biophysicochemical interactions at the nano–bio interface.Nature materials, 8,
543-557.
Chapter 4
126
Neun, B. W, Stern, S. T. 2011. Monitoring lysosomal activity in nanoparticle-treated
cells. Methods Mol. Biol. 697, 207-212.
Oberdorster, G., Oberdorster, E., Oberdorster. J. 2005. Nanotoxicology: an emerging
discipline evolving from studies of ultrafine particles. Environ Health Perspect
113, 823-39.
Papageorgiou, I., Brown, C., Schins, R., Singh, S., Newson, R., Davis, S., Fisher, J.,
Ingham, E., Case. C. P. 2007. The effect of nano- and micron-sized particles of
cobalt-chromium alloy on human fibroblasts in vitro. Biomaterials 28, 2946-58.
Peppas, N. A., Bures, P., Leobandung, W., Ichikawa. H., 2000. Hydrogels in
pharmaceutical formulations. Eur J Pharm Biopharm 50, 27-46.
Poland, C. A., Duffin, R., Kinloch, I., Maynard, A., Wallace, W.A., Seaton, A., Stone,
V., Brown, S., Macnee, W., Donaldson. K. 2008. Carbon nanotubes introduced
into the abdominal cavity of mice show asbestos-like pathogenicity in a pilot
study. Nat Nanotechnol 3, 423-8.
Shapero, K., Fenaroli, F., Lynch, I., Cottell, D.C., Salvati, A., Dawson. K.A., 2010.
Time and space resolved uptake study of silica nanoparticles by human cells.
Molecular biosaystem, DOI: 10.1039/c0mb00109k.
Salvati, A., Santos, T., Varela, J., Åberg, C., Pinto, P., Lynch, I.,. Dawson, K.A. 2011.
Experimental and theoretical approach to comparative nanoparticle and small
molecule intracellular import, trafficking, and export. Nanomedicine (In press),
Shi, H., He, X., Yuan, Y., Wang, K., Liu, D. 2010. Nanoparticle-based biocompatible
and long-life marker for lysosome labeling and tracking. Anal Chem.82, 2213-
2220.
Chapter 4
127
Silva, C. M., Ribeiro, A. J., Ferreira, D., Veiga. F. 2006. Insulin encapsulation in
reinforced alginate microspheres prepared by internal gelation. Eur J Pharm Sci
29, 148-59.
Singh, N., Manshian, B., Jenkins, G. J., Griffiths, S. M., Williams, P.M., Maffeis, T. G.,
Wright, C. J., Doak. S. H. 2009. NanoGenotoxicology: the DNA damaging
potential of engineered nanomaterials. Biomaterials, 30, 3891-914.
Singh, S., Shi, T., Duffin, R., Albrecht, C., van Berlo, D., Hohr, D., Fubini, B., Martra,
G., Fenoglio, I., Borm, P. J., Schins. R. P. 2007. Endocytosis, oxidative stress
and IL-8 expression in human lung epithelial cells upon treatment with fine and
ultrafine TiO2: role of the specific surface area and of surface methylation of the
particles. Toxicol Appl Pharmacol 222, 141-51.
Turkez, H., Geyikoglu, F. 2007. An in vitro blood culture for evaluating the
genotoxicity of titanium dioxide: the responses of antioxidant enzymes. Toxicol
Ind Health. 23, 19-23.
Xu, F. J., Kang, E. T., Neoh. K. G. 2006. pH- and temperature-responsive hydrogels
from crosslinked triblock copolymers prepared via consecutive atom transfer
radical polymerizations. Biomaterials, 27, 2787-97.
Xu, F. J., Zhong, S. P., Yung, L. Y., Kang, E. T., Neoh. K. G. 2004. Surface-active and
stimuli-responsive polymer--Si(100) hybrids from surface-initiated atom transfer
radical polymerization for control of cell adhesion. Biomacromolecules 5, 2392-
403.
Zhang, X. Z., Jo Lewis, P., Chu. C. C. 2005. Fabrication and characterization of a smart
drug delivery system: microsphere in hydrogel. Biomaterials 26, 3299-309.
Chapter 4
128
Zhang, J., Misra, R.D.K. 2007. Magnetic drug-targeting carrier encapsulated with
thermosensitive smart polymer: Core–shell nanoparticle carrier and drug release
response. Acta Biomaterialia 3, 838–850
Chapter 5
129
Chapter 5
Ecotoxicology of PAMAM dendrimers (G4,
G5 and G6)
Adapted from “An Ecotoxicological Study of Poly (amidoamine) Dendrimers –
Towards Quantitative Structure Activity Relationships”. Environmental science
and Technology, 2009, 43, 6864-6869.
Authors: Pratap C. Naha, Maria Davoren, Alan Casey, Hugh J. Byrne
Chapter 5
130
5.1 Introduction
Dendritic polymer nanostructures are highly branched radial polymers that have specific
and systematically variable size, shape and chemical structure (Boas and Heegaard,
2004). Polyamidoamine (PAMAM) dendrimers contain a 2-carbon ethylenediamine
core and primary amino groups on the surface
(http://www.dendritech.com/pamam.html). The potential applications of the PAMAM
dendrimers are described in introduction chapter-1. There have also been recent reports
on the ecotoxicological evaluation of various metal based nanomaterials (Lovern et al.,
2007; Heinlaan et al., 2008; Gagńe et al., 2008; Mortimer et al., 2008; Navarro et al.,
2008; Franklin et al., 2007; Mueller and Nowack, 2008). A recent study has explored
the toxicity of PAMAM dendrimers G 3.5 and G 4 in a zebra fish embryo model
(Heiden et al., 2007). However, the field of eco-(nano) toxicology is still relatively new
and there is a dearth of quantitative structure activity relationships established for
nanomaterials. Our previous study of N-isopropylacrylamide/N-tert-butylacrylamide
copolymer nanoparticles demonstrated a clear relationship between the toxicity
observed in a range of test models and the physico-chemical properties of the
nanoparticles (Chapter 3; Naha et al., 2009).
To date there have been no reports on the environmental impacts of PAMAM
dendrimers. The range of potential applications may result in their unintentional release
into the environment, however, so that an assessment of their potential environmental
impact is imperative. The structurally well defined and variable macromolecules can
also provide a further basis upon which to establish structure activity relationships
governing ecotoxicological responses which may serve to develop a fundamental
understanding of their interactions and as guidelines for the future prediction of
responses.

Chapter 5
131
The aim of the present investigation was the characterization and ecotoxicological
evaluation of three commercially available PAMAM dendrimers (G4, G5 and G6).
Successive generations increase in diameter and therefore effective surface area, while
the surface chemistry is unchanged, thus enabling an assessment of the influence of
particle size alone on the toxic response. Acute ecotoxicological effects of G4, G5 and
G6 were evaluated using a battery of bioassays representing different trophic levels. The
tests employed included a bacterial model, two crustaceans and in vitro tests employing
two different fish cell lines to represent vertebrate models, in accordance with the EU
policy of Reduction, Replacement and Refinement (RRR), (Directive 86/609/EEC) on
the protection of animals used for experimental and scientific purposes. Indeed,
previous studies have demonstrated that fish cell lines are versatile tools in
ecotoxicology and found that in vitro cytotoxicity is positively correlated with acute
toxicity in vivo (Fent, 2001). The particle size and zeta potential combined with pH
were monitored in the range of test media. UV/visible spectroscopic analysis of these
particles in two different cell culture media was performed to investigate any potential
changes to the effective medium composition which could contribute to an indirect or
secondary toxicity (Casey et al., 2008).
5.2 Experimental methods
The experimental methods are described in chapter 2. Particle size measurement and
zeta potential are described in chapter 2, section 2.2.1.1 and 2.2.1.2. Interactions of
PAMAM dendrimers with cell culture media were carried out by spectroscopic study
and the methodology is described in section 2.2.1.3. All the ecotoxicity protocols and
cytotoxicity assays are described in section 2.2.2 and 2.2.2.6 of chapter 2.
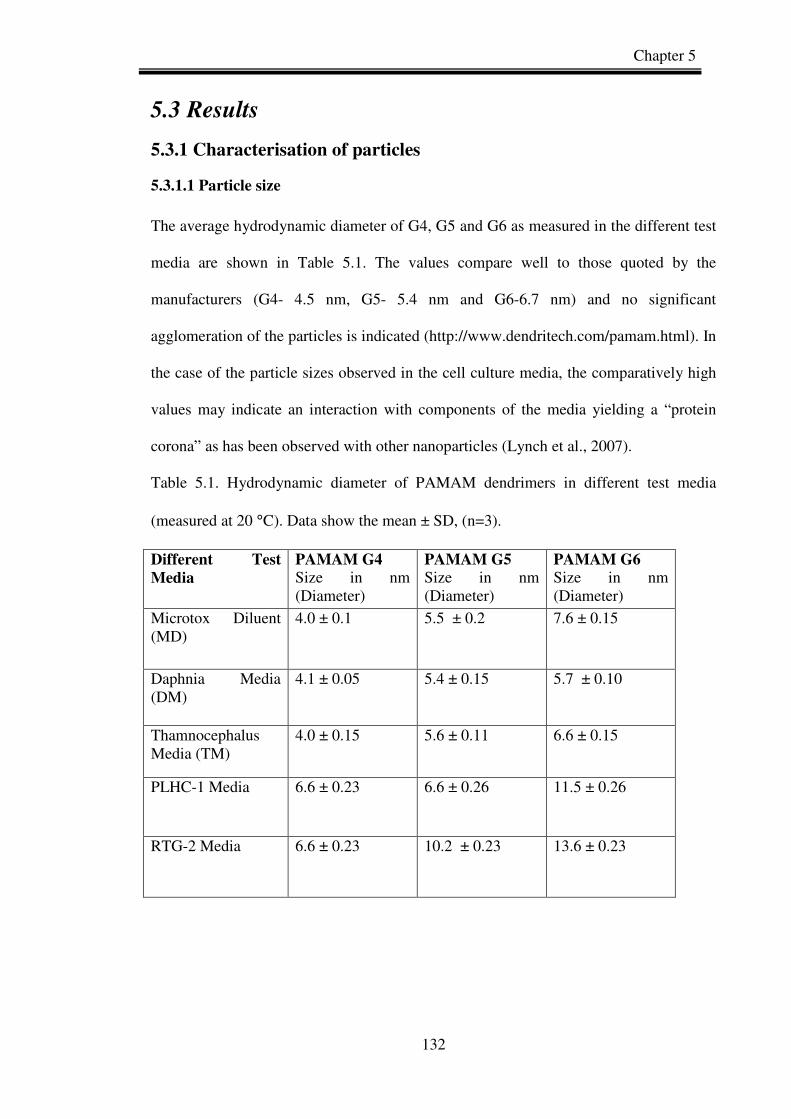
Chapter 5
132
5.3 Results
5.3.1 Characterisation of particles
5.3.1.1 Particle size
The average hydrodynamic diameter of G4, G5 and G6 as measured in the different test
media are shown in Table 5.1. The values compare well to those quoted by the
manufacturers (G4- 4.5 nm, G5- 5.4 nm and G6-6.7 nm) and no significant
agglomeration of the particles is indicated (http://www.dendritech.com/pamam.html). In
the case of the particle sizes observed in the cell culture media, the comparatively high
values may indicate an interaction with components of the media yielding a “protein
corona” as has been observed with other nanoparticles (Lynch et al., 2007).
Table 5.1. Hydrodynamic diameter of PAMAM dendrimers in different test media
(measured at 20 °C). Data show the mean ± SD, (n=3).
Different Test Media
PAMAM G4 Size in nm (Diameter)
PAMAM G5 Size in nm (Diameter)
PAMAM G6 Size in nm (Diameter)
Microtox Diluent (MD)
4.0 ± 0.1 5.5 ± 0.2 7.6 ± 0.15
Daphnia Media (DM)
4.1 ± 0.05 5.4 ± 0.15 5.7 ± 0.10
Thamnocephalus Media (TM)
4.0 ± 0.15 5.6 ± 0.11 6.6 ± 0.15
PLHC-1 Media 6.6 ± 0.23 6.6 ± 0.26 11.5 ± 0.26
RTG-2 Media 6.6 ± 0.23 10.2 ± 0.23 13.6 ± 0.23

Chapter 5
133
5.3.1.2 Zeta potential
The zeta potential of each the dendrimer was measured in each of test media employed
and these values are shown graphically in Figure 5.1. Each of the particles tested gave a
positive zeta potential in all the media (with the exception of the cell culture media) as a
result of the positively charged NH2 surface groups. It is noted, however, that the
magnitude of the zeta potential does not change monotonically with generation number,
except in MQ. The G4 dendrimer is minimally perturbed compared to the value in MQ
in all media, again with the exception of the PLHC-1 and RTG-2 media. The PLHC-1
and RTG-2 media differ from the DMEM medium in that they contain additional FCS.
It is suggested therefore that the additional protein adsorbs onto the surface of the
particles masking the intrinsic surface charge. In DM, TM and MD, the zeta potentials
of G5 and G6 are considerably perturbed suggesting a significant interaction with the
medium.
-10
-5
0
5
10
15
20
25
30
35
MQ DM TM MD DMEM
Different Test Media
Zet
a p
ote
nti
al i
n m
V
PAMAM G-4
PAMAM G-5
PAMAM G-6
PLHC-1
Figure 5.1. Zeta potential of PAMAM dendrimer in different test media. Data presented
as mean ± SD (n=6).
Chapter 5
134
5.3.1.3 Spectroscopic analysis
Both the particle size and zeta potential measurements point towards an interaction of
the dendrimers with the cell culture medium. Such interactions have previously been
observed for single walled carbon nanotubes (Casey et al., 2008) and were characterized
using UV/visible absorption spectroscopy (Casey et al., 2007).
The UV-Visible absorption spectrum of the DMEM medium shows characteristic peaks
at ~270, ~360, ~410 and ~560 nm (Figure 5.2 A). The feature at ~360 nm can be
attributed to riboflavin (Posadaz et al., 2000; Zirak et al., 2005), a vitamin present in the
medium, whereas the feature at ~560 nm can be assigned to the phenol red indicator
within the medium. At ~270 nm, there are contributions from the range of amino acids
and other molecular components contained within the medium. Upon addition of FCS,
in PLHC-1 and RTG-2, a further feature at ~ 410 nm evolves and the feature at ~ 270
nm increases significantly. Most notably, upon addition of the FCS to the DMEM
medium, there is a visible colour change manifest spectroscopically as a significant and
progressive decrease of the characteristic absorption feature of the phenol red pH
indicator at ~560 nm indicating that the additional proteins affect a change in the pH of
the medium.
Upon addition of the dendrimers to the cell culture media, a visible colour change was
also observed. Figure 5.2C, shows the absorption spectra of the 5% FCS supplemented
DMEM medium, PLHC-1, with and without the dendrimer particles added. The phenol
red absorption at ~560 nm is seen to increase, the change increasing according to the
sequence G6~G5<G4. This is essentially a reversal of the changes observed in the pure
medium DMEM upon addition of the 5% FCS. Also notable in Figure 5.2 are the
changes to the spectral feature at ~410nm, associated with the FCS. There is a
progressive reduction of the absorbance from that observed in the pure medium in the

Chapter 5
135
sequence G6~G5>G4. The same behaviour and indeed trend is observable in the RTG-2
10% serum supplemented cell culture medium. (Figure 5.2B).
Figure 5.2. Medium interaction study of PAMAM (G4, G5 and G6) dendrimers in
PLHC-1 media by UV-Visible absorption spectroscopy. Figure A represents UV-
Visible absorption spectra of DMEM F-12 HAM, PLHC-1 and RTG-2 media; Figure B
represents UV-Visible absorption spectra of RTG-2 media with PAMAM (G4, G5 and
G6) dendrimers; Figure C represents UV-Visible absorption spectra of PLHC-1 media
with PAMAM (G4, G5 and G6) dendrimers.
The observed spectroscopic changes can be associated with changes in the pH of the
medium. Upon addition of FCS to DMEM, the pH is reduced from 7.9 to 7.6 (5%) and
0
0.2
0.4
0.6
0.8
1
1.2
1.4
1.6
250 300 350 400 450 500 550 600
Wavelength (nm)
Ab
sorb
an
ce (
a.u
)
DMEM
PLHC-1
RTG-2
A B
C
Chapter 5
136
7.4 (10%). Upon addition of the dendrimer nanoparticles to the media, the pH was seen
to recover significantly, most notably for G4.
The reduction of the absorbance feature associated with the FCS and the concurrent
reversal of the pH changes caused by the addition of the FCS to the pure medium points
towards an interaction of the particles with the FCS by adsorption. This changes the
contribution of the serum to the pH and the effective composition of the medium.
Comparatively high values of the particle sizes observed in the cell culture media may
indicate an interaction with components of the media yielding a “protein corona” as has
been observed with other nanoparticles (Lynch et al., 2007). The values of the zeta
potential of the dendrimers in the cell culture media are negative which suggests that the
additional protein adsorbs onto the surface of the particles. In addition, the changes to
the spectral feature at ~410nm, associated with the FCS, also indicate an interaction of
the nanoparticles with the protein. There is a progressive reduction of the absorbance
from that observed in the pure medium in the sequence G6~G5>G4. The same behavior
and indeed trend is observable in the RTG-2 10 % serum supplemented cell culture
medium. (Figure 5.2B and C). Notably, however, no changes to the absorption features
at ~ 360 nm are discernible, indicating that the medium interaction is primarily with the
FCS.
5.3.2 Ecotoxicity
Testing of the reference chemicals, phenol and potassium dichromate, was carried out in
tandem with the nanoparticles to ensure the validity of each test method. Endpoints of
all reference toxicity tests were within those stipulated in each respective standard
guideline or reported in other previous studies (Chapter 2. section 2.2.2). Consistent
results were achieved for each test control in accordance with the criteria for validity of
each test guideline.
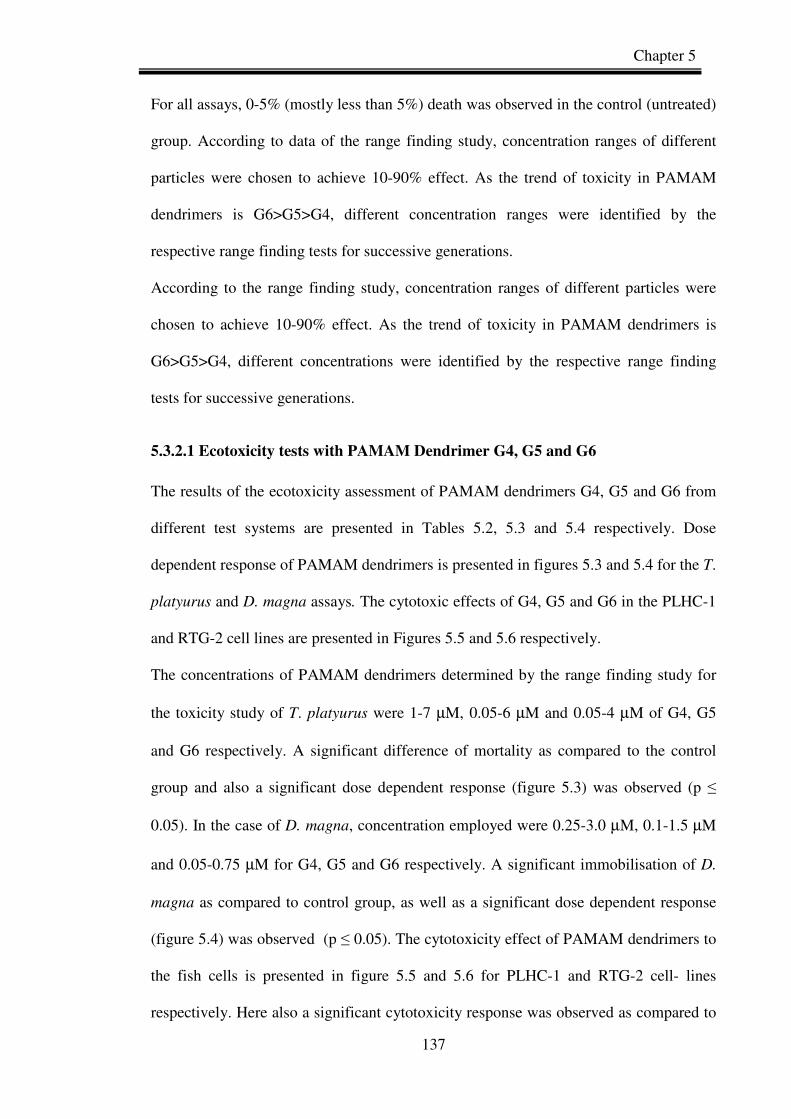
Chapter 5
137
For all assays, 0-5% (mostly less than 5%) death was observed in the control (untreated)
group. According to data of the range finding study, concentration ranges of different
particles were chosen to achieve 10-90% effect. As the trend of toxicity in PAMAM
dendrimers is G6>G5>G4, different concentration ranges were identified by the
respective range finding tests for successive generations.
According to the range finding study, concentration ranges of different particles were
chosen to achieve 10-90% effect. As the trend of toxicity in PAMAM dendrimers is
G6>G5>G4, different concentrations were identified by the respective range finding
tests for successive generations.
5.3.2.1 Ecotoxicity tests with PAMAM Dendrimer G4, G5 and G6
The results of the ecotoxicity assessment of PAMAM dendrimers G4, G5 and G6 from
different test systems are presented in Tables 5.2, 5.3 and 5.4 respectively. Dose
dependent response of PAMAM dendrimers is presented in figures 5.3 and 5.4 for the T.
platyurus and D. magna assays. The cytotoxic effects of G4, G5 and G6 in the PLHC-1
and RTG-2 cell lines are presented in Figures 5.5 and 5.6 respectively.
The concentrations of PAMAM dendrimers determined by the range finding study for
the toxicity study of T. platyurus were 1-7 µM, 0.05-6 µM and 0.05-4 µM of G4, G5
and G6 respectively. A significant difference of mortality as compared to the control
group and also a significant dose dependent response (figure 5.3) was observed (p ≤
0.05). In the case of D. magna, concentration employed were 0.25-3.0 µM, 0.1-1.5 µM
and 0.05-0.75 µM for G4, G5 and G6 respectively. A significant immobilisation of D.
magna as compared to control group, as well as a significant dose dependent response
(figure 5.4) was observed (p ≤ 0.05). The cytotoxicity effect of PAMAM dendrimers to
the fish cells is presented in figure 5.5 and 5.6 for PLHC-1 and RTG-2 cell- lines
respectively. Here also a significant cytotoxicity response was observed as compared to

Chapter 5
138
control group (p ≤ 0.05). Overall, a significant generation dependent ecotoxicity
response was observed with PAMAM dendrimers and the trend of toxicity is G6 > G5 >
G4 (p ≤ 0.05) for the range of test models employed, except the case of V. Fischeri. D.
magna is found to be most sensitive test model and RTG-2 cells the least, according to
the calculated EC50/LC50 value (Table 5.2-5.4) for the case of G4, G5 and G6 PAMAM
dendrimers. The LOEC and NOEC of all the PAMAM dendrimers for the entire range
of test models employed here is described in table 5.2-5.4.
Figure 5.3. Dose dependent response of PAMAM dendrimers in T. platyurus , Figures
A, B and C represents results for the PAMAM dendrimers G4, G5 and G6 respectively.
* Denotes significant difference of mortality as compared to control group (p ≤ 0.05).
*
*
*
**
0
20
40
60
80
100
120
1 2 3 5 7
Concentration of Dendrimer in µµµµM
% o
f M
ort
ality
*
*
*
*
*
0
20
40
60
80
100
120
0.5 1 2 4 6
Concentration of Dendrimers in µµµµM
% o
f M
ort
ality
**
*
*
*
0
20
40
60
80
100
120
0.5 1 2 3 4
Concentration of Dendrimers in µµµµM
% o
f M
ort
ality
A B
C
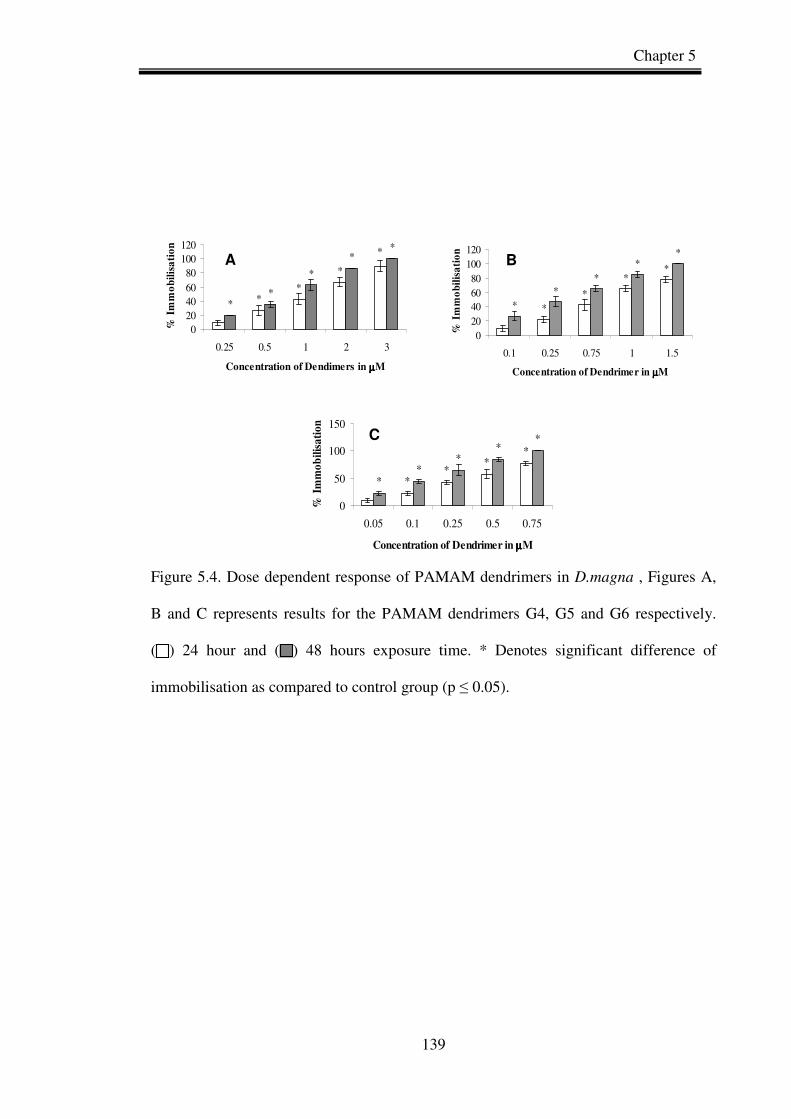
Chapter 5
139
Figure 5.4. Dose dependent response of PAMAM dendrimers in D.magna , Figures A,
B and C represents results for the PAMAM dendrimers G4, G5 and G6 respectively.
( ) 24 hour and ( ) 48 hours exposure time. * Denotes significant difference of
immobilisation as compared to control group (p ≤ 0.05).
*
*
***
*
*
**
0
20
40
60
80
100
120
0.25 0.5 1 2 3
Concentration of Dendimers in µµµµM
% I
mm
ob
ilis
ati
on
**
*
*
**
**
*
0
20
40
60
80
100
120
0.1 0.25 0.75 1 1.5
Concentration of Dendrimer in µµµµM
% I
mm
ob
ilis
ati
on
**
**
**
**
*
0
50
100
150
0.05 0.1 0.25 0.5 0.75
Concentration of Dendrimer in µµµµM
% I
mm
ob
ilis
atio
n
A B
C

Chapter 5
140
Table 5.2. Ecotoxicity of PAMAM dendrimer G4.
Test Model End Point and Concentration Range tested
(µµµµM)
EC50/LC50 (µµµµM)
NOEC (µµµµM)
LOEC (µµµµM)
V. fischeri 5 min inhibition
( 0.195 – 50 )
16.30 3.1 6.25
V. fischeri 15 min inhibition
( 0.195 – 50 )
6.17 1.5 3.1
V. fischeri 30 min inhibition
( 0.195 – 50 )
3.11 0.195 0.39
D. magna 24 h immobilisation
( 0.25 – 3 )
1.13 0.25 0.5
D. magna 48 h immobilisation
( 0.25 – 3 )
0.68 < 0.25 0.25
T. platyurus 24 h lethality ( 1 – 7 )
2.90 < 1 1
PLHC-1 96 h Cytotoxicity ( 0.176 – 13 )
2.08 0.176 0.352
RTG-2 96 h Cytotoxicity
( 1- 80 )
12.93 < 1 1
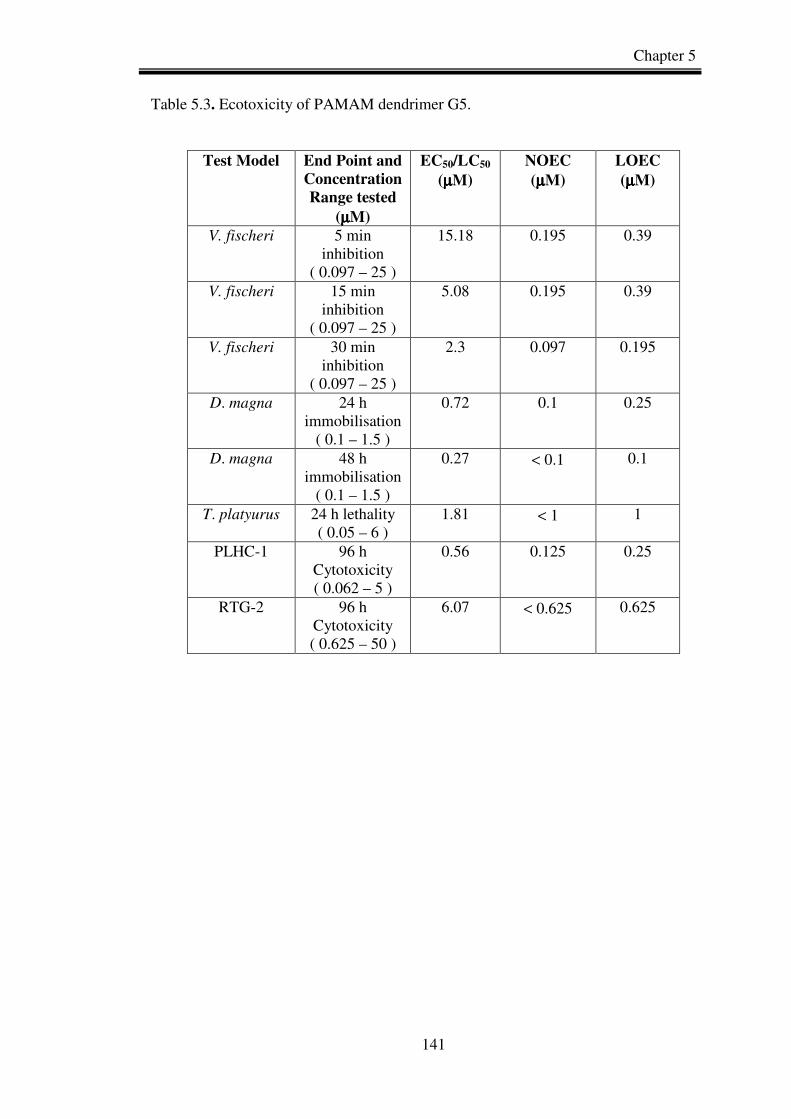
Chapter 5
141
Table 5.3. Ecotoxicity of PAMAM dendrimer G5.
Test Model End Point and Concentration Range tested
(µµµµM)
EC50/LC50 (µµµµM)
NOEC (µµµµM)
LOEC (µµµµM)
V. fischeri 5 min inhibition
( 0.097 – 25 )
15.18 0.195 0.39
V. fischeri 15 min inhibition
( 0.097 – 25 )
5.08 0.195 0.39
V. fischeri 30 min inhibition
( 0.097 – 25 )
2.3 0.097 0.195
D. magna 24 h immobilisation
( 0.1 – 1.5 )
0.72 0.1 0.25
D. magna 48 h immobilisation
( 0.1 – 1.5 )
0.27 < 0.1 0.1
T. platyurus 24 h lethality ( 0.05 – 6 )
1.81 < 1 1
PLHC-1 96 h Cytotoxicity ( 0.062 – 5 )
0.56 0.125 0.25
RTG-2 96 h Cytotoxicity ( 0.625 – 50 )
6.07 < 0.625 0.625
Chapter 5
142
Table 5.4. Ecotoxicity of PAMAM dendrimer G6.
Test Model End Point and Concentration Range tested
(µµµµM)
EC50/LC50 (µµµµM)
NOEC (µµµµM)
LOEC (µµµµM)
V. fischeri 5 min inhibition
( 0.048 – 12.5 )
4.80 0.195 0.39
V. fischeri 15 min inhibition
( 0.048 – 12.5 )
1.64 0.195 0.39
V. fischeri 30 min inhibition
( 0.048 – 12.5 )
0.83 0.195 0.39
D. magna 24 h immobilisation ( 0.05 – 0.75 )
0.32 0.05 0.1
D. magna 48 h immobilisation ( 0.05 – 0.75 )
0.13 < 0.05 0.05
T. platyurus 24 h lethality ( 0.5 – 4 )
1.11 < 1 1
PLHC-1 96 h Cytotoxicity ( 0.037 – 3 )
0.21 0.037 0.075
RTG-2 96 h Cytotoxicity ( 0.031 – 25 )
2.51 < 0.31 0.31

Chapter 5
143
Figure 5.5 Cytotoxicity of PAMAM dendrimer in PLHC-1 cells as quantified using the
AB Assay. A, B and C represent G4, G5 and G6 respectively. Data presented as mean ±
SD (N=3). ∗ Denotes significant difference from control ( p ≤ 0.05). 24 h ( ); 48 h ( );
72 h ( ) and (96 h ( ).
The results of the ecotoxicological assessment of the three generations of PAMAM
dendrimer nanoparticles are summarised in Table 5.2 to 5.4. Although the different
models cannot be quantitatively compared, and we acknowledge that generally fish cell
lines are at least an order of magnitude less sensitive than the whole organism (Davoren
and Fogarty 2006), the figure illustrates the differing sensitivities of the models, and
most significantly the consistent systematic structural dependence of the response. In
the case of the Vibrio fischeri test model, the toxicity of each dendrimer was found to
increase linearly with increasing exposure time.
A B
C
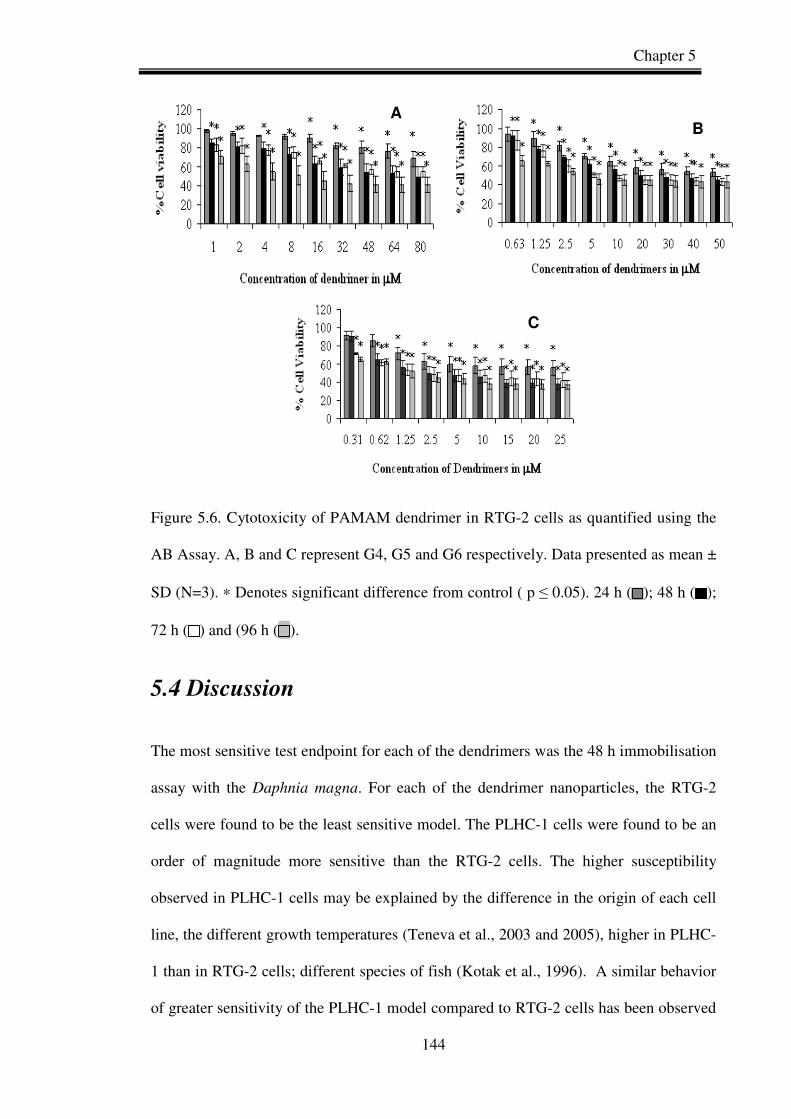
Chapter 5
144
Figure 5.6. Cytotoxicity of PAMAM dendrimer in RTG-2 cells as quantified using the
AB Assay. A, B and C represent G4, G5 and G6 respectively. Data presented as mean ±
SD (N=3). ∗ Denotes significant difference from control ( p ≤ 0.05). 24 h ( ); 48 h ( );
72 h ( ) and (96 h ( ).
5.4 Discussion
The most sensitive test endpoint for each of the dendrimers was the 48 h immobilisation
assay with the Daphnia magna. For each of the dendrimer nanoparticles, the RTG-2
cells were found to be the least sensitive model. The PLHC-1 cells were found to be an
order of magnitude more sensitive than the RTG-2 cells. The higher susceptibility
observed in PLHC-1 cells may be explained by the difference in the origin of each cell
line, the different growth temperatures (Teneva et al., 2003 and 2005), higher in PLHC-
1 than in RTG-2 cells; different species of fish (Kotak et al., 1996). A similar behavior
of greater sensitivity of the PLHC-1 model compared to RTG-2 cells has been observed
A B
C
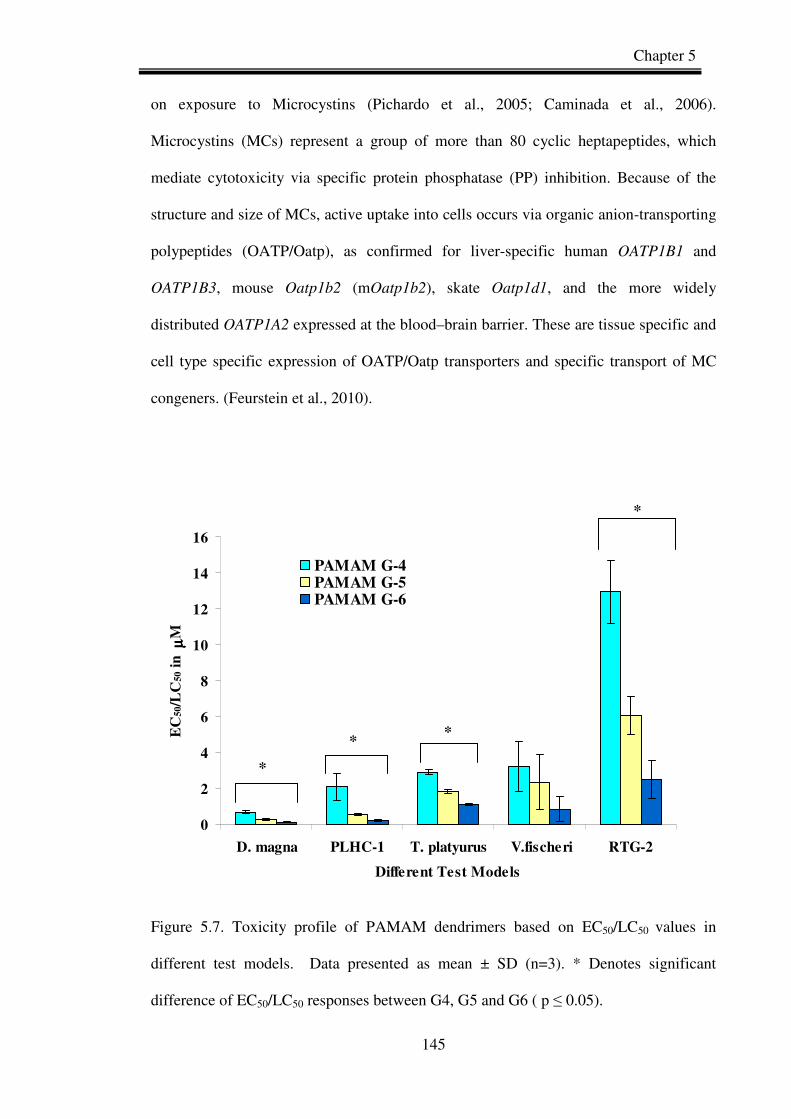
Chapter 5
145
on exposure to Microcystins (Pichardo et al., 2005; Caminada et al., 2006).
Microcystins (MCs) represent a group of more than 80 cyclic heptapeptides, which
mediate cytotoxicity via specific protein phosphatase (PP) inhibition. Because of the
structure and size of MCs, active uptake into cells occurs via organic anion-transporting
polypeptides (OATP/Oatp), as confirmed for liver-specific human OATP1B1 and
OATP1B3, mouse Oatp1b2 (mOatp1b2), skate Oatp1d1, and the more widely
distributed OATP1A2 expressed at the blood–brain barrier. These are tissue specific and
cell type specific expression of OATP/Oatp transporters and specific transport of MC
congeners. (Feurstein et al., 2010).
0
2
4
6
8
10
12
14
16
D. magna PLHC-1 T. platyurus V.fischeri RTG-2
Different Test Models
EC
50/L
C50
in
µµ µµ
M
PAMAM G-4PAMAM G-5PAMAM G-6
*
**
*
Figure 5.7. Toxicity profile of PAMAM dendrimers based on EC50/LC50 values in
different test models. Data presented as mean ± SD (n=3). * Denotes significant
difference of EC50/LC50 responses between G4, G5 and G6 ( p ≤ 0.05).
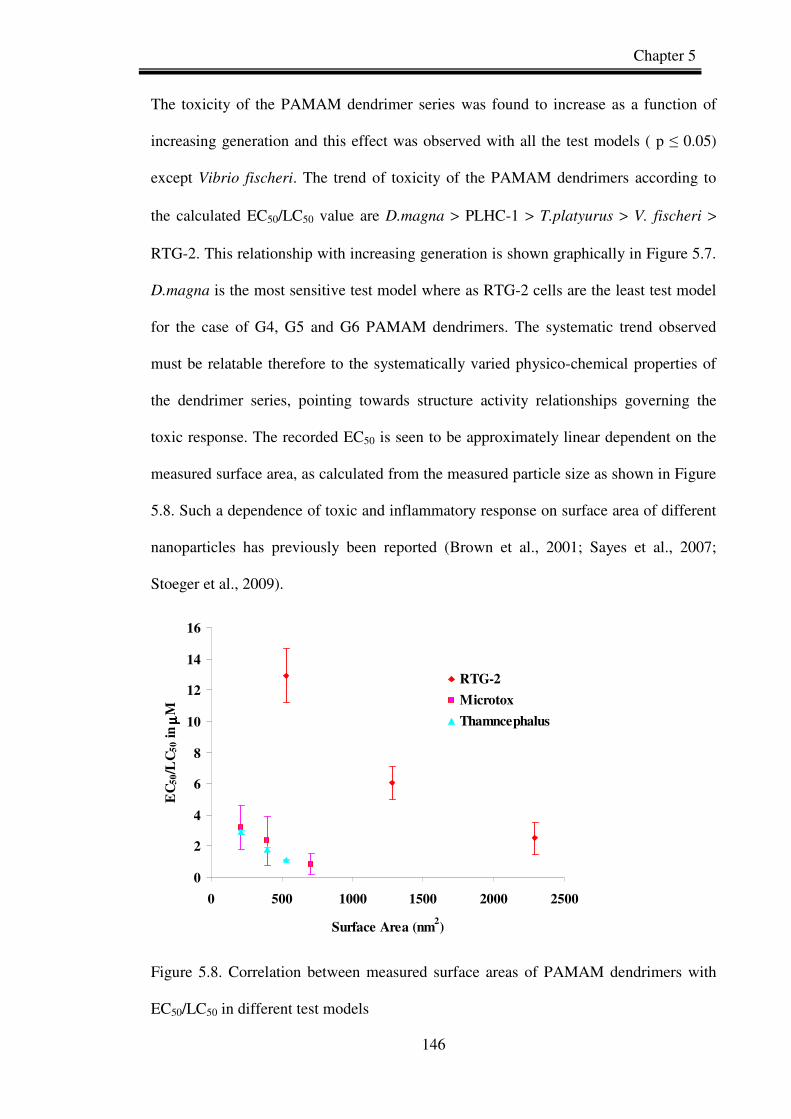
Chapter 5
146
The toxicity of the PAMAM dendrimer series was found to increase as a function of
increasing generation and this effect was observed with all the test models ( p ≤ 0.05)
except Vibrio fischeri. The trend of toxicity of the PAMAM dendrimers according to
the calculated EC50/LC50 value are D.magna > PLHC-1 > T.platyurus > V. fischeri >
RTG-2. This relationship with increasing generation is shown graphically in Figure 5.7.
D.magna is the most sensitive test model where as RTG-2 cells are the least test model
for the case of G4, G5 and G6 PAMAM dendrimers. The systematic trend observed
must be relatable therefore to the systematically varied physico-chemical properties of
the dendrimer series, pointing towards structure activity relationships governing the
toxic response. The recorded EC50 is seen to be approximately linear dependent on the
measured surface area, as calculated from the measured particle size as shown in Figure
5.8. Such a dependence of toxic and inflammatory response on surface area of different
nanoparticles has previously been reported (Brown et al., 2001; Sayes et al., 2007;
Stoeger et al., 2009).
0
2
4
6
8
10
12
14
16
0 500 1000 1500 2000 2500
Surface Area (nm2)
EC
50/L
C5
0 i
n µµ µµ
M
RTG-2
Microtox
Thamncephalus
Figure 5.8. Correlation between measured surface areas of PAMAM dendrimers with
EC50/LC50 in different test models
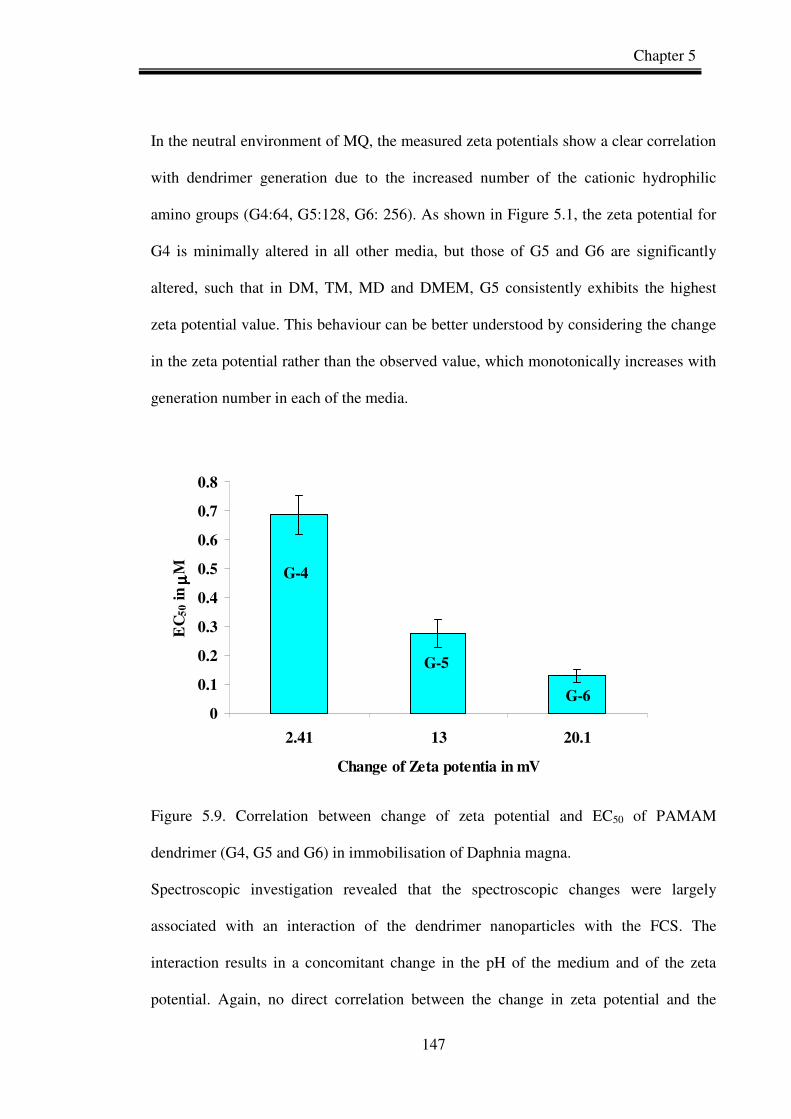
Chapter 5
147
In the neutral environment of MQ, the measured zeta potentials show a clear correlation
with dendrimer generation due to the increased number of the cationic hydrophilic
amino groups (G4:64, G5:128, G6: 256). As shown in Figure 5.1, the zeta potential for
G4 is minimally altered in all other media, but those of G5 and G6 are significantly
altered, such that in DM, TM, MD and DMEM, G5 consistently exhibits the highest
zeta potential value. This behaviour can be better understood by considering the change
in the zeta potential rather than the observed value, which monotonically increases with
generation number in each of the media.
0
0.1
0.2
0.3
0.4
0.5
0.6
0.7
0.8
2.41 13 20.1
Change of Zeta potentia in mV
EC
50 i
n µµ µµ
M
G-5
G-6
G-4
Figure 5.9. Correlation between change of zeta potential and EC50 of PAMAM
dendrimer (G4, G5 and G6) in immobilisation of Daphnia magna.
Spectroscopic investigation revealed that the spectroscopic changes were largely
associated with an interaction of the dendrimer nanoparticles with the FCS. The
interaction results in a concomitant change in the pH of the medium and of the zeta
potential. Again, no direct correlation between the change in zeta potential and the
Chapter 5
148
change in pH was observed. Notably, the trend of the degree of interaction of
G4>G5~G6 does not correlate with the observed trends in the toxic response of
G4<G5<G6, indicating that changes to the effective medium concentration due to
adsorption of the protein are not the dominant factor governing the toxic response, and
that a direct response to the interaction of the cells with the protein covered particles is
most likely (Lynch et al., 2007). As for the bacterial and crustacean models, however,
there is a correlation between the observed change in the zeta potential and the toxic
response potentially pointing towards an indirect toxic mechanism.
The PAMAM dendrimers tested in this study were found to be more toxic, according to
the differences of the EC50s to the same test models compared to the PNIPAM and
NIPAM/BAM copolymer nanoparticles previously tested (Naha et al., 2009). From the
previous study it was demonstrated that the most sensitive model for PNIPAM and
NIPAM/BAM 85:15 nanoparticles is Daphnia magna (EC50 413.6 and 449.6 mgl-1
respectively). For NIPAM/BAM 65:35 and NIPAM/BAM 50:50 the most sensitive
model was found to be Vibrio fischeri (EC50 40 and 25 mgl-1 respectively). For the
PAMAM dendrimers tested in this study the Daphnia magna was the most sensitive
model, EC50 0.68 µM (~ 9.6 mgl-1), 0.27 µM (~ 7.7 mgl-1) and 0.13 µM (~ 7.4 mgl-1)
respectively.
For the PAMAM dendrimer series, the surface chemistry is the same for each
generation, but in successive generations there is a systematic increase in molecular
weight, number of surface amino groups and particle size. The toxicity also linearly
increased with the increase in generation of PAMAM dendrimer (G6 > G5 > G4) with
all the test models which point towards physico-chemical properties as well as structure
activity relationship.
Chapter 5
149
5.5 Conclusion
In summary, polyamidoamine (PAMAM) dendrimers show a significant eco and
cytotoxicological response at concentrations ranges from 0.13 µM to 16.30 µM. For all
generations of PAMAM dendrimer tested the Daphnia magna was demonstrated to be
the most sensitive test model with the RTG-2 cell line being the least sensitive. The
toxicological response was seen to correlate well with the generation of PAMAM
dendrimers and therefore with the particle surface area. The surface chemistry is
unaltered in successive generations, and thus a clear and direct relationship between the
physical parameter and the toxic response is inferred. The physico- chemical
characteristics, most notably the zeta potential of the particles, were seen to change
dependant on the dispersion medium, however, and the correlation of the toxic response
to these changes may point towards an interaction with the medium resulting in a
change in effective composition as an underlying source of the toxic response.
Successive generations present a larger surface area for interaction with the media, and
thus a larger toxic response. Such an indirect effect cannot be considered as the sole
origin; however, as is seen by comparison of the PAMAM dendrimers with the
NIPAM/BAM copolymer nanoparticles and mechanisms of internalisation resulting in a
direct toxic response should be investigated for all models.
While this study has established the initial ecotoxicity of these PAMAM (G4, G5 and
G6) dendrimers, consideration should now be directed towards understanding the
mechanisms behind the observed toxicity for these dendrimers, as presented in the next
chapter.

Chapter 5
150
References
Boas, U., Heegaard, P. M. H. 2004. Dendrimers in drug research. Chem. Soc. Rev. 33,
43-63.
Boaru, D. A., Dragos, N., Schirmer, K. 2006. Microcystin-LR induced cellular effects
in mammalian and fish primary hepatocyte cultures and cell lines: a comparative
study. Toxicology, 218, 134–148.
Brown, D. M., Wilson, M. R., MacNee, W., Stone, V., Donaldson, K. 2001. Size-
Dependent Proinflammatory Effects of Ultrafine Polystyrene Particles: A Role for
Surface Area and Oxidative Stress in the Enhanced Activity of Ultrafines.
Toxicology and Applied Pharmacology, 175, 191–199.
Caminada, D., Escher, C., Fent, K. 2006. Cytotoxicity of pharmaceuticals found in
aquatic systems: Comparison of PLHC-1 and RTG-2 fish cell lines. Aquat. Toxicol.
79, 114-123.
Casey, A., Herzog, E., Lyng, F. M., Byrne, H. J., Chambers, G., Davoren, M. 2008.
Single walled carbon nanotubes induce indirect cytotoxicity by medium depletion in
A549 lung cells. Toxicol. Lett. 179, 78-84.
Casey, A., Davoren, M., Herzog, E., Lyng, F. M., Byrne, H. J., Chambers, G. 2007.
Probing the interaction of single walled carbon nanotubes within cell culture
medium as a precursor to toxicity testing. Carbon, 45, 34–40.
Chandrasekhar, D., Sistla, R., Ahmad, F. J., Khar, R. K., Diwan, P. V. 2007. The
development of folate-PAMAM dendrimer conjugates for targeted delivery of anti-
arthritic drugs and their pharmacokinetics and biodistribution in arthritic rats.
Biomaterial, 28, 504-512.
Colvin, V. L. 2003. The potential environmental impact of engineered nanomaterials.
Nat. Biotechnol. 21, 1166–70.
Chapter 5
151
Davoren, M., Fogarty, A.M. 2006. In vitro cytotoxicity assessment of the biocidal
agents sodium o-phenylphenol, sodium o-benzyl-p-chlorophenol, and sodium p-
tertiary amylphenol using established fish cell lines. Toxicol. In Vitro, 7, 1190-
1201.
Duncan, R., Izzo, L. 2005. Dendrimer biocompatibility and toxicity. Adv. Drug Deliv.
Rev. 57, 2215-2237.
Emanuele, A. D., Attwood, D. 2005. Dendrimer-drug interactions. Adv. Drug Deliv.
Rev. 57, 2147-2162.
Franklin, N. M., Rogers, N. J., Apte, S. C., Batley, G. E., Gadd,G. E., Casey, P.S. 2007.
Comparative Toxicity of Nanoparticulate ZnO, Bulk ZnO, and ZnCl2 to a
Freshwater Microalga (Pseudokirchneriella subcapitata): The Importance of Particle
Solubility. Environ. Sci. Technol. 41, 8484–8490.
Fent, K. 2001. Fish cell lines are versatile tools in ecotoxicology: assessment of
cytotoxicity, cytochrome P4501A induced potential and estrogenic activity of
chemicals and environmental samples. Toxicology in vitro, 15, 477-488.
Feurstein, D., Kleinteich, J., Heussner, A.H., Stemmer, K., Dietrich, D.R. 2010.
Investigation of microcystin congener-dependent uptake into primary murine
neurons. Environmental Health and Perspective, 118, 370-375.
Foley, S., Crowley, C., Smaihi, M., Bonfils, C., Erlanger, B., Seta, P., Larroque, C.
2002. Cellular localisation of a water-soluble fullerene derivative. Biochem.
Biophys. Res. Commun. 294, 116–119.
Gagńe, F., Auclair, J., Turcotte, P., Fournier, M., Gagnon, C., Sauve, S., Blaise, C.
2008. Ecotoxicity of CdTe quantum dots to fresh water mussels: Impacts on
immune system, oxidative stress and genotoxicity. Aquat. Toxicol. 86, 333-340.
Chapter 5
152
Heiden, T. C., Dengler, E., Kao, W. J., Heideman, W., Peterson, R. E. 2007.
Developmental toxicity of low generation PAMAM dendrimers in zebrafish.
Toxicol Appl Pharmacol. 225, 70-79.
Heinlaan, M., Ivask, A., Blinova, I., Dubourguier, H. C., Kahru, A. 2008. Toxicity of
nanosized and bulk ZnO, CuO and TiO2 to bacteria Vibrio fischeri and crustaceans
Daphnia magna and Thamnocephalus platyurus. Chemosphere, 71, 1308-1316.
Hong, S. P., Bielinska, A. U., Mecke, A., Keszler, B., Beals, J. L., Shi, X. Y., Balogh,
L., Orr, B. G., Baker, J. R., Holl, M. M. B. 2004. Interaction of poly(amidoamine)
dendrimers with supported lipid bilayers and cells: hole formation and the relation
to transport. Bioconjugate Chem. 15, 774-782.
http://www.dendritech.com/pamam.html.
Kotak, B. J., Semalulu, S., Friytz, D. L., Prepas, E. E., Hrudey, S. E., Coppock, R.W.
1996. Hepatic and renal pathology of intraperitoneally administered microcystin-LR
in rainbow trout (Oncorhynchus mykiss). Toxicon, 34, 517–525.
Labieniec, M., Gabryelak, T. 2008. Preliminary biological evaluation of
poli(amidoamine) (PAMAM) dendrimer G3.5 on selected parameters of rat liver
mitochondria. Mitochondrion, 8, 305–312
Leroueil, P. R., Berry, S. A., Duthie, K., Han, G., Rotello, V. M., McNerny, D. Q.,
Baker, J. R., Orr, B. G., Holl, M. M. B. 2008. Wide varieties of cationic
nanoparticles induce defects in supported lipid bilayers. Nano Letters. 8, 420-424.
Leroueil, P. R., Hong, S. Y., Mecke, A., Baker, J. R., Orr, B. G., Holl, M. M. B. 2007.
Nanoparticle interaction with biological membranes: Does nanotechnology
present a janus face? Acc. Chem. Res. 40, 335-342.

Chapter 5
153
Lovern, S. B., Strickler J. R., Klaper, R. 2007. Behavioural and physiological changes
in Daphnia magna when exposed to nanoparticle suspensions (titanium dioxide,
nano-C60, and C60HxC70Hx). Environ. Sci. Technol. 41, 4465-7.
Lynch, I., Cedervall, T., Lundqvist, M., Cabaleiro-Lago, C., Linse, S., Dawson, K. A.
2007. The nanoparticle–protein complex as a biological entity; a complex fluids and
surface science challenge for the 21st century. Advances in Colloid and Interface
Science, 134-135, 167–174.
Malik, N., Wiwattanapatapee, R., Klopsch, R., Lorenz, K., Frey, H., Weener, J. W.,
Meijer, E. W., Paulus, W., Duncan, R. 2000. Dendrimers: relationship between
structure and biocompatibility in vitro, and preliminary studies in the biodistribution
of 125I-labelled polyamidoamine dendrimers in vivo. Journal of Controlled Release.
65, 133-148.
Mortimer, M., Kasemets, K., Heinlaan, M., Kurvet, I., Kahru, A. 2008. High
throughput kinetic Vibrio fischeri bioluminescence inhibition assay for study of
toxic effects of nanoparticles. Toxicol. In Vitro, 22, 1412-1417.
Mueller, N. C., Nowack, B. 2008. Exposure Modelling of Engineered Nanoparticles in
the Environment. Environ. Sci. Technol. 42, 4447–4453.
Naha, P. C., Casey, A., Tenuta, T., Lynch, I., Dawson, K. A., Byrne, H. J., Davoren, M.
2009. Preparation, Characterization of NIPAM and NIPAM/BAM Copolymer
Nanoparticles and their Acute Toxicity Testing using an Aquatic test battery. Aquat.
Toxicol. 92, 146-154.
Navarro, E., Piccapietra, F., Wagner, B., Marconi, F., Kaegi, R., Odzak, N., Sigg, L.,
Behra, R. 2008. Toxicity of Silver Nanoparticles to Chlamydomonas reinhardtii.
Environ. Sci. Technol. 42, 8959–8964.
Chapter 5
154
Perinotto, A. C., Caseli, L., Hayasaka, C. O., Riul, A., Oliveira, O. N., Zucolotto, V.
2008. Dendrimer-assisted immobilization of alcohol dehydrogenase in
nanostructured films for biosensing: Ethanol detection using electrical capacitance
measurements, Thin Solid Films, 516, 9002–9005.
Pichardo, S., Jos, A., Zurita, J. L., Salguero, M., Camean, A. M., Repetto, G. 2005. The
use of the fish cell lines RTG-2 and PLHC-1 to compare the toxic effects produced
by microcystins LR and RR. Toxicol. In vitro, 19, 865–873.
Posadaz, A., Sanchez, E., Gutierrez, M.I., Calderon, M., Bertolotti, S., Biasutti, M.A.,
Garcia, N.A. 2000. Riboflavin and rose Bengal sensitised photo-oxidation of
sulfathiazole and succinylsulfathiazole kinetic study and microbiological
implications. Dyes and Pigments, 45, 219–228.
Roberts, J. C., Bhalgat, M. K., Zera, R. T. 1996. Preliminary biological evaluation of
polyamidoamine (PAMAM) Starburst™ dendrimers. J. Biomed. Material Research,
30, 53-65.
Sayes, C. M., Reed, K. L., Warheit, D. B. 2007. Assessing Toxicity of Fine and
Nanoparticles: Comparing In vitro Measurements to In vivo Pulmonary Toxicity
Profiles. Toxicological Sciences, 97, 163–180.
Shieh, M. J., Peng, C. L., Lou, P. J., Chiu, C. H., Tsai, T. Y., Hsu, C. Y., Yeh, C.
Y., Lai, P. S. 2008. Non-toxic phototriggered gene transfection by PAMAM-
porphyrin conjugates. J. Control. Rel. 129, 200-206.
Stoeger, T., Takenaka, S., Frankenberger, B., Ritter, B., Karg, E., Maier, K., Schulz, H.,
Schmid O. 2009. Deducing in vivo Toxicity of Combustion-Derived Nanoparticles
from a Cell-Free Oxidative Potency Assay and Metabolic Activation of Organic
Compounds. Environmental Health Perspectives, 117, 54-60.
Chapter 5
155
Svenson, S., Tomalia, D. A. 2005. Dendrimers in biomedical applications – reflections
on the field. Adv. Drug Deliv. Rev. 57, 2106-2129
Teneva, I., Asparuhova, D., Dzhambazov, B., Mladenov, R., Schirmer, K. 2003. The
freshwater cyanobacterium Lyngbya aerugineo-coerulea produces compounds toxic
to mice and to mammalian and fish cells. Environmental Toxicology, 18, 9–20.
Teneva, I., Dzhambazov, B., Koleva, L., Mladenov, R., Schirmer, K. 2005. Toxic
potential of five freshwater Phormidium species (Cyanoprokaryota). Toxicon, 45,
711–725.
Venuganti, V. V. K., Perumal, O. P. 2008. Effect of Poly(amidoamine) (PAMAM)
dendrimer on skin permeation of 5-fluorouracil. Int. J. Pharm. 361, 230-238.
Vergun, O., Reynolds, I. J. 2005. Distinct characteristics of Ca2+ induced
depolarization of isolated brain and liver mitochondria. Biochim. Biophys. Acta.
1709, 127–137.
Xu, Y. H., Zhao, D.Y. 2005. Removal of copper from contaminated soil by use of
poly(amidoamine) dendrimers. Environ. Sci. Technol. 39, 2369-2375.
Xu, Y. H., Zhao, D. Y. 2006. Removal of lead from contaminated soils using poly
(amidoamine) dendrimers. Ind. Eng. Chem. Res. 45, 1758-1765.
Zirak, P., Penzkofer, A., Schiereis, T., Hegemann, P., Jung, A., Schlichting, I. 2005.
Absorption and fluorescence spectroscopic characterisation of BLUF domain of
AppA from Rhodobacter sphaeroides. Chemical Physics, 315, 142–154.

Chapter 6
156
Chapter 6
Genotoxicity and apoptosis of PLHC-1 Cells
upon exposure to PAMAM dendrimers
Adapted from Reactive oxygen species induced genotoxicity and apoptosis of
PLHC-1 cells upon exposure of PAMAM dendrimers. (Manuscript in preparation)
Chapter 6
157
6.1 Introduction
Eco (nano) toxicology is a relatively new area of research and, notably, in comparison
to human nanotoxicology, there is a dearth of quantitative structure activity
relationships established for nanomaterials. The study of N-isopropylacrylamide/N-tert-
butylacrylamide copolymer nanoparticles demonstrated a clear relationship between the
observed toxicity in a range of fresh water test models, representing different trophic
levels, and the physico-chemical properties of the nanoparticles (Chapter 3, Naha et al.,
2009). Similarly clear structural dependences of the responses of all trophic levels have
been observed with nano-sized PAMAM dendrimers in the same range of fresh water
ecological organisms and fish cells (Chapter 5, Naha et al., 2009). There have been
other recent reports on the ecotoxicological evaluation of various metal-based
nanomaterials (Lovern et al., 2007; Heinlaan et al., 2008; Gagńe et al., 2008; Mortimer
et al., 2008; Navarro et al., 2008; Franklin et al., 2007; Mueller and Nowack, 2008).
However, the majority of studies to date have been phenomenological and in the main
have not explored the mechanisms of interaction.
These systematically varied molecular nanostructures also present a route towards an
understanding of the dependence of the interactions with biosystems on the physico-
chemical properties of nanomaterials. As well as their potential importance in
nanomedical applications, the structurally well-defined and variable macromolecules
can also provide a further basis upon which to establish structure activity relationships
governing eco-toxicological responses which may serve to develop a fundamental
understanding of their interactions as described in chapter 5.
Oxidative stress has been established as one of the key factors determining the toxicity
of several nanomaterials (Nel et al., 2006; Lanone et al., 2006; Donaldson et al., 2006;
Obedoster et al., 2005). Free radical formation causes damage to biological components
Chapter 6
158
through oxidation of lipids, proteins and DNA damage and finally leads to apoptotic
cell death. Oxidative stress may have a role in the induction of inflammation through
up regulation of redox sensitive transcription factors, NF-κB and activator protein-1
(AP-1), and kinases involved in inflammation (Lanone et al., 2006; Rahman, 2000;
Rahman et al., 2005; Park and Park 2009). However, there is a range of reactive oxygen
species which can be generated, dependent upon the chemical nature of the toxicant.
Also different species of ROS lead to different intracellular responses. For example, the
hydroxyl radical can lead to adduct formation in the base pairs of DNA such as 8-OHdG
(8-hydroxy2’-deoxyguanosine) production, which mediates the pathophysiology of a
wide variety of diseases including cancer, atherosclerosis, neurodegenerative disorders
and the aging process (Halliwell and Gutteridge, 1999). Because of its importance, the
potential of nanoparticles to elicit such a response should be investigated.
The ecotoxicological assessment of PAMAM dendrimers was previously conducted in a
multitrophic battery of bioassays representing different trophic levels (Chapter 5).
Within the battery, the PLHC-1 fish cell line, derived from a hepatocellular carcinoma
in an adult female topminnow (Poeciliopsis lucida), was seen to be the second most
sensitive bioassay and a clear and systematic dependence of the toxic response on the
dendrimer generation was observed. In this chapter, the mechanism of the toxicity
pathway of PAMAM dendrimers is explored in the PLHC-1 fish cell line. Analysis of
the generation of reactive oxygen species, DNA damage and apoptosis was performed
to understand the cell death process. The PLHC-1 cell line represents vertebrate models,
in accordance with the EU policy of Reduction, Replacement and Refinement (RRR),
(Directive 86/609/EEC on the protection of animals used for experimental and scientific
purposes).
Chapter 6
159
6.2 Experimental methods
All the experimental methods employed are described in chapter 2. The protocols for
intracellular reactive oxygen species (ROS) detection and quantification in PLHC-1
cells is described in section 2.2.2.9. The genotoxic response of PLHC-1 cells exposed to
PAMAM dendrimers was detected by the alkaline comet assay described in section
2.2.2.12. The procedure for DNA extraction after exposure to PAMAM dendrimers is
outlined in section 2.2.2.11.1. The 8-OHdG assay was carried out by ELISA as
described in section 2.2.2.11.2 and the apoptosis assay is described in section 2.2.2.13
of chapter 2.
6.3 Results
6.3.1 Particle characterization and Cytotoxicity
Particle characterisation (particle size, zeta potential, spectroscopic studies) and the
cytotoxicity data were provided in chapter 5. Due to the observed relatively higher
sensitivity of the PLHC-1 cells, the mechanistic pathways are explored in PLHC-1 cells.
6.3.2 Intracellular reactive oxygen species (ROS)
Quantitative measurement of the intracellular ROS generation in PLHC-1 cells was
performed at different time points (1h, 2h, 4h, 6h and 12h) and with different exposure
concentrations of each dendrimer (G4, G5 and G6). For all generations, the exposure
time points and the concentration of PAMAM dendrimer (0.15 µM to 6 µM) used were
the same, in order to correlate intracellular ROS production by the three generations of
PAMAM dendrimers and also to enable comparison with the cytotoxic and genotoxic
responses, as well as apoptosis and cell death. Intracellular ROS generation in PLHC-1
cells upon the exposure to PAMAM dendrimers was visualised using confocal
Chapter 6
160
fluorescence microscopy, as shown in figure 6.1, for the case of 2 h exposure of each
dendrimer at a concentration of 2 µM (G4, G5 and G6) and 400 µM for H2O2. The
confocal images were taken using a 63x oil immersion objective lens. It should be noted
that the regions of white coloration are present in the control samples and therefore are
not the due to nanoparticles, but may be due to the reflection of the white light. The
concentration dependent increase in ROS production for the five different time points
for the three dendrimer generations was monitored using the fluorescence plate reader
and the results are shown in figure 6.2. Intracellular ROS production was found to be
dendrimer generation and time dependent (Figure 6.3). A significant generation
dependent ROS production G6 > G5 > G4 was observed at 1, 2, and 12 h exposure time
period (p ≤ 0.05) as illustrated in figure 6.3.

Chapter 6
161
Figure 6.4A describes the relationship between the intracellular ROS production and the
primary surface amino group of the PAMAM dendrimer for a fixed concentration of 0.6
µM at 2 h exposure time period. Similar to the case of the cytotoxic response, the
A
B
C
D
E
Fig
ure
6.1
Con
foca
l la
ser
scan
ning
mic
rogr
aph
(CL
SM
) of
PL
HC
-1 c
ells
sho
win
g in
trac
ellu
lar
RO
S
prod
ucti
on u
pon
expo
sure
of
PA
MA
M d
endr
imer
s to
the
PL
HC
-1 c
ells
at
2 h
expo
sure
tim
e pe
riod
.
Fig
ure
A, B
, C,
D a
nd E
rep
rese
nt t
he N
egat
ive
cont
rol,
H2O
2, P
AM
AM
G4,
G5
and
G6
resp
ecti
vely
at
2
µM
con
cent
rati
on f
or t
he
case
of
PA
MA
M a
nd 4
00
µM
H2O
2. M
agni
fica
tion
is
at 6
3x.
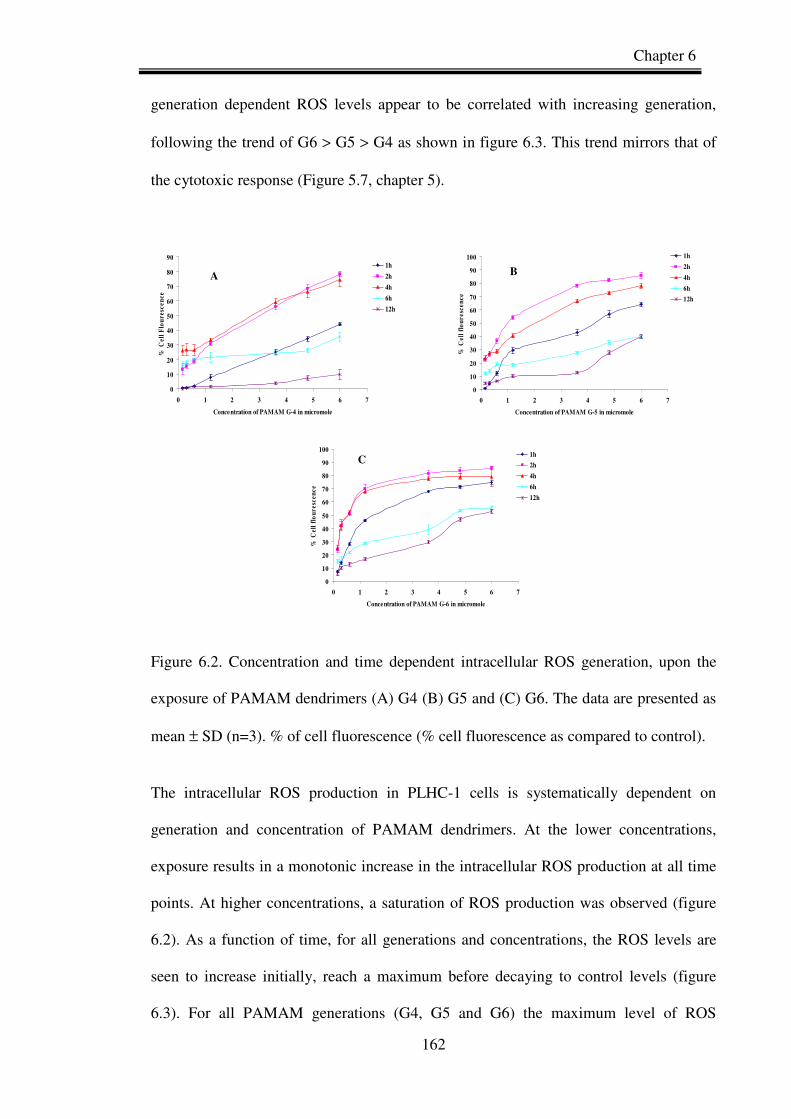
Chapter 6
162
generation dependent ROS levels appear to be correlated with increasing generation,
following the trend of G6 > G5 > G4 as shown in figure 6.3. This trend mirrors that of
the cytotoxic response (Figure 5.7, chapter 5).
Figure 6.2. Concentration and time dependent intracellular ROS generation, upon the
exposure of PAMAM dendrimers (A) G4 (B) G5 and (C) G6. The data are presented as
mean ± SD (n=3). % of cell fluorescence (% cell fluorescence as compared to control).
The intracellular ROS production in PLHC-1 cells is systematically dependent on
generation and concentration of PAMAM dendrimers. At the lower concentrations,
exposure results in a monotonic increase in the intracellular ROS production at all time
points. At higher concentrations, a saturation of ROS production was observed (figure
6.2). As a function of time, for all generations and concentrations, the ROS levels are
seen to increase initially, reach a maximum before decaying to control levels (figure
6.3). For all PAMAM generations (G4, G5 and G6) the maximum level of ROS
0
10
20
30
40
50
60
70
80
90
0 1 2 3 4 5 6 7
Concentration of PAMAM G-4 in micromole
% C
ell
Flo
ure
scen
ce
1h
2h
4h
6h
12h
0
10
20
30
40
50
60
70
80
90
100
0 1 2 3 4 5 6 7
Concentration of PAMAM G-5 in micromole
% C
ell
flo
ure
scen
ce
1h
2h
4h
6h
12h
0
10
20
30
40
50
60
70
80
90
100
0 1 2 3 4 5 6 7
Concentration of PAMAM G-6 in micromole
% C
ell
flo
ure
scen
ce
1h
2h
4h
6h
12h
A B
C

Chapter 6
163
production is approximately 90% and this maximum level is reached after ~2h for G5
and G6, while for the case of G4, the maximum level is reached at ~ 4h. The generation
of ROS is counteracted by the natural intracellular antioxidants which act to minimize
the oxidative stress (Sies, 1993). In general, the time evolution of the ROS is not very
well understood, but similar behaviour has been observed in other studies (Mukherjee et
al.,2010)
0
10
20
30
40
50
60
1h 2h 4h 6h 12h
Time in hour
% C
ell
Flo
ure
scen
ce
G-4
G-5
G-6
*
*
*
Figure 6.3. Plot showing the generation dependent intracellular ROS production at a
concentration of 0.6µM. *Denotes significant difference of ROS production between
G4, G5 and G6 in all the exposure time period 1, 2, and 12 h (p ≤ 0.05).
Notably, however, when the concentration is expressed in terms of effective number of
amino groups (molar dose x number of amino groups per dendrimer), the ROS
generation curves for a fixed time point overlap almost exactly, as shown in Figure
6.4(B).
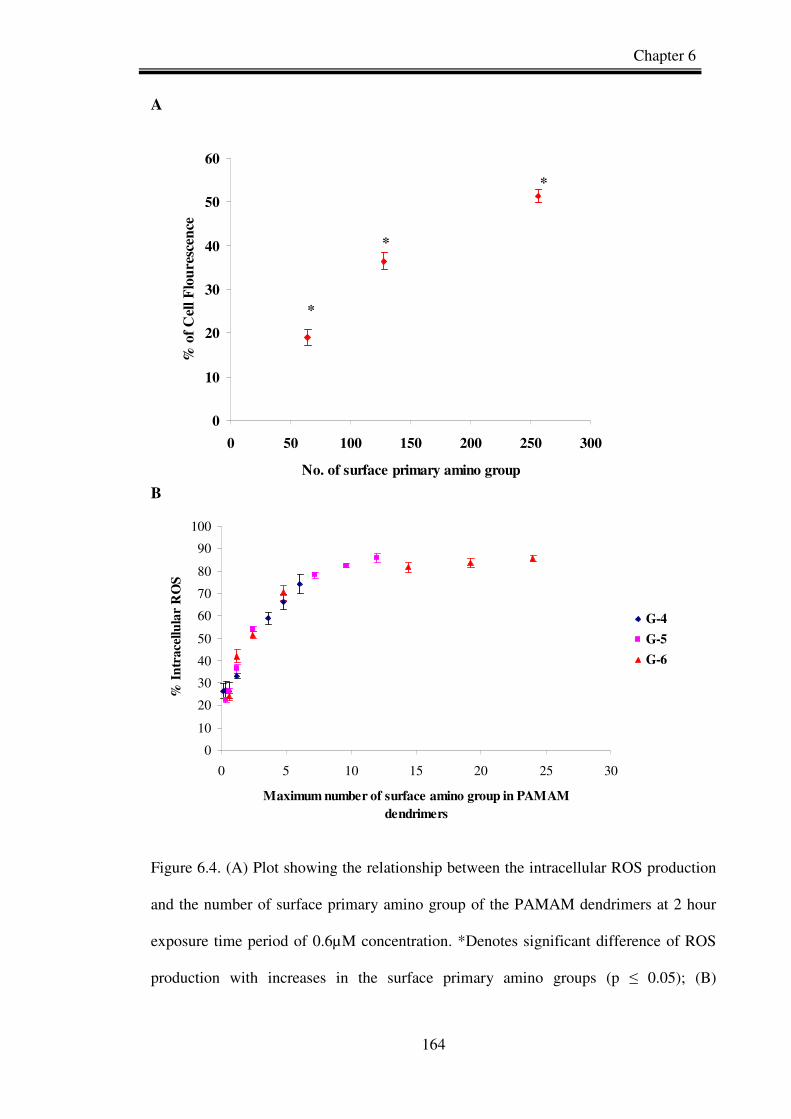
Chapter 6
164
A
B
0
10
20
30
40
50
60
0 50 100 150 200 250 300
No. of surface primary amino group
% o
f C
ell
Flo
ure
scen
ce
*
*
*
0
10
20
30
40
50
60
70
80
90
100
0 5 10 15 20 25 30
Maximum number of surface amino group in PAMAM
dendrimers
% I
ntr
acel
lula
r R
OS
G-4
G-5
G-6
Figure 6.4. (A) Plot showing the relationship between the intracellular ROS production
and the number of surface primary amino group of the PAMAM dendrimers at 2 hour
exposure time period of 0.6µM concentration. *Denotes significant difference of ROS
production with increases in the surface primary amino groups (p ≤ 0.05); (B)

Chapter 6
165
relationship between maximum surface amino group and the intracellular ROS
production in PLHC-1 cells.
6.3.3 Genotoxicity response of PAMAM dendrimers
The genotoxicity of the PAMAM dendrimers was evaluated in PLHC-1 cells at a
concentration range from 0.125 µM to 1 µM for the cases of G4, G5 and G6, for
different exposure times (6h, 12h and 24h). For all dendrimer generations, the
concentration range is one of approximately linear increase in levels of ROS (figure
6.2). DNA damage was estimated by analyzing the tail percentage DNA in the Comet
assay. Representative micrographs of observed comets are shown in figure 6.5, after 24
hour exposure to PAMAM dendrimers at a concentration of 0.5 µM. A dose dependent
genotoxicity response was observed in all three generations of PAMAM dendrimers in
PLHC-1 cells (Figure 6.6). Significant genotoxicity response was observed in PLHC-1
cells as compared to control group (p ≤ 0.05) after exposure of PAMAM dendrimers.
Also a generation dependent level of DNA damage was observed with the PAMAM
dendrimers (Figure 6.7). Significant generation dependent (p ≤ 0.05) genotoxicity
response was observed at 24 hour exposure time period. However, after 6 and 12 h
exposure, a significant difference of genotoxicity response between G4, G6, and
between G5, G6 (p ≤ 0.05) is observed at a concentration of 0.5 µM (Figure 6.7).
The toxic responses of all organisms studied are well correlated with the physico-
chemical characteristic of the PAMAM dendrimers (Chapter 5, Naha et al., 2009), and
here the same is observed for the generation of intracellular ROS and the genotoxic
response in PLHC-1 cells, indicating that the paradigm of oxidative stress as the source
of the toxic mechanism of nanoparticles, outlined by Nel et al., 2006, is applicable for
PAMAM dendrimers. Notably, both the oxidative stress and the genotoxic response are

Chapter 6
166
correlated with the number of surface amino groups per dendrimer as shown in shown
in figure 6.4A and 6.8.

Chapter 6
167
Figure 6.5. Representative micrographs showing comets of PLHC-1 cells after 24 hour
exposure of PAMAM dendrimers. Panel A represents control, Panel B, Represents ENU
(Ethyl nitrosourea), Panels C, D and E represent G4, G5 and G6 respectively.
A B
D C
E

Chapter 6
168
Figure 6.6. Genotoxicity response of PAMAM dendrimers at 6h, 12h and 24h exposure,
Panels A, B and C represent PAMAM G4, G5 and G6 respectively. *Denotes
significant difference genotoxicity response as compared to control group (p ≤ 0.05).
0
5
10
15
20
25
30
35
40
45
Control 0.125 0.25 0.5 0.75 1
Concentration of PAMAM dendrimer G-4 in µµµµM
% T
ail
DN
A6h
12h
24h
* *
*
*
*
*
*
*
*
0
10
20
30
40
50
60
70
Control 0.125 0.25 0.5 0.75 1
Concentration of PAMAM dendrimer G-5 in µµµµM
% T
ail D
NA
6h
12h
24h
**
*
*
*
*
*
*
*
*
0
10
20
30
40
50
60
70
80
90
Control 0.125 0.25 0.5 0.75 1
Concentration of PAMAM dendrimer G-6 in µµµµM
% T
ail
DN
A
6h
12h
24h
*
*
*
*
**
*
*
*
*
*
*
*
A
C
B
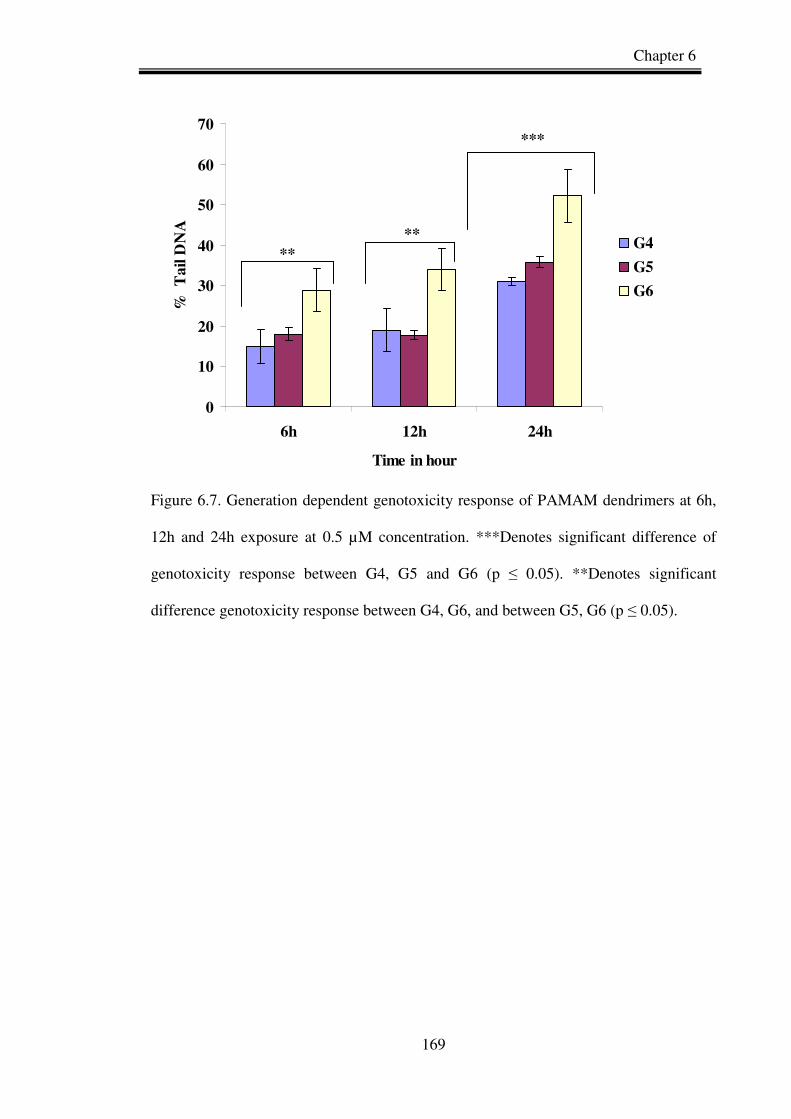
Chapter 6
169
0
10
20
30
40
50
60
70
6h 12h 24h
Time in hour
%
Ta
il D
NA
G4
G5
G6
***
**
**
Figure 6.7. Generation dependent genotoxicity response of PAMAM dendrimers at 6h,
12h and 24h exposure at 0.5 µM concentration. ***Denotes significant difference of
genotoxicity response between G4, G5 and G6 (p ≤ 0.05). **Denotes significant
difference genotoxicity response between G4, G6, and between G5, G6 (p ≤ 0.05).

Chapter 6
170
0
10
20
30
40
50
60
70
0 50 100 150 200 250 300
Number of primary surface amino groups
% T
ail
DN
A
Figure 6.8. Relationship between the % Tail DNA and number of primary surface
amino groups of the PAMAM dendrimers (Data shown 24 h exposure at 0.5 µM
concentration. Data showed mean ± SD.
6.3.4 8-OHdG assay
Oxidative damage to DNA in cells by ROS is a well reported process (Zhang et al.,
2009). The level of 8-OHdG (8-hydroxy2’-deoxyguanosine) production was measured
by a competitive in vitro enzyme-linked immunosorbant assay for quantitative
measurement of the oxidative DNA adduct 8-hydroxy-2’-deoxyguanosine. The levels of
8-OHdG production in the PLHC-1 cells to the PAMAM dendrimers are presented in
Table 6.1. As the genotoxicity and intracellular ROS study was investigated in the
PLHC-1 cells and at 0.5 µM significant genotoxicity and intracellular ROS response

Chapter 6
171
was observed, this cell line and the same concentration was used for the detection of 8-
OHdG formation. The exposure concentration is 0.5 µM of G4, G5 and G6, each at 6h,
12h and 24h time periods. Notably there is no significant difference between the control
group and the PAMAM exposure group. However, there is a significant difference in
the level of 8-OHdG production upon exposure to the positive control, H2O2 (Shown in
table 6.1). Increased levels of 8-OHdG production upon the exposure to PAMAM
dendrimers were not detectable over the entire exposure time period. Although a
significant degree of DNA damage has been observed as compared to the control group
(p ≤ 0.05) at lower concentrations of 0.125 µM, 0.25 µM and 0.5 µM after 24h exposure
(figure 6.6) , no 8-OHdG formation was observed at a concentration of 0.5 µM at the
same time of exposure. The results suggests that 8-OHdG is not produced upon the
exposure of PAMAM dendrimers in PLHC-1 cells, which is a positive outcome given
the potential pathophysiological importance, although significant genotoxic response
has been observed at the same concentration (0.5µM) in PLHC-1 cells.
Table 6.1. Levels of 8-OHdG formation in the PLHC-1 cells to PAMAM dendrimers
exposure.
6h 8-OHdG level in ng/ml
12h 8-OHdG level in
ng/ml
24h 8-OHdG level
in ng/ml Control < 0.125 < 0.125 < 0.125
H202 0.573 ± 0.29 2.895 ± 0.32 15.704 ± 0.275 G4 < 0.125 < 0.125 <0 .125 G5 <0 .125 < 0.125 < 0.125 G6 < 0.125 <0 .125 <0 .125
6.3.5 Apoptosis Assay
The apoptosis study performed with PLHC-1 cells exposed to PAMAM G4, G5 and G6
dendrimers suggests that, with increasing concentration, the percentage of healthy cells

Chapter 6
172
decreases, whereas the early apoptotic, late apoptotic and dead cell populations increase,
as shown in Tables 6.2, 6.3 and 6.4 for 6h, 12h and 24h exposure respectively. After 6
hour exposure, a significant early apoptotic cell population was observed as compared
to control groups. A significant difference (p<0.05) of early apoptotic cell population at
exposure concentrations of 0.6 and 1.2 µM in the case of G6 and 2 µM in the case of G5
as compared to control has been observed. However, a significant (p<0.05) late
apoptotic cell population was observed at all the exposure concentrations except 0.65
µM of G4 after 6h exposure (Table 6.2). After 12 hour exposure of PAMAM
dendrimers, significant (p<0.05) early and late apoptotic cell populations were observed
in PLHC-1 cells except at 0.65 µM concentration of G4, as compared to control (Table
6.3). However, after 24 hour exposure, all the exposure concentrations of PAMAM
dendrimer (G4, G5 and G6) employed show significant (p<0.05) early and late
apoptotic cell populations, as compared with the control group (Table 6.4). No
significant difference between response to the G4, G5 and G6 PAMAM dendrimers was
observed at 6 and 12 h (figure 6.9 A and B), although a significant difference (p<0.05)
in early and late apoptotic cell populations was observed between G4 and G6 at 24 hour
exposure (figure 6.9 C). Furthermore, a significant difference (p<0.05) is observed
between the late apoptotic cell population after 24 hour exposure to G5 and G6
dendrimers (figure 6.9 C).
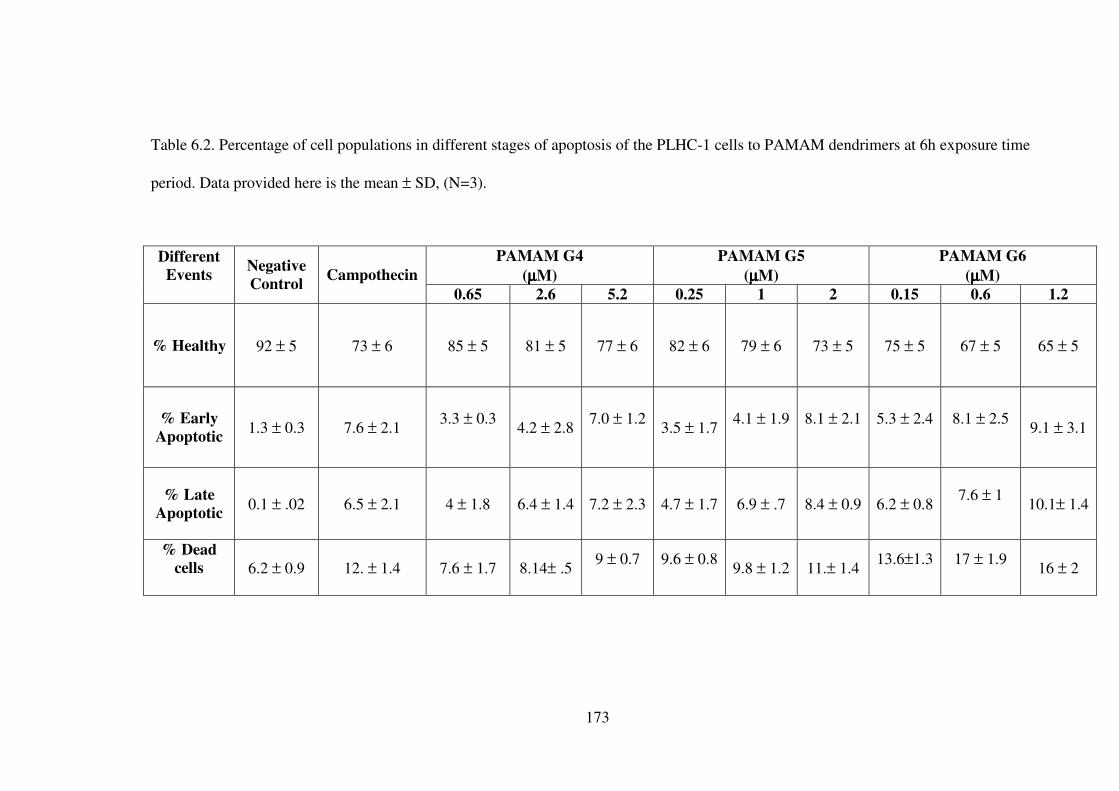
173
Table 6.2. Percentage of cell populations in different stages of apoptosis of the PLHC-1 cells to PAMAM dendrimers at 6h exposure time
period. Data provided here is the mean ± SD, (N=3).
PAMAM G4
(µµµµM) PAMAM G5
(µµµµM) PAMAM G6
(µµµµM) Different Events
Negative Control
Campothecin 0.65 2.6 5.2 0.25 1 2 0.15 0.6 1.2
% Healthy 92 ± 5 73 ± 6 85 ± 5 81 ± 5 77 ± 6 82 ± 6 79 ± 6 73 ± 5 75 ± 5 67 ± 5 65 ± 5
% Early Apoptotic
1.3 ± 0.3 7.6 ± 2.1 3.3 ± 0.3
4.2 ± 2.8
7.0 ± 1.2
3.5 ± 1.7 4.1 ± 1.9
8.1 ± 2.1
5.3 ± 2.4
8.1 ± 2.5
9.1 ± 3.1
% Late Apoptotic
0.1 ± .02 6.5 ± 2.1 4 ± 1.8 6.4 ± 1.4 7.2 ± 2.3 4.7 ± 1.7 6.9 ± .7 8.4 ± 0.9 6.2 ± 0.8 7.6 ± 1
10.1± 1.4
% Dead cells
6.2 ± 0.9 12. ± 1.4 7.6 ± 1.7 8.14± .5
9 ± 0.7
9.6 ± 0.8
9.8 ± 1.2 11.± 1.4 13.6±1.3
17 ± 1.9
16 ± 2
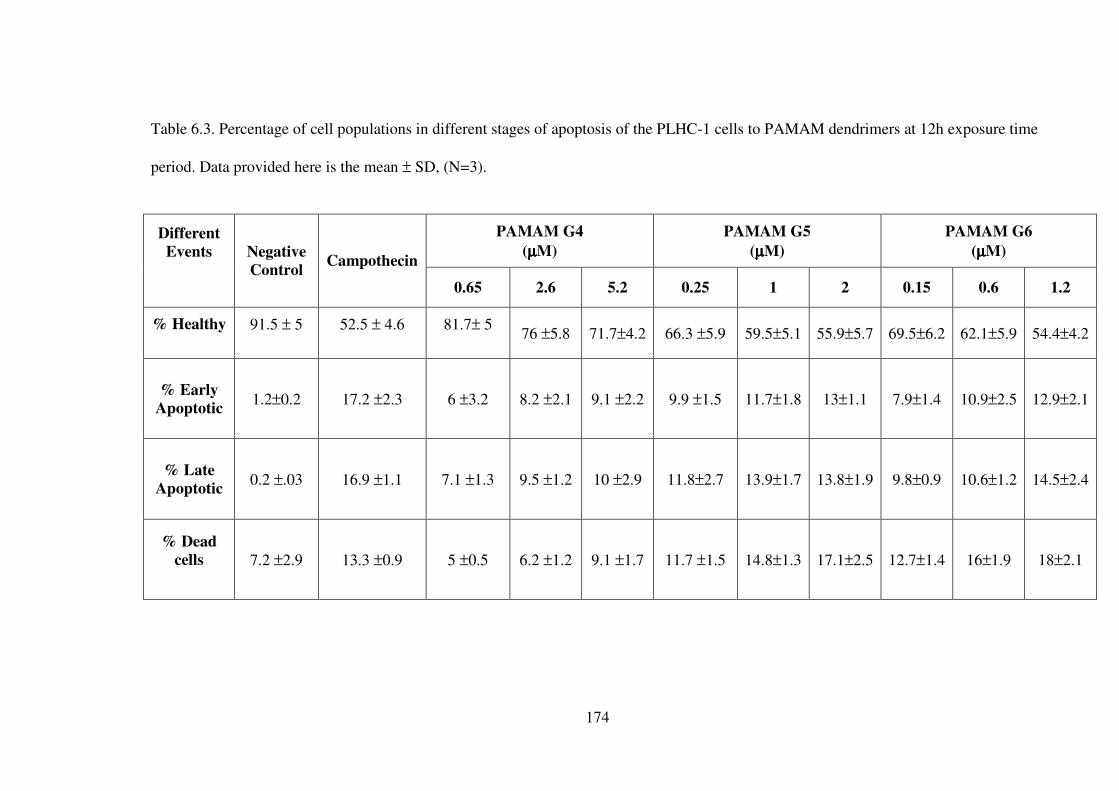
174
Table 6.3. Percentage of cell populations in different stages of apoptosis of the PLHC-1 cells to PAMAM dendrimers at 12h exposure time
period. Data provided here is the mean ± SD, (N=3).
PAMAM G4 (µµµµM)
PAMAM G5 (µµµµM)
PAMAM G6 (µµµµM)
Different Events
Negative Control
Campothecin
0.65 2.6 5.2 0.25 1 2 0.15 0.6 1.2
% Healthy
91.5 ± 5
52.5 ± 4.6
81.7± 5
76 ±5.8 71.7±4.2 66.3 ±5.9 59.5±5.1 55.9±5.7 69.5±6.2 62.1±5.9 54.4±4.2
% Early Apoptotic
1.2±0.2 17.2 ±2.3 6 ±3.2 8.2 ±2.1 9.1 ±2.2 9.9 ±1.5 11.7±1.8 13±1.1 7.9±1.4 10.9±2.5 12.9±2.1
% Late Apoptotic
0.2 ±.03 16.9 ±1.1 7.1 ±1.3 9.5 ±1.2 10 ±2.9 11.8±2.7 13.9±1.7 13.8±1.9 9.8±0.9 10.6±1.2 14.5±2.4
% Dead cells
7.2 ±2.9 13.3 ±0.9 5 ±0.5 6.2 ±1.2 9.1 ±1.7 11.7 ±1.5 14.8±1.3 17.1±2.5 12.7±1.4 16±1.9 18±2.1
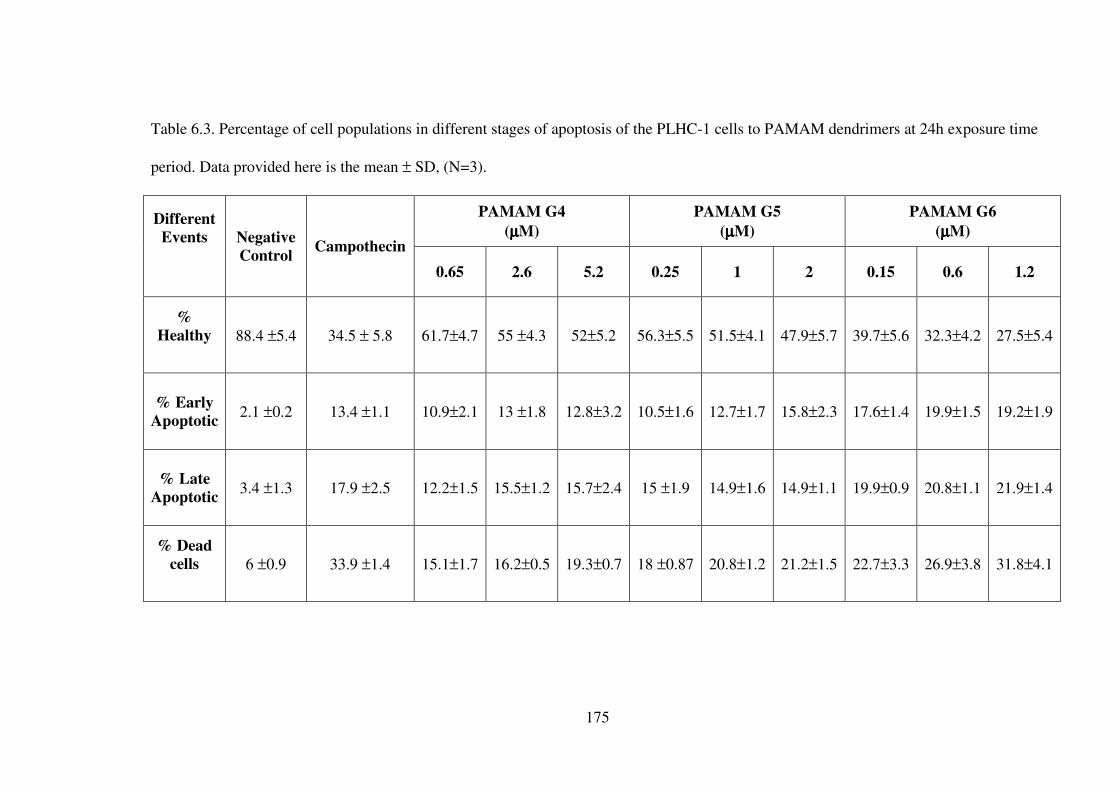
175
Table 6.3. Percentage of cell populations in different stages of apoptosis of the PLHC-1 cells to PAMAM dendrimers at 24h exposure time
period. Data provided here is the mean ± SD, (N=3).
PAMAM G4 (µµµµM)
PAMAM G5 (µµµµM)
PAMAM G6 (µµµµM)
Different Events
Negative Control
Campothecin
0.65 2.6 5.2 0.25 1 2 0.15 0.6 1.2
% Healthy
88.4 ±5.4 34.5 ± 5.8 61.7±4.7 55 ±4.3 52±5.2 56.3±5.5 51.5±4.1 47.9±5.7 39.7±5.6 32.3±4.2 27.5±5.4
% Early Apoptotic
2.1 ±0.2 13.4 ±1.1 10.9±2.1 13 ±1.8 12.8±3.2 10.5±1.6 12.7±1.7 15.8±2.3 17.6±1.4 19.9±1.5 19.2±1.9
% Late Apoptotic
3.4 ±1.3 17.9 ±2.5 12.2±1.5 15.5±1.2 15.7±2.4 15 ±1.9 14.9±1.6 14.9±1.1 19.9±0.9 20.8±1.1 21.9±1.4
% Dead cells
6 ±0.9 33.9 ±1.4 15.1±1.7 16.2±0.5 19.3±0.7 18 ±0.87 20.8±1.2 21.2±1.5 22.7±3.3 26.9±3.8 31.8±4.1
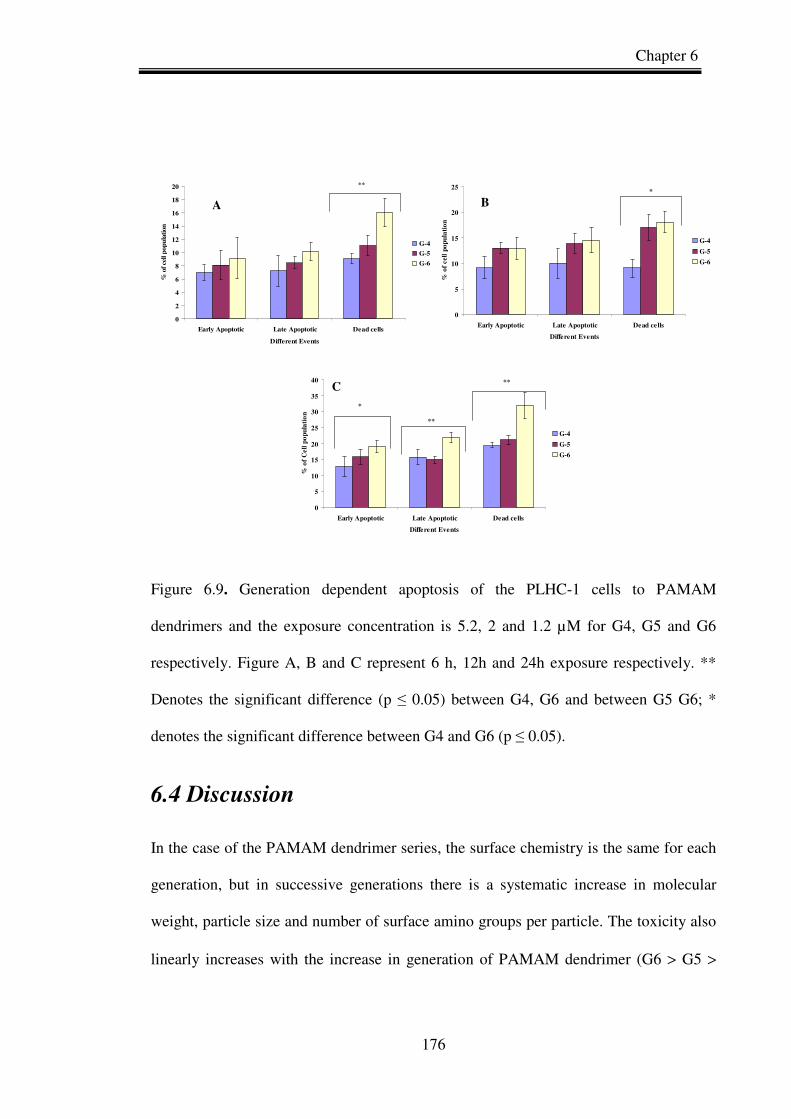
Chapter 6
176
Figure 6.9. Generation dependent apoptosis of the PLHC-1 cells to PAMAM
dendrimers and the exposure concentration is 5.2, 2 and 1.2 µM for G4, G5 and G6
respectively. Figure A, B and C represent 6 h, 12h and 24h exposure respectively. **
Denotes the significant difference (p ≤ 0.05) between G4, G6 and between G5 G6; *
denotes the significant difference between G4 and G6 (p ≤ 0.05).
6.4 Discussion
In the case of the PAMAM dendrimer series, the surface chemistry is the same for each
generation, but in successive generations there is a systematic increase in molecular
weight, particle size and number of surface amino groups per particle. The toxicity also
linearly increases with the increase in generation of PAMAM dendrimer (G6 > G5 >
0
2
4
6
8
10
12
14
16
18
20
Early Apoptotic Late Apoptotic Dead cells
Different Events
% o
f ce
ll p
op
ula
tion
G-4
G-5
G-6
**
0
5
10
15
20
25
Early Apoptotic Late Apoptotic Dead cells
Different Events
% o
f ce
ll p
op
ula
tio
n
G-4
G-5
G-6
*
0
5
10
15
20
25
30
35
40
Early Apoptotic Late Apoptotic Dead cells
Different Events
% o
f C
ell
po
pu
lati
on
G-4
G-5
G-6
*
**
**
A
C
B
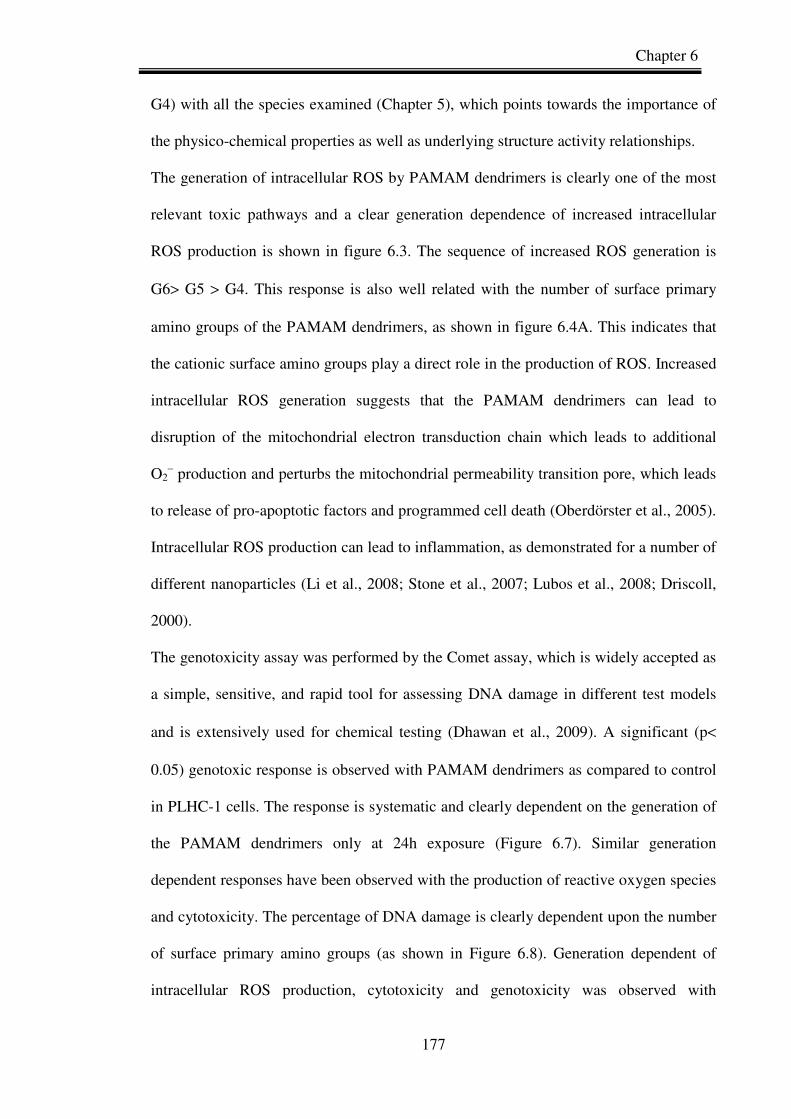
Chapter 6
177
G4) with all the species examined (Chapter 5), which points towards the importance of
the physico-chemical properties as well as underlying structure activity relationships.
The generation of intracellular ROS by PAMAM dendrimers is clearly one of the most
relevant toxic pathways and a clear generation dependence of increased intracellular
ROS production is shown in figure 6.3. The sequence of increased ROS generation is
G6> G5 > G4. This response is also well related with the number of surface primary
amino groups of the PAMAM dendrimers, as shown in figure 6.4A. This indicates that
the cationic surface amino groups play a direct role in the production of ROS. Increased
intracellular ROS generation suggests that the PAMAM dendrimers can lead to
disruption of the mitochondrial electron transduction chain which leads to additional
O2– production and perturbs the mitochondrial permeability transition pore, which leads
to release of pro-apoptotic factors and programmed cell death (Oberdörster et al., 2005).
Intracellular ROS production can lead to inflammation, as demonstrated for a number of
different nanoparticles (Li et al., 2008; Stone et al., 2007; Lubos et al., 2008; Driscoll,
2000).
The genotoxicity assay was performed by the Comet assay, which is widely accepted as
a simple, sensitive, and rapid tool for assessing DNA damage in different test models
and is extensively used for chemical testing (Dhawan et al., 2009). A significant (p<
0.05) genotoxic response is observed with PAMAM dendrimers as compared to control
in PLHC-1 cells. The response is systematic and clearly dependent on the generation of
the PAMAM dendrimers only at 24h exposure (Figure 6.7). Similar generation
dependent responses have been observed with the production of reactive oxygen species
and cytotoxicity. The percentage of DNA damage is clearly dependent upon the number
of surface primary amino groups (as shown in Figure 6.8). Generation dependent of
intracellular ROS production, cytotoxicity and genotoxicity was observed with
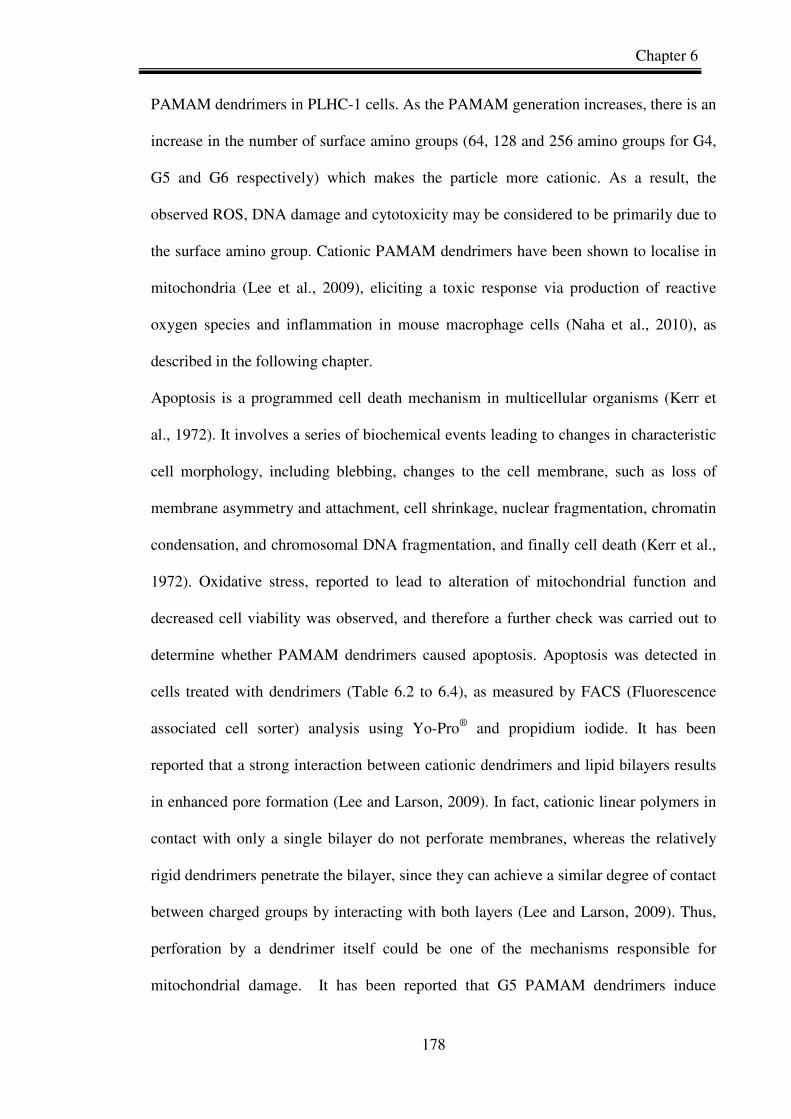
Chapter 6
178
PAMAM dendrimers in PLHC-1 cells. As the PAMAM generation increases, there is an
increase in the number of surface amino groups (64, 128 and 256 amino groups for G4,
G5 and G6 respectively) which makes the particle more cationic. As a result, the
observed ROS, DNA damage and cytotoxicity may be considered to be primarily due to
the surface amino group. Cationic PAMAM dendrimers have been shown to localise in
mitochondria (Lee et al., 2009), eliciting a toxic response via production of reactive
oxygen species and inflammation in mouse macrophage cells (Naha et al., 2010), as
described in the following chapter.
Apoptosis is a programmed cell death mechanism in multicellular organisms (Kerr et
al., 1972). It involves a series of biochemical events leading to changes in characteristic
cell morphology, including blebbing, changes to the cell membrane, such as loss of
membrane asymmetry and attachment, cell shrinkage, nuclear fragmentation, chromatin
condensation, and chromosomal DNA fragmentation, and finally cell death (Kerr et al.,
1972). Oxidative stress, reported to lead to alteration of mitochondrial function and
decreased cell viability was observed, and therefore a further check was carried out to
determine whether PAMAM dendrimers caused apoptosis. Apoptosis was detected in
cells treated with dendrimers (Table 6.2 to 6.4), as measured by FACS (Fluorescence
associated cell sorter) analysis using Yo-Pro® and propidium iodide. It has been
reported that a strong interaction between cationic dendrimers and lipid bilayers results
in enhanced pore formation (Lee and Larson, 2009). In fact, cationic linear polymers in
contact with only a single bilayer do not perforate membranes, whereas the relatively
rigid dendrimers penetrate the bilayer, since they can achieve a similar degree of contact
between charged groups by interacting with both layers (Lee and Larson, 2009). Thus,
perforation by a dendrimer itself could be one of the mechanisms responsible for
mitochondrial damage. It has been reported that G5 PAMAM dendrimers induce

Chapter 6
179
expression of caspases 3, 9, and Bax proteins and decreased Bcl-2 expression which is
an indication of apoptosis (Lee et al., 2009). The results presented here agree with the
published literature. However after 24 hour exposure, all the exposure concentration of
PAMAM dendrimer (G4, G5 and G6) employed shows significant (p<0.05) early and
late apoptotic cell populations as compared with control group (Table 6.4). It has been
observed that no significant difference of early and late apoptotic cell populations
between the G4, G5 and G6 PAMAM dendrimers at 6 and 12 h (figure 6.9 A and B),
however a significant difference (p<0.05). However, there was a significant difference
of early and late apoptotic cell population was observed between G4 and G6 at 24 hour
exposure time period (figure 6.9 C).
0
10
20
30
40
50
60
70
80
0 20 40 60 80 100
% of intracellular ROS
% T
ail
DN
A
G-4
G-5
G-6
Figure 6.10. Relation between maximum DNA damage and maximum intracellular
ROS production upon the exposure of PAMAM dendrimers G4, G5 and G6. (DNA
damage 24h and ROS 2h Data).
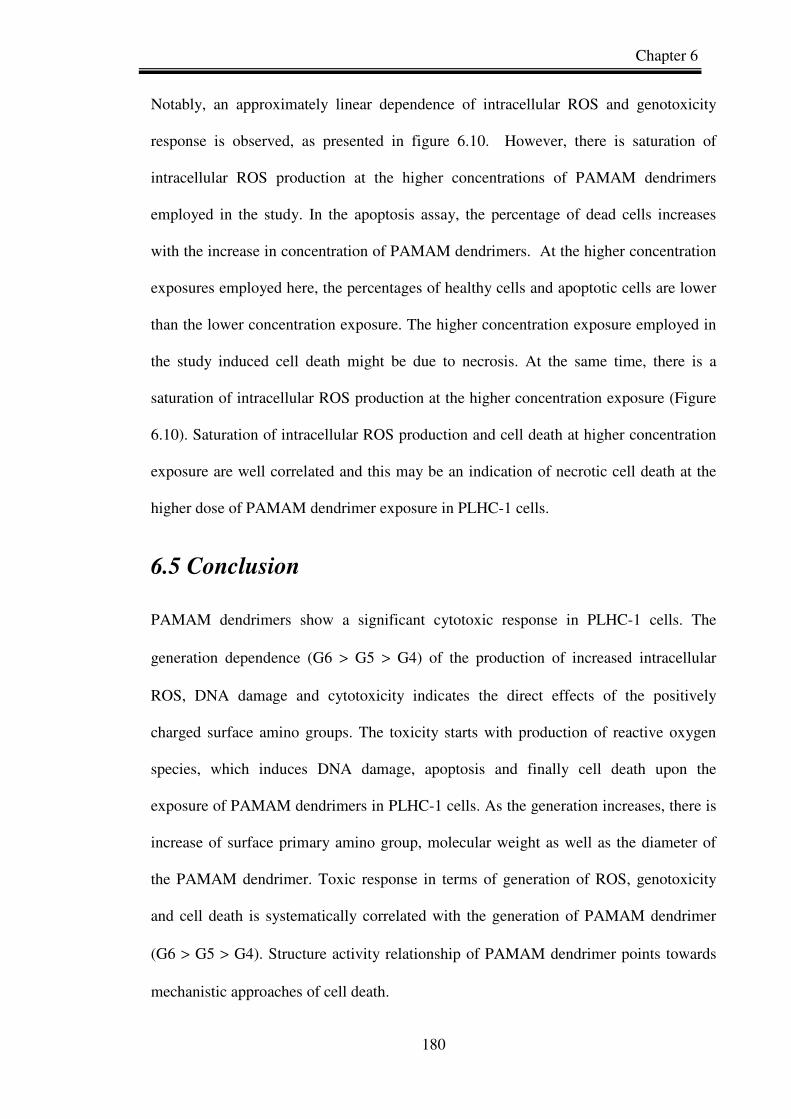
Chapter 6
180
Notably, an approximately linear dependence of intracellular ROS and genotoxicity
response is observed, as presented in figure 6.10. However, there is saturation of
intracellular ROS production at the higher concentrations of PAMAM dendrimers
employed in the study. In the apoptosis assay, the percentage of dead cells increases
with the increase in concentration of PAMAM dendrimers. At the higher concentration
exposures employed here, the percentages of healthy cells and apoptotic cells are lower
than the lower concentration exposure. The higher concentration exposure employed in
the study induced cell death might be due to necrosis. At the same time, there is a
saturation of intracellular ROS production at the higher concentration exposure (Figure
6.10). Saturation of intracellular ROS production and cell death at higher concentration
exposure are well correlated and this may be an indication of necrotic cell death at the
higher dose of PAMAM dendrimer exposure in PLHC-1 cells.
6.5 Conclusion
PAMAM dendrimers show a significant cytotoxic response in PLHC-1 cells. The
generation dependence (G6 > G5 > G4) of the production of increased intracellular
ROS, DNA damage and cytotoxicity indicates the direct effects of the positively
charged surface amino groups. The toxicity starts with production of reactive oxygen
species, which induces DNA damage, apoptosis and finally cell death upon the
exposure of PAMAM dendrimers in PLHC-1 cells. As the generation increases, there is
increase of surface primary amino group, molecular weight as well as the diameter of
the PAMAM dendrimer. Toxic response in terms of generation of ROS, genotoxicity
and cell death is systematically correlated with the generation of PAMAM dendrimer
(G6 > G5 > G4). Structure activity relationship of PAMAM dendrimer points towards
mechanistic approaches of cell death.

Chapter 6
181
References
Chandrasekhar, D., Sistla, R., Ahmad, F. J., Khar, R. K., Diwan, P. V. 2007. The
development of folate-PAMAM dendrimer conjugates for targeted delivery of anti-
arthritic drugs and their pharmacokinetics and biodistribution in arthritic rats.
Biomaterial, 28, 504-512.
Dhawan, A., Bajpayee, M., Parmar, D.2009. Comet assay: a reliable tool for the
assessment of DNA damage in different models. Cell Biol Toxicol. 25, 5-32.
Donaldson, K., Aitken, R., Tran, L., Stone, V., Duffin, R., Forrest, G., Alexaner, A.
2006. Carbon nanotubes: a review of their properties in relation to pulmonary
toxicology and work place safety. Toxicol. Sci. 92, 5-22.
Donaldson, K., Tran, L., Jimenez, L.A., Duffin, R., Newby, D.E., Mills, N., MacNee,
W., Stone, V. 2005. Combustion-derived nanoparticles: a review of their toxicology
following inhalation exposure. Part Fibre Toxicol. 2, 10.
Driscoll K.E. 2000. TNF-α and MIP-2: role in particle induced inflammation and
regulation by oxidative stress. Toxicol Lett. 112-113, 177-184.
Franklin, N. M., Rogers, N. J., Apte, S. C., Batley, G. E., Gadd,G. E., Casey, P.S. 2007.
Comparative Toxicity of Nanoparticulate ZnO, Bulk ZnO, and ZnCl2 to a
Freshwater Microalga (Pseudokirchneriella subcapitata): The Importance of Particle
Solubility. Environ. Sci. Technol. 41, 8484–8490.
Gagńe, F., Auclair, J., Turcotte, P., Fournier, M., Gagnon, C., Sauve, S., Blaise, C.
2008. Ecotoxicity of CdTe quantum dots to fresh water mussels: Impacts on
immune system, oxidative stress and genotoxicity. Aquat. Toxicol. 86, 333-340.
Heinlaan, M., Ivask, A., Blinova, I., Dubourguier, H. C., Kahru, A. 2008. Toxicity of
nanosized and bulk ZnO, CuO and TiO2 to bacteria Vibrio fischeri and crustaceans
Daphnia magna and Thamnocephalus platyurus. Chemosphere, 71, 1308-1316.

Chapter 6
182
http://probes.invitrogen.com/media/pis/mp13243
Kerr, J.F., Wyllie, A.H., Currie, A.R. 1972. Apoptosis: a basic biological phenomenon
with wide-ranging implications in tissue kinetics. Br. J. Cancer 26, 239–257.
Lanone, S., Boczkowski, J. 2006. Biomedical Applications and Potential Health Risks
of Nanomaterials: Molecular Mechanisms. Curr Mol Med. 6, 651-63.
Lee, H., Larson, R.G., 2009. Multiscale modeling of dendrimers and their interactions
with bilayers and polyelectrolytes. Molecules 19, 423–438.
Lee, J.H., Cha, K.E., Kim, M.S., Hong, H.W., Chung, D.J., Ryu, G., Myung, H. 2009.
Nanosized polyamidoamine (PAMAM) dendrimer-induced apoptosis mediated by
mitochondrial dysfunction. Toxicol Lett. 190, 202–207.
Li, N., Xia, T., Nel, A.E. 2008. The role of oxidative stress in ambient particulate
Matter-induced lung diseases and its implications in the toxicity of engineered
nanoparticles. Free Radical Biol. Med. 44, 1689–1699.
Lovern, S. B., Strickler J. R., Klaper, R. 2007. Behavioural and physiological changes
in Daphnia magna when exposed to nanoparticle suspensions (titanium dioxide,
nano-C60, and C60HxC70Hx). Environ. Sci. Technol. 41, 4465-7.
Lynch, I., Cedervall, T., Lundqvist, M., Cabaleiro-Lago, C., Linse, S., Dawson, K. A.
2007. The nanoparticle–protein complex as a biological entity; a complex fluids and
surface science challenge for the 21st century. Advances in Colloid and Interface
Science, 134-135, 167–174.
Lubos, E., Handy, D.E., Loscalzo, J. 2008. Role of oxidative stress and nitric oxide in
atherothrombosis. Front. Biosci. 13, 5323–5344.
Mortimer, M., Kasemets, K., Heinlaan, M., Kurvet, I., Kahru, A. 2008. High
throughput kinetic Vibrio fischeri bioluminescence inhibition assay for study of
toxic effects of nanoparticles. Toxicol. In Vitro, 22, 1412-1417.
Chapter 6
183
Mukherjee, S.P., Lyng, F.M., Garcia, A., Davoren, M., Byrne, H.J. 2010. Mechanistic
studies of in vitro cytotoxicity of poly (amidoamine) dendrimers in mammalian
cells. Toxicol Appl Pharmacol. 248, 259-68.
Mueller, N. C., Nowack, B. 2008. Exposure Modelling of Engineered Nanoparticles in
the Environment. Environ. Sci. Technol. 42, 4447–4453.
Navarro, E., Piccapietra, F., Wagner, B., Marconi, F., Kaegi, R., Odzak, N., Sigg, L.,
Behra, R. 2008. Toxicity of Silver Nanoparticles to Chlamydomonas reinhardtii.
Environ. Sci. Technol. 42, 8959–8964.
Nel, A., Xia, T., Madler, L., Ning, L. 2006. Toxic potential of materials at nanolevel.
Science 311, 622-627.
Obedoster, G., Obedoster, E., Obedoster. A. 2005. Nanotoxicology: an emerging
discipline evolving from studies of ultrafine particles. Environ. Health Perspect.
113, 823-839.
Shieh, M. J., Peng, C. L., Lou, P. J., Chiu, C. H., Tsai, T. Y., Hsu, C. Y., Yeh, C.
Y., Lai, P. S. 2008. Non-toxic phototriggered gene transfection by PAMAM-
porphyrin conjugates. J. Control. Rel. 129, 200-206.
Sies H.1993. Strategies of antioxidant defense. Eur J Biochem. 215, 213-219.
Zhang, R., Kang, K.A., Piao, M.J., Maeng, Y.H., Lee, K.H., Chang, W.Y., You, H.J.,
Kim, J.S., Kang, S.S., Hyun, J.W. 2009. Cellular protection of morin against the
oxidative stress induced by hydrogen peroxide, Chem. Biol. Interact. 177, 21–27.
Chapter 7
184
Chapter 7
Immunotoxicity of PAMAM dendrimers
(G4, G5 and G6)
Adapted from “Reactive Oxygen Species (ROS) induced cytokine production and
cytotoxicity of PAMAM dendrimers in J774A.1 cells”. Toxicology and applied
Pharmacology, 2010, 246, 91-99.
Authors: Pratap C. Naha, Maria Davoren, Fiona M. Lyng and Hugh J. Byrne

Chapter 7
185
7.1 Introduction
The interaction of PAMAM dendrimers with PLHC-1 cells, representative of fresh
water vertebrate species was described in chapter 6. In this chapter, the immunotoxicity
of the PAMAM dendrimers is explored. Macrophages were chosen as the target cells
for the in vitro model, as macrophages are one of the professional antigen presenting
cells (APC). J774A.1 cells, derived from the blood of the female BALB/c mouse.
Although both PLHC-1 and J774A.1 cells are considered to represent vertebrate
species, they are derived from different species and thus have different metabolic
activity. The application of nanomaterials as intravenous drug delivery platforms may
depend on avoiding rapid elimination from systemic circulation by cells of the immune
system. When nanoparticles enter into the bloodstream, they immediately encounter a
complex environment of plasma proteins and immune cells. The interaction of
nanoparticles with immune cells may occur both in the blood stream via monocytes,
platelets, leukocytes, and dendritic cells (DC) and in tissues by resident phagocytes,
e.g., Kupffer cells in liver, DC in lymph nodes, macrophages and B cells in the spleen
(Dobrovolskaia et al., 2008). As PAMAM dendrimers are potentially proposed for
vaccine and intracellular gene delivery applications, and macrophages are the main
target cells to produce or improve the immunogenicity of the different antigens, this
study explores the interaction with and toxicity to macrophages cells of PAMAM (G4,
G5 and G6) dendrimers. ROS and subsequent cytokine production are monitored as
indicators of oxidative stress and inflammatory response.
In addition to a study of the PAMAM dendrimer materials in their own right, the
systematically varied molecular nanostructures potentially provides a route towards an
understanding of the dependence of the interactions on the physico-chemical properties
of nanomaterials. In a recent study, the toxicity of PAMAM dendrimers in mammalian

Chapter 7
186
cells has been demonstrated to be generation dependent (Mukherjee et al., 2009),
potentially laying the foundation for structure-activity relationships underlining the
mechanistic responses. Conjugation of poly (ethylene glycol) (PEG) to the surface of
PAMAM dendrimers has been observed to improve their biocompatibility, reducing the
cytotoxic response (Wang et al., 2009). The objective of the present work is an in vitro
assessment of the immunotoxicological response of three generations of the cationic
PAMAM dendrimers (G4, G4 and G6) in mouse macrophage cells (J774A1). The
systematically varied structure and size allows an evaluation of the dependence of the
response on the physico–chemical properties. The PAMAM dendrimers were
characterized in terms of particle size and zeta potential in cell culture media with and
without protein (FBS). In accordance with the EU policy of Reduction, Replacement
and Refinement (RRR) an in vitro rather than animal model is employed to assess the
cytotoxic response and underlying mechanisms of these materials. (Directive
86/609/EEC on the protection of animals used for experimental and scientific purposes).
Cytotoxicological effects of PAMAM dendrimers were evaluated using the Alamar blue
and MTT [(3-(4, 5-Dimethylthiazol-2-yl)-2, 5- diphenyltetrazolium bromide, a
tetrazole)] assays. Intracellular reactive oxygen species (ROS) were measured following
exposure of the macrophages to PAMAM dendrimers for time periods of 1h, 2h, 4h and
6h. The visualisation of ROS production by the cells was performed by confocal laser
scanning microscopy. The secretion of the cytokines and chemokines, Macrophage
Inflammatory Protein-2 (MIP-2), Tumour Necrosis Factor -α (TNF-α) and Interleukin -
6 (IL-6), following exposure of the macrophage cells to PAMAM dendrimers was
measured quantitatively by enzyme linked immunosorbant assay (ELISA).
Chapter 7
187
7.2 Experimental methods
All the relevant experimental methods are described in chapter 2. Particle size and zeta
potential measurement are described in chapter 2, sections 2.2.1.1 and 2.2.1.2.
Intracellular reactive oxygen species (ROS) detection in J774A.1 cells is described in
section 2.2.2.9; Cytokine expression upon the exposure of PAMAM dendrimers in
J774A.1 cells was detected by ELISA as described in section 2.2.2.10. The cytotoxicity
assays employed are described in section 2.2.2.6 of chapter 2.
7.3 Results
7.3.1 Characterisation of PAMAM dendrimers
The PAMAM dendrimers (G4, G5 and G6) were characterised in terms of particle size,
and zeta potential. As described in chapter 5, the hydrodynamic diameter correlated well
with that quoted by the manufactures (Naha et al., 2009). In the J774A.1 cell culture
media, the hydrodynamic diameter of G4, G5 and G6 was 6.2 nm ± 0.3 nm; 7.5 nm ±
0.3 nm and 10.3 nm ± 0.4 nm respectively. The slight increase in size in cell culture
media may be due to interaction with proteins or other components of the cell culture
media producing a ‘protein corona’ as has been observed with other nanoparticles
(Lynch et al., 2007).
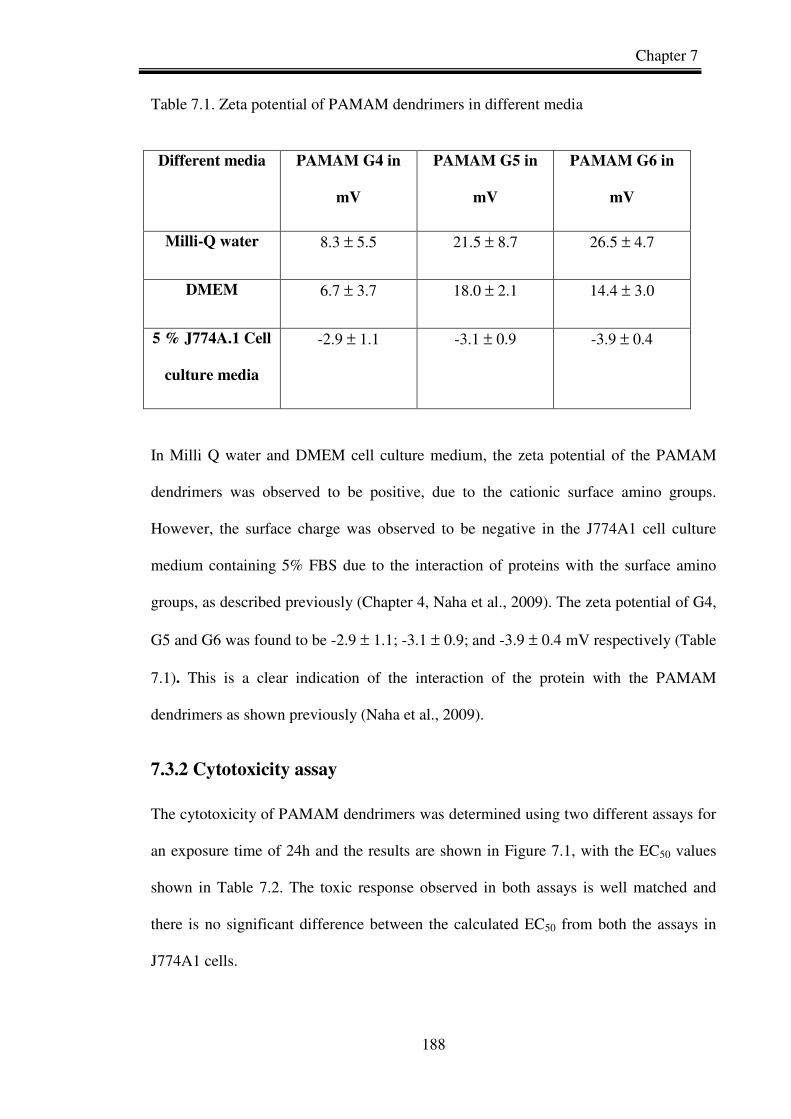
Chapter 7
188
Table 7.1. Zeta potential of PAMAM dendrimers in different media
Different media PAMAM G4 in
mV
PAMAM G5 in
mV
PAMAM G6 in
mV
Milli-Q water 8.3 ± 5.5 21.5 ± 8.7 26.5 ± 4.7
DMEM 6.7 ± 3.7 18.0 ± 2.1 14.4 ± 3.0
5 % J774A.1 Cell
culture media
-2.9 ± 1.1 -3.1 ± 0.9 -3.9 ± 0.4
In Milli Q water and DMEM cell culture medium, the zeta potential of the PAMAM
dendrimers was observed to be positive, due to the cationic surface amino groups.
However, the surface charge was observed to be negative in the J774A1 cell culture
medium containing 5% FBS due to the interaction of proteins with the surface amino
groups, as described previously (Chapter 4, Naha et al., 2009). The zeta potential of G4,
G5 and G6 was found to be -2.9 ± 1.1; -3.1 ± 0.9; and -3.9 ± 0.4 mV respectively (Table
7.1). This is a clear indication of the interaction of the protein with the PAMAM
dendrimers as shown previously (Naha et al., 2009).
7.3.2 Cytotoxicity assay
The cytotoxicity of PAMAM dendrimers was determined using two different assays for
an exposure time of 24h and the results are shown in Figure 7.1, with the EC50 values
shown in Table 7.2. The toxic response observed in both assays is well matched and
there is no significant difference between the calculated EC50 from both the assays in
J774A1 cells.

Chapter 7
189
Table 7.2. EC50 data of PAMAM dendrimers G4, G5 and G6 for the Alamar blue (AB)
and MTT assays for 24 hour exposure in J774A.1 cells.
PAMAM Dendrimer EC50 of AB assay in (µµµµM) EC50 of MTT assay in (µµµµM)
G4 1.6 ± (0.3) 1.4 ± (0.3)
G5 0.5 ± (0.2) 0.5 ± (0.2)
G6 0.3 ± (0.1) 0.2 ± (0.1)
A time and generation dependent toxic response was furthermore observed as shown in
Figure 7.2a. Maximum cell death occurs at 72 h exposure for all three generations of
PAMAM dendrimers. The trend of toxic response was G6 > G5 > G4, as observed
previously for aquatic species and fish cell lines (Chapter 5, Naha et al., 2009) as well
as mammalian cell lines (Mukherjee et al., 2009). Notably, the toxic response in terms
of inverse EC50 (Ragnvaldsson et al., 2007) shows a monotonic increase with increasing
number of surface primary amino groups present in the PAMAM dendrimers which is
shown in Figure 7.2.b for the case of 24 h exposure, demonstrating a clear structure-
activity relationship. In order to further explore the mechanisms of cell death, the
induced oxidative stress and inflammatory response were explored.

Chapter 7
190
Figure 7.1. Comparison of cytotoxicity assays AB and MTT of (A) G4, (B) G5 and (C)
G6 PAMAM dendrimers in J774A.1 cells after 24h exposure. The data shown mean ±
SD (n=3).
0
20
40
60
80
100
120
0.01 0.1 1 10
Concentration of PAMAM (G-4) dendrimer in µµµµM
% C
ell
Via
bili
ty
AB
MTT
0
20
40
60
80
100
120
0.01 0.1 1 10
Concentration of PAMAM (G-5) dendrimer in µµµµM
% C
ell
viab
ilit
ty
AB
MTT
0
20
40
60
80
100
120
0.01 0.1 1 10
Concentration of PAMAM (G-6) dendrimer in µµµµM
% C
ell V
iab
ility
AB
MTT
A B
C
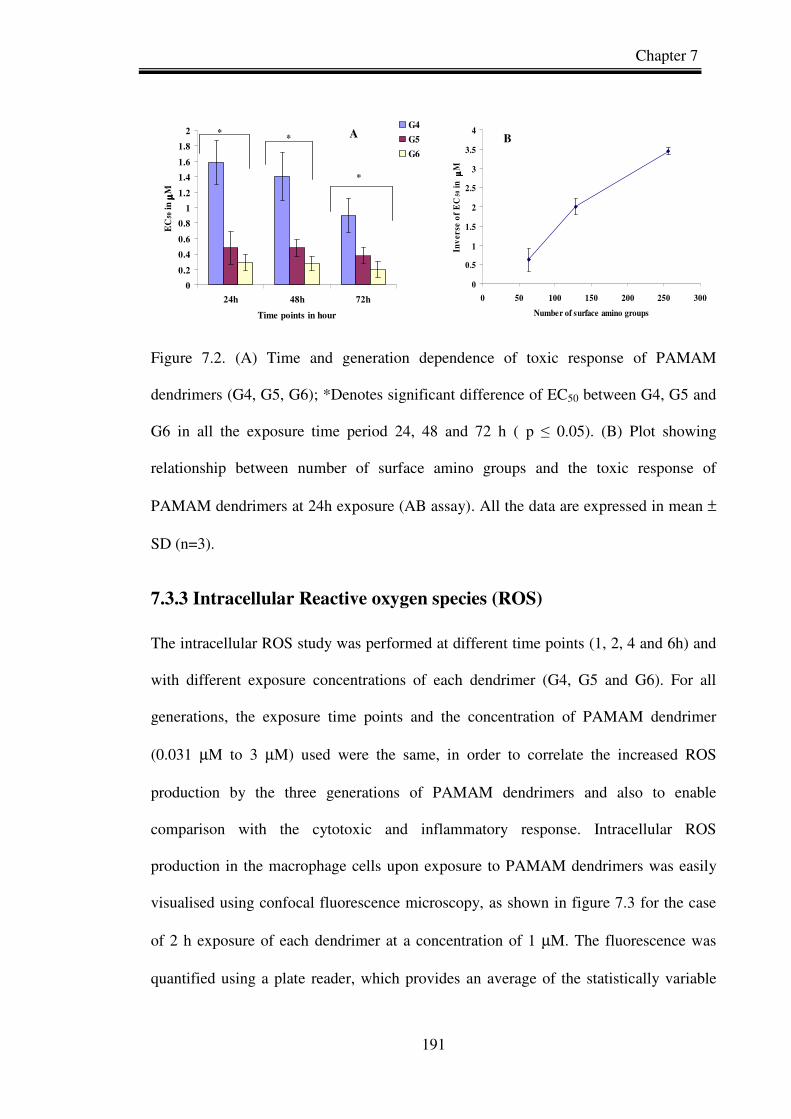
Chapter 7
191
Figure 7.2. (A) Time and generation dependence of toxic response of PAMAM
dendrimers (G4, G5, G6); *Denotes significant difference of EC50 between G4, G5 and
G6 in all the exposure time period 24, 48 and 72 h ( p ≤ 0.05). (B) Plot showing
relationship between number of surface amino groups and the toxic response of
PAMAM dendrimers at 24h exposure (AB assay). All the data are expressed in mean ±
SD (n=3).
7.3.3 Intracellular Reactive oxygen species (ROS)
The intracellular ROS study was performed at different time points (1, 2, 4 and 6h) and
with different exposure concentrations of each dendrimer (G4, G5 and G6). For all
generations, the exposure time points and the concentration of PAMAM dendrimer
(0.031 µM to 3 µM) used were the same, in order to correlate the increased ROS
production by the three generations of PAMAM dendrimers and also to enable
comparison with the cytotoxic and inflammatory response. Intracellular ROS
production in the macrophage cells upon exposure to PAMAM dendrimers was easily
visualised using confocal fluorescence microscopy, as shown in figure 7.3 for the case
of 2 h exposure of each dendrimer at a concentration of 1 µM. The fluorescence was
quantified using a plate reader, which provides an average of the statistically variable
0
0.5
1
1.5
2
2.5
3
3.5
4
0 50 100 150 200 250 300
Number of surface amino groups
Inv
erse
of
EC
50 i
n
µµ µµM
0
0.2
0.4
0.6
0.8
1
1.2
1.4
1.6
1.8
2
24h 48h 72h
Time points in hour
EC
50
in µµ µµ
M
G4
G5
G6
**
*
A B

Chapter 7
192
response of individual cells (Elbekai and El-Kadi, 2005). This in situ method was
favoured over flow cytometry as J7741.A cells are strongly adherent and do not detach
easily from the flask after trypsinisation. The concentration dependent increase in ROS
production for four different time points for the three dendrimer generations was
monitored and the results are shown in Figure 7.4. Increased ROS production was found
to be dendrimer generation and time dependent (Figure 7.5A). In a previous study of
poly (propyleneimine) dendrimers (PPI), a similar generation dependent intracellular
ROS production and reduction of mitochondrial membrane potential was observed in
macrophages (Kuo et al., 2007). The generation dependence follows the trend of G6 >
G5 > G4, as was seen for the cytotoxic response. Similar to the case of the cytotoxic
response, the generation dependent ROS levels appear to be correlated with the increase
in number of surface primary amino groups with increasing generation, as shown in
figure 7.5B for the case of 1 h exposure.
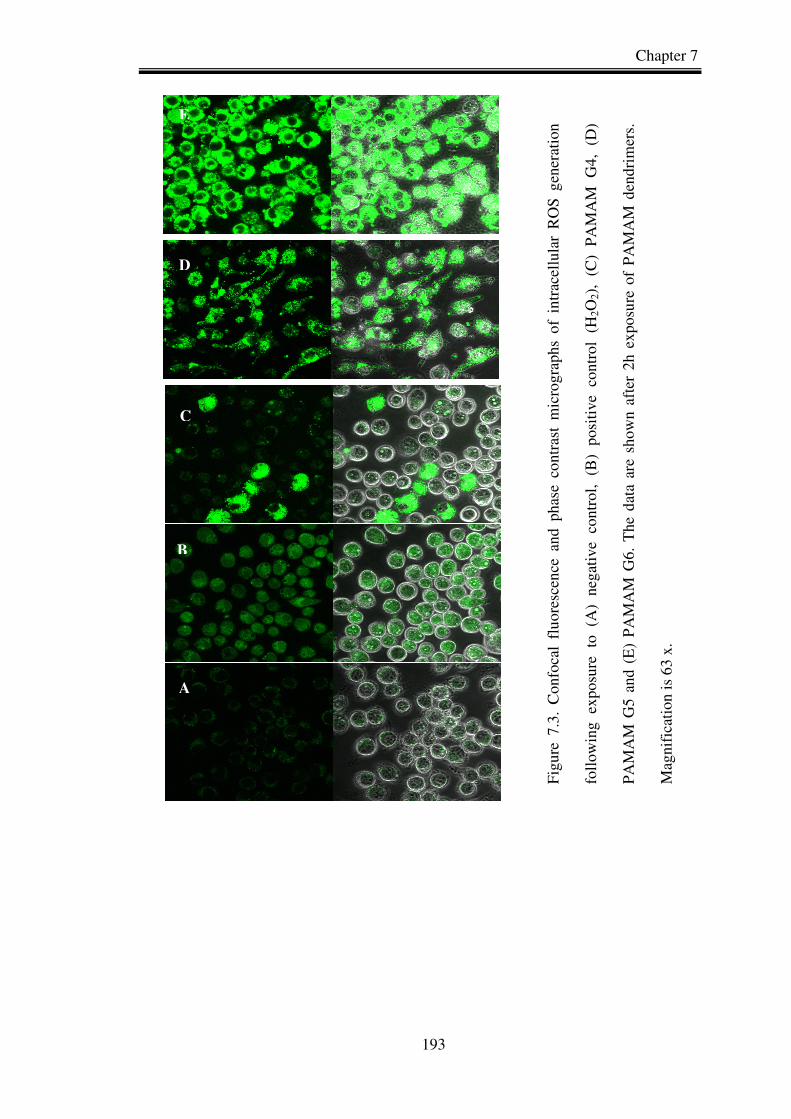
Chapter 7
193
A
B
C
D
E
Fig
ure
7.3.
Con
foca
l fl
uor
esce
nce
and
pha
se c
ont
rast
mic
rogr
aph
s o
f in
trac
ellu
lar
RO
S g
ener
atio
n
foll
owin
g ex
posu
re
to
(A)
neg
ativ
e co
ntro
l,
(B)
posi
tive
co
ntro
l (H
2O
2),
(C
) P
AM
AM
G
4,
(D)
PA
MA
M G
5 an
d (E
) P
AM
AM
G6.
The
dat
a ar
e sh
own
afte
r 2h
exp
osu
re o
f P
AM
AM
den
drim
ers.
Mag
nifi
cati
on i
s 63
x.
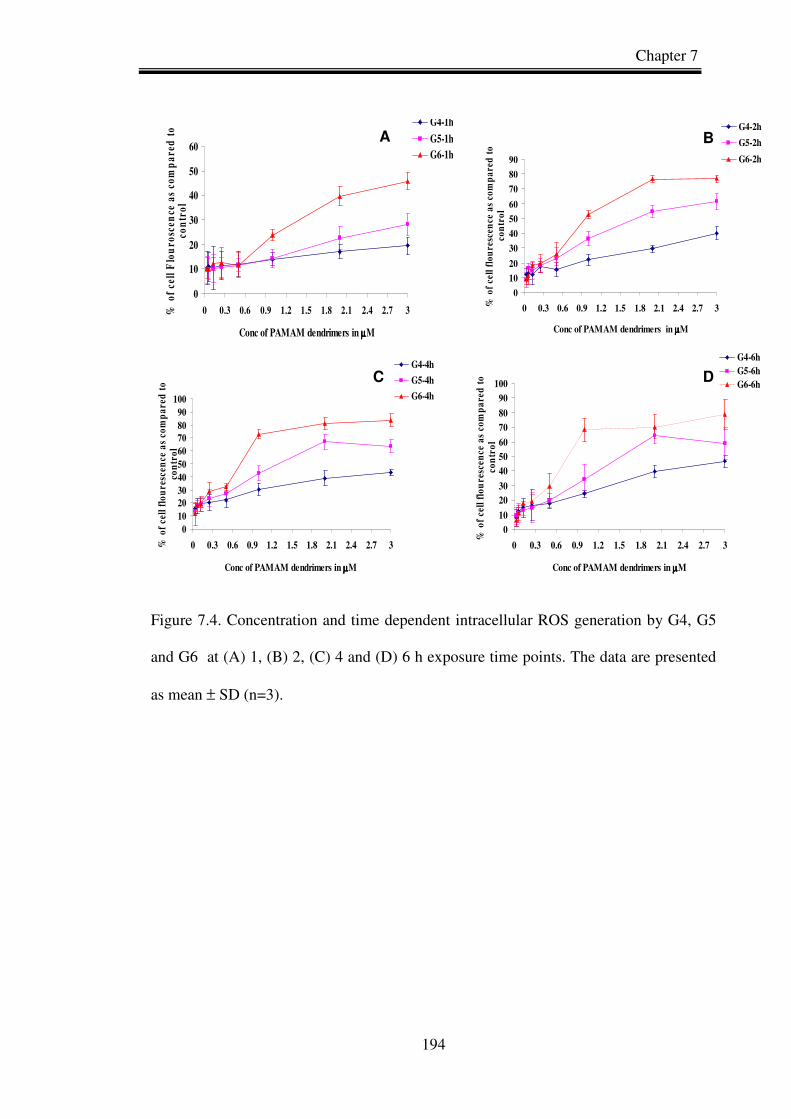
Chapter 7
194
Figure 7.4. Concentration and time dependent intracellular ROS generation by G4, G5
and G6 at (A) 1, (B) 2, (C) 4 and (D) 6 h exposure time points. The data are presented
as mean ± SD (n=3).
0
10
20
30
40
50
60
70
80
90
100
0 0.3 0.6 0.9 1.2 1.5 1.8 2.1 2.4 2.7 3
Conc of PAMAM dendrimers in µµµµM
% o
f ce
ll f
lou
resc
ence
as
com
pa
red
to
co
ntr
ol
G4-6h
G5-6h
G6-6h
0
10
20
30
40
50
60
0 0.3 0.6 0.9 1.2 1.5 1.8 2.1 2.4 2.7 3
Conc of PAMAM dendrimers in µµµµM
% o
f ce
ll F
lou
rosc
ence
as
com
par
ed t
o co
ntr
ol
G4-1h
G5-1h
G6-1h
0
10
20
30
40
50
60
70
80
90
0 0.3 0.6 0.9 1.2 1.5 1.8 2.1 2.4 2.7 3
Conc of PAMAM dendrimers in µµµµM
% o
f ce
ll f
lou
resc
ence
as
com
pa
red
to
co
ntr
ol
G4-2h
G5-2h
G6-2h
010
20304050
607080
90100
0 0.3 0.6 0.9 1.2 1.5 1.8 2.1 2.4 2.7 3
Conc of PAMAM dendrimers in µµµµM
% o
f ce
ll f
lou
resc
ence
as
com
pa
red
to
co
ntr
ol
G4-4h
G5-4h
G6-4h
A B
C D
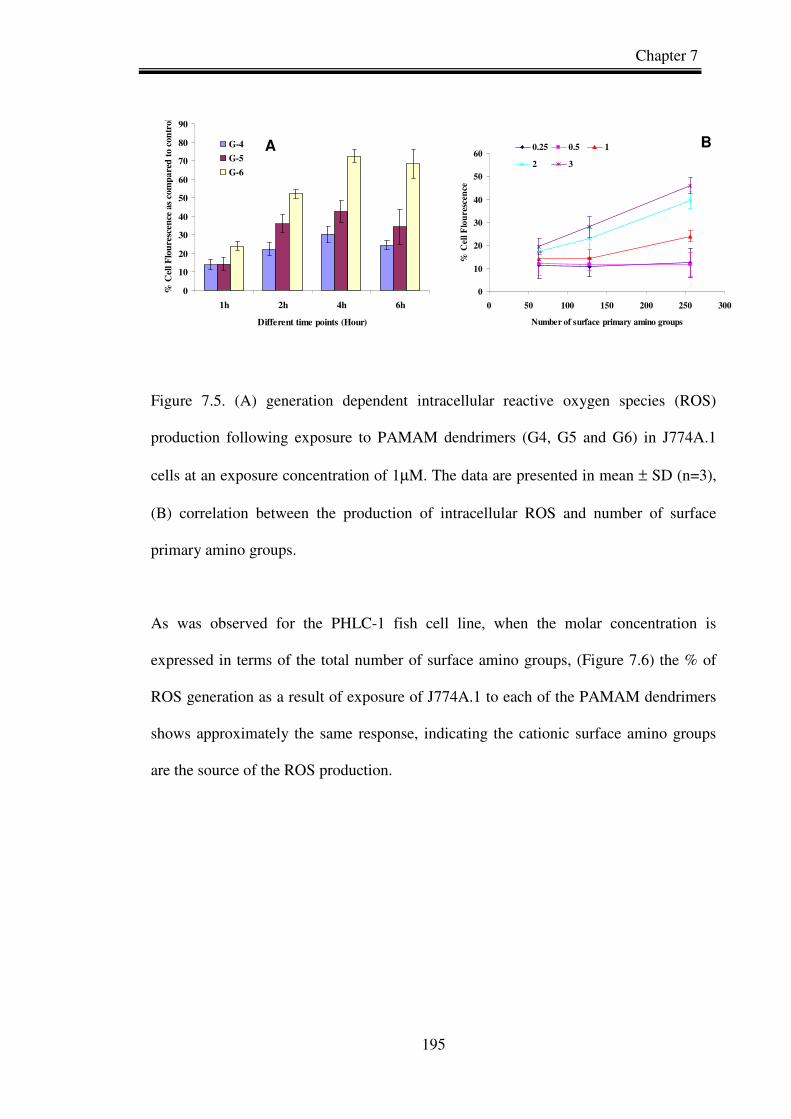
Chapter 7
195
Figure 7.5. (A) generation dependent intracellular reactive oxygen species (ROS)
production following exposure to PAMAM dendrimers (G4, G5 and G6) in J774A.1
cells at an exposure concentration of 1µM. The data are presented in mean ± SD (n=3),
(B) correlation between the production of intracellular ROS and number of surface
primary amino groups.
As was observed for the PHLC-1 fish cell line, when the molar concentration is
expressed in terms of the total number of surface amino groups, (Figure 7.6) the % of
ROS generation as a result of exposure of J774A.1 to each of the PAMAM dendrimers
shows approximately the same response, indicating the cationic surface amino groups
are the source of the ROS production.
0
10
20
30
40
50
60
70
80
90
1h 2h 4h 6h
Different time points (Hour)
% C
ell F
lou
resc
ence
as
com
pa
red
to
con
tro
l
G-4
G-5
G-6
0
10
20
30
40
50
60
0 50 100 150 200 250 300
Number of surface primary amino groups
% C
ell F
lou
resc
ence
0.25 0.5 1
2 3
A B

Chapter 7
196
0
10
20
30
40
50
60
70
80
90
100
0 2 4 6 8 10 12 14
Maximum number of surface amino groups in PAMAM
dendrimers
% I
ntr
ace
llu
lar
RO
S
G-4_4h
G-5_4h
G-6_4h
Figure 7.6 Correlation between maximum ROS production and the maximum number
of surface primary amino groups of PAMAM dendrimers at 4 hour exposure.
7.3.4 Cytokines production
7.3.4.1 Macrophage inflammatory protein-2 (MIP-2)
The level of macrophage inflammatory protein-2 (MIP-2) secretion by the J774A.1 cells
following exposure to PAMAM dendrimers was analysed from the cell culture
supernatant after exposure to 5 different concentrations of each dendrimer and also at 5
different exposure time periods (6, 12, 24, 48 and 72h). MIP-2 levels at different
exposure time periods were calculated from the standard curve of the MIP-2 standards
(ranging from 10 to 800 pg/ml).
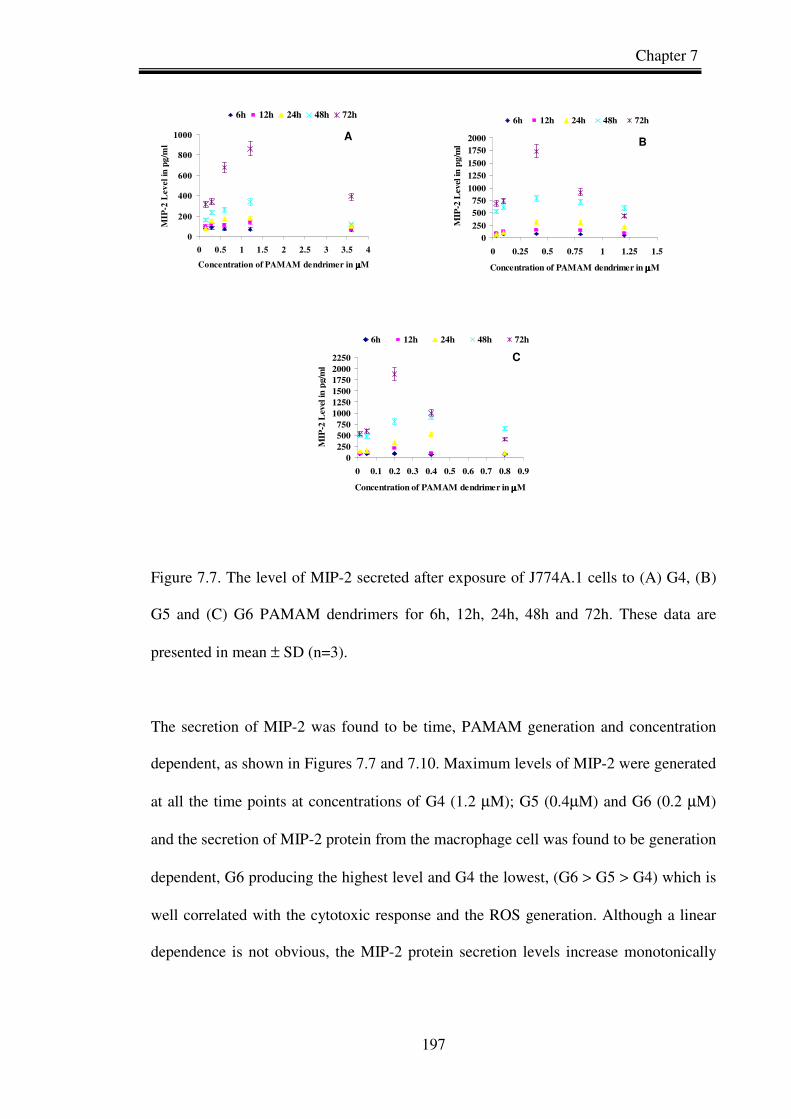
Chapter 7
197
Figure 7.7. The level of MIP-2 secreted after exposure of J774A.1 cells to (A) G4, (B)
G5 and (C) G6 PAMAM dendrimers for 6h, 12h, 24h, 48h and 72h. These data are
presented in mean ± SD (n=3).
The secretion of MIP-2 was found to be time, PAMAM generation and concentration
dependent, as shown in Figures 7.7 and 7.10. Maximum levels of MIP-2 were generated
at all the time points at concentrations of G4 (1.2 µM); G5 (0.4µM) and G6 (0.2 µM)
and the secretion of MIP-2 protein from the macrophage cell was found to be generation
dependent, G6 producing the highest level and G4 the lowest, (G6 > G5 > G4) which is
well correlated with the cytotoxic response and the ROS generation. Although a linear
dependence is not obvious, the MIP-2 protein secretion levels increase monotonically
0
200
400
600
800
1000
0 0.5 1 1.5 2 2.5 3 3.5 4
Concentration of PAMAM dendrimer in µµµµM
MIP
-2 L
evel
in
pg
/ml
6h 12h 24h 48h 72h
0
250
500
750
1000
1250
1500
1750
2000
0 0.25 0.5 0.75 1 1.25 1.5
Concentration of PAMAM dendrimer in µµµµM
MIP
-2 L
evel
in
pg/m
l
6h 12h 24h 48h 72h
0
250
500750
10001250
1500
17502000
2250
0 0.1 0.2 0.3 0.4 0.5 0.6 0.7 0.8 0.9
Concentration of PAMAM dendrimer in µµµµM
MIP
-2 L
evel
in
pg/
ml
6h 12h 24h 48h 72h
A B
C

Chapter 7
198
with the number of surface primary amino groups of the PAMAM dendrimers, as
shown in Figure 7.11 A.
7.3.4.2 Interleukin-6 (IL-6)
After different exposure time periods (6, 12, 24, and 48 h) of PAMAM dendrimers, the
levels of IL-6 were calculated from the standard curve (standards ranging from 10 to
800 pg/ml). In the case of G4 (0.6 µM); G5 (0.4 µM) and G6 (0.2 µM), the maximum
levels of IL-6 were observed after 24 h exposure. A time, concentration and generation
dependent IL-6 secretion from the macrophage cells was observed upon the exposure to
PAMAM dendrimers as shown in Figure 7.8 and 7.10. PAMAM dendrimer G6
producing the highest levels and G4 the lowest (G6 > G5 > G4) which is well correlated
with the cytotoxic response. Again the level of IL-6 secretion by the J774A.1 cells
increases monotonically with the surface area of each dendrimer generation, as shown
in Figure 7.11 B.
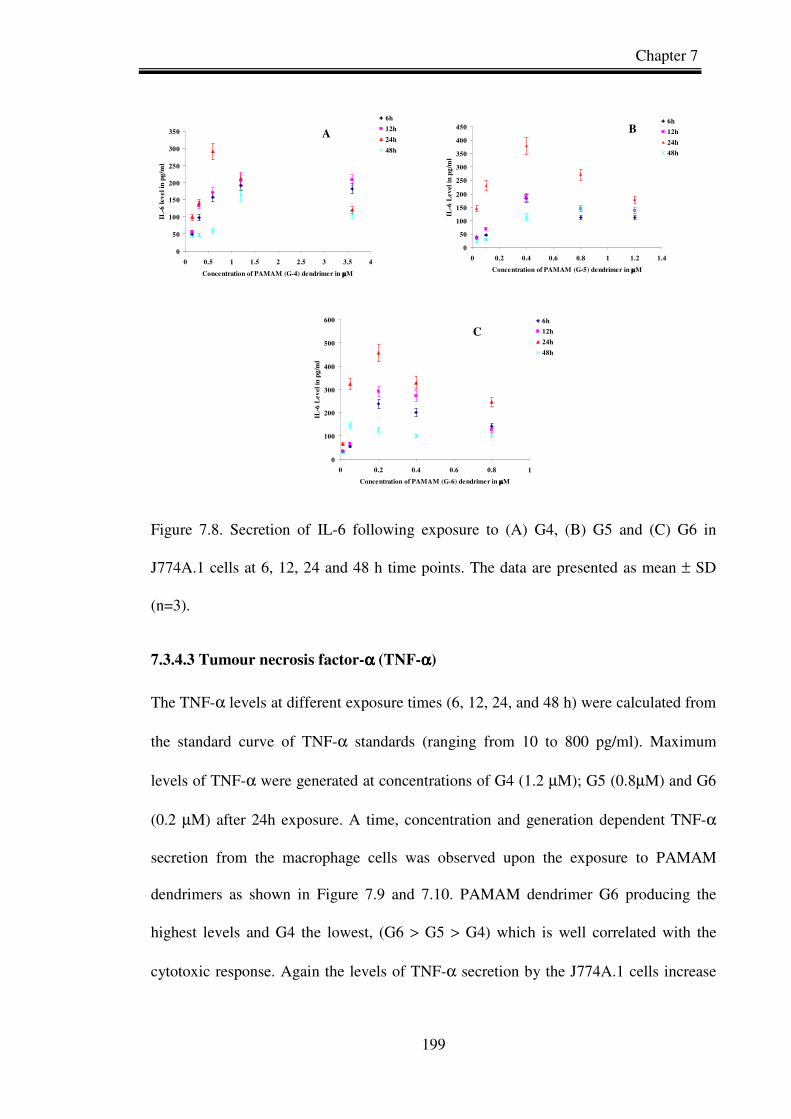
Chapter 7
199
Figure 7.8. Secretion of IL-6 following exposure to (A) G4, (B) G5 and (C) G6 in
J774A.1 cells at 6, 12, 24 and 48 h time points. The data are presented as mean ± SD
(n=3).
7.3.4.3 Tumour necrosis factor-αααα (TNF-αααα)
The TNF-α levels at different exposure times (6, 12, 24, and 48 h) were calculated from
the standard curve of TNF-α standards (ranging from 10 to 800 pg/ml). Maximum
levels of TNF-α were generated at concentrations of G4 (1.2 µM); G5 (0.8µM) and G6
(0.2 µM) after 24h exposure. A time, concentration and generation dependent TNF-α
secretion from the macrophage cells was observed upon the exposure to PAMAM
dendrimers as shown in Figure 7.9 and 7.10. PAMAM dendrimer G6 producing the
highest levels and G4 the lowest, (G6 > G5 > G4) which is well correlated with the
cytotoxic response. Again the levels of TNF-α secretion by the J774A.1 cells increase
0
50
100
150
200
250
300
350
0 0.5 1 1.5 2 2.5 3 3.5 4
Concentration of PAMAM (G-4) dendrimer in µµµµM
IL-6
lev
el i
n p
g/m
l
6h
12h
24h
48h
0
50
100
150
200
250
300
350
400
450
0 0.2 0.4 0.6 0.8 1 1.2 1.4
Concentration of PAMAM (G-5) dendrimer in µµµµM
IL-6
Lev
el i
n p
g/m
l
6h
12h
24h
48h
0
100
200
300
400
500
600
0 0.2 0.4 0.6 0.8 1
Concentration of PAMAM (G-6) dendrimer in µµµµM
IL-6
Lev
el i
n p
g/m
l6h
12h
24h
48h
A
C
B
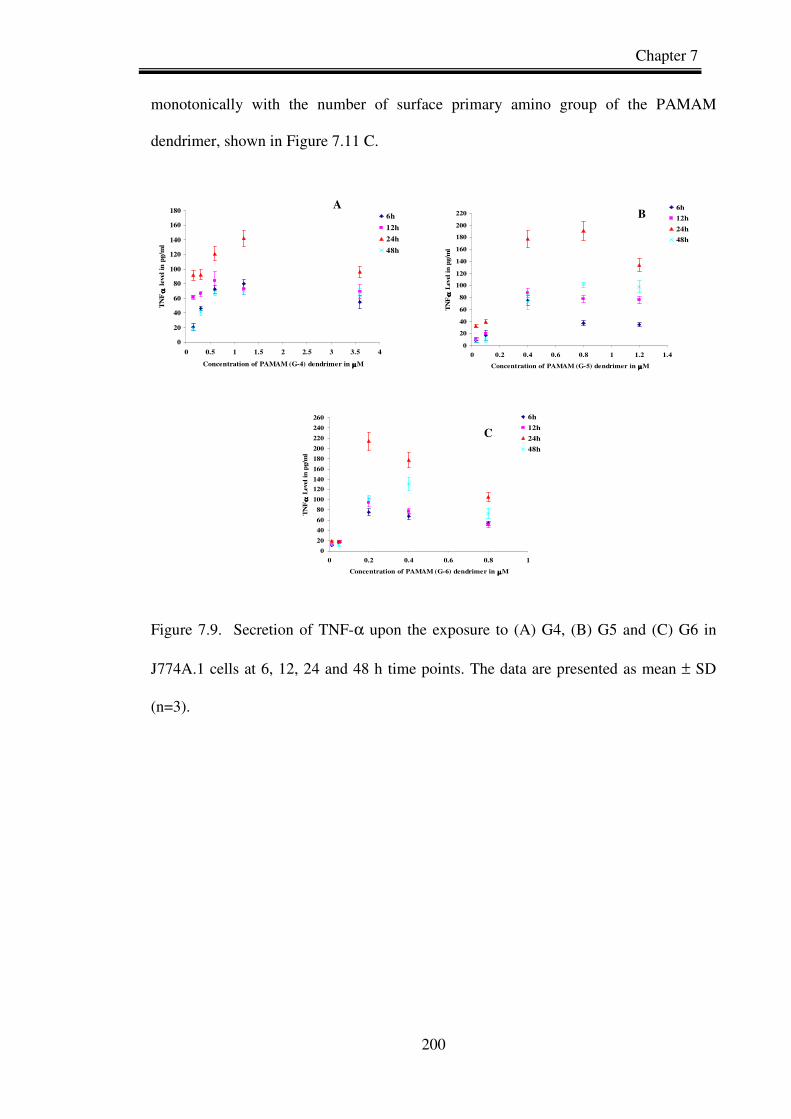
Chapter 7
200
monotonically with the number of surface primary amino group of the PAMAM
dendrimer, shown in Figure 7.11 C.
Figure 7.9. Secretion of TNF-α upon the exposure to (A) G4, (B) G5 and (C) G6 in
J774A.1 cells at 6, 12, 24 and 48 h time points. The data are presented as mean ± SD
(n=3).
0
20
40
60
80
100
120
140
160
180
0 0.5 1 1.5 2 2.5 3 3.5 4
Concentration of PAMAM (G-4) dendrimer in µµµµM
TN
F- αα αα
lev
el i
n p
g/m
l
6h
12h
24h
48h
0
20
40
60
80
100
120
140
160
180
200
220
0 0.2 0.4 0.6 0.8 1 1.2 1.4
Concentration of PAMAM (G-5) dendrimer in µµµµM
TN
F- αα αα
Lev
el i
n p
g/m
l
6h
12h
24h
48h
0
20
40
60
80
100
120
140
160
180
200
220
240
260
0 0.2 0.4 0.6 0.8 1
Concentration of PAMAM (G-6) dendrimer in µµµµM
TN
F- αα αα
Lev
el i
n p
g/m
l
6h
12h
24h
48h
A B
C

Chapter 7
201
0
50
100
150
200
250
300
350
400
450
500
G-4 G-5 G-6
PAMAM dendrimer
Lev
el o
f T
NF
- α,
α,
α,
α,M
IP-2
an
d I
L-6
in
pg
/ml
TNF-a
MIP-2
IL-6
Figure 7.10. Generation dependent MIP-2, IL-6 and TNF-α secretion after 24h exposure
of PAMAM dendrimers (G4, G5 and G6) in J774A.1 cells. The data are shown as mean
± SD (n=3).

Chapter 7
202
Figure 7.11. Correlation between inflammatory mediator (A) MIP-2, (B) IL-6 and (C)
TNF-α response and the surface area of PAMAM dendrimers (G4, G5 and G6). All the
data are presented in mean ± SD (n=3).
7.4 Discussion
The cytotoxic response of J774A.1 cells to the PAMAM dendrimers, with varying
numbers of –NH2 surface group (G4, G5 and G6), was evaluated using the Alamar blue
(AB) and MTT assays. The EC50 was calculated and no significant difference was
observed between the assays after 24 h exposure (Figure 7.1). Alamar blue is a water-
soluble dye and the oxidized form enters the cytosol and is converted to the reduced
form by mitochondrial enzyme activity by accepting electrons from NADPH, FADH,
FMNH, NADH as well as from the cytochromes (Al-Nasiry et al., 2007). Mitochondrial
0
500
1000
1500
2000
2500
0 50 100 150 200 250 300
Number of surface primary amino groups
Lev
el o
f M
IP-2
in
pg/
ml
6h 12h 24h 48h 72h
0
50
100
150
200
250
300
350
400
450
500
550
0 50 100 150 200 250 300
Number of surface primary amino groups
Lev
el o
f IL
-6 i
n p
g/m
l
6h 12h 24h 48h
0
50
100
150
200
250
0 50 100 150 200 250 300
Number of surface primary amino groups
Lev
el o
f T
NF
- αα αα in p
g/m
l
6h 12h 24h 48h
A
C
B
Chapter 7
203
activity was determined by the MTT assay. MTT is reduced to the purple formazan in
the mitochondria of living cells. This reduction takes place only when mitochondrial
reductase enzymes are active, and therefore conversion can be directly related to the
number of viable (living) cells. MTT is completely reduced by mitochondrial enzyme.
The close agreement of the EC50 as determined by the two assays is an indication of
significant mitochondrial injury as origin of the cytotoxic response.
The toxic response was seen to increase with dendrimer generation and therefore size. A
similar generation dependent toxicological response was previously seen with fish cells
(Naha et al., 2009) and also mammalian cells lines (Mukherjee et al., 2009). A toxic
response which increases with nanoparticle diameter would appear to go against the
commonly accepted trends of increased toxicity with decreased nanoparticle size, but
can be understood in terms of the linear correlation with the number of surface amino
groups of PAMAM dendrimer as shown in Figure 7.2 B.
The surface primary amino groups render the dendrimers cationic and as the generation
of PAMAM dendrimer increases, there is a linear increase in the number of surface
amino groups (Dendritech, Inc. http://www.dendritech.com/pamam.html). The observed
generation dependence suggests that the toxic response has origin in the actions of the
surface charge (Figure 7.2B).
Cationic nanoparticles, like amino-terminated PAMAM dendrimers enter into an
endosomal compartment and escape from the lysosomes by inhibiting the lysosomal
proton pump (Nel et al., 2009) and become localized in the mitochondria (Lee et al.,
2009) producing reactive oxygen species and inducing cell death (Mukherjee et al.,
2010). But in case of PNIPAM, the particles remain in the lysosomes for 24 hours.
Chapter 7
204
In this study, intracellular ROS generation by PAMAM dendrimers is clearly one of the
toxic pathways and a clear generation dependence of intracellular increased ROS
production is shown in Figure 7.5A. The sequence of increased ROS generation is G6>
G5 > G4. This response is also well correlated with the number of surface primary
amino group of PAMAM dendrimers, as shown in Figure 7.5B. This indicates that the
cationic surface amino groups play a direct role in the production of ROS. Generation
dependent intracellular ROS, cytotoxicity and also cytokines production has been
observed with the PAMAM dendrimers in J774A.1 cells. As the PAMAM generation
increases, there is an increase in the number of surface amino groups (64, 128 and 256
amino groups for G4, G5 and G6 respectively) which makes the particle more cationic.
The toxicity of the PAMAM dendrimers has also been reported to decrease upon
modification of the number of functional groups (Khandare et al., 2010). In a recent
study, it has been proposed that amino-terminated PAMAM dendrimers enter into an
endosomal compartment whereupon the unsaturated amino groups are capable of
sequestering protons that are supplied by the v-ATPase. They thus inhibit the lysosomal
proton pump mechanism, leading to rupture and deposition of the particles and the
lysosomal content in the cytoplasm and ultimately cell death (Nel et al., 2009).
Increased intracellular ROS generation suggests that the PAMAM dendrimers can lead
to disruption of the mitochondrial electron transduction chain which may leads to
additional O2– production, which has been observed with carbon based nanoparticles
(Donaldson et al., 2005) and perturbs the mitochondrial permeability transition pore,
which leads to release of pro-apoptotic factors and programmed cell death (Oberdörster
et al., 2005).
Intracellular ROS production can lead to inflammation, as demonstrated for a number of
different nanoparticles (Li et al., 2008; Stone et al., 2007; Lubos et al., 2008; Driscoll,
Chapter 7
205
2000). Oxidative stress activates the MAPK signalling pathway, inducing transcription
factors such as NFkB and AP-1, and these transcription factors induce mRNA
expression of pro-inflammatory mediators and finally cause inflammation (Park and
Park 2009). Macrophage inflammatory protein-2 (MIP-2) plays a major role in
mediating the neutrophilic inflammatory response to nanoparticles (Driscoll et al.,
1995). It is a potent neutrophil chemoattractant and epithelial cell mitogen and is
involved in acute pulmonary inflammation and mediates tissue damage (Walley et al.,
1997; Chung et al., 2003). It is induced by LPS (Lipopolysaccharide), oxidative stress in
a wide range of cells including alveolar macrophages, mast cells, peritoneal
macrophages, epithelial cells and fibroblasts (Monteiller et al., 2007).

Chapter 7
206
Figure 7.12. Schematic of the systematic sequence of events in J774A.1 cells following
exposure to PAMAM dendrimers.
IL-6
Cytotoxicity
Cellular uptake
PAMAM dendrimers (G4, G5 and G6)
Intracellular ROS
Cytokines, Chemokines, etc.
MIP-2
TNF-αααα
Lee et al.,
Chapter 7
207
Inflammatory response induced by nanoparticles is thus a further toxic mechanism
(Monteiller et al., 2007), and in this work the inflammatory mediators (MIP-2, TNF-α
and IL-6) induced by PAMAM dendrimers are highlighted. The level of secretion of all
three inflammatory mediators, MIP-2, TNF-α and IL-6 following exposure of
macrophage cells to PAMAM dendrimers is dependent on the concentration, time of
exposure and the generation of PAMAM dendrimers, as well as the cytotoxic response.
A generation dependent cytokine production was found in all cases and the trend was
G6 > G5 > G4. Thus the ROS production, inflammatory response and cytotoxicity all
show similar trends in terms of dendrimer structure. The pathway of the toxic response
induced by PAMAM dendrimers may therefore be one of localisation in the
mitochondria (Lee et al., 2009) which could be leading to disruption of the
mitochondrial electron transduction chain, and additional O2– production resulting in
oxidative stress (Figure 7.3 and Figure 7.4). The systematic mechanistic pathways of
cell death due to PAMAM dendrimers is presented in Figure 7.12, and the sequence of
responses as a function of time is shown in Figure 7.13. Within the resolution of the
measurements performed, the timing sequence is identical for all three dendrimer
generations. In figure 7.13, the systematic sequence of events as function of time is
presented. Initially, maximum levels of ROS are produced after 4 h, and this is followed
by a maximum level of IL-6 and TNF-α expressed at 24 h and the maximum level of
MIP-2 and cytotoxicity observed at 72 h after the exposure of PAMAM dendrimers to
J774A.1 cells. This indicates that the intracellular ROS production is one of the key
origins of toxic response of PAMAM dendrimers in J774A.1 cells.
Although the toxic responses can be well correlated with the dendrimer generation
structures, it should be noted that the particle size was seen to increase in the cell culture
medium and furthermore that the zeta potential of the PAMAM dendrimers changed
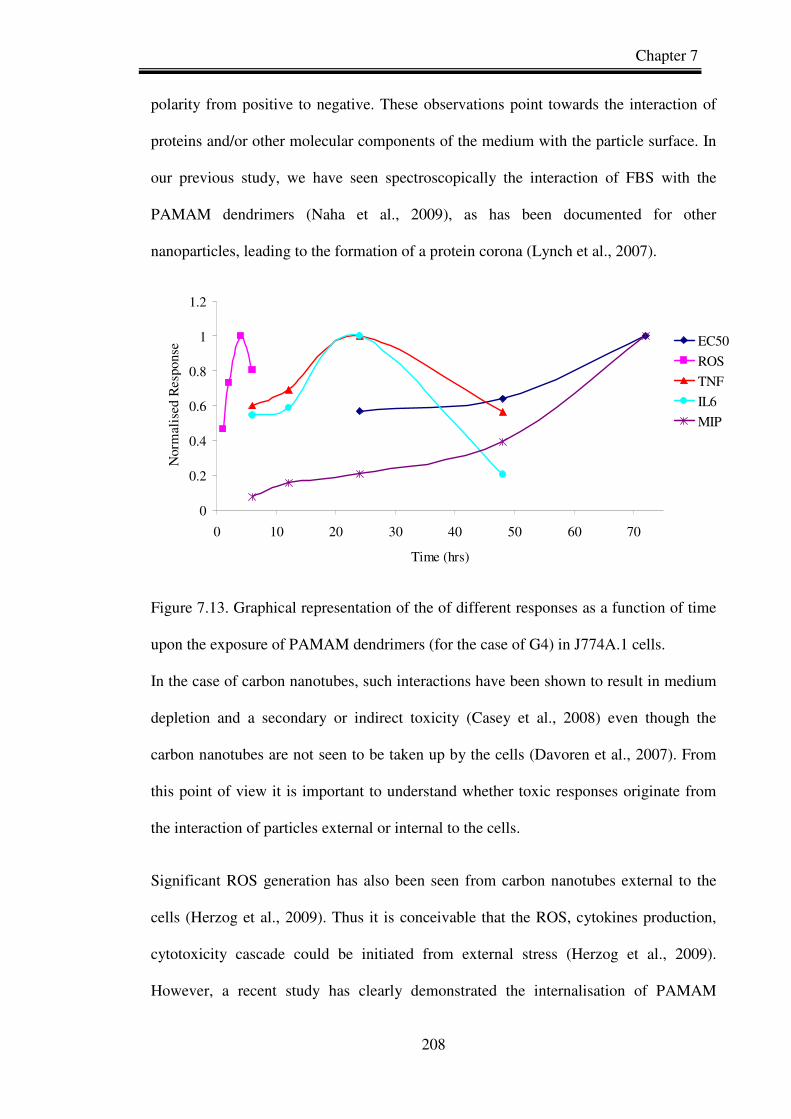
Chapter 7
208
polarity from positive to negative. These observations point towards the interaction of
proteins and/or other molecular components of the medium with the particle surface. In
our previous study, we have seen spectroscopically the interaction of FBS with the
PAMAM dendrimers (Naha et al., 2009), as has been documented for other
nanoparticles, leading to the formation of a protein corona (Lynch et al., 2007).
0
0.2
0.4
0.6
0.8
1
1.2
0 10 20 30 40 50 60 70
Time (hrs)
Nor
mal
ised
Res
pons
e EC50
ROS
TNF
IL6
MIP
Figure 7.13. Graphical representation of the of different responses as a function of time
upon the exposure of PAMAM dendrimers (for the case of G4) in J774A.1 cells.
In the case of carbon nanotubes, such interactions have been shown to result in medium
depletion and a secondary or indirect toxicity (Casey et al., 2008) even though the
carbon nanotubes are not seen to be taken up by the cells (Davoren et al., 2007). From
this point of view it is important to understand whether toxic responses originate from
the interaction of particles external or internal to the cells.
Significant ROS generation has also been seen from carbon nanotubes external to the
cells (Herzog et al., 2009). Thus it is conceivable that the ROS, cytokines production,
cytotoxicity cascade could be initiated from external stress (Herzog et al., 2009).
However, a recent study has clearly demonstrated the internalisation of PAMAM
Chapter 7
209
dendrimers and their localisation in the mitocondria (Lee et al., 2009). Thus, although
there may be external stress leading to some degree of indirect toxic response, it is
proposed that the principal response is a direct result of internalisation of the
nanomaterials.
7.5 Conclusions
PAMAM dendrimers show a significant cytotoxic response in mouse macrophage cells
(J774A.1) in vitro at a concentration of 0.013 to 6 µM. The generation dependence (G6
> G5 > G4) of the production of increased intracellular ROS, inflammatory mediators
and the cytotoxicity indicates the direct effects of the positively charged surface amino
groups. The mechanism of the toxic response is proposed to be one of localisation of the
cationic particles in the mitochondria, leading to significant increase in ROS generation,
induction of cytokines production and ultimately cell death. The generation dependent
intracellular ROS levels, cytokines production and cytotoxicity of PAMAM dendrimers
point towards the basis of structure activity relationships.

Chapter 7
210
Reference
Al-Nasiry, S., Geusens, N., Hanssens, M., Luyte, C., and Pijnenborg R. 2007. The use
of Alamar Blue assay for quantitative analysis of viability, migration and invasion
of choriocarcinoma cells. Human Production 22, 1304-1309.
Batista, M.L Jr., Santos, R.V., Cunha, L.M., Mattos, K., Oliveira, E.M., Seelaender,
M.C., Costa Rosa, L.F. 2006. Changes in the pro-inflammatory cytokine production
and peritoneal macrophage function in rats with chronic heart failure. Cytokine, 34,
284-290.
Casey, A., Herzog, E., Lyng, F. M., Byrne, H. J., Chambers, G., Davoren, M. 2008.
Single walled carbon nanotubes induce indirect cytotoxicity by medium depletion in
A549 lung cells. Toxico Lett. 179, 78–84.
Cheng, Y., Xu, Z., Ma, M., Xu, T. 2008. Dendrimers as drug carrier: applications in
different routes of drug administration. J. Pharm. Sci. 97, 123-143.
Chung, Y-J., Yang, G H., Islam, Z., Pestka J. J. 2003. Up-regulation of macrophage
inflammatory protein-2 and complement 3A receptor by the trichothecenes
deoxynivalenol and satratoxin G. Toxicology 186, 51-65.
Davoren, M., Herzog, E., Casey, A., Cottineau, B., Chambers, G., Byrne, H.J., Lyng,
F.M. 2007. In vitro toxicity evaluation of single walled carbon nanotubes on human
A549 lung cells. Toxicol In Vitro, 21,438-48.
Dendritech, Inc. http://www.dendritech.com/pamam.html. accessed on 16th June 2009.
De Jong W.H. NanoImpactNet workshop on Protocols for assessment of biological
hazards of engineered nanoparticles, Lausanne, March 2009.

Chapter 7
211
Dobrovolskaia, M.A., Aggarwal, P., Hall, JB., McNeil, S.E. 2008. Preclinical study to
understand nanoparticle interaction with the immuno system and its potential effects
on nanoparticle biodistribution. Mol. Pharm. 5, 487-495.
Donaldson, K., Tran, L., Jimenez, L.A., Duffin, R., Newby, D.E., Mills, N., MacNee,
W., Stone, V. 2005. Combustion-derived nanoparticles: a review of their toxicology
following inhalation exposure. Part Fibre Toxicol. 2, 10.
Donaldson, K., Aitken, R., Tran, L., Stone, V., Duffin, R., Forrest, G., Alexaner, A.
2006. Carbon nanotubes: a review of their properties in relation to pulmonary
toxicology and work place safety. Toxicol. Sci. 92, 5-22.
Driscoll K.E. 2000. TNF-α and MIP-2: role in particle induced inflammation and
regulation by oxidative stress. Toxicol Lett. 112-113, 177-184.
Driscoll, K.E., Hassenbein, D.G., Howard, B.W., Isfort, R.J., Cody, D., Tindal, M.H.,
Carter, J.M. 1995. Cloning, expression, and functional characterization of rat
macrophage inflammatory protein 2: a neutrophil chemoattractant and epithelial cell
mitogen. J. Leuk. Biol. 58, 359–364.
Duncan, R., Izzo, L. 2005. Dendrimer biocompatibility and toxicity. Adv. Drug
Delivery Rev. 57, 2215–2237
Emanuele, A. D., Attwood, D. 2005. Dendrimer-drug interactions. Adv. Drug Delivery
Rev. 57, 2147–2162.
Elbekai, R.H and El-Kadi, A.O.S., 2005. The role of oxidative stress in the modulation
of aryl hydrocarbon receptor-regulated genes by As3+, Cd2+, and Cr6+. Free
RadicalBiol. Med. 39, 1499–1511.
Gillies, E.R., Frechet, J.M.J. 2005. Dendrimers and dendritic polymers in drug delivery.
Drug Discovery Today 10, 35-43.

Chapter 7
212
Herzog, E., Byrne, H.J., Casey, A., Davoren, M., Lenz, A-G., Maier, K.L., Duschl,
A., Oostingh, G.J. 2009. SWCNT suppress inflammatory mediator responses in
human lung epithelium in vitro. Toxicology and Applied Pharmacology 234, 378-
390.
http://probes.invitrogen.com/media/pis/g002.pdf, accessed on 16th June 2009.
Huang, R.Q., Qu, Y.H., Ke, W.L., Zhu, J.H., Pei, Y.Y., Jiang, C. 2007. Efficient gene
delivery targeted to brain using a transferrin conjugated polyethylene glycol
modified polyamidoamine dendrimer. FASEB J. 21, 1117-1125.
Hulikova, K., Benson, V., Svoboda, J., Sima, P., Fiserova, A. 2009. N-Acetyl-D-
glucosamine-coated polyamidoamine dendrimer modulates antibody formation via
natural killer cell activation. International Immunopharmacology 9, 792–799.
Kang, H., De-Long, R., Fisher, MH., Juliano, R.L. 2005. Tat-conjugated PAMAM
Dendrimers as delivery agents for antisense and siRNA oligonucleotides.
Pharmaceutical research, 22, 2099-2106.
Khandare, J., Mohr, A., Calderón, M., Welker, P., Licha, K., Haag, R. 2010. Structure-
biocompatibility relationship of dendritic polyglycerol derivatives. Biomaterial, 31,
4268-4277.
Kuo, J.H., Jan, M.S., Lin, Y.L. 2007. Interactions between U-937 human macrophages
and poly(propyleneimine) dendrimers. J. Control Release. 120, 51-9.
Kukowska-Latallo, J.F., Candido, K.A., Cao, Z., Nigavekar, S.S., Majoros, I.J.,
Thomas, T.P., Balogh, L.P., Khan, M.K., Baker, J.R. 2005. Nanoparticle targeting
of anticancer drug improves therapeutic response in animal model of human
epithelial cancer. Cancer Res. 65, 5317-24.
Lanone, S., Boczkowski, J. 2006. Biomedical Applications and Potential Health Risks
of Nanomaterials: Molecular Mechanisms. Curr Mol Med. 6, 651-63.

Chapter 7
213
Lee, C.C., MacKay, J.A., Frechet, J.M.J., Szoka, F.C. 2005. Designing dendrimers for
biological applications. Nat Biotechnol. 23, 1517–1526.
Lee, J.H., Cha, K.E., Kim, M.S., Hong, H.W., Chung, D.J., Ryu, G., Myung, H. 2009.
Nanosized polyamidoamine (PAMAM) dendrimer-induced apoptosis mediated by
mitochondrial dysfunction. Toxicol Lett. 190 , 202–207.
Li, N., Sioutas, C., Cho, A., Schmitz, D., Misra, C., Sempf, J., Wang, M, Oberley, T.,
Froines, J., Nel, A. 2003. Ultrafine particulate pollutants induce oxidative stress and
mitochondrial damage. Environ Health Perspect. 111, 455-60.
Li, N., Xia, T., Nel, A.E. 2008. The role of oxidative stress in ambient particulate
Matter-induced lung diseases and its implications in the toxicity of engineered
nanoparticles. Free Radical Biol. Med. 44, 1689–1699.
Lubos, E., Handy, D.E., Loscalzo, J. 2008. Role of oxidative stress and nitric oxide in
atherothrombosis. Front. Biosci. 13, 5323–5344.
Lynch, I., Cedervall, T., Lundqvist, M., Cabaleiro-Lago, C., Linse, S., Dawson, K.
2007. A. The nanoparticle-protein complex as a biological entity; A complex fluids
and surface science challenge for the 21st century. Adv. Colloid Interface Sci. 13,
4–135.
Maeda, H., Matsumura, Y. 1986. A new concept on macromolecular therapeutics in
cancer chemotherapy: mechanism of tumouritropic accumulation of proteins and the
antitumour agents SMANCS. Cancer Res. 46, 6387-6392.
Monteiller, C., Tran, L., MacNee, W., Faux, S., Jones, A., Miller, B., Donaldson, K.
2007. The proinflammatory effect of low toxicity low solubulity particles,
nanoparticles and fine particles on epithelial cell in vitro: the role of surface area.
Occup. Environ. Med. 64, 609-615.
Chapter 7
214
Mukherjee, S.P., Davoren, M., Byrne, H.J. 2010. In vitro mammalian cytotoxicological
study of PAMAM dendrimers - Towards quantitative structure activity relationships
Toxicol. In Vitro, 24, 169-77.
Mukherjee, S.P., Lyng, F.M., Garcia, A., Davoren, M., Byrne, H.J. 2010. Mechanistic
studies of in vitro cytotoxicity of poly (amidoamine) dendrimers in mammalian
cells. Toxicol Appl Pharmacol. 248, 259-68.
Naha, P.C., Davoren, M., Casey, A., Byrne, H.J. 2009. An ecotoxicological study of
poly(amidoamine dendrimers-towards quantitative structure activity relationship.
Environ. Sci. Technol. 43, 6864-6869.
Nel, A., Xia, T., Madler, L., Ning, L. 2006. Toxic potential of materials at nanolevel.
Science 311, 622-627.
Nel, A.E., Mädler, L., Velegol, D., Xia, T., Hoek, E.M.V., Somasundaran, P.,
Klaessig, F., Castranova V., and Thompson, M. 2009. Understanding
biophysicochemical interactions at the nano–bio interface.Nature materials, 8,
543-557.
Obedoster, G., Obedoster, E., Obedoster. A. 2005. Nanotoxicology: an emerging
discipline evolving from studies of ultrafine particles. Environ. Health Perspect.
113, 823-839.
Organisation for Economic Co-operation and Development, 2001, Guideline (423) for
Testing of Chemicals : Acute Oral Toxicity – Acute Toxic Class Method
(http://www.oecd.org/dataoecd/17/50/1948370.pdf, accessed on 16th March 2010)
Osuchowski, M.F., Siddiqui, J., Copeland, S., Remick D.G. 2005. Sequential ELISA to
profile multiple cytokines from small volumes. Journal of Immunological Methods,
302, 172–181
Chapter 7
215
Osuchowski, M.F., Welch, K., Siddiqui, J., Remick, D.G. 2006. Circulating
Cytokine/Inhibitor Profiles Reshape the Understanding of the SIRS/CARS
Continuum in Sepsis and Predict Mortality. Journal of Immunology, 177, 1967-74.
Park, E.J., Park, K. 2009. Oxidative stress and pro-inflammatory response induced by
silica nanoparticles in vitro and in vivo. Toxicology Letters 184, 18-25.
Ragnvaldsson, D., Berglind, R., Tysklind, M., and Leffler, P. 2007. Environmental
Hazard Screening of a Metal-polluted Site Using Pressurized Liquid Extraction and
Two In vitro Bioassays. A Journal of the Human Environment 36,494-501.
Rahman, I. 2000. Regulation of nuclear factor-κB, activator protein-1, and glutathione
levels by tumor necrosis factor-α and dexamethasone in alveolar epithelial cells,
Biochem. Pharmacol. 60, 1041–1049.
Rajananthanan, P., Attard, G. S., Sheikh, N. A., Morrow, W. J. 1999. Evaluation of
novel aggregate structures as adjuvants: composition, toxicity studies and humoral
responses. Vaccine 17, 715–730.
Sheng, K. C., Kalkanidis, M., Pouniotis, D.S., Esparon, S., Tang, C.K.,
Apostolopoulos, V., Geoffrey, A., Pietersz, G.A. 2008. Delivery of antigen using a
novel mannosylated dendrimer potentiates immunogenicity in vitro and in vivo Eur.
J. Immunol. 38, 424–436.
Stone, V., Johnston, H., Clift, M.J. 2007. Air pollution, ultrafine and nanoparticles
toxicology: cellular and molecular interactions. IEEE Trans. Nanobiosci. 6, 331–
340.
Svenson, S., Tomalia, D. A. 2005. Dendrimers in biomedical applications-reflections on
the field. Adv. Drug Delivery Rev. 57, 2106–2129.
Venuganti, V. V. K., Perumal, O. P. 2008. Effect of Poly(amidoamine) (PAMAM)
dendrimer on skin permeation of 5-fluorouracil. Int. J. Pharm. 361, 230–238.
Chapter 7
216
Walley, K.R., Lukacs, N.W., Standiford, T.J., Strieter, R.M., Kunkel, S.L. 1997.
Elevated levels of macrophage inflammatory protein 2 in severe murine peritonitis
increase neutrophil recruitment and mortality. Infect. Immun. 65, 3847-3851.
Wang, W., Xiong, W., Wan, J., Sun, X., Xu, H., Yang, X. 2009. The decrease of
PAMAM dendrimer-induced cytotoxicity by PEGylation via attenuation of
oxidative stress. Nanotechnology, 11;20(10):105103.
Xia, T., Kovochich, M., Liong M., Zink J.I., Nel, A. E. 2008. Cationic Polystyrene
Nanosphere Toxicity Depends on Cell-Specific Endocytic and Mitochondrial Injury
Pathways. ACS Nano, 2, 85-96.
Xia, T., Kovochich, M., Brant, J., Hotze, M., Sempf, J., Oberley, T., Sioutas, C., Yeh, J.
I., Wiesner, M. R., Nel, A. E. 2006. Comparison of the Abilities of Ambient and
Manufactured Nanoparticles to Induce Cellular Toxicity According to an Oxidative
Stress Paradigm. Nano Lett. 6, 1794–1807.
Yoo, H., Juliano, R.L. 2000. Enhanced delivery of antisense oligonucleotides with
fluorophore-conjugated PAMAM dendrimers. Nucleic acid Research. 28, 4225-
4231.

Chapter 8
217
Chapter 8
Conclusion

Chapter 8
218
Polymeric nanoparticles have been investigated for a wide range of potential
applications, especially in the biomedical field, in terms of drug, gene, and vaccine
delivery vectors as well as for MRI contrast agents for diagnosis. Given the potential
widespread use of both the series of polymeric nanomaterials (PAMAM dendrimers,
PNIPAM and NIPAM/BAM copolymer nanoparticles), there is an urgent need for
information regarding the human health and environmental implications of exposure to
these polymeric nanomaterials. In terms of human exposure, considerable attention has
been devoted of late to the potential effects of exposure to nanomaterials. However, the
field of eco-(nano) toxicology is still relatively new and there is a dearth of quantitative
structure activity relationships established for nanomaterials. Thus, this study has
utilised both human and aquatic models.
In the case of polymeric nanoparticles, the structurally well defined and variable
macromolecules can also provide a further basis upon which to establish structure
activity relationships governing eco and mammalian-toxicological responses which may
serve to develop a fundamental understanding of their interactions and as guidelines for
the future prediction of responses. In the case of PNIPAM and NIPAM/BAM
nanoparticles, a systematically varied surface morphology is achieved as the ratio of
BAM increases, the amount of N-H groups exposed at the surface decreases, and the
amount of -C-(CH3)3 groups increases, reducing the hydrophillicity of the resulting
copolymer. The systematically varied molecular PAMAM dendrimer nanostructures
potentially provide a route towards an understanding of the dependence of the
interactions on the physico-chemical properties of nanomaterials. Both the polymer
particles were selected to understand the correlation between physico-chemical
properties and toxicological impact of these nanomaterials to the human health as well
as to the environment. As such, independent of their potential applications, the particle
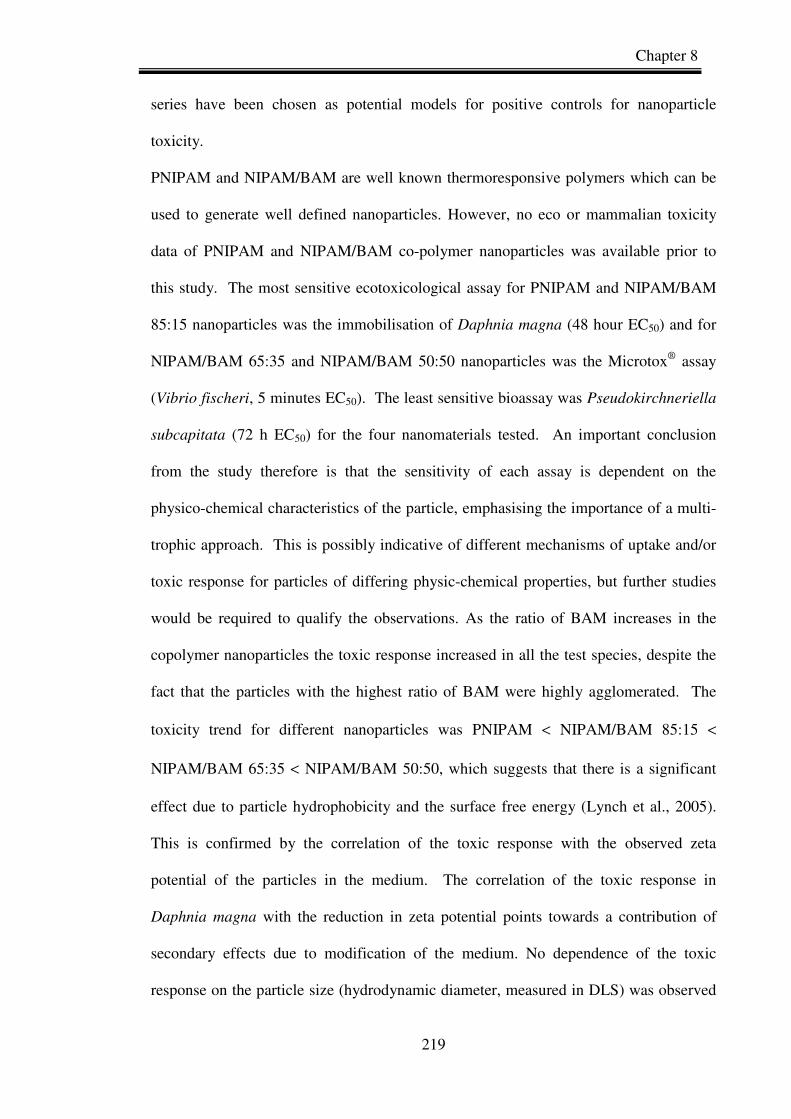
Chapter 8
219
series have been chosen as potential models for positive controls for nanoparticle
toxicity.
PNIPAM and NIPAM/BAM are well known thermoresponsive polymers which can be
used to generate well defined nanoparticles. However, no eco or mammalian toxicity
data of PNIPAM and NIPAM/BAM co-polymer nanoparticles was available prior to
this study. The most sensitive ecotoxicological assay for PNIPAM and NIPAM/BAM
85:15 nanoparticles was the immobilisation of Daphnia magna (48 hour EC50) and for
NIPAM/BAM 65:35 and NIPAM/BAM 50:50 nanoparticles was the Microtox® assay
(Vibrio fischeri, 5 minutes EC50). The least sensitive bioassay was Pseudokirchneriella
subcapitata (72 h EC50) for the four nanomaterials tested. An important conclusion
from the study therefore is that the sensitivity of each assay is dependent on the
physico-chemical characteristics of the particle, emphasising the importance of a multi-
trophic approach. This is possibly indicative of different mechanisms of uptake and/or
toxic response for particles of differing physic-chemical properties, but further studies
would be required to qualify the observations. As the ratio of BAM increases in the
copolymer nanoparticles the toxic response increased in all the test species, despite the
fact that the particles with the highest ratio of BAM were highly agglomerated. The
toxicity trend for different nanoparticles was PNIPAM < NIPAM/BAM 85:15 <
NIPAM/BAM 65:35 < NIPAM/BAM 50:50, which suggests that there is a significant
effect due to particle hydrophobicity and the surface free energy (Lynch et al., 2005).
This is confirmed by the correlation of the toxic response with the observed zeta
potential of the particles in the medium. The correlation of the toxic response in
Daphnia magna with the reduction in zeta potential points towards a contribution of
secondary effects due to modification of the medium. No dependence of the toxic
response on the particle size (hydrodynamic diameter, measured in DLS) was observed
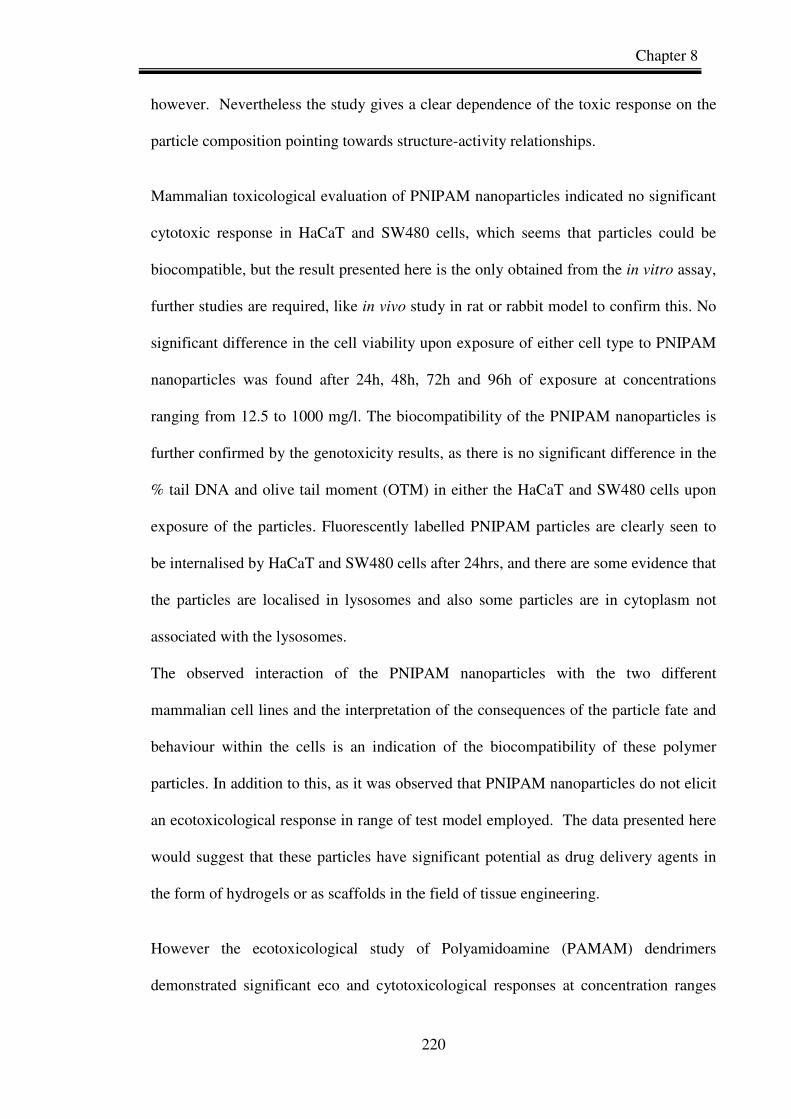
Chapter 8
220
however. Nevertheless the study gives a clear dependence of the toxic response on the
particle composition pointing towards structure-activity relationships.
Mammalian toxicological evaluation of PNIPAM nanoparticles indicated no significant
cytotoxic response in HaCaT and SW480 cells, which seems that particles could be
biocompatible, but the result presented here is the only obtained from the in vitro assay,
further studies are required, like in vivo study in rat or rabbit model to confirm this. No
significant difference in the cell viability upon exposure of either cell type to PNIPAM
nanoparticles was found after 24h, 48h, 72h and 96h of exposure at concentrations
ranging from 12.5 to 1000 mg/l. The biocompatibility of the PNIPAM nanoparticles is
further confirmed by the genotoxicity results, as there is no significant difference in the
% tail DNA and olive tail moment (OTM) in either the HaCaT and SW480 cells upon
exposure of the particles. Fluorescently labelled PNIPAM particles are clearly seen to
be internalised by HaCaT and SW480 cells after 24hrs, and there are some evidence that
the particles are localised in lysosomes and also some particles are in cytoplasm not
associated with the lysosomes.
The observed interaction of the PNIPAM nanoparticles with the two different
mammalian cell lines and the interpretation of the consequences of the particle fate and
behaviour within the cells is an indication of the biocompatibility of these polymer
particles. In addition to this, as it was observed that PNIPAM nanoparticles do not elicit
an ecotoxicological response in range of test model employed. The data presented here
would suggest that these particles have significant potential as drug delivery agents in
the form of hydrogels or as scaffolds in the field of tissue engineering.
However the ecotoxicological study of Polyamidoamine (PAMAM) dendrimers
demonstrated significant eco and cytotoxicological responses at concentration ranges

Chapter 8
221
from 0.13 µM to 16.30 µM. For all generations of PAMAM dendrimer tested, the
Daphnia magna was shown to be the most sensitive test model, the RTG-2 cell line
being the least sensitive. The ecotoxicological response was seen to correlate well with
the generation of PAMAM dendrimers and therefore with the particle surface area. The
surface chemistry is unaltered in successive generations, and thus a clear and direct
relationship between the physical parameter and the toxic response is inferred. The
physico- chemical characteristics, most notably the zeta potential of the particles, were
seen to change dependant on the dispersion medium, however, and the correlation of the
toxic response to these changes may point towards an interaction with the medium
resulting in a change in effective composition as an underlying source of the toxic
response. Successive generations present a larger number of surface amino groups for
interaction with the media, and thus a larger toxic response. Such an indirect effect can
not be considered as the sole origin; however, as is seen by comparison of the PAMAM
dendrimers with the NIPAM/BAM copolymer nanoparticles and mechanisms of
internalisation resulting in a direct toxic response should be investigated for all models.
A significant genotoxicity and apoptosis response in PLHC-1 cells was observed upon
the exposure to PAMAM dendrimers. The generation dependence (G6 > G5 > G4) of
the production of increased intracellular ROS, DNA damage, apoptosis and the
cytotoxicity in the PLHC-1 cells, indicates the direct effects of the positively charged
surface amino groups.
The immunotoxicity of PAMAM dendrimers was investigated in mouse macrophage
cells (J774A.1) in vitro at a concentration of 0.013 to 6 µM. Generation dependent
immunotoxicological response of PAMAM dendrimer was observed in J774A.1 cells.
The generation dependence (G6 > G5 > G4) of the production of increased intracellular
ROS, inflammatory mediators and the cytotoxicity. The mechanism of the toxic
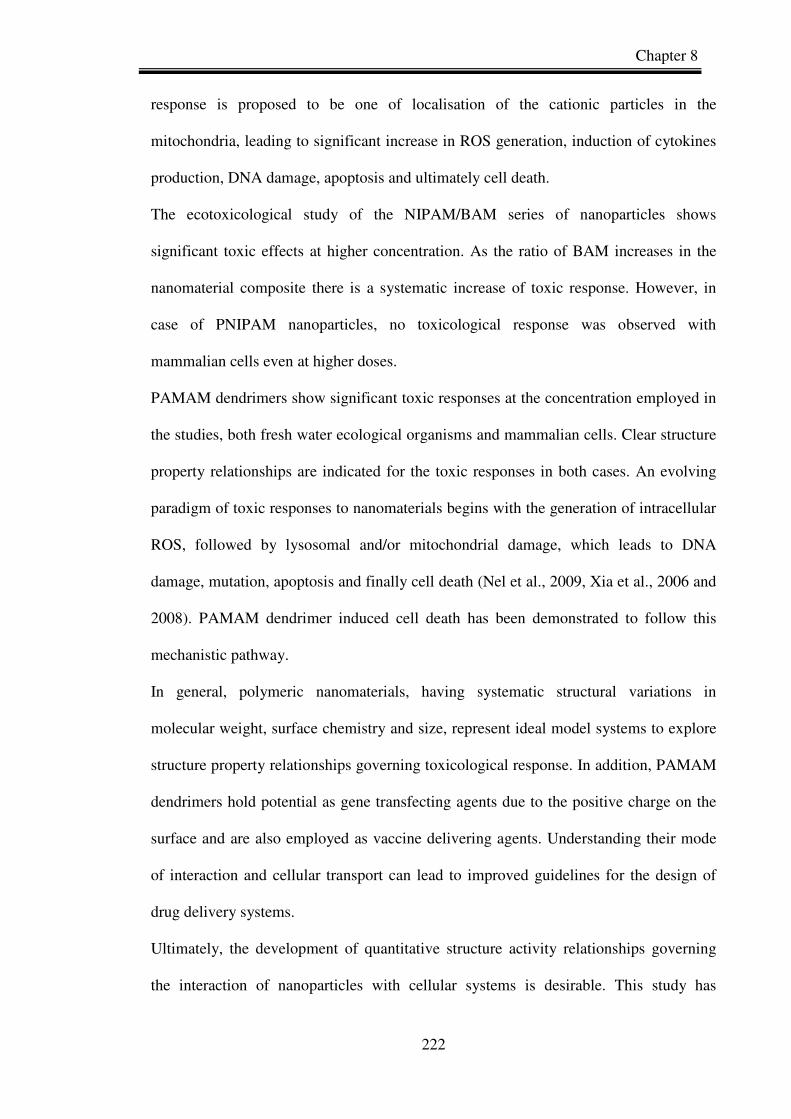
Chapter 8
222
response is proposed to be one of localisation of the cationic particles in the
mitochondria, leading to significant increase in ROS generation, induction of cytokines
production, DNA damage, apoptosis and ultimately cell death.
The ecotoxicological study of the NIPAM/BAM series of nanoparticles shows
significant toxic effects at higher concentration. As the ratio of BAM increases in the
nanomaterial composite there is a systematic increase of toxic response. However, in
case of PNIPAM nanoparticles, no toxicological response was observed with
mammalian cells even at higher doses.
PAMAM dendrimers show significant toxic responses at the concentration employed in
the studies, both fresh water ecological organisms and mammalian cells. Clear structure
property relationships are indicated for the toxic responses in both cases. An evolving
paradigm of toxic responses to nanomaterials begins with the generation of intracellular
ROS, followed by lysosomal and/or mitochondrial damage, which leads to DNA
damage, mutation, apoptosis and finally cell death (Nel et al., 2009, Xia et al., 2006 and
2008). PAMAM dendrimer induced cell death has been demonstrated to follow this
mechanistic pathway.
In general, polymeric nanomaterials, having systematic structural variations in
molecular weight, surface chemistry and size, represent ideal model systems to explore
structure property relationships governing toxicological response. In addition, PAMAM
dendrimers hold potential as gene transfecting agents due to the positive charge on the
surface and are also employed as vaccine delivering agents. Understanding their mode
of interaction and cellular transport can lead to improved guidelines for the design of
drug delivery systems.
Ultimately, the development of quantitative structure activity relationships governing
the interaction of nanoparticles with cellular systems is desirable. This study has
Chapter 8
223
indicated that systematic variation of physic-chemical properties may be the foundation
of such relationships.

Chapter 8
224
References
Lynch, I., Blute, I.A., Zhmud, B., MacArtain, P., Tosetto, M., Allen, L.T., Byrne, H.J.,
Farrell, G.F., Keenan, A.K., Gallagher, W.M., Dawson, K.A. 2005. Correlation of
the Adhesive Properties of Cells to N-Isopropylacrylamide/N-tert-Butylacrylamide
Copolymer Surfaces with Changes in Surface Structure Using Contact Angle
Measurements, Molecular Simulations, and Raman Spectroscopy. Chem. Mater.
17, 3889 - 3898.
Nel, A.E., Mädler, L., Velegol, D., Xia, T., Hoek, E.M.V., Somasundaran, P.,
Klaessig, F., Castranova V., and Thompson, M. 2009. Understanding
biophysicochemical interactions at the nano–bio interface.Nature materials, 8,
543-557.
Xia, T., Kovochich, M., Liong, M., Mädler, L., Gilbert, B., Shi, H., Yeh, J.I., Zink, J.I.,
Nel A.E. 2008. Comparison of the mechanism of toxicity of zinc oxide and cerium
oxide nanoparticles based on dissolution and oxidative stress properties. Am.
Chem. Soc. Nano. 2, 2121–2134.
Xia, T., Kovochich, M, Brant J., Hotze, M., Sempf, J., Oberley, T., Sioutas, C., Yeh, J.
I., Wiesner, M. R., Nel, A.E. 2006. Comparison of the abilities of ambient and
manufactured nanoparticles to induce cellular toxicity according to an oxidative
stress paradigm. Nano Letter. 6, 1794–1807.

Appendices
225
Appendices

Appendices
226
Appendix I: Supporting Information
1.1 PNIPAM and NIPAM/BAM co-polymer nanoparticles
Poly N-isopropylacrylamide (PNIPAM) and N-isopropylacrylamide-co-N-tert-
butylacrylamide (NIPAM/BAM) copolymer particles with systematically varied ratios
of the respective monomers (85:15, 65:35, and 50:50 NIPAM/BAM) were made
available by University College Dublin through the “Integrated NanoScience Platform
for Ireland” collaborative programme (www.inspirenano.com). They were synthesised
by free radical polymerisation (Cedervall, et al., 2007). In brief, the synthetic procedure
, as supplied by UCD, was as follows: 2.8g monomers (in the appropriate ratios by
weight), and 0.28g crosslinker (N,N-methylenebisacrylamide) were dissolved in 190 ml
MilliQ water (MQ) with 0.8 g Sodium Dodecyl Sulphate (SDS) and the solution was
degassed by bubbling with nitrogen gas for 30 minutes. Polymerisation was induced by
adding 0.095g ammonium persulfate initiator in 10 ml MQ water and heating at 70°C
for 4 hours. Particles were extensively dialysed with MQ water for several weeks, the
water being changed daily, until no traces of monomers, crosslinker, initiator or SDS
could be detected by proton NMR (spectra acquired in D2O using a 500 MHz Varian
Inova spectrometer). Particles were freeze-dried and stored in the fridge until used.
Due to the inverse solubility of PNIPAM and NIPAM/BAM particles, solutions for
exposure studies were prepared by dispersing the particles on ice to ensure good
solubility of the particles (i.e. to ensure that the solutions are below the lower critical
solution temperature of the particles and thus that polymer-water contacts are more
favourable than polymer-polymer contacts which would result in uptake of water and
swelling of the particles), before gradually warming them to the test conditions.
Fluorescently tagged NIPAM nanoparticles with nominally 500 fluorescent labels per
particle were also synthesized within the “Integrated NanoScience Platform for Ireland”
Appendices
227
collaborative programme (www.inspirenano.com). In brief, the synthetic procedure, as
supplied by UCD, was as follows. 0.1 g of SDS was mixed with 0.0044 g of
methacryloxyethyl thiocarbamoyl Rhodamine B in 10 ml of MQ water and the mixture
was sonicated using a Covaris S2 system at a frequency of 450 kHz for 500 seconds
until most of the dye was visibly dissolved. The solution was transferred into a falcon
tube adding an additional 10 ml MQ water together with the rest the SDS (0.3 g) and
was then sonicated using an ultrasonic bath (Branson 1510) at a frequency of 42 kHz for
5 hours continuously until the dye was completely dissolved in the SDS. The monomers
(1.4 g of NIPAM, 0.14 g of cross linker) were added to this solution with 75 ml of MQ
water, stirred for 30 minutes under nitrogen flow to remove dissolved O2, heated at
70°C and then the synthesis was performed by adding a degassed solution composed of
0.0475 g of initiator diluted in 5 ml of MQ water. The reaction was carried out for 12
hours at 70°C and under nitrogen flow. The labelled particles were dialysed against
ethanol for 6 days and then extensively dialysed in ultrapure water, freeze dried and
stored at 4°C. Any unreacted dye was removed by extensive dialysis to ensure that the
fluorescence detected during internalisation studies was truly representative of
nanoparticles. (Personal communication, Iseult Lynch).
1.2 Transmission electron microscopy (TEM) study
In the case of PNIPAM particles, particle size was also determined by Electron
Microscopy. Samples were prepared by negative-contrast staining as described
previously (Gorelov et al 1997). Briefly, stock solutions of tungstophosphoric acid
(TPA, 200 mg / ml) (Fluka) and labelled NIPAM nanoparticles (5mg / ml) were
prepared in water, and were left in a drying cabinet for about 2 hours at 55°C. The
mixing of the final solution and the sample preparation was performed in the drying
cabinet at a constant temperature of 55 °C. The final solution contained 20 mg / ml of
Appendices
228
TPA and 4.5 mg /ml of NIPAM nanoparticles, and was left in the drying cabinet for
about 15 minutes together with the TEM grids. A drop of this final solution was placed
on the grid and immediately soaked with filter paper in order to leave on the grid a thin
film of nanoparticles, in this way minimising the nanoparticle agglomeration during the
drop drying time. Samples were investigated in a TECNAI G 2 12 TWIN TEM using an
acceleration voltage of 120 kV and objective aperture of 20 µm. Digital images were
recorded with a MegaView III (SIS) camera.
Appendices
229
Appendix II: Publications
� Pratap C. Naha, V. Kanchan, P.K. Manna, Amulya K. Panda. 2008. Improved
bioavailability of orally delivered insulin using Eudragit L 30D coated PLGA
microparticle. Journal of Microencapsulation, 25, 248-256.
� Pratap C. Naha, V. Kanchan and Amulya K. Panda. Evaluation of parenteral
depot insulin formulation using PLGA and PLA microparticles. Journal of
Biomaterial Applications, 2009. 24 (4):309-25.
� Pratap C. Naha, Alan Casey, Tiziana Tenuta, Iseult Lynch, Kenneth A.
Dawson, Hugh J. Byrne, Maria Davoren. Preparation and characterisation of
NIPAM and NIPAM/BAM co-polymer nanoparticles and their acute toxicity
testing using an aquatic test battery. Aquatic Toxicology, 2009. 92, 146-154.
� Pratap C. Naha, Maria Davoren, Alan Casey and Hugh J. Byrne. An
Ecotoxicological study of Poly (amidoamine) Dendrimers-Towards Quantitaive
Structure Activity Relationship. Environmental Science and Technology,
2009. 43(17):6864-6869.
� Pratap C. Naha, Maria Davoren, Fiona M. Lyng and Hugh J. Byrne. Oxidative
stress induced inflammatory response and cytotoxicity of PAMAM dendrimers
in J774A.1 cells. (2010). Toxicology and Applied Pharmacology, 246 (1-2),
91-99.
� Pratap C. Naha, Kunal Bhattacharya, Tiziana Tenuta, Kenneth A. Dawson,
Iseult Lynch, Amaya Gracia, Fiona M. Lyng , Hugh J. Byrne. Intracellular
localisation, Geno- and Cytotoxic response of Poly N-isopropylacrylamide
(PNIPAM) nanoparticles to human keratinocyte (HaCaT) and colon cells (SW
480). Toxicology Letters. (2010), 198, 134-143.
� Pratap C. Naha, S. Madhusudan, P. K Manna, Hugh J. Byrne and Amulya K.
Panda. Role of polymeric excipients on controlled release profile of Glipizide
from PLGA and Eudragit RS 100 Nanoparticles. (December, 2010),
Biomedical materials. (Submitted).
� Kunal Bhattacharya, Pratap C. Naha, Andrew Kellet, Fiona Lyng, Izabela
Neydenova, Svetlana Mintova, Hugh J Byrne. Biocompatability of silica based
Zeolite-MFI nanoparticles in human lung cells. (2011). (In Preparation).
Appendices
230
� Pratap C. Naha and Hugh J. Byrne. Oxidative stress induced DNA damage and
apoptosis by PAMAM dendrimers in PLHC-1 cells. (2011), (In preparation).
Appendices
231
Appendix III: Presentations
� Pratap C. Naha, Maria Davoren, Iseult Lynch, Kenneth Dawson, Hugh J.
Byrne. Preparation, characterisation and ecotoxicological evaluation of
P(NIPAM) and NIPAM:BAM co-polymer nanoparticles. NanoimpactNet
Conference, 25th March, 2009. Lausanne, Switzerland. (Oral Presentation)
� Pratap C. Naha and Hugh J. Byrne. Ecotoxicological Assessment of Polymeric
Nanoparticles of Technological Relevance. 6th May 2009, NanoBio INSPIRE
meeting, Tyndal Institute, Cork, Ireland. (Oral Presentation)
� Pratap C. Naha, Hugh J. Byrne, Iseult Lynch, Kenneth A. Dawson, Maria
Davoren. Physico-Chemical Properties And Structure Activity Relationship Are
Key Factors For Ecotoxicity Of Polymeric Nanoparticles. 1st June 2009, 19th
Annual Meeting SETAC Europe. Goteborg, Sweden. (Poster presentation).
� Pratap C. Naha, Maria Davoren, Tiziana Tenuta, Iseult Lynch, Kenneth
Dawson, Hugh J. Byrne. Structurally Dependent Ecotoxicity of Polymeric
Nanoparticles. 15th & 16th October 2009. INSPIRE NanoBio conference,
Dublin, Ireland. (Poster presentation).
� Pratap C. Naha, Maria Davoren, Fiona M. Lyng and Hugh J. Byrne. Oxidative
stress induced inflammatory response and cytotoxicity of PAMAM dendrimers
in J774A.1 cells. 2nd - 4th June 2010. 3rd International Conference on
Nanotoxicology, Edinburgh Napier University, Edinburgh UK. (Poster
presentation).
� Pratap C. Naha; Tiziana Tenuta; Kenneth A. Dawson; Iseult Lynch; Fiona M.
Lyng; Hugh J. Byrne. Interaction of Poly N-isopropylacrylamide (PNIPAM)
nanoparticles with human keratinocyte (HaCaT) and colon cells (SW 480). 20-
21st October 2010, INSPIRE NanoBio conference, Dublin, Ireland. (Poster
presentation).
� Pratap C. Naha, Maria Davoren and Hugh J. Byrne. Interaction of nanosized
Poly (amido) amine dendrimers with fresh water ecological organisms and fish
cells. 15th -19th May 2011., 21st Annual Meeting SETAC Europe. Milan,
Italy. (Oral presentation).
�
Appendices
232
Appendix IVI: Conference and Workshop Attendance
1. 2nd International Conference on Nanotoxicology September, 2008, Zurich,
Switzerland.
2. NanoImpactnet workshop, June 2008, UCD, Dublin, Ireland.
3. 1ST NanoImpactnet Conference March 2009, Lusanne, Switzerland.
4. 19th SETAC Annual meeting June 2009, Goteborg, Sweden.
5. 1st International NanoBio Conference, October 2009, Dublin, Ireland
6. 3rd International Conference on Nanotoxicology 2nd - 4th June 2010. 3rd
International Conference on Nanotoxicology, Edinburgh Napier University,
Edinburgh UK.
7. NanoImpactnet workshop, 6-9 September 2010, Hazard Assessment of
Nanomaterials.UCD, Dublin, Ireland.
8. BioNano Conference, 20-21st October 2010. UCD, Dublin, Ireland.
9. VIth Annual meeting of Irish cytometry society. November 17th and 18th 2010,
Dublin, Ireland.
10. 21st SETAC Annual meeting May 2011, Milan, Italy
Curriculum Vitae
233
Curriculum Vitae
Pratap C. Naha Radiation and Environmental Science Centre (RESC) FOCAS Research Institute. Dublin Institute of Technology Kevin Street, Dublin-8, Ireland E Mail : [email protected] [email protected] [email protected] Phone : +353 1 402 7956 (Office) +353 879421303 (Moblile)
Educational Qualification 2008/05 – 03/2011 : Ph.D Dublin Institute of Technology Supervisor: Prof. Hugh J. Byrne 2006/07 – 2008/04: Project assistance National Institute of Immunology Supervisor: Dr. Amulya K. Panda 2004 – 2006: Master in Pharmacy (M. Pharm; Pharmacology) Dept. of Pharmacy; Annamalai University; First Division with GPA 8.58. 2000-2004: Bachelor in Pharmacy (B.Pharm.) Institute of Pharmacy and Technology, Biju Pattnaik University of Technology, (BPUT) First Division (77% marks).
Research Experience 05/2008 – 03/2011: (Focas Research Institute, DIT, Dublin, Ireland)
• Eco and In vitro mammalian totoxicological assessment of Polymeric nanomaterials.
Curriculum Vitae
234
07/2006 – 04/2008: (National Institute of Immunology; New Delhi, India)
• Scale up and evaluation of biodegradable polymer particle formulations for
single dose vaccine.
• Improved immunogenicity of enterovirus antigen by use of microparticle
carrier: a proof of principle study for development of multi-variant enterovirus
vaccine.
2004–2006: (Dept. of Pharmacy, Annamalai University and National Institute of Immunology)
• Development and Characterization of Novel Polymeric Microspheres for sustained oral and intramuscular delivery of Insulin.
Scientific Skills
During Ph.D
• Characterization of nanoparticles in terms of hydrodynamic diameter, zeta
potential, and the BET surface area measurement.
• Cell culture like HaCaT, SW480, J774A.1, PLHC-1 and RTG-2 cells.
• Cytotoxic Assays like, MTT, Alamar blue, Neutral red, Clonogenic assay.
• Interaction of nanomaterials with dye and cell culture medium study was
performed with UV/Visible spectroscopy and fluorometric technique.
• Uptake and co-localisation study of nanoparticles within the cells by Confocal
Laser Scanning Microscope (CLSM) and live cell observer.
• Mechanistic pathway of nanoparticles induced toxicity was studied in terms of
Reactive Oxygen Species (ROS) generation, Mitochondrial membrane potential
(MMP), DNA damage (by Alkaline Comet assay), Oxidative DNA damage, like
formation of DNA adduct (8-OHdG), inflammatory response (IL-6, IL-8, TNF-
∝, and MIP-2, by ELISA), and Apoptosis assay (by Flowcytometer).
Curriculum Vitae
235
• Toxicological screening procedure of PAMAM dendrimers (G4, G5 and G6)
and PNIPAM/BAM series of nanoparticles in both mammalian cells and fresh
water organisms, repressing different trophic level for the Ecotoxicological
evaluation.
• Ecotoxicity assessment of PAMAM dendrimers (G4, G5 and G6) and
PNIPAM/BAM series of nanoparticles using a battery of bioassays like
Microtox assay, Algal growth inhibition assay, Immobilisation of Daphnia
magna, Thamnocephalus assay, chronic toxicity assay with Daphnia magna
(Reproductive toxicity) and the cytotoxicity assessment in two fish cell line
(PLHC-1 and RTG-2) to represents a secondary consumer in fresh water
ecosystem.
During Project Assistant at National Institute of Immunology, India.
• Techniques related to development of novel drug delivery systems e.g.
liposome’s, microspheres, nanoparticles, SLN (solid-lipid nanoparticles) and
Dendrimers. Spray-drying technique for production of polymeric nano and
microparticles and development of delivery system for poorly soluble drugs and
proteins.
• Improvement of immunogenicity (of viral proteins like Rota virus and Entero
virus; Tetanus Toxoid; DPT; HBSAg) by polymeric microparticles.
• In vivo study (Rat and Mice model) for the immunological response of the
antigen entrapped polymeric microparticles; especially for the evaluation of
humoral and T- cell response. And also for the memory response against the
antigen (TT, DPT) entrapped polymeric microparticles (PLA and PLGA).
• In vivo anti-diabetic evaluation of insulin loaded Eudragit coated PLGA
microparticles in rat model (Both oral and parenteral route).

Curriculum Vitae
236
• Isolation and high throughput protein purification techniques (Human growth
hormone, SOD etc).
• Techniques like ELISA, RIA, ELISPOT, Flow Cytometry, Western Blot, SDS-
PAGE and chromatographic techniques (like FPLC, Ion exchange, Size
exclusion) for protein purification.
Publications
• Pratap C. Naha, V. Kanchan, P.K. Manna, Amulya K. Panda. 2008. Improved
bioavailability of orally delivered insulin using Eudragit L 30D coated PLGA
microparticle. Journal of Microencapsulation, 25, 248-256.
• Pratap C. Naha, V. Kanchan and Amulya K. Panda. Evaluation of parenteral
depot insulin formulation using PLGA and PLA microparticles. Journal of
Biomaterial Applications, 2009. 24 (4):309-25.
• Pratap C. Naha, Alan Casey, Tiziana Tenuta, Iseult Lynch, Kenneth A.
Dawson, Hugh J. Byrne, Maria Davoren. Preparation and characterisation of
NIPAM and NIPAM/BAM co-polymer nanoparticles and their acute toxicity
testing using an aquatic test battery. (2009), Aqatic Toxicology, 92, 146-154.
• Pratap C. Naha, Maria Davoren, Alan Casey and Hugh J. Byrne. An
Ecotoxicological study of Poly (amidoamine) Dendrimers-Towards Quantitaive
Structure Activity Relationship. (2009). Environmental Science and
Technology, 43(17):6864-6869.
• Pratap C. Naha, Maria Davoren, Fiona M. Lyng and Hugh J. Byrne. Oxidative
stress induced inflammatory response and cytotoxicity of PAMAM dendrimers
in J774A.1 cells. (2010). Toxicology and Applied Pharmacology. 246 (1-2),
91-99.

Curriculum Vitae
237
• Pratap C. Naha, Kunal Bhattacharya, Tiziana Tenuta, Kenneth A. Dawson,
Iseult Lynch, Amaya Gracia, Fiona M. Lyng , Hugh J. Byrne. Intracellular
localisation, Geno- and Cytotoxic response of Poly N-isopropylacrylamide
(PNIPAM) nanoparticles to human keratinocyte (HaCaT) and colon cells (SW
480). (2010) Toxicology Letters, 198, 134-143.
• Pratap C. Naha, S. Madhusudan, P. K Manna, Hugh J. Byrne and Amulya K.
Panda. Role of polymeric excipients on controlled release profile of Glipizide
from PLGA and Eudragit RS 100 Nanoparticles. Biomedical Materials,
(Submitted, December 2010).
• Kunal Bhattacharya, Pratap C. Naha, Andrew Kellet, Fiona Lyng, Izabela
Neydenova, Svetlana Mintova, Hugh J Byrne. Biocompatability of silica based
Zeolite-MFI nanoparticles in human lung cells. (2011). (In Preparation).
• Pratap C. Naha and Hugh J. Byrne. Oxidative stress induced DNA damage and
apoptosis by PAMAM dendrimers in PLHC-1 cells. (In preparation).
Conference Presentations
• Pratap C. Naha, Maria Davoren, Iseult Lynch, Kenneth Dawson, Hugh J. Byrne.
Preparation, characterisation and ecotoxicological evaluation of P(NIPAM) and
NIPAM:BAM co-polymer nanoparticles. NanoimpactNet Conference, 25th
March, 2009. Lausanne, Switzerland. (Oral Presentation)
• Pratap C. Naha and Hugh J. Byrne. Ecotoxicological Assessment of Polymeric
Nanoparticles of Technological Relevance. 6th May 2009, NanoBio INSPIRE
meeting, Tyndal Institute, Cork, Ireland. (Oral Presentation)
Curriculum Vitae
238
• Pratap C. Naha, Hugh J. Byrne, Iseult Lynch, Kenneth A. Dawson, Maria
Davoren. Physico-Chemical Properties And Structure Activity Relationship Are
Key Factors For Ecotoxicity Of Polymeric Nanoparticles. 1st June 2009, 19th
Annual Meeting SETAC Europe. Goteborg, Sweden. (Poster presentation).
• Pratap C. Naha, Maria Davoren, Tiziana Tenuta, Iseult Lynch, Kenneth Dawson,
Hugh J. Byrne. Structurally Dependent Ecotoxicity of Polymeric Nanoparticles.
15th & 16th October 2009. INSPIRE NanoBio conference, Dublin, Ireland.
(Poster presentation).
• Pratap C. Naha, Maria Davoren, Fiona M. Lyng, Hugh J. Byrne. Oxidative stress
induced inflammatory response and cytotoxicity of PAMAM dendrimers in
J774A.1 Cells. 2nd -4th June 2010, 3rd International Nanotoxicology
conference. Edinburgh, UK. (Poster presentation).
Reference
Prof. Hugh J. Byrne Director, FOCAS Research Institute, Dublin Institute of Technology (DIT). Kevin Street, Dublin-8. Ireland. E mail: [email protected] Phone : +353 1 4027900 Fax : +353 1 402 7901 I, hereby assure that the statements mentioned in this CV are true in the best of my knowledge. Dublin, Ireland. ` Pratap C. Naha


