

Ecological Outcomes from Flow Regimes in the
Murray-Darling Basin
Ian Overton
RiverSymposium
24/09/2009
Water for a Healthy Country

Project Team
• Sue Cuddy
• Matt Colloff
• Brent Henderson
• Tanya Doody
• Gary Caitchen
• Kim Pullen
• Heather McGinness
• Linda Merrin
• Carmel Cattalini
• Warren Jin
• Elliot Dovers
• Petra Kuhnert
• Paul Wettin
• Dave Penton
• Ian Szarka
• Tony Arthur
• Juan-Pablo Guerschman
• Julian Reid
• Jane Roberts
• Rod Oliver
• Mike Geddes
• Michael Stewardson
• Darren Baldwin
• George Ganf
• Richard Norris
• Qifeng Ye
• Robyn Watts
• Simon Treadwell
• Danny Simpson

NWC Ecological Outcomes Project
• Funded by the National Water Commission under the
„Raising National Standards Programme‟
• “While various environmental flow guidelines have been
developed through expert panels and from general
ecological principles, it is now timely to seek empirical
datasets to test and shed further light on these
principles”.

NWC Ecological Outcomes Project
The project was original designed to provide scientific
evidence for ecological outcomes for flow regimes
• What are the hypotheses from science and
management?
• What are the critical biophysical and flow links
(conceptual models)?
• What data is available to test?
• What hypotheses can we test?
• How transferable are these relationships?

Ecosystem Areas
• Geomorphology - Michael Stewardson
• Biogeochemistry - Darren Baldwin
• Plankton - Rod Oliver
• Invertebrates - Richard Norris
• Fish - Qifeng Ye
• Birds - Julian Reid
• Floodplain Vegetation - Jane Roberts
• Ecosystem Function - Matt Colloff
• Estuary - Mikes Geddes

Data Identified
• 269 Databases of 461 datasets
• Metadata inventory available
9%
19%
19%
13%
9%4%
10%
10%
5%
4%
41
15
36
76
75
39
51
19
38
15
Biogeochemistry
Plankton
Macroinvertebrates
Native fish
Waterbirds
Aquatic vegetation
Riparian/floodplain vegetation
Ecosystem function
Geomorphology
Estuary
The number and percentage of datasets identified in each of the 10 ecosystem areas.
The number and percentage of datasets identified by sector.
20
56
12
181
Academic
Federal
Other
State
7%
21%
4%
67%
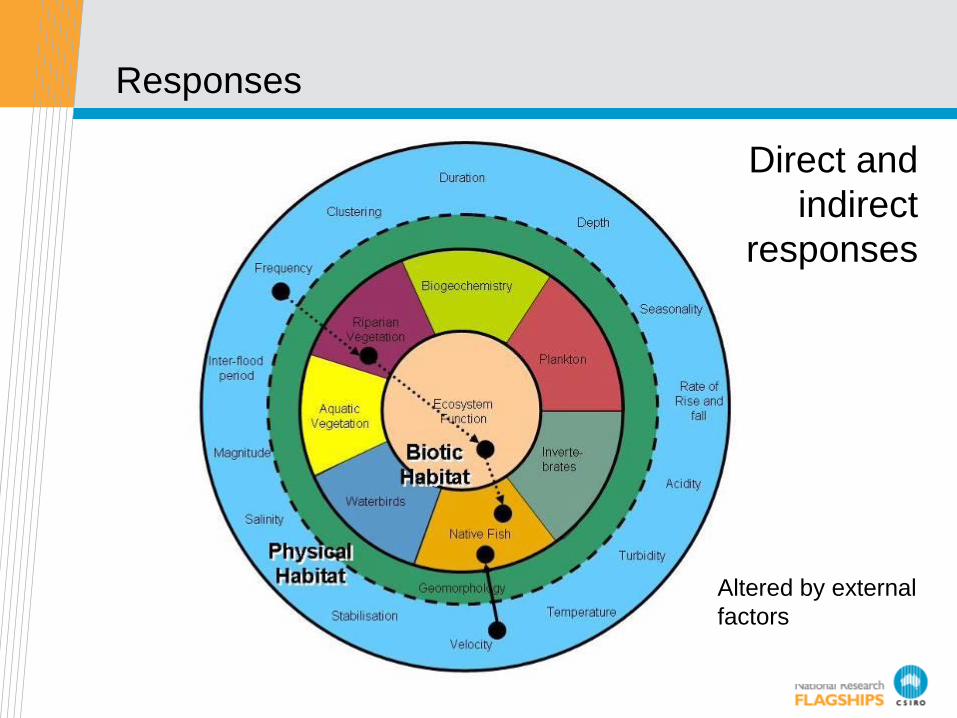
Responses
Direct and
indirect
responses
Altered by external
factors


Ecosystem Response Conceptual Model

Management Plans
• 79 Management plans
5%
22%
29%
42%
3%4
17
23
33
0
2
Qld
NSW
VIC
SA
ACT
Estuary
The number of management plans in each region.
• How are plans developed?
• How are plans implemented?
• What do you do if you do not have enough water?
• What ecological outcomes do you manage with
flows?

Management Plans
Trends in the science supporting environmental water management hypotheses
Southern basin plans
• aspirational and science based hypotheses
• eg Eflow studies in Vic and MFAT for Murray.
• Science has been synthesized to flow/water needs recommendations
• Improved tools and hydrodynamic models for Icon sites
Northern basin plans
• aspirational hypotheses with less science support
• not synthesized with flow/water needs recommendations (Narran exception)
• “asset” level plans being developed Marshes, Gwydir
• DSS developed and hydrodynamic models for Marshes etc

Management Hypotheses
• 187 ecology:flow hypotheses

Management Hypotheses
• ExampleEcological objective Magnitu
deInter-flood Period
Frequency
Clustering
Duration
Depth Seasonality Reference/Rationale
Restore self-sustaining
populations of Pygmy Perch
and other native fish -
spawning
High
flows
6-9 in
10
years
2-4
mths
Win/spr/su
mm
Gunbower-
Koondrook-
Perricoota Icon Site
Environmental
Management Plan
2006–2007: MDBC
(2006)
Successful breeding of
thousands of colonial
waterbirds in at least three
years in ten
Flood 6-9 in
10
years
5-8
mths
Aug-Jan MDFWRC (2005)
Barmah,
Gunbower, Chowilla
Maintenance of red gum
community
Flood.
5000 to
70,000
ML/Day
one to
two
(1:1-2)
years
4-7
month
s and
no
more
than
24
month
s is
desira
ble.
Winter-
spring
(extending
into
summer for
regeneratio
n with a
wet winter-
spring
following)
NWC Eflow - Black
Swamp, WINDS
modelling (SKM
2004), MFAT
modelling and
flow regime
requirements in
Roberts and
Marston (2000) -
Chowilla, MDBC
(2003) - Barmah

Hydrology
• Collating hydrology across the basin
• Observed / recorded
• Modelled actual
• Modelled natural
• Future (median climate)

Impacts of Climate Change

Flood Model for the MDB
• Amalgamation of
existing mapping and
modelling
• Remote sensing
between inundation
mapping

Flood Mapping for the MDB
• MODIS (2000 – 2009)
• 250m pixels
• 8 day composites
• Whole of basin
• Landsat (1982 – 2009)
• 25m pixels
• River Murray
• Analysis
• Flooding
• Connectivity
• Drying

LANDSAT vs. MODIS
LANDSAT TM
27 Jan 2004
MODIS Terra (MOD09GA)
27 Jan 2004

NDVI for the MDB
• Using MODIS and Landsat
• Test relationship between flooding and response of
primary productivity

Basin Regionalisation
• Ecohydrological classification for whole of basin
• River reaches – hydrograph analysis
• Hydrology and hydrological alteration
• Floodplains – flood inundation
• Wetlands – connectivity
• Climate, groundwater, land change
• Refine analysis
• Extrapolate results
• Includes regulated reaches

Analysis strategy

0.0
0.2
0.4
0.6
0.8
1.0
Ecological response
time
tree h
ealth
1970 1980 1990 2000 2010
050000
100000
150000
Station SA4260903 Hydrograph
time
Dis
charg
e (
ML/d
ay)
1970 1980 1990 2000 2010
range of interest
Overview of analysis strategy
Ecological Response
Flow History

Hydrology
• flood magnitude
• flooding frequency
• inter-flood period (dry period)
• clustering of flooding events
• duration of flood or high flow
• depth of river, wetland or flood inundation
• seasonality of river flow, wetland or flood inundation
• rate of rise and fall of river, wetland and flood inundation
• velocity of water movement
• stabilisation of river flows or wetland inundation
• temperature
• turbidity
• oxygen concentration
• salinity
• acidity

Some Hypotheses Being Tested
3 - Floodplain primary production will increase with increasing frequency of floodplain inundation
9 – Riparian tree condition is the outcome of previous inundation history
11 – Fish abundance increases with increasing floodplain inundation
12 - Colonial nesting waterbird breeding increases in response to increased floodplain inundation in the southern MDB
14 – Ruppia presence in the Estuary increases with increasing estuarine area as a result of increased flows
15 – Fish abundance increases in the Estuary with increasing estuarine area as a result of increased flows
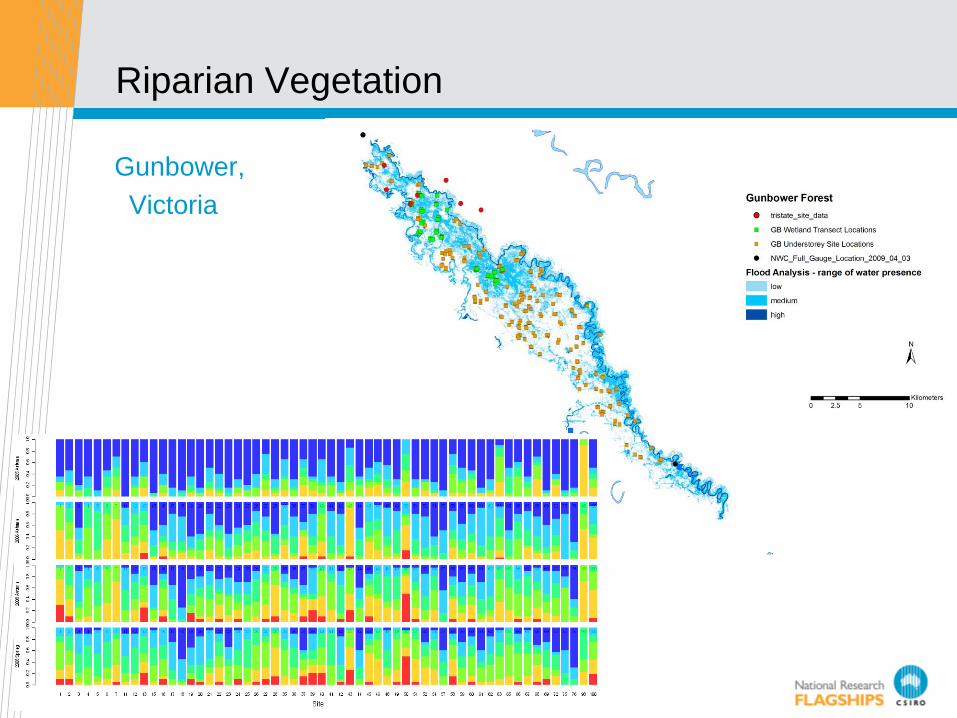
Riparian Vegetation
Gunbower,
Victoria

Riparian Vegetation
• Main factors are „proportion of wet days‟, „min and
median flood duration‟ and „max time between floods‟
• Red Gum confounded by proximity to water
• Grey box health increases with proportion of wet days
and maximum flood duration.
Red Gum
Grey Box
Flooding Characteristics
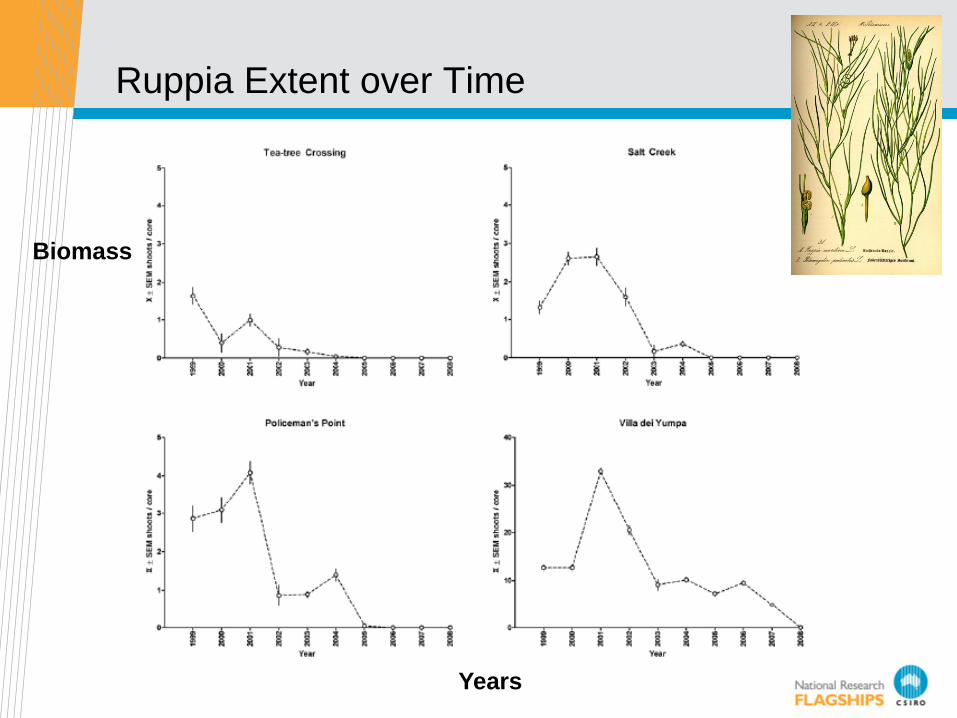
Ruppia Extent over Time
Biomass
Years

Ruppia and Fish Response

Final Outcomes
• Science and management hypotheses
• Conceptual model/s of critical biophysical and flow
links
• Metadata inventory
• Statistical relationships
• Flood model
• Eco-hydrological
classification
• Basin assessment of
what is known and how
transferrable

Water for a Healthy Country
Healthy Water Ecosystems
Environmental Water
Ian Overton – Stream Leader
Phone: +61 8 8303 8710
Email: [email protected]
Thank You


