
Exhibit 1-1
Ecological Soil Screening LevelGuidance - DraftReview of Existing Soil Screening Benchmarks
July 10, 2000

This page intentionally left blank
A CRITICAL REVIEW OF METHODS
for
DEVELOPING ECOLOGICAL SOIL QUALITY
GUIDELINES AND CRITERIA
Prepared for
American Petroleum Institute
Biomonitoring Task Force
1220 L Street, Northwest
Washington, DC 20005-4070
Prepared by
ecological planning and toxicology, inc.
5010 S.W. Hout Street
Corvallis, OR 97333-9540
October 1999

critical review of soil criteria methods
i
EXECUTIVE SUMMARY
In support of the U.S. Environmental Protection Agency (USEPA) development of soil criteria
referred to as Ecological Soil Screening Level to screen contaminated sites, methods used
elsewhere to develop similar criteria were reviewed. Technical guidance documents from
Europe (most notably, The Netherlands), Australia, Canada (Federal), British Columbia, and
Oak Ridge National Laboratory were examined. None of the U.S. states have distinct methods.
Technical staff in each of the countries were also consulted. In addition, USEPA methods for
development of water and sediment criteria were reviewed.
Three generic methods have been used to set protective soil concentrations throughout the
world.
• Type 1 selects the lowest reported toxicity value and divides by an assessment (safety)factor.
• Type 2 arrays all reported values in a statistical distribution and selects a particularpercentile.
• Type 3 ranks all reported soil concentrations from lowest to highest and chooses theupper boundary such that no toxic effects are known to occur at lower concentrations;however, higher concentrations do not always cause toxicity.
The final goal of all environmental protection values, regardless of media, is protection while
being reasonable. How issues such as level of protection, use of assessment factors,
background levels, and minimum data requirements are addressed varies with jurisdictions,
which in turn affects the final values. Compilation of soil protection values revealed substantial
differences among the various jurisdictions. Generally, the different values were drawn from the
same world-wide body scientific studies. Therefore the differences among these jurisdictions
primarily reflect differences in policy, rather than technical rigor or quality of the underlying
science.
critical review of soil criteria methods
ii
TABLE OF CONTENTS
1. INTRODUCTION.................................................................................................................. 1-1
1.1. INFORMATION SOURCES........................................................................................ 1-2
2. APPROACHES FOR ECO-SSL DEVELOPMENT .............................................................. 2-1
2.1. EUROPEAN................................................................................................................. 2-2
2.1.1. Distribution Based Method....................................................................... 2-4
2.1.2. Factor Application Method ....................................................................... 2-5
2.1.3. Equilibrium Partitioning Method............................................................... 2-6
2.1.4. Wildlife...................................................................................................... 2-6
2.2. CANADIAN.................................................................................................................. 2-7
2.2.1. Canadian Council of Ministers of the Environment ................................. 2-7
2.2.2. British Columbia..................................................................................... 2-10
2.2.3. Ontario.................................................................................................... 2-12
2.2.4. Other provinces...................................................................................... 2-13
2.3. AUSTRALIA............................................................................................................... 2-13
2.4. OAK RIDGE NATIONAL LABORATORY (ORNL).................................................... 2-15
2.4.1. Microorganisms, Invertebrates and Plants ............................................ 2-15
2.4.2. Wildlife.................................................................................................... 2-16
2.5. SAVANNAH RIVER SITE.......................................................................................... 2-17
2.6. U.S. FISH AND WILDLIFE SERVICE....................................................................... 2-17
2.7. STATES AND PROVINCES...................................................................................... 2-18
2.8. USEPA....................................................................................................................... 2-18
2.9. USEPA WATER QUALITY CRITERIA...................................................................... 2-19
2.10. SEDIMENT QUALITY CRITERIA.............................................................................. 2-20
2.10.1. Equilibrium Partitioning Method............................................................. 2-20
2.10.2. Effects Range Method............................................................................ 2-20
3. SOIL CRITERIA VALUES .................................................................................................... 3-1
4. CRITICAL REVIEW.............................................................................................................. 4-1
4.1. APPLICATION............................................................................................................. 4-1
4.2. MINIMUM DATA SET REQUIREMENTS ................................................................... 4-3
4.3. TOXICITY ENDPOINT ................................................................................................ 4-3
4.4. EXTRAPOLATIONS.................................................................................................... 4-5
critical review of soil criteria methods
iii
4.5. BIOAVAILABILITY ADJUSTMENTS........................................................................... 4-6
4.6. ASSESSMENT FACTORS ......................................................................................... 4-6
4.7. EQUILIBRIUM PARTITIONING.................................................................................. 4-8
4.8. VALIDATION................................................................................................................ 4-9
4.9. PEER REVIEW.......................................................................................................... 4-11
5. CONCLUSIONS ................................................................................................................... 5-1
REFERENCES ................................................................................................................................1
Appendix A. Summary tables of methods for derivation of ecologically protective soilvalues ......................................................................................................................A-1
Appendix B. Guiding principles used by the Canadian Council of Ministers of theEnvironment for deriving soil protection values......................................................B-1
Appendix C. Comparison of methods for deriving ecologically protective soil values................C-1
Appendix D. Published soil values for use in screening, cleanup, or monitoringcontaminated sites..................................................................................................D-1
critical review of soil criteria methods
iv
LIST OF FIGURES
Figure 2-1 Frequency distribution of toxicity threshold (hypothetical). .................................... 2-5
Figure 2-2. Example calculation of effects distribution for derivation of critical soilvalues by British Columbia.................................................................................... 2-12
Figure 2-3. Sediment quality criteria derivation by Effects Range determination (Longand Morgan, 1991)................................................................................................ 2-21
Figure 4-1. Derivation of the Benchmark Dose for human health risk assessment................. 4-4
LIST OF TABLES
Table 1-1. Documents and other information sources reviewed .................................................. 1-3
Table 2-1. Contaminated sites soil criteria in Europe.................................................................... 2-3
Table 2–2. Assessment factors for determination of soil quality criteria (Europe) ....................... 2-6
Table 2-3. Uncertainty factors for determination of soil quality criteria using the weight ofevidence approach (Canada) ................................................................................. 2-8
Table 2-4. Uncertainty factors for determination of soil quality criteria using the LOAECmethod (Canada) .................................................................................................... 2-9
Table 2-5. Assessment factors for determination of soil quality criteria (Australia).................... 2-15
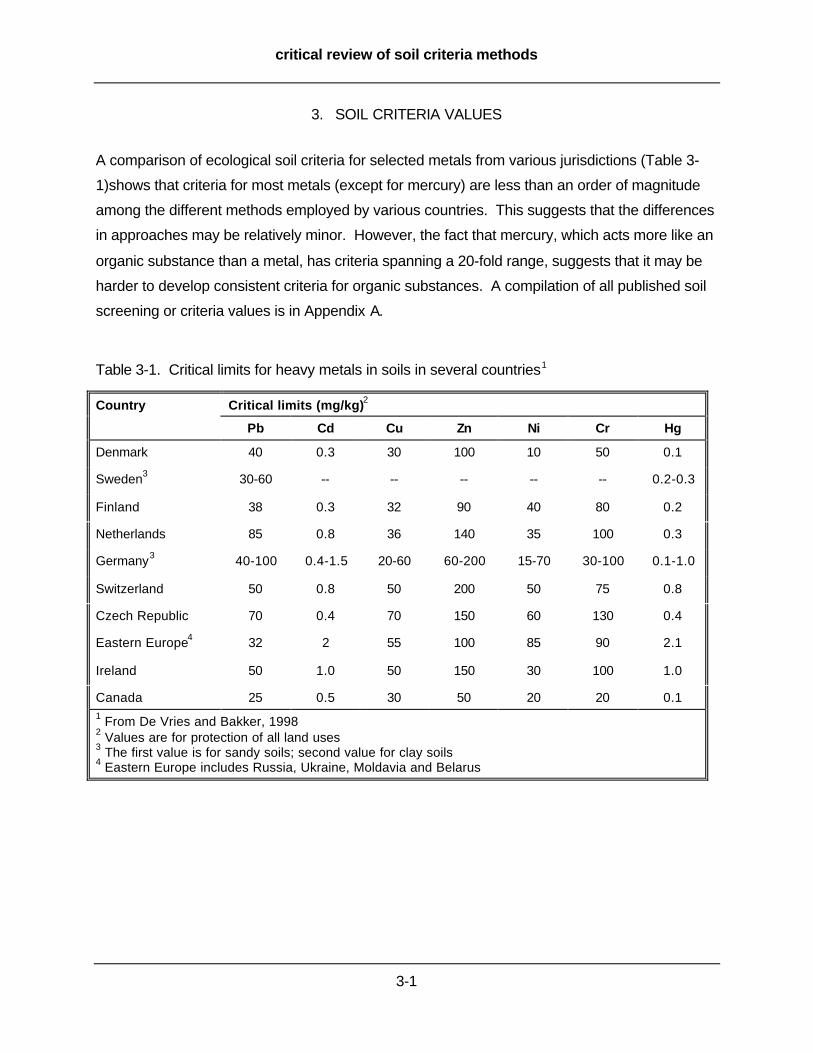
Table 3-1. Critical limits for heavy metals in soils in several countries1........................................ 3-1

critical review of soil criteria methods
v
ABBREVIATIONS
ACR Acute to Chronic Ratio
BCF Bioconcentration Factor
BCME British Columbia Ministry of Environment, Lands, and Parks
BW Body Weight
CCME Canadian Council of Ministers of the Environment
EC European Community
EC10 Effect Concentration for 10% of the test organisms
EC50 Effect Concentration for 50% of the test organisms
Eco-SSL Ecological Soil Screening Level
EIL Environmental Impact Level
ER-H Effects Range – High
ER-L Effects Range - Low
ER-M Effects Range - Medium
LC50 Lethal Concentration for 50% of the test animals
LOAEC Lowest Observable Adverse Effect Concentration
MOEE Ministry of Environment and Energy (Ontario)
MPC Maximum Permissible Concentration
NOAA National Oceanographic and Atmospheric Administration
NOAEC No Observable Adverse Effect Concentration
NPER No Potential Effects Range
ORNL Oak Ridge National Laboratory
PNEC Predicted No Effect Concentration
QSAR Quantitative Structure Activity Relationship
SETAC Society of Environmental Toxicology and Chemistry
TEC Threshold Effects Concentration
USEPA United States Environmental Protection Agency
critical review of soil criteria methods
vi
GLOSSARY
Acute Toxicity: A short-term exposure to a contaminant in a medium and usually at
concentrations high enough to induce an effect rapidly.1
Assessment Factors: A number applied to the toxicity value of a chemical in a situation with
little data to provide an assumed safe value in the ecosystem. Also called: application
factors, uncertainty factors, or safety factors.
Background Concentration: A representative ambient level for a chemical in soil or water.1
Benchmark Values: Concentrations related to thresholds sometimes used in Risk Quotients.
Bioaccumulation: Defined by the USEPA to be terrestrial rates of uptake of contaminants from
the environment.
Bioconcentration Factor (BCF): The ratio of the chemical concentration in an organisms to
the concentration in the media. However, the USEPA defines bioconcentration as only a
concentration of chemical absorbed through gills from an aquatic environment.
Biomagnification: As tissue concentrations of accumulated chemical compounds are passed
up trophic levels, the tissue residue concentrations increase systematically as trophic
level increases.1
Chronic Continuous Criterion: A USEPA water quality value that is the highest concentration
of a pollutant that can be continuously maintained in a water body without unacceptably
affecting aquatic organisms or beneficial uses.
Chronic Maximum Concentration: A value for the USEPA that my be exceeded for a few
hours once every three years, set at half of the Final Acute Value.
Chronic Toxicity: Long-term exposure (weeks to years) to a contaminant in a medium, often
includes reproduction or the full life cycle of the organism.1
Cofauna: Australian term for animals not directly associated with an area of contamination, but
may be affected by impact (i.e., indirect effects) or by offsite migration of the
contaminant.
1 Adapted from CCME 1996(a)

critical review of soil criteria methods
vii
Criteria: Concentrations of contaminants in environmental media that may not be exceeded;
legally enforceable and subject to fine or other regulatory action should exceedences
occur.
Critical Limits: A threshold value where harmful effects occur used in RIVM (The Netherlands)
Guidelines. Also called: Maximum Permissible Concentration or Maximum Allowable
Concentration.
Critical Loads: A threshold amount of material that can be present without causing harm to
terrestrial organisms within the context of the specific soil chemistry that is used in RIVM
(The Netherlands) Guidelines.
Ecological Soil Screening Level (Eco-SSL): Soil concentrations protective of terrestrial
organisms; unacceptable adverse effects should not occur to ecological receptors at or
below this value. Also called: critical loads, precautionary soil values, or soil quality
objectives.
Ecotox Thresholds: A screening value set by the USEPA Superfund to determine if a risk
assessment is necessary at a particular site.
Effect Concentration (ECx): The concentration of a chemical in the medium that results in
some sublethal effect to x% of the test organisms.1
Effects Range- High (ER-H): NOAA’s definition of the sediment concentration above, which
effects are always seen and below which they sometimes occur.
Effects Range- Low (ER-L): The 10th percentile of the distribution of toxic effects (LOAEC
values) thresholds for organisms in soil. The USEPA defines it as the sediment
concentration below which measured effects have never been seen and above which
measured effects are sometimes seen.
Effects Range- Median (ER-M): The midpoint between the ER-H and the ER-L.
Environmental Impact Level (EIL): Australia’s level for protecting ecological values. It is the
concentration of a contaminant that does not cause an adverse effect on specified biota.
Epifauna: Australian term for animals that live in general contact with soil.
Equilibrium Partitioning Theory: The relationship between the concentration of a substance
bound to the soil particles and the concentration in soil solution when the system is at
equilibrium.
critical review of soil criteria methods
viii
Final Acute Value: Acute water quality criteria developed by the USEPA for a group of
organisms. Using the mean data from available genus and species tests, the 5th
percentile of the lowest four values is calculated.
Infauna: Australian term for fauna that live within and in contact with soil.
Intervention Values: A soil concentration defined in The Netherlands as a level indicating
serious contamination and requiring immediate remediation.
Lethal Concentration (LCx): The concentration of chemical in the medium that results in
mortality to x% of the test organisms.1
Lowest Effect Level: The State of New York’s level of contamination that can be tolerated by
the majority of organisms, but still causes a toxicity to a few species.
Lowest Observable Adverse Effect Concentration (LOAEC): The lowest concentration of a
chemical used in a toxicity test that has a statistically adverse effect on test organisms
relative to a control.1
Matrix Standard: A standard developed by British Columbia for substances with a larger
database with separate numbers for human health and ecological receptors.
No Observable Adverse Effect Concentration (NOAEC): The highest concentration of a
contaminant used in a toxicity test that has no statistically adverse effect on the exposed
population of test organisms relative to a control.1
No Potential Effects Range (NPER): A Canadian point estimate in the distribution of
LOAEC/NOAEC and EC50/LC50 below which the proportion of definitive effects data does
not exceed “acceptable levels."
Numerical Soil Standard: Standards developed by British Columbia for each land use
category for substances with a limited toxicity database, intended to be protective of both
human health and ecological receptors.
Precautionary Soil Value: The German term for the soil concentration above which the
responsible party has to reduce or avoid future input of these substances onto the site or
in the vicinity of the site.
Predicted No Effect Concentration (PNEC): The European value or the concentration below
which unacceptable effects on organisms will most likely not occur. This is derived from
the No Observable Effect Concentration.

critical review of soil criteria methods
ix
Preliminary Soil Quality Guidelines: Canadian developed generic numerical concentrations
of a contaminant considered safe for a broad range of conditions and regions.
Quantitative Structure Activity Relationship (QSAR): A prediction of how a molecule will
react in and effect the environment based on its molecular structure.
Severe Effect Level: The State of New York’s level of contamination at which pronounced
disturbance of the sediment community can be expected.
Soil Protection Value: A general term used in this report to encompass all soil concentration
values derived to protect all or part of the terrestrial system from unacceptable effects
due to contamination. It includes screening level values, criteria, and clean-up target
levels.
Soil Quality Remediation Objectives: Canadian developed numerical concentrations
selected or derived to define acceptable residual contamination at a specific site.
Target Values: Clean-up goals.
Threshold Effects Concentration (TEC): The concentration of a chemical below which no
adverse effect is expected to occur.

critical review of soil criteria methods
1-1
1. INTRODUCTION
Many jurisdictions around the world have begun developing Soil Protection Values (SPVs),
variously known as "critical loads," "precautionary soil values," "soil criteria," ecological soil
screening levels, or "soil quality objectives." These soil concentrations (based on total
recoverable concentrations of chemical measured from bulk soils) are to be protective for
terrestrial organisms. At the SPV or below, there is no reason to believe that adverse effects
will occur to ecological receptors. At concentrations above the SPV, there may be adverse
effects depending upon local conditions. Soil Protection Values are used to screen potentially
contaminated sites for priority pollutants or, in some countries, as clean up goals or targets for
allowable discharge rates. In screening sites, substances with concentrations below the
particular SPV would be eliminated from further consideration, allowing the site-specific
ecological risk assessment to focus only on those substances that may cause adverse effects.
Development of SPVs is a two-step process. The first is a data gathering and qualification
exercise. Typically, this involves search of the peer reviewed and government literature on
toxicological response and exposure relationships for terrestrial plants and animals. This is
followed by a quality control screen to select only those studies that meet relatively stringent
criteria for inclusion in the final database. This type of quality control screen is followed for all
regulatory criteria development (e.g., water quality criteria, human health reference doses), as
most of the studies reported in the literature were conducted with other objectives in mind. It
therefore is necessary to screen such work carefully to find only those that are applicable to the
regulatory effort, as well as those that embody sound, quality scientific approaches.
The next step in the SPV development process is determining how to use the retrieved data to
set the final value. Differences in measurement endpoints and species sensitivity, as well as in
test design and laboratory practices result in relatively large variability in reported toxicity
threshold values. How all these values are integrated into final SPV is of great importance. The
final value is intended to be protective of terrestrial species and critical ecological functions, but
must also be reasonable and not so low that even at trivial concentrations (i.e., well below
biological effects thresholds) no chemical is ever screened out from further risk analysis.
Certainly, values for metals should not be significantly below natural background levels. Those
metals that are essential micronutrients need to be present at minimal levels to sustain plants
and invertebrate communities and microbial functions. Acceptable levels of either natural or
critical review of soil criteria methods
1-2
synthetic organic substances must account for organismal mechanisms that protect against
toxic insults as well as acknowledging the assimilative capacity of ecological systems.
Development of SPVs requires a review of the toxicology literature. Soil concentrations related
to toxicity effects are used to set a soil concentration that will be protective of terrestrial species.
In setting SPVs, regulatory agencies generally will err on the side of protection while not being
unreasonably lower than known biological response levels. Achieving this balance between
what is protective and reasonable has been the subject of much debate in many countries as
SPVs are being developed. A blend of toxicology and ecology, as well as public interest and
policies regarding species protection are required to attain protectiveness and reasonableness.
In the United States, this means that the single screening value must be protective across such
diverse regions as the New England forests, Rocky Mountain forests, Central Plains grasslands,
and Great Basin desert scrublands.
Countries that currently are developing SPVs would benefit greatly from a critical review of the
approaches used by other jurisdictions, with a particular emphasis on understanding where a
scientific understanding of ecotoxicological principles can provide guidance and where
regulatory policy should take precedence. This will enable regulatory agencies to build on what
has been learned from the work by other jurisdictions. This report reviews all the approaches
currently in use for establishing SPVs. It includes as well a review of water and sediment
criteria development (as practiced in the U.S.) as these processes have addressed the same
issues currently confronting soil evaluations. Final sections critically review some of the
common issues associated with criteria development and highlight where particular approaches
have had difficulty.
1.1. INFORMATION SOURCES
The U.S. Environmental Protection Agency has tabulated information on SPVs methods used
by other jurisdictions as it began to develop Ecological Soil Screening Levels (EcoSSLs) for use
in the Superfund program. The information was prepared by DynCorp and submitted to the
USEPA on 16 March 1998 (DynCorp, 1998). The DynCorp report did not include information
from European countries or Australia and, for many of the jurisdictions, it lacked information
about methods used to calculate the soil values once the toxicity data have been retrieved.
Information from Europe and Australia have been included in this report and have focused on

critical review of soil criteria methods
1-3
the methods to convert toxicity data to soil criteria (Table 1-1). Where sufficient information was
provided by DynCorp, it has been abstracted and incorporated into this report.
Table 1-1. Documents and other information sources reviewed
Technical guidance documents
Australian Environmental Protection Authority(Environmental Australia, 1997)
British Columbia Ministry of Environment, Lands and Parks(BCME 1995)
Canadian Council of Ministers of the Environment(CCME 1996a) -- Protocol for the derivation of environmental and human health soil quality
guidelines(CCME 1996b) - Guidance manual for developing site-specific soil quality remediation objectives
for contaminated sites in Canada
European Commission(EC 1996)
Netherlands Ministry of Housing, Spatial Planning, and the Environment(De Vries and Bakker, 1998)
Oak Ridge National Laboratory(Efroymson et al., 1997a,b; Sample et al., 1996).
Washington River Site(WSRS 1998)
DiToro et al. (1991)
Long and Morgan (1991)
Stephan et al., (1985)
Review articles
Beyer, N. (1990)
Cowan et al., (1995)
Kimerle et al., (1995)
Internet
http://ci.mond.org/9513/951306.html
Other
personal discussions between the authors and scientists involved in regulatory agencies in Germany,Denmark, Belgium, and Spain
(personal communications 1999 at SETAC Pellston workshop on Hazard Assessment of Metals inSoil, San Lorenzo de El Escorial, Spain).
ECO Update bulletin (USEPA, 1989).

critical review of soil criteria methods
2-1
2. APPROACHES FOR ECO-SSL DEVELOPMENT
Derivation of criteria for protection of organisms against potential adverse effects of chemical
exposure requires information about the concentration-response relationship (i.e., hazard) in
media representative of that found in the natural environment. Additional information about the
relative sensitivity of species is required, to select a concentration that is "protective" of all (or
most) species. Thus, all criteria setting, whether in water, sediment, or soil, follows the same
basic principles: develop a dataset of hazard information and then apply some extrapolation
method to determine the "safe" value (Kimerle et al., 1995).
Ideally, hazard information would be available for all species, thus allowing an accurate
determination of the toxicity threshold, (i.e., that concentration below which effects never occur
in any species and above which effects sometimes occur in one or more species). However,
this can never be achieved, given the thousands of currently extant species. Therefore, tests
are performed on a range of representative species and extrapolations are made to account for
differences in species sensitivity. In aquatic and human toxicology, these extrapolations to non-
tested species may be based on scientific knowledge of chemical-organism relationships
through the use of comparative physiology and Quantitative Structure Activity Relationships
(QSARs) (Enslein, 1988; Zeeman, 1995). However, QSARs for terrestrial organisms have not
been developed. Therefore, determination of the range of species sensitivity becomes more
difficult and derivation of a "safe" concentration may rely more on policy than science through
the application of "assessment" or "safety factors" when there are very few data [but see
Chapman et al. (1998) for a discussion of the drawbacks to this approach]. When more data
are available, alternative approaches are used. These include using geometric mean toxicity
values within or among trophic levels, or arranging the toxicity values in a frequency distribution
and selecting a pre-specified lower percentile (Kimerle et al., 1995).
Wildlife soil criteria have been particularly problematic, as these animals generally have limited
direct exposure to soil. Toxicological relationships are expressed in terms of dietary exposures,
followed by a variety of methods to estimate a corresponding soil concentration. Many
jurisdictions discussed below have chosen to leave out wildlife, focusing only on the soil
infauna, to set soil criteria. Others have not set generic wildlife standards, but have chosen
instead to derive values for individual species. These will be discussed in detail when
describing methods for the respective jurisdictions.
critical review of soil criteria methods
2-2
While each of the jurisdictions described below differ to some degree in how the final soil values
are derived, they all share a common struggle to use data that were not produced under
standardized systems and in many cases, not intended for this purpose. They have grappled
with issues arising from lack of information on some organism groups, and of desiring a value
that is protective and reasonable. The following sections review each of the approaches
currently in use. The intended use or purpose for developing the method (e.g., contaminated
site clean up levels, discharge allocations, etc.) is provided. Terminology is explained and
summarized in the Glossary (page viii), as each jurisdiction refers to the soil values differently.
Issues associated with the various methods are critiqued in Section 4 of this report. Summary
tables of the various approaches currently in use are provided in Appendix A.
2.1. EUROPEAN
The methods described here are contained in the European Community Technical Guidance
Document for Environmental Risk Assessment (European Community, 1996). These methods
have been used to derive Probable No Effect Concentrations (PNECs) values for local, regional,
and continental scale risk assessments for substances in commerce (e.g., metals, plasticizers)
as well as for derivation of critical loads of pollutants (particularly metals) in soils. The
Netherlands provided extended discussions on the derivations of PNECs and soil values (De
Vries and Bakker, 1998), and uses these numbers for ecological risk assessment (generic and
site-specific), identification of seriously contaminated sites requiring intervention and target
values for regulation for discharges (Ministry of Housing Spatial Planning and Environment,
1994; Soil Protection Act, 1998). Germany currently has no Federal legislation for contaminated
soil issues, so each state is responsible for preparing their own values although there is no
formal written documentation for how this is to be done. Bachmann et al. (1997) of the German
Federal Environmental Agency, Section on Soil Protection compiled the available information for
discussion at a European Community workshop. The German approach is conceptually similar
to that used by The Netherlands and other European Community countries. Denmark also has
been working to develop soil assessment and clean-up values for contaminated sites, but still
has no formal documentation. Great Britain has documentation on allowable amounts of
contaminants for sludge applications, but no similar documents for contaminated sites.
The information described here is the general approach followed by all the European
Community countries, as embodied in the Technical Guidance document and further described
by The Netherlands. The only major difference among countries is whether they have different
critical review of soil criteria methods
2-3
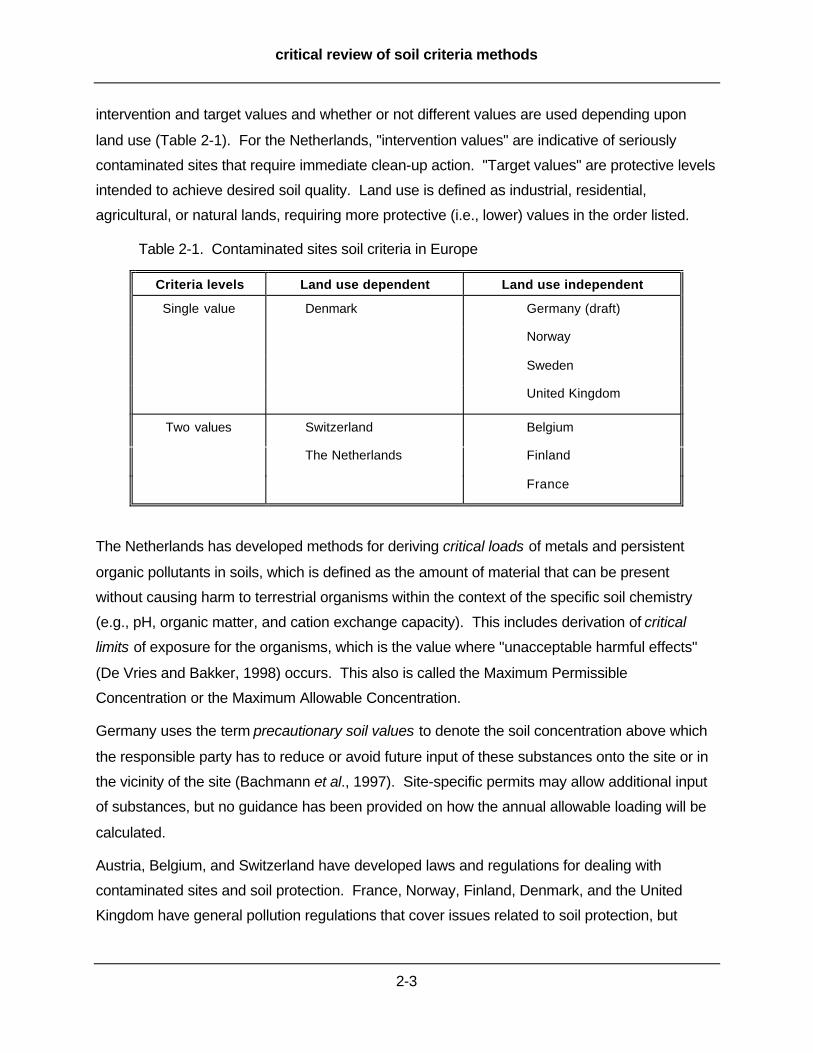
intervention and target values and whether or not different values are used depending upon
land use (Table 2-1). For the Netherlands, "intervention values" are indicative of seriously
contaminated sites that require immediate clean-up action. "Target values" are protective levels
intended to achieve desired soil quality. Land use is defined as industrial, residential,
agricultural, or natural lands, requiring more protective (i.e., lower) values in the order listed.
Table 2-1. Contaminated sites soil criteria in Europe
Criteria levels Land use dependent Land use independent
Single value Denmark Germany (draft)
Norway
Sweden
United Kingdom
Two values Switzerland Belgium
The Netherlands Finland
France
The Netherlands has developed methods for deriving critical loads of metals and persistent
organic pollutants in soils, which is defined as the amount of material that can be present
without causing harm to terrestrial organisms within the context of the specific soil chemistry
(e.g., pH, organic matter, and cation exchange capacity). This includes derivation of critical
limits of exposure for the organisms, which is the value where "unacceptable harmful effects"
(De Vries and Bakker, 1998) occurs. This also is called the Maximum Permissible
Concentration or the Maximum Allowable Concentration.
Germany uses the term precautionary soil values to denote the soil concentration above which
the responsible party has to reduce or avoid future input of these substances onto the site or in
the vicinity of the site (Bachmann et al., 1997). Site-specific permits may allow additional input
of substances, but no guidance has been provided on how the annual allowable loading will be
calculated.
Austria, Belgium, and Switzerland have developed laws and regulations for dealing with
contaminated sites and soil protection. France, Norway, Finland, Denmark, and the United
Kingdom have general pollution regulations that cover issues related to soil protection, but

critical review of soil criteria methods
2-4
currently do not have contaminated lands legislation. These countries have, or are developing,
soil quality criteria that can be used as guidelines for site-specific risk assessments.
The soil values developed by the Europeans are validated to some extent, particularly for
metals. De Vries and Bakker (1998) includes an uncertainty analysis in the guidance for
calculating critical soil loads, including a sensitivity analysis of which parameters contribute the
most uncertainty to the final soil value. All jurisdictions recognize the concept of "natural
background" levels for metals, but disagree on how these are defined. This concept is
discussed further in Section 4 of this report.
The following sections describe three methods used by the European Community for deriving
soil values, depending upon how much toxicity data are available. The distribution method is
the preferred method, but can only be used with robust data sets. If fewer toxicity data are
available, the factor method is used. If no toxicity data are available form terrestrial organisms,
a proposal has been made to use the Equilibrium Partitioning method where information from
aquatic studies, extrapolated to soil systems through pore water analysis. The numbers
generated by these methods have, so far, relied only on toxicity data from soil organisms;
wildlife information has not been included. However, the approach suggested by The
Netherlands for deriving wildlife values also is reviewed. Regardless of the method used, a
single number is derived that is meant to be protective of all organisms in the terrestrial
ecosystem.
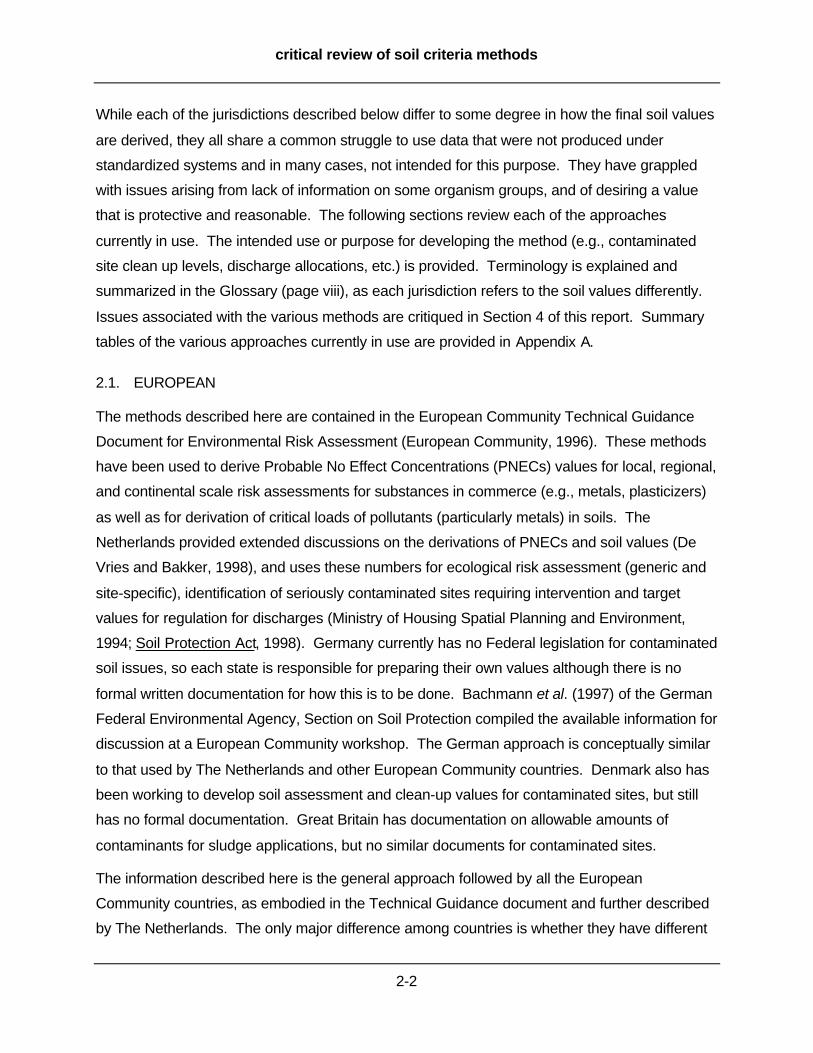
2.1.1. Distribution Based Method
This method has been used when there are an acceptable number of reported toxicity threshold
values (i.e., four or more values), representing a wide spectrum of genera. It is assumed that
the varying sensitivities of soil organisms follow a predictable statistical distribution with most
genera having approximately the same sensitivity and fewer being more sensitive or less
sensitive. The frequency distribution of species (or genera) sensitivities generally is assumed to
follow a log-normal distribution (Figure 2-1). The 5th percentile (i.e., low end) of the toxicity
threshold values is then estimated and is used as the final criterion value (Van Straalen and
Denneman, 1989; Wagner and Løkke, 1991).
critical review of soil criteria methods
2-5
Figure 2-1. Frequency distribution of toxicity threshold (hypothetical).
2.1.2. Factor Application Method
The Factor Applications Method is used when there is little information available about the
hazard of the chemical of concern to terrestrial organisms. It generally is applied if the data set
is small (fewer than four studies) or when only acute data are available. Acute toxicity data,
arise from short-term ecotoxicological experiments (defined by the European Union as less than
one day in duration) and generally are expressed as an LC50 (lethal concentration for 50% of the
test animals), but also may be a non-lethal response at the 50% or lower level. The lowest
reported value is chosen, and then assessment factors (also known as "application factors,"
"uncertainty factors," or "safety factors") are applied. Generally, this entails dividing the toxicity
value by 100 or 1,000 (Table 2-2). If chronic data (from studies one day to one month in
duration) are available, but the number of tests or genera represented are still small, the lowest
value is selected and divided by ten (Table 2-2). Chronic data are reported as the No
Observable Adverse Effect Concentration (NOAEC). Note that the lowest reported toxicity
number always is divided by at least ten. This is to account for uncertainties in the data,
potential for additive or synergistic interactions among chemicals occurring in the environment,
unknown differences in species sensitivity that may not be captured in the existing data set, and
differences in laboratory methods as well as lab-to-field extrapolations. Data also are adjusted
to standardize pH and organic matter according to algorithms developed from background
conditions of uncontaminated sites (Table 2-2).
Logarithm of Toxicity Threshold Values
Number
of Genera
or Species
critical review of soil criteria methods
2-6
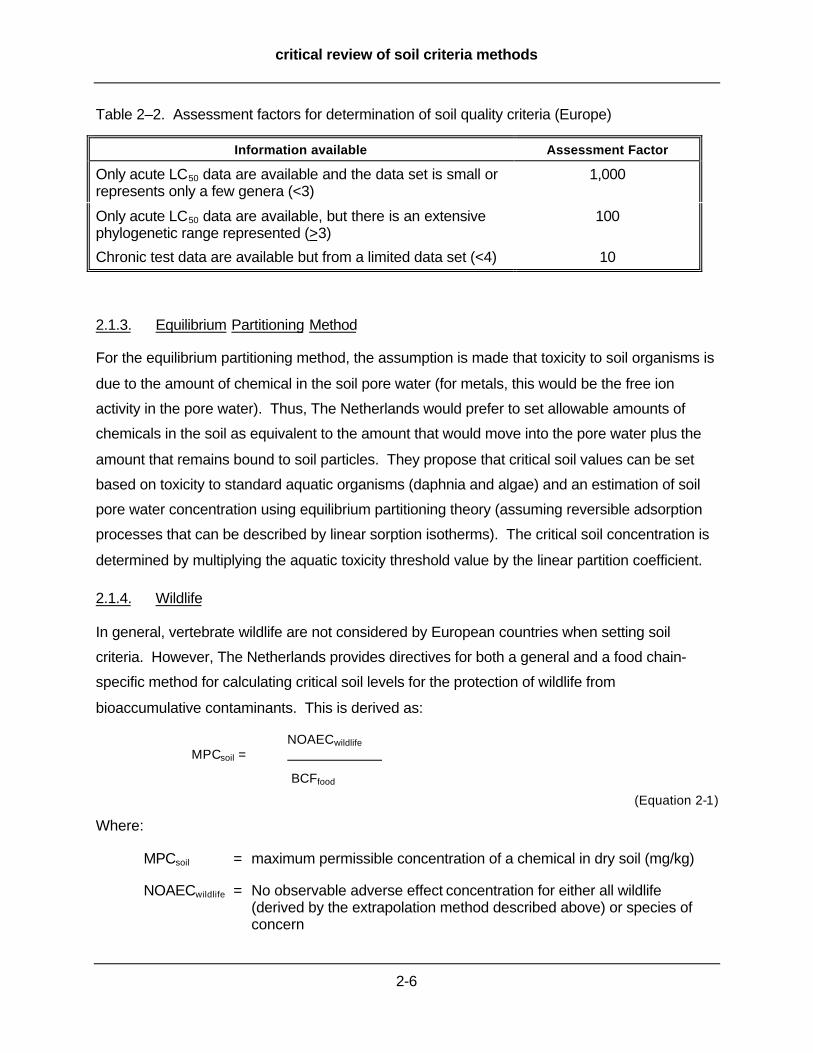
Table 2–2. Assessment factors for determination of soil quality criteria (Europe)
Information available Assessment Factor
Only acute LC50 data are available and the data set is small orrepresents only a few genera (<3)
1,000
Only acute LC50 data are available, but there is an extensivephylogenetic range represented (>3)
100
Chronic test data are available but from a limited data set (<4) 10
2.1.3. Equilibrium Partitioning Method
For the equilibrium partitioning method, the assumption is made that toxicity to soil organisms is
due to the amount of chemical in the soil pore water (for metals, this would be the free ion
activity in the pore water). Thus, The Netherlands would prefer to set allowable amounts of
chemicals in the soil as equivalent to the amount that would move into the pore water plus the
amount that remains bound to soil particles. They propose that critical soil values can be set
based on toxicity to standard aquatic organisms (daphnia and algae) and an estimation of soil
pore water concentration using equilibrium partitioning theory (assuming reversible adsorption
processes that can be described by linear sorption isotherms). The critical soil concentration is
determined by multiplying the aquatic toxicity threshold value by the linear partition coefficient.
2.1.4. Wildlife
In general, vertebrate wildlife are not considered by European countries when setting soil
criteria. However, The Netherlands provides directives for both a general and a food chain-
specific method for calculating critical soil levels for the protection of wildlife from
bioaccumulative contaminants. This is derived as:
NOAECwildlife
MPCsoil =
BCFfood
(Equation 2-1)
Where:
MPCsoil = maximum permissible concentration of a chemical in dry soil (mg/kg)
NOAECwildlife = No observable adverse effect concentration for either all wildlife(derived by the extrapolation method described above) or species ofconcern
critical review of soil criteria methods
2-7
BCFfood = bioconcentration factor representing the ratio between the concentrationin the food (wet weight) and the concentration in the soil (dry weight).
Up to three BCFs can be concatenated to determine the exposure to a particular trophic level of
wildlife (soil to plants or invertebrates, then to birds or mammals, and then to predators). The
Netherlands used field collected data to determine BCFs empirically for the wildlife food chain,
applying a Monte Carlo analysis of all BCF data for each trophic level and selecting the 95th
percentile (i.e., a high BCF to develop a conservative estimate). Species-specific food chains
can be derived as well following this same model.
2.2. CANADIAN
2.2.1. Canadian Council of Ministers of the Environment
The Canadian Council of Ministers of the Environment (CCME) provides guidance for deriving
preliminary soil quality guidelines (CCME, 1996a) and site specific soil quality remediation
objectives (CCME, 1996b) for use in assessing risk at contaminated sites, clean-up goals, and
monitoring remediation efforts. The recommended approaches were based (at least in part)
from a review prepared by MacDonald and Sobolewski (1993) for CCME of approaches existing
at that time. The guiding principle under which CCME operated in developing the soil numbers
was to "provide a healthy functioning ecosystem capable of sustaining the current and likely
future uses of the site by ecological receptors and humans." (CCME, 1996a). The CCME
further describes the basis for their approach (CCME, 1996b) as needing to be practical,
applicable to the objectives of the contaminated site program, and scientifically defensible.
They listed 14 additional guiding principles for the derivation of site-specific soil remediation
objectives (Appendix B) and conducted an uncertainty and sensitivity analysis of all the input
parameters (CCME, 1996a).
Soil quality guidelines and remediation goals for receptors in direct contact with the soil (i.e.,
plants and invertebrates) are derived using one of several approaches, depending upon the
quantity and type of toxicological data available and the specified land use. A single value is
derived for each chemical under each land use that is assumed to be protective of all soil
organisms, based on the lowest value derived for invertebrates, wildlife, and microorganisms
(see Section 2.2.1.6 for details). Land use categories (listed here from most to least protective)
are: agricultural lands, residential/parkland, commercial land, and industrial land. Differences in

critical review of soil criteria methods
2-8
protection levels result from consideration of different receptors and different exposure
pathways.
Ambient background levels of contaminants may be higher than the effects-based derived
generic soil quality guidelines. In this instance, the CCME recognizes that background levels
will take precedence over the derived values. Therefore, the final clean-up criterion will be the
derived value or background, whichever is the highest. Background levels are based on
regional or provincial limits and may be determined on a site-specific basis.
2.2.1.1. Weight of Evidence Approach
The Canadians prefer the "weight-of-evidence" approach where sufficient numbers of chronic
studies are conducted from which Lowest Observable Adverse Effect Concentrations (LOAECs)
and NOAECs have been derived. Studies that calculated EC50 or LC50 values also are included
in this data set. The data set then is examined to determine if it is biased by excessive numbers
of NOAEC or LOAEC values or if EC50 or LC50 values predominate. If one or the other type of
study is over-represented, then this approach would not be used (determination of "over-
represented" is based on "expert judgment"). If the data set is balanced, the 25th percentile of
the frequency distribution is calculated and assumed to represent the "No Potential Effects
Range" (NPER). The Threshold Effects Concentration (TEC) is then derived by dividing the
NPER by an uncertainty factor between 1 and 5 (Table 2-3). An uncertainty factor need not
always be applied and the magnitude of any factor used is left to expert judgment.
Table 2-3. Uncertainty factors for determination of soil quality criteria using the weightof evidence approach (Canada)
Information available Suggested Uncertainty Factor
Only the minimum of 3 studies is available 5
> 3 studies are available, but <3 taxonomic groupsare represented 3
> 25% of the data below the 25th percentile aredefinitive effects data (i.e., not LOAECs) 1
2.2.1.2. Lowest Observed Effect Concentration Method
When there are insufficient data to apply the weight of evidence method, the TEC is derived by
dividing the lowest available LOAEC by an uncertainty factor. A minimum of three studies
including at least one terrestrial plant and one soil invertebrate study must be available for

critical review of soil criteria methods
2-9
application of this approach. The uncertainty factor is again between 1 and 5, dependent upon
expert judgement (Table 2-4).
Table 2-4. Uncertainty factors for determination of soil quality criteria using the LOAECmethod (Canada)
Information available Suggested Uncertainty Factor
The LOAEC is "biologically significant" and notjust statistically different from controls 1
The LOAEC is taken from an acute study 3
Only 3 studies were available and/or <3taxonomic groups are represented 5
2.2.1.3. Median Effects Method
If only acute toxicity study data are available (EC50 or LC50 data), then neither of the above
methods can be used. In this case, the TEC is estimated using the Median Effects Method.
Here, the TEC is the lowest reported EC50 or LC50, divided by an uncertainty factor. A minimum
of three studies is required, including one terrestrial plant and one soil invertebrate study. If the
lowest datum is an EC50 value, the uncertainty factor of five should be used. If the lowest datum
is an LC50, then an uncertainty factor of ten should be applied. An additional uncertainty factor
between one and five may be applied if the factors listed in Table 2-4 are incurred as well. The
use of uncertainty factors of five and ten applied to the EC50 and LC50 data, respectively, were
selected after examination of acute versus chronic (NOAEC) data for 38 inorganic and organic
contaminants for soil-dependent organisms.
2.2.1.4. Microbial Processes
Effect threshold concentrations for microbial processes (nutrient and energy cycling) are
calculated in parallel with determination of the TEC for plants and soil invertebrates. Data on
effects of chemicals on nitrification and denitrification are gathered and a TEC for microbial
processes is derived by one of the above methods. If insufficient data are available, then
decomposition, soil respiration, and nitrogen mineralization rate data are gathered as well, and
the TEC derivation process is followed as above. If the minimum number of data sets are not
available, no value is generated.

critical review of soil criteria methods
2-10
2.2.1.5. Wildlife
Critical values for wildlife are limited to those related to soil and food ingestion and further
limited to herbivorous animals (using a livestock model). A minimum of three studies is
required, one of which must be an oral mammalian study, and one must be an oral avian study.
Only one laboratory rodent study may be used to fulfill the data requirements for mammalian
species. The daily threshold effect dose is estimated using the lowest reported LOAEL divided
by an uncertainty factor between one and five (Table 2-4). This value is converted to a soil
concentration using the body weight, food ingestion rate, and soil ingestion rate of the species
from which the LOAEL was determined. Bioconcentration factors (BCFs) are derived from the
literature using "best professional judgement," with no guidance provided for how to select
among the available BCFs or which one(s) to use in the final calculation. Additionally, it is
assumed that 20% of the animal's estimated daily intake is from water, and apportionment of
exposure estimates are made accordingly.
2.2.1.6. Final Soil Criteria
Once the TEC has been derived, it is compared with microbial process data (nutrient and
energy cycling) and wildlife data. For agricultural lands, the lowest of the TEC, the microbial
value, or the wildlife value is used as the criteria. For residential and park lands, the lowest of
the TEC or the microbial values is used. For commercial and industrial land use, the TEC is
used if it is below the microbial value. If the microbial value is lower, then the geometric mean
of the microbial value and the TEC is calculated and used as the final criterion.
2.2.2. British Columbia
British Columbia also derives separate soil standards for soil organisms (plants and
invertebrates), microbial functions, and livestock for five categories of land use (the same uses
as defined by CCME, but residential and urban parklands are in separate categories). Single
generic numerical soil standard are developed for each land use category for substances with a
limited toxicity database. These standards are intended to be protective of both human health
and environmental receptors. Matrix standards are provided for substances with a larger
amount of data. For these, separate numbers are generated for human health (one based on
contaminated soil intake and another based on protection of groundwater for drinking) and
ecological receptors (soil invertebrates, plants, livestock, and microbial functions). The lowest
matrix standard is used for purposes of defining a contaminated site or establishing remediation
critical review of soil criteria methods
2-11
goals. The contaminated sites regulations state that clean-up below background will not be
required for metals or other naturally occurring substances. Background levels may be
determined on site-specific basis with approval of the protocol for doing so given by the Director
of the Ministry of Environment, Lands, and Parks. Furthermore, for the few cases where the
toxicologically-based standards are below current analytical detection limits, the value will be
raised to the detection limit. Should better analytical chemistry techniques become available in
the future, the standard may be lowered to the toxicologically-derived value.
2.2.2.1. Soil organisms
For soil organisms (plants and invertebrates) or microbial functions, all acceptable toxicity data
are examined. Data are sorted into two data sets of either lethality endpoints (LCx values) or
non-lethal endpoints (ECx values). Studies that report NOAEC or LOAEC values are used only
if sufficient data are reported in the study for calculation of an ECx or LCx value. Within the
lethal and non-lethal data sets, if multiple studies exist that report the same percent response
(e.g., an LC50), then the concentration causing that response is averaged to obtain a single
value. For the non-lethal data, these responses represent a variety of measured endpoints,
although reproduction studies are preferred. These revised data sets (one for lethality studies
and one for the non-lethal endpoints) are then used to calculate the regression line representing
the soil concentration as a function of the reported percent response (Figure 2-2). The
predicted soil concentration where a 50% non-lethal response (EC50) or a 20% lethal response
(LC20) occurs is then determined from the regression lines or equations. For Agricultural,
Residential, or Park land uses, the lesser of the EC50 (non-lethal) or LC20 (lethal) soil
concentration values is used as the criterion. For Commercial or Industrial land uses, the
greater of the EC50 (non-lethal) or LC20 (lethal) soil concentration values is used. If insufficient
data are available for the application of this method, an estimation of the EC50 or LC20
concentrations is made using best professional judgment (no guidance is provided on what
constitutes a "sufficient" data set nor how this determination should be carried out).

critical review of soil criteria methods
2-12
Figure 2-2. Example calculation of effects distribution for derivation of critical soil values by
British Columbia
2.2.2.2. Microbial Function
British Columbia has adopted the CCME methods for derivation of criteria protective of soil
microbial processes.
2.2.2.3. Wildlife
British Columbia soil matrix standards do not address wildlife. The Agriculture land use
standards address livestock exposure through ingestion of soil and fodder. Development of
these soil criteria are equivalent to those described above for CCME and European soil criteria.
2.2.3. Ontario
The Ontario Ministry of Environment and Energy (MOEE) has published guidelines containing
both generic and site-specific approaches to clean up of contaminated sites (MOEE 1996).
These criteria are meant to "protect against adverse effects to human health, ecological health
and the natural environment" (MOEE, 1996). The guidance and associated criteria contain both
human health and ecological effects information. The single soil criterion for each chemical is
the lowest number from human health and ecological effects analyses. Human health criteria
are derived from the lowest value from the following exposure routes: dermal exposure,
incidental soil ingestion, groundwater contamination, or soil vapor to indoor air. Wildlife are
considered for agricultural lands and residential/parklands, but only the herbivore food chain is
% Response
Soil concentration(mg/kg)
5020
reported
calculated
critical review of soil criteria methods
2-13
evaluated. Unlike CCME and British Columbia, Ontario groups industrial and commercial uses
together into a single category of land use. The guideline document (MOEE, 1996) does not
describe how Ontario derives ecological effects criteria (other than to state that conservative
exposure values are used), but does state that the Netherlands' numbers will be used whenever
Ontario does not promulgate a specific number. As in British Columbia, the MOEE provides
that soil criteria will be at or above background levels (for naturally occurring substances) or
analytical detection limits. Province-wide background levels are published by the MOEE, but
site-specific background numbers may be developed with MOEE approval.
2.2.4. Other provinces
None of the other Canadian provinces have developed soil criteria or guidance for contaminated
sites, although Alberta is in the process of development of such documentation (personal
communication, Ted Nason, Environment Canada,).
2.3. AUSTRALIA
Soil values are developed separately for two multi-exposure pathways: plants plus animals that
live within soil (e.g., soil invertebrates, called “infauna” by the Australian EPA) and animals that
live above ground having direct soil contact (called “epifauna” by the Australian EPA) plus
potentially affected animals impacted indirectly or via off-site movement of contaminants (i.e.,
“cofauna” as used by the Australian EPA). The lowest of these values is then selected as the
Environmental Impact Level for soil (EILsoil) (Environment Australia, 1997). The aim of setting
an EILsoil is "to protect ecological values." These values include ecological processes,
community systems, and populations or biota of particular value. The values and species differ
for land uses, which include: residential, urban parkland, commercial, industrial, agricultural,
rural parkland, and nature reserves. The EILsoil should be the concentration of a contaminant
that may persist in the soil without causing an adverse effect on specified biota. Where
assumptions are made in deriving EILs, they should be conservative in nature. The technical
guidance document for derivation of EILssoil (Environment Australia, 1997) includes an appendix
with criteria for assessing the quality and applicability of ecotoxicological data in the literature for
use in the derivation process. For substances with insufficient or low quality toxicity data, EILs
should be based on background concentrations or chemical detection limits. Toxicologically-
based EILs should not be below the background or detection concentrations. The EILsoil are
meant to be used a screening tools for assessing whether or not a site may be considered
critical review of soil criteria methods
2-14
contaminated, and are also referred to as Investigation Levels. Soils that exceed these levels
may require further assessment of actual risk through the derivation of site-specific EILssoil.
The Australian method for derivation of EILsoil are part of the National Framework for Ecological
Risk Assessment of Contaminated Sites (Parts B and C). This document is in draft form, and is
available for public review and comment at: http://www.environment.gov.au/epg/contam/
documents.html. Because the Framework is only in draft form, soil ecological impact levels
have not been published at this time.
2.3.1.1. Soil Organisms
The EILin & f (EIL for infauna and flora) is developed by selecting the lowest reported NOAEC
from studies of plants or animals that live within the soil. The guidelines go into great detail
describing how to evaluate toxicity studies for quality of the data, but very little detail on what to
do with the information once it has been retrieved. There is a suggestion that NOAEC data
should be used (i.e., from chronic studies), with the lowest reported value selected as the final
value. However, this is not stated explicitly, nor are there rules for the application of
assessment factors (if any).
2.3.1.2. Wildlife
The Australian approach focuses wildlife protection on a species-specific basis. The overall
EILepi & co is obtained by selecting the lowest calculated wildlife value. The process used to
determine critical soil values for Australian wildlife is fundamentally the same as that used in
Europe (See Wildlife, Page 2-6) although specific guidance is provided for incorporation of
exposures from inhalation and drinking water routes. Toxicity data are derived from studies
where NOAECs are reported or can be calculated. For derivation of biomagnification factors
(equivalent to the BCF), data from studies that pass the quality screen are pooled for each
chemical. The "best estimate" for the BCF is the median value while a "conservative estimate"
is the upper 95% confidence limit. This designation of "best" and "conservative" estimate
applies to any of the input parameters for which a distribution of values is available (e.g., body
weight, food ingestion rate, etc.). The lowest reported NOAEC for the species of interest is
selected, if available. If not, surrogate species data may be used as well as EC50 data or data
from acute studies (LC50s), adjusted by assessment factors (Table 2-5).

critical review of soil criteria methods
2-15
Table 2-5. Assessment factors for determination of soil quality criteria (Australia)
Information available Assessment Factor
Acute to chronic extrapolation 1,000EC50 to LOAEL 10LOAEL to NOAEL 10Extrapolation across species within a Family 10Extrapolation across Families within a Class 10Extrapolation across Classes within a Phylum 10
2.4. OAK RIDGE NATIONAL LABORATORY (ORNL)
Oak Ridge National Laboratory (ORNL) developed a set of soil benchmark values for plants,
invertebrates, microorganisms, and wildlife for use in their site-specific risk assessments.
These values were used as screening values for soils at the Oak Ridge Department of Energy
site to determine areas where more ecological risk assessments would be required. If the
toxicologically-derived values were below background (as determined for ORNL soils), then
background values were used instead. The benchmark values were posted on the Internet and
were made available through published documents. These values have been adopted by
various states and USEPA Regions in the absence of any alternative values. ORNL has since
removed the tabulated information from the Internet, as they recognized the difficulty of
maintaining quality control and updating information, although their technical guidance
documents (with associated tables of benchmark values) are still available on the ORNL web
site.
2.4.1. Microorganisms, Invertebrates and Plants
Soil benchmarks for microorganisms, invertebrates and plants proposed by ORNL were derived
using a method similar to that developed by the National Oceanographic and Atmospheric
Administration (NOAA) for calculating the Effects Range Low (ER-L) in sediments (Long and
Morgan 1991). This approach has been recommended as a sediment screening benchmark by
USEPA Region IV. The ER-L is the 10th percentile of the distribution of toxic effects thresholds
for organisms in soil, using LOAEC values. If less than ten values were available for a
chemical, the lowest LOAEC was used. For studies where a LC50 was reported instead of a
LOAEC, the concentration was divided by five in the hope of approximating the more sensitive

critical review of soil criteria methods
2-16
endpoints of growth and reproduction, prior to inclusion in the LOAEC data set. No other
assessment factors are used. Invertebrates are represented only by earthworms; no other
species were included in the assessment. The assessment endpoints for microorganisms are
related to community function (e.g., carbon mineralization, nitrogen transformation, and enzyme
activities). Plant toxicity benchmarks derived by this method for metals generally are lower than
those for soil invertebrates or microbial processes, and the reverse is true for organic
compounds.
2.4.2. Wildlife
ORNL did not develop single soil criteria protective of all wildlife for each chemical. Rather, they
developed animal-specific benchmark concentrations in a manner similar to that used by the
Australians. In the event that a single mammalian or single avian soil benchmark value is
needed for site screening purposes, ORNL uses the short-tailed shrew (Blarina brevicauda) and
the American woodcock (Philohela minor) as representative species, respectively.
ORNL differs from the Australian approach by looking for the single best study that represented
chronic effects (preferably reproductive endpoints) in a species as closely related to the species
of interest as possible, rather than using all acceptable toxicity study data from any species and
selecting the lowest value. Only mammalian studies were used to represent mammalian wildlife
and only avian studies were used for birds. However, the same study often was used to model
all birds (or all mammals), so differences in soil benchmarks became a function only of the
exposure factors (food consumption rates, body weights, dietary BCFs, etc.). Furthermore,
ORNL extrapolated among species using dose on a mg/kg-body weight (BW) basis, with the
body weight modified to reflect differences in metabolic rates. Because the initial assumption
that dose differences are related to metabolic rates expressed as (BW)0.75 has since been
proven to not be a universal characteristic of all species and chemicals, ORNL has realized that
their wildlife benchmarks may not have been calculated correctly (personal communication, B.
Sample). ORNL has not published revised values, however, as the appropriate algorithm has
not been determined. Most other jurisdictions that develop species-specific wildlife benchmarks
(e.g., CCME, Australia) have followed the ORNL approach to cross-species extrapolations and
so suffer from the same inaccuracies.
critical review of soil criteria methods
2-17
2.5. SAVANNAH RIVER SITE
The Savannah River Site is another Department of Energy facility faced with environmental
contamination issues. To support the preparation of ecological risk assessments at the
Savannah River Site, Friday (1998) compiled ecological screening values for soil, sediment, and
surface water. The report explicitly states that the screening values are “inappropriate for
setting remedial action cleanup levels.” The recommended soil screening levels, which were
reviewed and adopted by the U.S. Environmental Protection Agency Region IV
(http://www.epa.gov/region4/wastepgs/oftecser/epatab4.pdf), were selected from benchmarks
published by the U.S. Fish and Wildlife Service (Beyer 1990), Oak Ridge National Laboratory
(Efroymson et al. 1997a, b), Canadian Council of Ministers of the Environment (CCME 1997),
and The Netherlands (MHSPE 1994, Crommentuijn et al. 1997). Generally, the most
conservative and recently published value cited in these references was recommended as the
ecological soil screening value. Dutch values comprised 60% of the recommended values;
ORNL values comprised 38% whereas Canadian values comprised 2%. The report states that
“no attempt is made to endorse a source or to evaluate the derivation process,” thus implying
that no validation procedure took place. Unless the recommended values are to be used to
support a preliminary ecological screening assessment, the investigator must ultimately
determine which values are most appropriate
2.6. U.S. FISH AND WILDLIFE SERVICE
In 1990, the U.S. Fish and Wildlife Service published a compilation of the soil screening level
values available at that time (Beyer, 1990). There was little to no information provided about
how the various numbers were chosen; rather, the reader is referred to the original guidance
documents for further details. Summaries are provided from ten jurisdictions, including two
states (New Jersey and California) whose numbers were developed for groundwater protection.
Canada, and both the Federal and provincial levels, had five different sets of numbers. The
remaining three sets of values were from Japan (although these numbers were developed for
human health purposes only), The Netherlands, and the former Soviet Union. All of the
ecological values, with the exception of the former Soviet Union, have been superceded by the
newer methods described in the above sections of this report.

critical review of soil criteria methods
2-18
2.7. STATES AND PROVINCES
DynCorp (1998) surveyed the various U.S. states to determine which ones have generic soil
screening benchmarks for ecological receptors. Washington, Texas, and Delaware have
adopted the ORNL values for use at the state level. Texas, however, is re-evaluating the ORNL
benchmarks as they may not be as conservative as the state would like. Many other states
have developed guidance for conducting site-specific ecological risk assessments, without
including any specific soil benchmarks. For example, Michigan states that "the published
literature … is not of sufficient quality to allow a clear-cut, quantitative approach in developing
criteria" for aesthetics, terrestrial flora, fauna, food chain or other impacts (Michigan DEQ,
1998). The Michigan state guidance goes on to say that statewide, regional, or site-specific soil
background levels will become default cleanup criteria where applicable risk-based criteria are
lower than the background level.
2.8. USEPA
In January 1996, the USEPA Superfund program published an issue of the Eco Update bulletin
devoted to Ecotox Thresholds. This discussed the use of thresholds to screen soil, sediment, or
water chemical concentrations to determine if a risk assessment would be necessary at a
particular site. Methods for calculating the Ecotox Thresholds are given for water (Ambient
Water Quality Criteria) and sediment (USEPA's Sediment Quality Criteria). For soil, they state
that "Methods to address toxicity in soils have not been sufficiently developed… The Superfund
program is currently evaluating options in this area…"
USEPA Region IV provides guidance suggesting that soil screening values can be submitted by
investigators based on information about potential direct toxicity to soil invertebrates and plants.
For those contaminants that biomagnify, Region IV suggests that soil values can be determined
by back-calculations from acceptable levels in prey items through two trophic levels to the soil.
Furthermore, Region IV disallows the use of area or regional background levels, preferring
instead to develop screening level concentrations based on data showing associations with
"ecological" effects. Published soil screening level criteria available from Region IV are derived
directly from the Westinghouse Savannah River Site documentation.
None of the other EPA regions have published soil values or guidance for their use in screening
ecological risks at sites although internally Region VIII, for example, has applied soil screening
levels at Superfund sites (personal communication, Gerry Henningsen). Region IX has
critical review of soil criteria methods
2-19
Preliminary Remediation Goals, but these were developed for human health assessments only.
The other regions had no available guidance posted on their web sites.
2.9. USEPA WATER QUALITY CRITERIA
Although water quality criteria are not applicable to the derivation of soil criteria, it is instructive
to examine how the USEPA develops water quality criteria. Once toxicity threshold information
is generated for appropriate species in a particular media, the derivation process to set the final
criterion value could be similar for water, soil, and sediment. The final goal of protection while
being reasonable is the same in all media. How this is achieved is mostly a matter of policy
rather than scientific rigor.
Development of a water quality criterion requires at least eight acute toxicity tests (LC50 values),
including animal species from eight different families, as well as three animal chronic tests (one
fish, one invertebrate, and one additional species), one algal test, and one test to determine the
BCF (Stephen et al., 1985). Nearly all the water quality criteria are based on studies conducted
specifically for the purposes of criteria setting, following standard protocols. Nevertheless, even
these studies are subject to data quality review. If more than one result is available for any
species, the geometric mean value is calculated. This value can then be used to calculate a
Species Mean Acute Value in the same manner as the Genus Mean Acute Value is calculated
as described when more than one species in a genus were tested.
The Genus (or Species) Mean Acute Values for each group of organisms tested are plotted to
determine the four lowest values. These four values are used to calculate the 5th percentile. A
triangular distribution is used to extrapolate this concentration known as the Final Acute Value.
Using only the lowest four values, and assuming a triangular distribution, ensures that the
extrapolation to the 5th percentile will not result in unrealistically low numbers. Nevertheless, if
data are available that show a species-specific toxicity threshold below the calculated value, the
measured value is used as the criterion.
Because acute tests are conducted for short intervals of exposure, chronic criteria (based on
NOAECs) also are derived. The Chronic Maximum Concentration criteria (a value that may be
exceeded for a few hours only once every three years) is set at one-half the Final Acute Value,
to have a built-in safety factor.
The Chronic Continuous Criterion (the most environmentally relevant number) is derived by
multiplying the Chronic Maximum Concentration by the ratio of the acute effect and the chronic

critical review of soil criteria methods
2-20
effect levels. The USEPA recognizes that chronic studies are expensive and time-consuming,
and thus requires a lower minimum number of studies. For those species with chronic studies,
the ratio of the acute values to the chronic values is derived (acute-to-chronic ratio; ACR).
Because organisms usually are more sensitive to long-term exposures than to very short ones,
the chronic values are almost always lower than acute values, and so the acute-to-chronic ratio
is greater than one. As with the acute values, any measured data that are below the calculated
criterion take precedence and used as the final value.
2.10. SEDIMENT QUALITY CRITERIA
Sediment quality criteria have been proposed by the USEPA (Di Toro et al., 1991) for nonpolar
organic substances, by the province of Ontario (Persaud et al., 1992) for metals, and by the
NOAA (Long and Morgan, 1991) for a variety of substances. The USEPA approach differs from
the other two, which use a similar method but rely on a different database.
2.10.1. Equilibrium Partitioning Method
Nonpolar organic substances partition between the sediment particles and the interstitial pore
water in a relatively predictable fashion. The USEPA proposed setting sediment quality
standards using toxicity data developed for aquatic organisms (e.g., daphnia, fish, and algae).
Aquatic toxicity thresholds would be determined for these organisms and set equivalent to the
maximum allowable concentration in pore water. Using equilibrium partitioning theory, the total
amount of chemical in the sediment (pore water plus particulate) could then be calculated. This
bulk sediment concentration would be the established sediment criteria.
2.10.2. Effects Range Method
Both NOAA and Ontario proposed basing sediment criteria on empirical relationships between
organism effects and sediment concentrations as determined by field measurements. Ontario
only used information from the Great Lakes (which are oligotrophic systems) to develop criteria
for metals, while NOAA incorporated data from a wide variety of freshwater and saline sites
throughout the U.S. and developed criteria for both organic compounds and metals. In this
method, the measured field concentrations are arrayed in ascending order and identified as to
whether or not measured effects on benthic biota were noted (Figure 2-3). The Effects Range-
Low (ER-L) is the sediment concentration below which measured effects have never been
observed and above which measured effects are sometimes seen. Similarly, the Effects

critical review of soil criteria methods
2-21
Range-High (ER-H) is the sediment concentration above, which effects are always seen and
below which they sometimes (but not always) occur. The Effects Range-Median (ER-M) is the
midpoint between the ER-L and ER-H. Comparison of the Ontario and NOAA values for metals
shows a significantly lower ER-L for metals using the Ontario data set. This is attributable to the
low organic matter (and thus increasing the bioavailability of the metals to aquatic organisms) in
Great Lakes water as compared to the larger set of data used by NOAA.
The state of New York, like Ontario, set two sediment levels of protection: the Lowest Effect
Level and the Severe Effect Level. The Lowest Effect Level indicates a level of contamination
that can be tolerated by the majority of organisms, but may be toxic to a few species. This was
derived as the lowest value between the NOAA and Ontario data sets. The Severe Effect Level
[adopted from the Ontario values (equivalent to the ER-H of NOAA)] indicates the concentration
at which pronounced disturbance of the sediment community can be expected and was.
Contamination in between these two levels is considered moderate.
Figure 2-3. Sediment quality criteria derivation by Effects Range determination (Long and
Morgan, 1991)
s e d i m e n t c o n c e n t r a t i o n
n o e f f e c te f f e c t
E R - L E R - H
critical review of soil criteria methods
3-1
3. SOIL CRITERIA VALUES
A comparison of ecological soil criteria for selected metals from various jurisdictions (Table 3-
1)shows that criteria for most metals (except for mercury) are less than an order of magnitude
among the different methods employed by various countries. This suggests that the differences
in approaches may be relatively minor. However, the fact that mercury, which acts more like an
organic substance than a metal, has criteria spanning a 20-fold range, suggests that it may be
harder to develop consistent criteria for organic substances. A compilation of all published soil
screening or criteria values is in Appendix A.
Table 3-1. Critical limits for heavy metals in soils in several countries1
Country Critical limits (mg/kg)2
Pb Cd Cu Zn Ni Cr Hg
Denmark 40 0.3 30 100 10 50 0.1
Sweden3 30-60 -- -- -- -- -- 0.2-0.3
Finland 38 0.3 32 90 40 80 0.2
Netherlands 85 0.8 36 140 35 100 0.3
Germany3 40-100 0.4-1.5 20-60 60-200 15-70 30-100 0.1-1.0
Switzerland 50 0.8 50 200 50 75 0.8
Czech Republic 70 0.4 70 150 60 130 0.4
Eastern Europe4 32 2 55 100 85 90 2.1
Ireland 50 1.0 50 150 30 100 1.0
Canada 25 0.5 30 50 20 20 0.11 From De Vries and Bakker, 19982 Values are for protection of all land uses3 The first value is for sandy soils; second value for clay soils4 Eastern Europe includes Russia, Ukraine, Moldavia and Belarus

critical review of soil criteria methods
4-1
4. CRITICAL REVIEW
This section critically examines issues associated with the approaches that currently are in use
to derive soil protection values. Significant issues include: intended application of the values,
minimum data requirements, toxicity endpoints, data extrapolations, bioavailability, assessment
factors, and validation. Some of these issues are common to all the methods; others are
specific to only one. Where different methods use variations on the same theme, both are
reviewed in relation to each other to highlight the relative strengths and weaknesses of the
alternative approaches.
4.1. APPLICATION
Soil protection values have been derived for various intended applications by the different
jurisdictions. Soil concentration levels may be established to either screen a particular site for
contaminants that may cause potential ecological dysfunction, or they may be used as cleanup
targets. The Netherlands is the only jurisdiction that explicitly acknowledges that these two
goals may require different degrees of conservatism. They have two sets of values: a higher
concentration that defines seriously contaminated sites requiring immediate cleanup (called the
“intervention value”), and a lower value that will be used as a target for desired soil quality
(called the “target value”), which is also used as the maximum amount allowable for release into
the environment. If a value is between the intervention level and the target value, then further
investigations are required to determine whether adverse effects are occurring, but remediation
may or may not be necessary.
At both the federal and provincial level, Canada recognizes that their published soil values are
most useful as screening tools. However, they require that sites be cleaned up to this level
unless a site specific assessment is done to show that 1) local background values are higher
than the published soil numbers or 2) a risk-based approach demonstrates no ecological
concern. This puts the burden of proof on the principle responsible party to demonstrate lack of
harm. For small sites, it generally is less expensive to clean up to the published levels, whereas
at wide area, complex sites the risk assessment option may be more attractive. The Canadian
numbers tend to be less conservative than those used by the Netherlands (certainly less so
than The Netherlands target values). Additionally, the Canadians are more judicious about the
use of assessment factors than are the other jurisdictions, preferring to use none, but never

critical review of soil criteria methods
4-2
more than a factor of five (see Section 4.6 for a further critique of the use of assessment
factors).
The other jurisdictions explicitly state that their values are developed for screening purposes
only and should not be used as remediation goals. This requires that additional site-specific
assessments always be conducted in instances where soil concentrations exceed the screening
value. In order to refute the presumption of risk that has been established in these cases, it is
most likely that bioassays or field studies would be required. Development of the screening
values relied on a literature review and desktop models of trophic transfers, generic exposure
pathways, and assumptions about bioavailability with very conservative exposure assumptions.
For example, 100% bioavailability is assumed, wildlife are estimated to consume 100% of their
diet from material containing the substance of concern, and invertebrates are assumed to be
stationary in the contaminated portion of the soil. Most of the jurisdictions recognize the
conservative nature of these values, and consider them to be protective rather than predictive.
That is, the goal is to make sure that no contaminated sites are mistakenly screened out and
declared “clean” when they really are not. Thus, they are willing to accept false positives (i.e.,
declaring a site “contaminated” when it is not), and to rely on the Tier 2 process to exonerate
parties in such cases.
States and provinces are developing guidance for Tier 2 assessment of sites that do not pass
the screening phase. British Columbia, Washington state, Oregon, Michigan, and
Massachusetts, for example, all have simple, easy to follow guidance for Tier 1 and Tier 2
assessments (see websites for Departments of Environmental Quality for the various states or
the British Columbia Ministry of Environment, Lands, and Parks to access specific guidance
documents). Tier 2 relies on development of site-specific bioavailability and trophic transfer
factors, either through relationships established from tissue analysis of field-collected biota or in
laboratory bioassays. Further refutation of the presumption of risk requires site-specific field
studies of ecological effects.
Experience has shown that the screening values generally are quite conservative and below
site-specific risk levels, with the exception of values for bioaccumulative compounds that did not
have wildlife values included in their derivation. However, for small sites (less than 5 hectares),
or sites located within urban or industrial areas, it generally is not cost-effective to conduct a
site-specific assessment. Thus, the conservative screening values often become de facto
cleanup goals for these sites.
critical review of soil criteria methods
4-3
4.2. MINIMUM DATA SET REQUIREMENTS
All of the approaches for deriving soil protection values rely on published studies. The CCME
has a minimum data set requirement for substances having only acute data. In those instances,
at least three studies must be used, including at least one terrestrial plant and one soil
invertebrate study. For all other jurisdictions and derivation methods, the implicit assumption is
that even a single acceptable datum point is sufficient to set an SPV, albeit generally requiring
the use of an assessment factor. In contrast to the relatively stringent data requirements for
derivation of water quality criteria (a minimum of eight acute toxicity tests representing species
from eight different families plus at least three chronic tests including one fish and one
invertebrate and an algal assay), minimum data requirements are not included in soil protection
value approaches. Recommendations from the recently convened SETAC-sponsored
workshop on Methods for Hazard Assessment of Metals in Soils (Madrid, Spain, June 1999)
include a minimum data set of three soil invertebrates (an earthworm, a collembola, and an
enchytrid) and three plants (lettuce, radish, and a grass). This minimum dataset reduces
uncertainty regarding the distribution of species sensitivity that would exist with smaller
datasets.
4.3. TOXICITY ENDPOINT
All of the methods currently in use for soil protection value derivation rely on NOAEC or LOAEC
values from chronic studies, except for British Columbia, which prefers EC20, or LC50 values.
The CCME preferred method includes both NOAEC and LOAEC endpoints, chronic ECx, and
acute LC50s. Scientists have concluded that NOAECs do not accurately reflect a toxicity
threshold, as they are more a function of test design than an actual dose-response relationship
(e.g., Chapman et al., 1996). In fact, by only slightly changing the spacing of the test
concentrations, Chapman et al. (1996) were able to change the calculated NOAEC in an aquatic
toxicity test by nine-fold. Of even greater importance in NOAEC determination is the number of
replicates at each treatment level relative to the amount of variability in a measured endpoint.
An endpoint that is highly variable will return a NOAEC at a higher concentration than one with
low variability, given the same number of replicates at each treatment level. Thus, the NOAEC
(or corresponding LOAEC) becomes more an artifact of statistical design and acuity than an
actual measure of toxicity.

critical review of soil criteria methods
4-4
Moreover, the use of a hypothesis test design to determine if one treatment is statistically similar
to another is not an appropriate statistic to use in a regulatory context such as determination of
toxicity thresholds. What is needed is a complete description of the dose-response relationship,
so threshold concentrations can be determined, but only within relationship to the form of the
remainder of the response function. If the concentration-response curve is very steep, this
would suggest more protective levels might be required than for a chemical with a very shallow
response function. In the first case, only a small addition of more chemical into the environment
could potentially to cause a large response, while in the latter case a substantial amount of
chemical could be added before an adverse effect would occur. Thus, in the ideal case,
information would be available about the slope of the response function, as well as values close
to the true toxicity threshold.
In human health risk assessments, this issue has been dealt with by using the Benchmark Dose
(Rees and Hattis, 1994). The Benchmark Dose is calculated as the concentration at the upper
95th confidence interval of the EC10. (Figure 4-1). The Reference Dose (RfD) is then calculated
as the Benchmark Dose divided by appropriate assessment factors to provide a large "margin of
safety." The Benchmark Dose has intuitive appeal, as it relies on calculation of the entire dose-
response function, rather than a NOAEC derived from hypothesis testing.
Figure 4-1. Derivation of the Benchmark Dose for human health risk assessment
Benchmark
Concentration (dose)
EC10
95% Upper Confidence Interval
Response
10%
20%

critical review of soil criteria methods
4-5
The test design required for determination of point estimates differs slightly from that used in
hypothesis testing in that it requires fewer replicates, but more test concentrations. Several
researchers have concluded independently that most of the NOAEC values determined in
terrestrial toxicity tests following standard protocols such as the ASTM early seedling growth
(ASTM, 1994) are equivalent to an EC20 (personal communications, Brad Sample, CH2M Hill
and Gladys Stephenson, ESG International). Therefore, using a Benchmark Dose approach at
the EC10 or EC20 is equally protective, but more consistent among laboratories (Chapman et al.
1996), than the use of a NOAEC.
4.4. EXTRAPOLATIONS
Most jurisdictions use extrapolation methods to estimate a single soil protection value from the
array of reported toxicity threshold endpoints. The Europeans assume that all species
responses lie within a log normal distribution and calculate the 5th percentile. The CCME uses
the 25th percentile. British Columbia deviates from this approach by arraying the ECx or LCx
values along a straight line to estimate the "true" EC20 and LC50. All of these approaches have
drawbacks identified by Hopkin (1993).
Hopkin (1993) argues that there are four main objections for adopting the 5th percentile of
species toxicity values as the soil criteria. First, this assumes that the most sensitive 5% of the
species are not important ecologically and can be killed by the pollution. This may be in
violation of other laws, such as the Endangered Species Act. Second, this method provides no
means of making sure that ecosystem functions are protected, only that species diversity is
considered. Third, the value may not be sufficiently protective to include reasonable worse case
scenarios. And fourth, the toxicity values relate to individual effects and it is not known how
these translate into population level consequences.
However, Hopkin's first argument that 5% of the species would not be protected probably is not
true. Using a function such as the log normal distribution to represent the range of possible
species sensitivities can result in unrealistically low values at the 5th percentile (i.e., generate
value substantially lower than the most sensitive species response measured) as a result of a
large number of very insensitive species. Insensitive species increase the spread of the
distribution and stretch the lower, sensitive end of the assumed distribution. Other functions
such as the Weibull function may not be as sensitive to this effect, but still are affected to some
degree by highly insensitive species. Most importantly, there is no scientific basis on which to
critical review of soil criteria methods
4-6
choose which function to use to represent the distribution of species sensitivities. Hopkin (1993)
and Scott-Fordsmand et al. (1996) both independently concluded that the use of the log-normal
distribution and 5th percentile calculations nearly always result in soil protection values for
metals that are significantly below normal background concentrations. Therefore, they both
conclude that the method is not feasible for use with metals. While similarly calculated values
for synthetic organic substances cannot be compared to background concentrations, it is likely
that they, too, are well below the assimilative capacity of the environment as the consequences
of statistical artifact forcing the criteria value below any response likely to occur with these
compounds as well.
The USEPA water quality criteria approach attempts to accommodate the shortcomings of the
extrapolation method by using only the four most sensitive (measured) genera and applying a
triangular distribution to derive the 5th percentile. Thus, addition of new, less sensitive species
to the data set does not change the derived endpoint as it would in the log normal functions.
This method does not "lose" information, as critics claim, but rather derives a protective value
that is not unduly influenced by a large number of insensitive species.
4.5. BIOAVAILABILITY ADJUSTMENTS
The toxicity of a contaminant is influenced by its bioavailability. Both pH and organic matter
content can influence the bioavailability of chemicals. In the derivation of soil protection values,
bioavailability of the contaminant to biota is not considered by any jurisdiction, with the
exception of The Netherlands. The Netherlands has developed algorithms for some metals to
standardize toxicity values in terms of pH and organic matter. The algorithms were derived from
analyses of soil parameters from uncontaminated sites. Their data are standardized to 10%
organic matter. It is not clear whether these adjustments would work outside of the specialized
conditions of the region, nor is it clear how much uncertainty is introduced with these
adjustments.
4.6. ASSESSMENT FACTORS
Because of the apparent shortcomings of the extrapolation method, particularly the requirement
for a relatively large data set, many jurisdictions provide the alternative approach of selection of
a low value and division by appropriate assessment factors (also called uncertainty factors or
safety factors). Cowan et al. (1995) suggest that this should be the preferred approach for
setting values protective of terrestrial systems. Assessment factors range from three to 1,000,
critical review of soil criteria methods
4-7
depending upon the jurisdiction and degree of desired conservatism. CCME is the least
conservative of the jurisdictions using assessment factors, considering that the data themselves
contain a large amount of conservative assumptions and therefore recommending that
assessment factors should never exceed five. Most other jurisdictions apply orders of
magnitude assessment factors in sequence, to account for interlaboratory variability,
interspecific differences, and laboratory-to-field extrapolations.
For metals, dividing the lowest reported LOAEC by more than a factor of 10 often results in
values that are below background concentrations (e.g., Scott-Fordsmand et al., 1996).
Certainly, division of the lowest reported NOAEC (or any reported NOAEC, for that matter) by
100 or 1,000 will result in values so low as to be meaningless for screening out chemicals of
little environmental concern. Therefore, for this reason alone, the assessment factor approach
should be viewed with caution. Chapman et al. (1998) point out that applications of assessment
factors are a matter of policy, not science, and grew out of human health risk assessments
where a true margin of safety was desired to make sure that regulatory action levels were well
below the predicted no effect level.
There is, however, sufficient knowledge about differences in measured endpoints among
species, laboratories, and test conditions for ecological receptors to make some science-based
generalizations. For plants, species differ in sensitivity by about 300-fold, and results obtained
in glasshouse studies are not consistently higher or lower than those obtained in field studies
(Fletcher, et. al, 1990; Kapustka and Reporter, 1993; Chapman et al., 1998). Examination of
chemical data sets with information on animal species sensitivity differences has shown that all
species are within an order of magnitude of each other (Chapman et al., 1998; Baril et al.,
1994). Therefore, in situations where policy dictates that assessment factors should be used to
accommodate uncertainty for protection of untested species under field conditions, the CCME
approach of dividing by no more than five is supported by this information. Application of any
additional safety factors will be a matter of policy and not a science-based approach. However,
it is likely that this will result in criteria that are well below background concentrations for metals
and ambient concentrations for organic substances (ambient concentrations are defined as an
anthropogenically derived background resulting from diffuse nonpoint source applications such
as atmospheric deposition).
critical review of soil criteria methods
4-8
4.7. EQUILIBRIUM PARTITIONING
The equilibrium partitioning approach is based on three assumptions. First, this method
assumes that toxicity to terrestrial organisms results from exposure to chemicals in the
interstitial pore water. Further, it assumes that chemicals in soil are in equilibrium between
partitioning into the solid matrix and into the pore water. Further, this method assumes that
sensitivity of terrestrial organisms to exposures through an aquatic medium is no different than
that of terrestrial organisms. However, none of these assumptions are true.
Exposure to chemicals by soil-dwelling organisms is through uptake from the pore water and off
of soil particles. Most plants accumulate virtually all nutrients and water through mycorrhizal
fungi. The zone surrounding roots, known as the rhizosphere, is populated by microorganisms.
Plant roots, along with symbiotic and associative microorganisms in the rhizosphere, alter their
microenvironment in ways that facilitates extraction of substances not represented in pore water
fractions. Furthermore, plants can restrict root growth into contaminated micro-zones or
suspend uptake processes in roots exposed to harmful substances. Of the soil invertebrates,
only enchytrids live wholly within the soil pore water. Many of the other families actually are
exposed to soil contaminants through the intra-soil food chain, by consuming microorganisms,
fungi, decaying plant material, or other invertebrates. Some organisms, such as the earthworm,
actively ingest soil particles and may have some chemical exposure from removal of materials
within the gastrointestinal tract.
The assumption of chemical equilibrium in the soil also is not met. As discussed above, the
presence of soil organisms themselves disrupts any stable equilibrium through the active
processes of nutrient uptake, decomposition, and energy cycling. Furthermore, physical-
chemical processes leading to equilibrium are slow acting and may be disrupted by chaotic
environmental processes such as leaching following rain events.
Finally, there is no scientific basis for the assumption that aquatic and terrestrial organisms
respond similarly to chemical exposures. In point of fact, mechanistic toxicology suggests
otherwise. For metals, for example, aquatic animals are exposed primarily through competitive
binding of the cations to the gill membrane. This results in disruption of blood oxygenation.
Terrestrial plants, on the other hand, are exposed by uptake through root surface or cortical
membranes, which may be active or passive events and depend upon cell membrane channels
or ion pumps. Terrestrial animal exposure is through similar mechanisms in gut wall epithelial
cells. Mode of action and detoxification mechanisms for metals and organic substances also
critical review of soil criteria methods
4-9
differ to a significant extent between aquatic and terrestrial organisms. Terrestrial animals rely
more heavily on metallothioneins for metal sequestration and elimination than do aquatic
animals, have significantly different metabolic partitioning of chemicals within the body, and
have significant differences in kidney and liver physiology relating to detoxification and
elimination rates. The significance of these differences is substantiated by comparison of
results from daphnia testing with tests of the same chemicals in earthworms that show no
predictable relationship (Clausen, 1999).
4.8. VALIDATION
An essential step in establishing soil protection values, whether for screening or as cleanup
goals, is verification of protectiveness and reasonableness. Most jurisdictions state that the
values should not be below background (for naturally occurring substances) or below analytical
detection limits for xenobiotics. National or regional average background levels generally are
provided in the guidance documents. Guidance documents further suggest that site-specific
background levels can be derived, but only with oversight from the regulatory body. USEPA
Region IV is the only jurisdiction that explicitly states that toxicologically-derived numbers are to
be used for screening values in all cases, regardless of whether or not they were lower than
background. However, regional guidance is silent on the subject of cleanup target values (i.e.,
whether cleanup would be required below background concentrations).
While most of the guidance documents tabulate regional or national background levels together
with their toxicologically derived values, all the values still are presented, even if the derived
values are below background. ORNL also published site-specific background numbers derived
from uncontaminated areas on the Oak Ridge reservation, but likewise included all of the
toxicologically-derived values. Thus, the user must be cognizant of the need to compare all
screening values with the appropriate background concentrations prior to making a final
determination of whether or not a substance is listed as a concern at a site.
The methods used to set soil protection values often yield values below background
concentrations. This raises questions about the appropriateness of the extrapolation methods,
but also begs for an ecotoxicological explanation. The ecological foundation of the problem lies
in the fact that organisms evolved or adapted to great ranges of soil concentration of naturally
occurring substances (Fairbrother and Kapustka, 1997). Organisms exhibit different levels of
required nutrients and varying degrees of tolerance to soil concentrations of naturally occurring

critical review of soil criteria methods
4-10
substances. Assemblages of plants, soil invertebrates, microorganisms, and to some extent
birds and mammals reflect niche preferences aligned with local or regional patterns of
background concentrations. Levels that are toxic to some organisms are optimal for others
organisms and deficient for yet another suite of organisms. The procedures for developing
SPVs generally search for the lowest concentrations that affect the most sensitive species.
Such efforts generally are independent of regional differences in background concentrations,
therefore, when applied over large geographic areas they may be unreasonable for screening
purposes. As such values often are misused as cleanup targets, they may also fail in terms of
being protective; if the clean up goals fall below the nutrient requirement levels for the regional
biota deficiency conditions would occur.
Furthermore, the design of laboratory toxicity studies conducted to derive the toxicity threshold
values have not addressed the need to use organisms acclimated to normal background levels
of metals and minerals and frequently produce values much lower than would ever be found in
natural systems. This problem has been recognized in the European approach to setting PNEC
values for regional or large-scale risk assessments (Dutch National Health Council, 1998).
There has been no systematic examination of spatial distribution of background concentrations
to determine how much of an area within a state, province, or country has naturally occurring
levels above toxicologically-derived values. If large areas have background levels higher than
the screening values, then the toxicologically-derived values are of little use. Either no sites
would pass the screens or regional background concentrations would become the default
screening level. There also has been no evaluation of how site-specific ecological risk
assessments and cleanup goals compare to SPVs. Reports of literature reviews, field studies,
and regulatory assessment documents (e.g., USEPA Superfund Records of Decision) could be
reviewed to determine if significant ecological risks have been detected at soil concentrations
comparable to the screening values. If such analysis documented adverse ecological effects
within an order of magnitude or so of toxicologically-based SPVs, there would be justification for
the process. However, if adverse effects are not demonstrated until much higher concentrations
are present, then the process should be revisited. Until such validation steps are taken, the
published soil protection values remain as “best guess” toxicological targets that may or may not
relate to significant ecological consequences at the population, community, or systems level.
critical review of soil criteria methods
4-11
4.9. PEER REVIEW
Most of the soil protection values have not undergone peer review. The USEPA requires peer
review and public comment on all policy and regulatory requirements prior to implementation.
Not all jurisdictions have such a policy. The CCME and British Columbia guidelines for soil
criteria derivation both underwent considerable scientific and public review prior to adoption.
The ORNL approach has not received such a review, nor has the European approach. The
European numbers are being reviewed and challenged during the current EU process of risk
assessment of chemicals in commerce, providing an opportunity for comment and revision
during the application process (similar to the notion of adaptive management by the U.S.
resource management agencies). Australia requires some level of public review, but it is not
known to what extent this occurred for the ecological risk assessment guidelines.

critical review of soil criteria methods
5-1
5. CONCLUSIONS
As development pressures from an expanding human population increase, requirements for
cleanup of contaminated sites will continue to grow. Natural areas must be of sufficient quality
to maintain desired species on diminishing acreage. Managed lands will provide a greater
proportion of refugia for wild plants and animals and should not become a population sink
because of excessive contamination. Therefore, regulatory bodies will be faced with an
increasing need to provide soil screening values and, ultimately, cleanup goals and discharge
targets. This review of the methods currently in use by various jurisdictions for derivation of
such values highlights the inadequacy of our current knowledge for setting realistic numbers.
We continue to be faced with the necessity of using highly conservative exposure assessments
and deriving information from laboratory toxicity studies that frequently were designed for other
purposes. Added to this is the desire of regulatory bodies to be precautionary during a
screening level assessment to ensure that all contaminated sites are given further
consideration. For these reasons, the final values derived by most of the methods reviewed
here tend to include the use of assessment factors to provide a “margin of safety.” Given the
conservative nature of the final values, a systematic validation process needs to be done to
determine 1) what proportion of the jurisdictions to which the various values apply would default
to background levels (for naturally occurring substances) as the toxicologically-derived values
are too low and 2) what proportion of tested sites have been screened out by this procedure. If
the development of toxicologically-based soil screening values fails to screen out sites, or only
screens those out that are at background, then the need for such conservative values becomes
questionable.
All jurisdictions use the same base of toxicological and exposure information to derive their soil
values. Final numbers differ primarily in how the literature is qualified for use, what
measurement endpoints are acceptable (e.g., only reproduction endpoints; NOAEC/LOAEC vs.
ECx), how interspecific differences are treated, and what type of assessment factors are
applied. Ecological procedures differ most from human health criteria development due to the
vast array of species under consideration and the ecotoxicological differences among the
species. Ecological assessments are concerned with protection of a wide variety of species.
There is often an expressed desire to develop screening values that are protective of “the most
sensitive species,” even when it is not known which species this is or how sensitive they might
be. This has lead to the various approaches using statistical distributions, arrays, or single

critical review of soil criteria methods
5-2
study effects data from toxicological tests. In aquatic systems, procedures for development of
water quality criteria and sediment quality screening levels have been debated extensively.
Difficulties with the distributional approach stem from a lack of knowledge about the shape of
the distribution of species sensitivities and, even more, from insensitive species broadening the
potential range of the distribution. The water quality criteria derivation solved this issue by using
only the lower end of the species sensitivity curve to derive threshold values. This should be
reviewed critically for terrestrial species as well. The approach for setting sediment screening
values follows that suggested by CCME (when few data exist) and ORNL (for soil organisms) by
setting a value between the concentrations at reported NOAEC and LOAEC values from all
studies. The sediment screening values went one step further, however, by basing the exercise
on field-collected data (relating benthic invertebrate community structure to sediment
concentration), rather than relying on laboratory toxicity tests as is done for derivation of soil
values.
Several regulatory bodies have been working towards development of soil protection values for
nearly a decade. While a lot of thought has gone into the derivation of each of the methods,
there obviously is no consensus about the best approach. All of the methods have a large
degree of built in conservatism, although some jurisdictions recognize that different land uses
may not need to support the same diversity of ecological services and functions and allow less
conservative numbers to be used for commercial, industrial, or residential lands. Regardless of
the methods chosen, all numbers are toxicologically based and do not incorporate many
ecological considerations.
Although the process for derivation of soil screening values is based on ecotoxicological
principles, regulatory policy has a significant influence on the outcome. How issues such as
level of protection, use of assessment factors, background levels, and minimum data
requirements are addressed varies with jurisdictions, which in turn affects the final values. It is
important the users of these values recognize that both science and policy contribute to the
derivation of soil protection values.
critical review of soil criteria methods
R-1
REFERENCES
Technical Guidance Documents
Bachmann, G. K., Terytze, F. Ruck, C. G. Bannick. 1997. Precautionary soil values according tothe upcoming Federal soil protection legislation. Handout for the ECE-Workshop onMapping Critical Loads for Heavy Metals. Federal Environmental Agency, Germany.2027/03/10/97. 10 pp.
BCME (British Columbia Ministry of the Environment). 1996. Overview of CSST Procedures forthe derivation of soil quality matrix standards for contaminated sites. BCME, RiskAssessment Unit, Victoria, Canada. 51 pp.
Beyer, W. N. 1990. Evaluating soil contamination. United States Fish and Wildlife Service.Biological Report 90(2). 25pp.
CCME (Canadian Council of Ministers of the Environment). 1996. A protocol for the derivation ofenvironmental and human health soil quality guidelines. CCME-EPC-101E. Ottawa,Canada. 169 pp.
CCME (Canadian Council of Ministers of the Environment). 1996. Guidance manual fordeveloping site-specific soil quality remediation objectives for contaminated sites inCanada. En-108-4/9 1996E. Ottawa, Canada. 45 pp.
CCME (Canadian Council of Ministers of the Environment). 1997. Recommended Canadian SoilQuality Guidelines. CCME, Winnipeg, Manitoba.
Crommentuijn, T., M.D. Polder, and E.J. van de Plassche. 1997. Maximum PermissibleConcentration and Negligible Concentrations for Metals, Taking BackgroundConcentrations into Account. RIVM Report No. 601501001, The Netherlands.
De Vries, W. and D. J. Bakker. 1998. Manual for calculating critical loads of heavy metals forterrestrial ecosystem: Guidelines for critical limits, calculation methods and input data.TNO Institute of Environmental Sciences, Energy Research and Process Innovation. DenHelder, The Netherlands. 144 pp.
DiToro, D. M., C. S. Zarba, D. J. Hansen, W. J. Berry, R. C. Swartz, C. E. Cowan, S. P. Pavlou, H.E. Allen, N. A. Thomas, and P. R. Paquin. 1991. Technical basis for establishing sedimentquality criteria for nonionic organic chemicals by using equilibrium partitioning. Environ.Toxicol. Chem. 10:1541-1586.
Dutch National Health Council. 1998. Zinc: summary, conclusions, and recommendations . DutchNational Health Council Commission for the Risk Assessment of Substances. Published4/2/98. 5pp.
Efroymson, R. A., M. E. Will, and G. W. Suter II. 1997a. Toxicological benchmarks forcontaminants of potential concern for effects on soil and litter invertebrates andheterotrophic processes. Oak Ridge National Laboratory, Oak Ridge, TN. 110 pp.ES/ER/TM-126/R2.

critical review of soil criteria methods
R-2
Efroymson, R. A., M. E. Will, G. W. Suter II, and A. C. Wooten. 1997b. Toxicological benchmarksfor screening contaminants of potential concerns for effects on terrestrial plants: 1997revision. Oak Ridge National Laboratory, Oak Ridge, TN. 128 pp. ES/ER/TM-85/R3.
Enslein, K. 1988. An overview of structure-activity relationships as an alternative to testing inanimals for carcinogenicity, mutagenicity, dermal and eye irritation and acute oral toxicity.Toxicology and Industrial Health. 4:479-498.
Environment Australia. 1997. Draft national framework for ecological risk assessment ofcontaminated sites. Part B: Derivation of ecological impact levels for soil. EnvironmentAustralia, Contaminated Sites Section. Kingston, Australia. 59 pp.
European Community. 1996. Technical guidance on environmental risk assessment of existingsubstances in the context of Regulation 94. Brussels, Belgium.
Friday, G. P. 1998. Ecological Screening Values for Surface Water, Sediment, and Soil.Westinghouse Savannah River Company, WSRC-TR-98-00110, Aiken, SC.
Long, E. R. and L. G. Morgan. 1991. The potential for biological effects of sediment-sorbedcontaminants tested in the National Status and Trends Program. NOAA TechnicalMemorandum NOS OMA 52, National Oceanic and Atmospheric Administration. 175 pp.
Ministry of Environment and Energy (MOEE). 1996. Guideline for use at contaminated sites .http:..www.ene.gov.on.ca. 83pp.
Ministry of Housing, Spatial Planning, and Environment (MHSPE). 1994. Intervention Values andTarget Values – Soil Quality Standards. Directorate General for Environmental Protection,Department of Soil Protection, The Hague, The Netherlands.
Ministry of Housing, Spatial Planning, and Environment (MHSPE). 1998. Soil Protection Act.Directorate General for Environmental Protection, Department of Soil Protection, TheHague, The Netherlands.
Sample, B. E., D. M Opresko, and G. W. Suter II. 1996. Toxicological benchmarks for wildlife:1996 revision. Oak Ridge National Laboratory, Oak Ridge, TN. 227 pp. ES/ER/TM-86/R3.
Stephan, C. E., D. I. Mount, D. J. Hansen, J. H. Gentile, G. A. Chapman, and W. A. Brungs. 1985.Guidelines for deriving numerical national water quality criteria for the protection of aquaticorganisms and their uses. PB85-227049. National Technical Information Service,Springfield, VA. 98 pp.
USEPA (Environmental Protection Agency). 1989. Risk assessment guidance for Superfund,Volume II: Environmental evaluation manual. USEPA, Washington, D.C. EPA./540-1-89/001.
USEPA (Environmental Protection Agency). 1996. Ecotox thresholds . Eco Update Bulletin 3(2).Office of Solid Waste and Emergency Response. EPA 540/F-95/038. 12 pp.
WSRC (Westinghouse Savannah River Site). 1998. Ecological screening values for surfacewater, sediment, and soil. WSRC-TR-98-00110. Westinghouse Savannah RiverCompany, Aiken, South Carolina. 67pp.

critical review of soil criteria methods
R-3
Supporting references
American Society for Testing and Materials (ASTM). 1994. Standard practice for conducting earlyseedling growth tests {E 1598-94]. Annual Book of ASTM Standards. American Society forTesting and Materials, Philadelphia, PA.
Baril, A., B. Jobin, P. Mineau, and B. T. Collins. 1994. A consideration of inter-species variability inthe use of the median lethal dose (LD50) in avian risk assessment. Technical ReportSeries No. 216, Canadian Wildlife Service Headquarters. Environment Canada, Ottawa.
Chapman, P. M., R. S. Caldwell, and P. F. Chapman. 1996. A warning: NOECs are inappropriatefor regulatory use. Environmental Toxicology and Chemistry. 15:77-79.
Chapman, P. M., A. Fairbrother, and D. Brown. 1998. A critical evaluation of safety (uncertainty)factors for ecological risk assessment. Environmental Toxicology and Chemistry. 17:99-108.
Clausen, H. 1999. On the need for classification of chemicals for effects on the terrestrialenvironment. In: Vega, M. M., A. Berthold, H. Clausen, P. Ingnagel, A. Fresno, S. Aycart,C. Ramos, E. Berggen, and J. V. Tarazona (eds.). Approaches for a hazard identification-classification system for the terrestrial environment; workshop proceedings, Madrid.November 1998. (Publ. April 1999). Environmental Chemicals Bureau, EuropeanCommission, Ispra Italy.
Cowan, C. E., D. J. Versteeg, R. L. Larson, and P. J. Kloepper-Sams. 1995. Integrated approachfor environmental assessment of new and existing substances. Regulatory Toxicology andPharmacology. 21:3-21.
DynCorp. 1998. Ecological soil screening level methodology summaries . Prepared for USEPASuperfund. March 16, 1998. 27pp.
Hopkin, S. P. Ecological implications of "95% protection levels" for metals in soil. Oikos . 66:137-141.
Fairbrother, A., and L. A. Kapustka. 1997. Hazard classificiation of inorganic substances interrestrial systems. International Council on Mtals and the Environment, Ottawa, Canada.
Fletcher, J. S., F. L. Johnson, and J. C. McFarlane. 1990. Influence of greenhouse versus fieldtesting and taxonomic differences on plant sensitivity to chemical treatment. EnvironmentalToxicolology and Chemistry. 9, 769-776
Kapustka, L. A. and M. Reporter. 1993. Terrestrial Primary Producers. Chapter 14, pages 278-298 in P. Calow, ed. Handbook of ecotoxicology . Blackwell Press, London, UK.
Kimerle, R. A., L. W. Barnthouse, R. P. Brown, B. Conilh de Beyssac, M. Gilbertson, K. Monk, Hpp. Poremski, R. E. Purdy, K. H. Reinert, R. M. Rolland, and M. G. Zeeman. 1995.Ecological effects. In: Swanson, M. B. and A. C. Socha (eds.). Chemical ranking andscoring: guidelines for relative assessments of chemicals. SETAC Press, Pensacola, Fl.Pp. 89-112.

critical review of soil criteria methods
R-4
Mac Donald, D. D. and A. Sobolewski. 1993. Recommended procedures for developing site-specific environmental quality remediation objectives for contaminated sites in Canada.Prepared for CCME Subcommittee on Environmental quality Criteria for ContaminatedSites. Ottawa, Ontario 194pp.
Michigan DEQ. 1998. Integrated table of Part 201 cleanup criteria and screening levels.http://www.deq.state.mi.us/erd/critguide/texplan.html. Michigan Department ofEnvironmental Quality, Environmental Response Division. April 14, 1998.
Persaud, D., R. Jaagumagi, and A. Hayton. 1992. Guidelines for the protection and managementof aquatic sediment quality in Ontario. Ontario Ministry of the Environment, Queen's Printerfor Ontario. London, Ontario.
Rees, D. C. and D. Hattis. 1994. Developing quantitative strategies for animal to humanextrapolation. In: A.W. Hayes (ed.). Principles and Methods of Toxicology; 3rd ed. RavenPress, Ltd., New York. Pp. 275-315.
Scott-Fordsmand, J. J., M. B. Pedersen, and J. Jensen. 1996. Setting a soil quality criterion.TEN. 3:20-24.
Van Straalen, N. M. and C. A. J. Denneman. 1989. Ecotoxicological evaluation of soil qualitycriteria. Ecotoxicology and Environmental Safety. 18: 241-251.
Wagner, C. and H. Løkke. 1991. Estimation of ecotoxicological protection levels from NOECtoxicity data. Water Research. 26:1237-1242.
Zeeman, M. 1995. Ecotoxicity testing and estimation methods developed under Section 5 of theToxic Substances Control Act (TSCA). Pp. 703-715 in Rand, G., ed. Fundamentals ofaquatic toxicology: Effects, environmental fate, and risk assessment, second edition.Taylor & Francis, Washington, DC.

critical review of soil criteria methods
A-1
Appendix A. Summary tables of methods for derivation of ecologically protective soilvalues
critical review of soil criteria methods
A-2
Table A- 1.
Jurisdiction European Community
Technical GuidanceDocument
Technical guidance on environmental risk assessment ofexisting substances in the context of Regulation 94
Date 1996
Application Screening, clean-up, and risk assessment
Approach The Europeans use the Factor Application Method whenthere is little data. This applies an assessment factor to thelowest LC50 or NOAEL. When there have been numerousstudies on different species, the Distribution Based Approachis used. This assumes that the frequency distribution followsa log-normal distribution, and calculates the final criterionvalues as the 5th percentile of the distribution.
Trophic Levels Soil invertebrates, plants
Validation Mostly just for metals
Soil Values Available No
Other Comments

critical review of soil criteria methods
A-3
Table A- 2
Jurisdiction The Netherlands
Technical GuidanceDocument
Manual for calculating loads of heavy metals for terrestrialecosystem: Guidelines for critical limits, calculation methodsand input data
Date 1998
Application Clean-up, screening
Approach The Netherlands adds to the approach of the rest of theEuropean Community. In the absence of soil toxicity data,the Dutch propose that soil pore water concentration beestimated through equilibrium partitioning. The critical soilconcentration is derived using aquatic toxicity thresholdvalues and the equilibrium partitioning theory. They alsocalculate critical soil levels for wildlife that takes into accountBCFs derived from field-collected data.
Trophic Levels soil invertebrates to wildlife predators
Validation Yes for background concentrations of metals
Soil Values Available Yes
Other Comments
critical review of soil criteria methods
A-4
Table A- 3
Jurisdiction Canadian Council of Ministers of the Environment
Technical GuidanceDocument
Recommended Canadian Soil Quality Guidelines
Date 1997
Application Screening, clean-up goals
Approach If there have been sufficient chronic studies, the Weight ofEvidence approach is used. This takes a percentile of theNOAEC and LOAEC numbers, and divides by an uncertaintyfactor to get the Threshold Effect Concentration (TEC). Ifthere are not enough data for this method, the LOAECapproach is used. This arrives at the TEC by dividing thelowest LOAEC by an uncertainty factor. If there are onlyacute toxicity data, The TEC is estimated by the MedianEffects Method. By this method, the lowest reported EC50 orLC50 is divided by an uncertainty factor. Effects on microbialprocesses and wildlife are included. Land use determineswhich value is used for the final environmental guideline.
Trophic Levels soil microbes, soil invertebrates, plants, terrestrial wildlife(mammalian and avian)
Validation Gives regional or provincial background limits, may be site-specific. Detection limits for organics.
Soil Values Available Yes
Other Comments
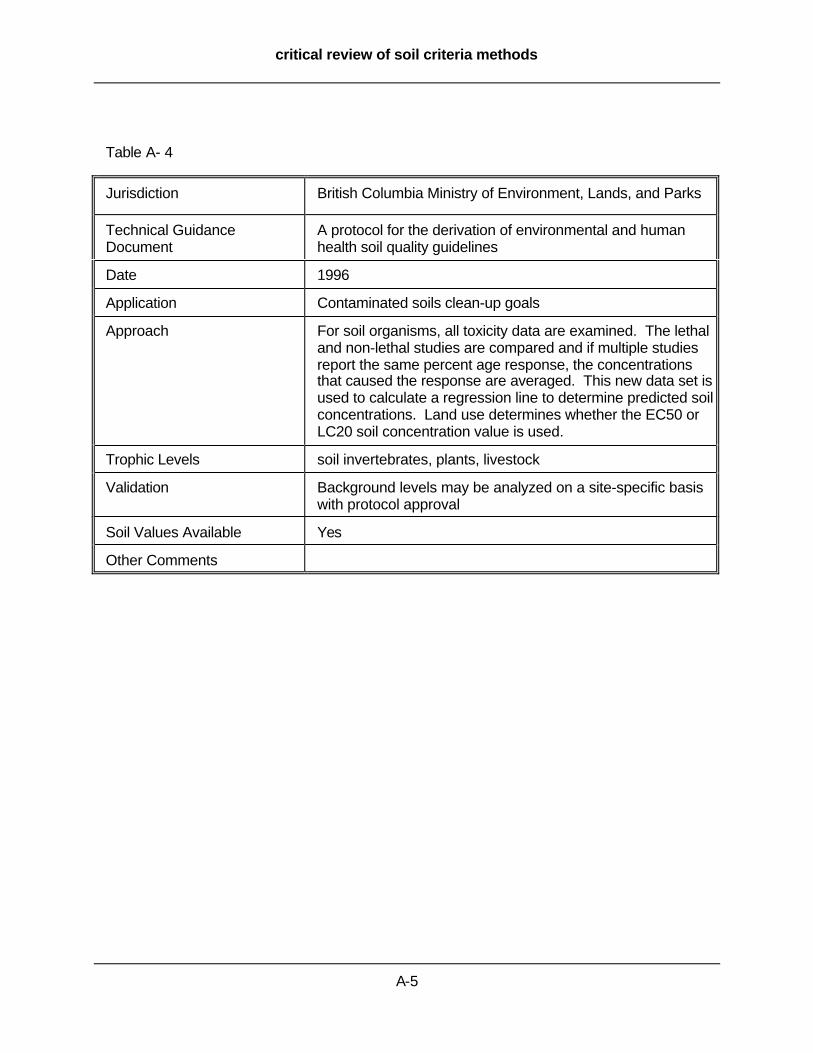
critical review of soil criteria methods
A-5
Table A- 4
Jurisdiction British Columbia Ministry of Environment, Lands, and Parks
Technical GuidanceDocument
A protocol for the derivation of environmental and humanhealth soil quality guidelines
Date 1996
Application Contaminated soils clean-up goals
Approach For soil organisms, all toxicity data are examined. The lethaland non-lethal studies are compared and if multiple studiesreport the same percent age response, the concentrationsthat caused the response are averaged. This new data set isused to calculate a regression line to determine predicted soilconcentrations. Land use determines whether the EC50 orLC20 soil concentration value is used.
Trophic Levels soil invertebrates, plants, livestock
Validation Background levels may be analyzed on a site-specific basiswith protocol approval
Soil Values Available Yes
Other Comments

critical review of soil criteria methods
A-6
Table A- 5
Jurisdiction Ontario Ministry of Environment and Energy
Technical GuidanceDocument
Guideline for use at Contaminated Sites in Ontario
Date 1996
Application Soil clean-up
Approach The soil criterion is the lowest number from human health andecological effects analysis. No documentation was found onhow the ecological effects analysis is conducted.
Trophic Levels Soil microbes, herbivores, humans
Validation Site-specific background may be developed
Soil Values Available Yes
Other Comments
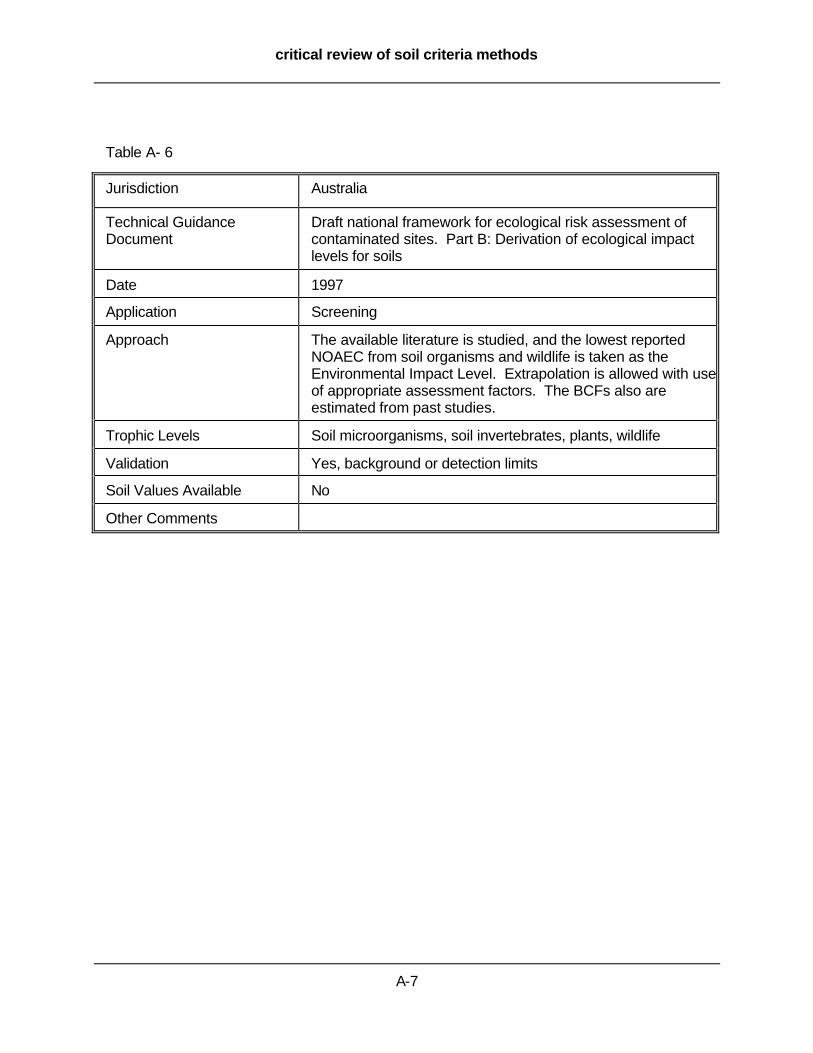
critical review of soil criteria methods
A-7
Table A- 6
Jurisdiction Australia
Technical GuidanceDocument
Draft national framework for ecological risk assessment ofcontaminated sites. Part B: Derivation of ecological impactlevels for soils
Date 1997
Application Screening
Approach The available literature is studied, and the lowest reportedNOAEC from soil organisms and wildlife is taken as theEnvironmental Impact Level. Extrapolation is allowed with useof appropriate assessment factors. The BCFs also areestimated from past studies.
Trophic Levels Soil microorganisms, soil invertebrates, plants, wildlife
Validation Yes, background or detection limits
Soil Values Available No
Other Comments
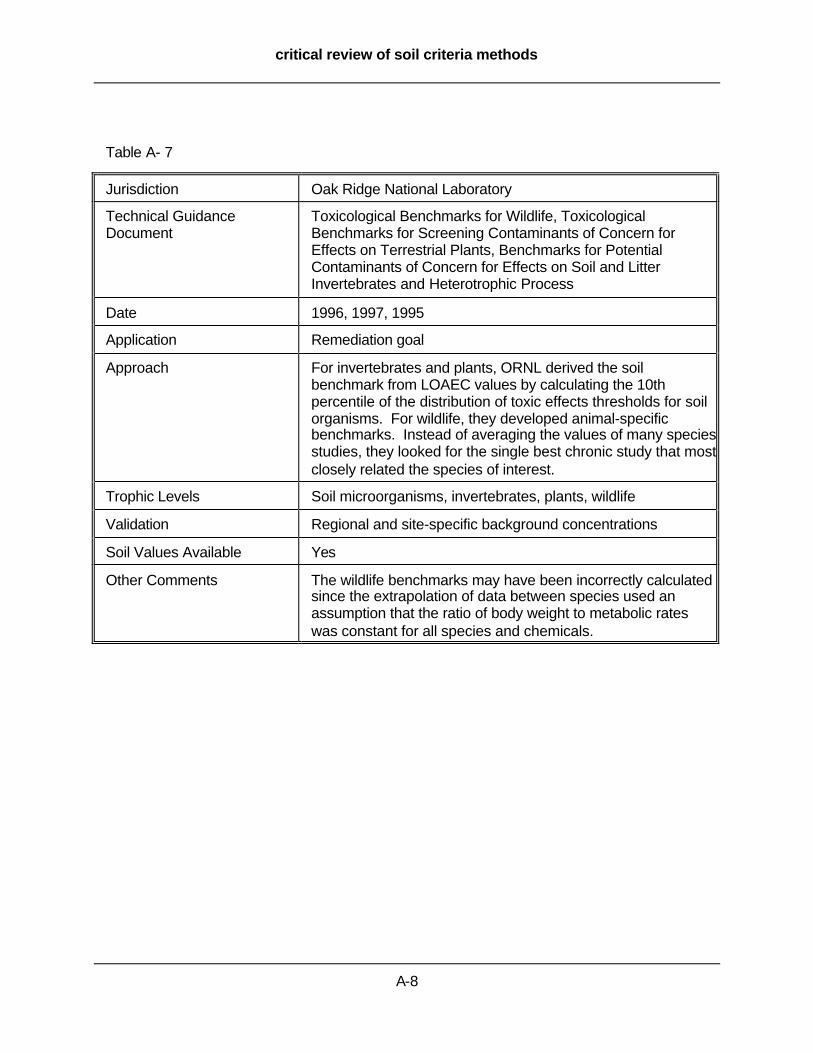
critical review of soil criteria methods
A-8
Table A- 7
Jurisdiction Oak Ridge National Laboratory
Technical GuidanceDocument
Toxicological Benchmarks for Wildlife, ToxicologicalBenchmarks for Screening Contaminants of Concern forEffects on Terrestrial Plants, Benchmarks for PotentialContaminants of Concern for Effects on Soil and LitterInvertebrates and Heterotrophic Process
Date 1996, 1997, 1995
Application Remediation goal
Approach For invertebrates and plants, ORNL derived the soilbenchmark from LOAEC values by calculating the 10thpercentile of the distribution of toxic effects thresholds for soilorganisms. For wildlife, they developed animal-specificbenchmarks. Instead of averaging the values of many speciesstudies, they looked for the single best chronic study that mostclosely related the species of interest.
Trophic Levels Soil microorganisms, invertebrates, plants, wildlife
Validation Regional and site-specific background concentrations
Soil Values Available Yes
Other Comments The wildlife benchmarks may have been incorrectly calculatedsince the extrapolation of data between species used anassumption that the ratio of body weight to metabolic rateswas constant for all species and chemicals.
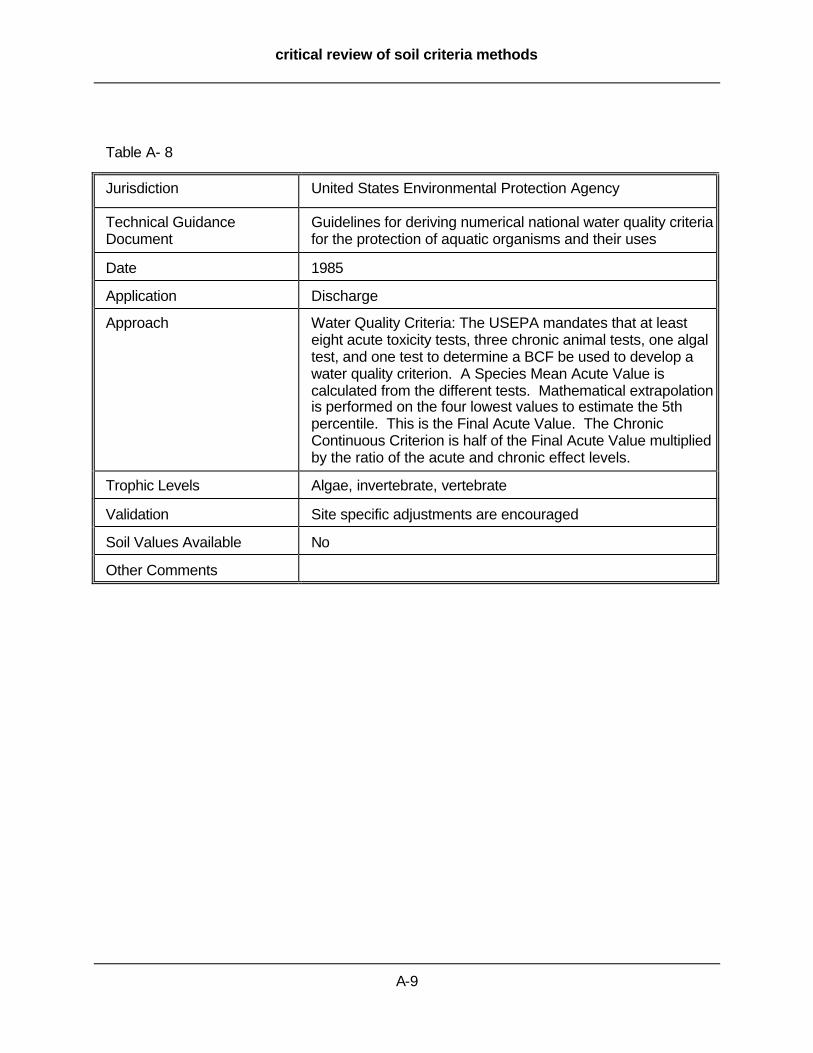
critical review of soil criteria methods
A-9
Table A- 8
Jurisdiction United States Environmental Protection Agency
Technical GuidanceDocument
Guidelines for deriving numerical national water quality criteriafor the protection of aquatic organisms and their uses
Date 1985
Application Discharge
Approach Water Quality Criteria: The USEPA mandates that at leasteight acute toxicity tests, three chronic animal tests, one algaltest, and one test to determine a BCF be used to develop awater quality criterion. A Species Mean Acute Value iscalculated from the different tests. Mathematical extrapolationis performed on the four lowest values to estimate the 5thpercentile. This is the Final Acute Value. The ChronicContinuous Criterion is half of the Final Acute Value multipliedby the ratio of the acute and chronic effect levels.
Trophic Levels Algae, invertebrate, vertebrate
Validation Site specific adjustments are encouraged
Soil Values Available No
Other Comments

critical review of soil criteria methods
A-10
Table A- 9
Jurisdiction United States Environmental Protection Agency
Technical GuidanceDocument
Technical basis for establishing sediment quality criteria fornonionic organic chemicals by using equilibrium partitioning.Guidelines for the protection and management of aquaticsediment quality in Ontario. The potential for biological effectsof sediment-sorbed contaminants tested in the National Statusand Trends Program
Date 1991, 1992, 1991
Application Site screening, clean-up goals
Approach Sediment Quality Criteria: For non-polar organics, standardsusing aquatic toxicity data are suitable for concentrations inthe pore water. The total amount of chemical in the sedimentcan be calculated using the equilibrium partitioning theory.The effects-range method is a compilation of results fromNOAA, which studies many different marine environments,and Ontario, which only used the Great Lakes. A graph of theresults gives an Effects Range-High, Low and Median.
Trophic Levels Algae, invertebrate, vertebrate
Validation Site specific adjustments are encouraged
Soil Values Available No
Other Comments
critical review of soil criteria methods
B-1
Appendix B. Guiding principles used by the Canadian Council of Ministers of theEnvironment for deriving soil protection values

critical review of soil criteria methods
B-2
The following guiding principles for the development of numerical soil quality remediation
objectives for contaminated sites in Canada are based on the philosophy established by CCME
(1991a; 1995a):
1. Site specific soil quality remediation objectives should be protective of human health and
the environment.
2. Site specific soil quality remediation objectives should be protective of the appropriate
land use at a contaminated site.
3. The land uses to be considered for protection include agricultural, residential/parkland,
commercial, and industrial.
4. It is the philosophy of the CCME to encourage remediation to the lowest level
practicable, considering the intended land use and other factors, such as technological
limitations. Environmental quality guidelines are not intended to establish maximum
levels of contamination acceptable at contaminated sites. Where the quality of site
conditions is considered superior to the Canadian environmental quality guidelines,
degradation of existing site conditions should be avoided.
5. Generic soil quality guidelines for a substance may be adopted directly (Method 1) as
the recommended soil quality remediation objective for the intended or likely future use
of a remediated contaminated site in Canada. Where it can be demonstrated that the
guidelines are not applicable or appropriate to the specific site in question using the
evaluation guidelines that follow, the guidelines may be modified within the limits
prescribed in this guidance manual (Method 2). In some circumstances, the risk-based
approach (Method 3) may be deemed more appropriate to determine site-specific
remediation objectives.
6. If generic soil quality guidelines for the designated land use at a contaminated site are
not available, the proponent should consult the jurisdictional authority. Options for
guidelines development may include, but are not limited to, using risk assessment to
develop remediation objectives, using the Protocol (CCME, 1995a) to develop
remediation objectives, adopting appropriate background levels as remediation
objectives, or adopting guidelines from other jurisdictions as remediation objectives.
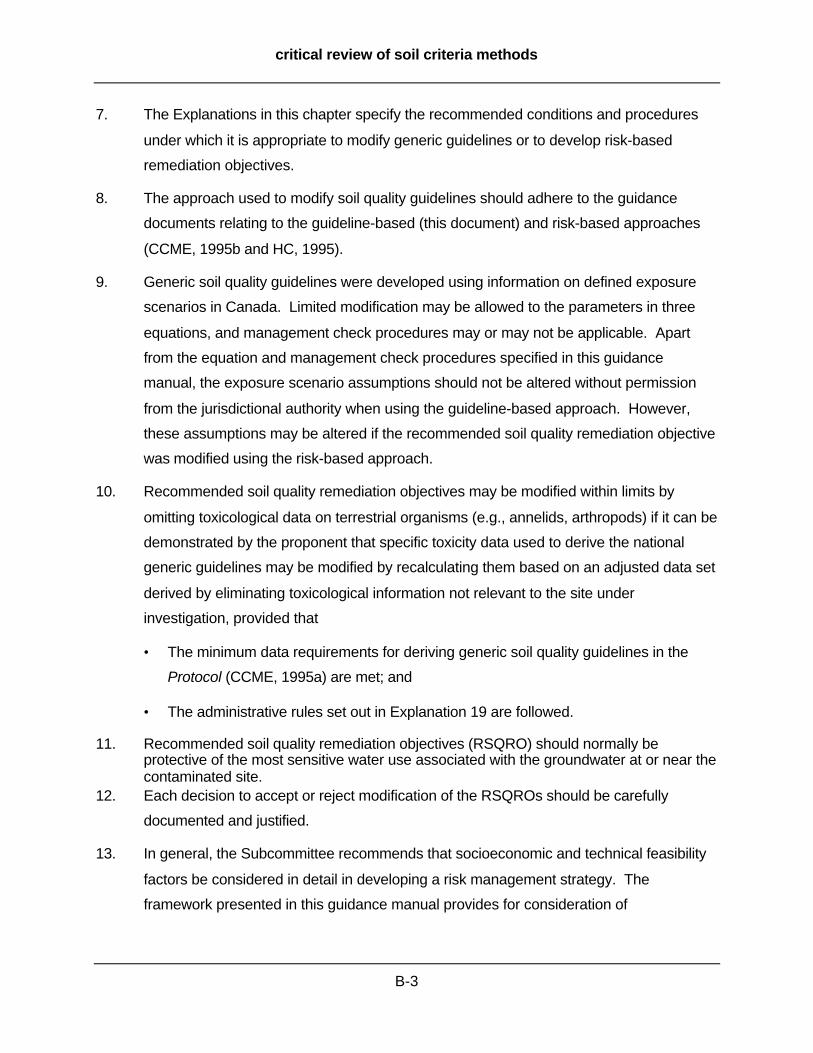
critical review of soil criteria methods
B-3
7. The Explanations in this chapter specify the recommended conditions and procedures
under which it is appropriate to modify generic guidelines or to develop risk-based
remediation objectives.
8. The approach used to modify soil quality guidelines should adhere to the guidance
documents relating to the guideline-based (this document) and risk-based approaches
(CCME, 1995b and HC, 1995).
9. Generic soil quality guidelines were developed using information on defined exposure
scenarios in Canada. Limited modification may be allowed to the parameters in three
equations, and management check procedures may or may not be applicable. Apart
from the equation and management check procedures specified in this guidance
manual, the exposure scenario assumptions should not be altered without permission
from the jurisdictional authority when using the guideline-based approach. However,
these assumptions may be altered if the recommended soil quality remediation objective
was modified using the risk-based approach.
10. Recommended soil quality remediation objectives may be modified within limits by
omitting toxicological data on terrestrial organisms (e.g., annelids, arthropods) if it can be
demonstrated by the proponent that specific toxicity data used to derive the national
generic guidelines may be modified by recalculating them based on an adjusted data set
derived by eliminating toxicological information not relevant to the site under
investigation, provided that
• The minimum data requirements for deriving generic soil quality guidelines in the
Protocol (CCME, 1995a) are met; and
• The administrative rules set out in Explanation 19 are followed.
11. Recommended soil quality remediation objectives (RSQRO) should normally beprotective of the most sensitive water use associated with the groundwater at or near thecontaminated site.
12. Each decision to accept or reject modification of the RSQROs should be carefully
documented and justified.
13. In general, the Subcommittee recommends that socioeconomic and technical feasibility
factors be considered in detail in developing a risk management strategy. The
framework presented in this guidance manual provides for consideration of

critical review of soil criteria methods
B-4
socioeconomic and technological factors after an RSQRO has been developed, using
either the guideline-based or risk-based approach. Guidance on socioeconomic and
technical feasibility factors is, however, outside the scope of the Subcommittee.
14. Continued contamination of the site from readily identifiable sources (pits, ponds,
lagoons, leaking storage tanks, etc.) should be prevented while detailed site
investigations are conducted to support the development of site-specific soil quality
remediation objectives using either the guide-based or risk-based approach. Under
these circumstances, the generic soil quality guidelines, modified using the available
information, may be used to guide the remedial action.

critical review of soil criteria methods
C-1
Appendix C. Comparison of methods for deriving ecologically protective soil values
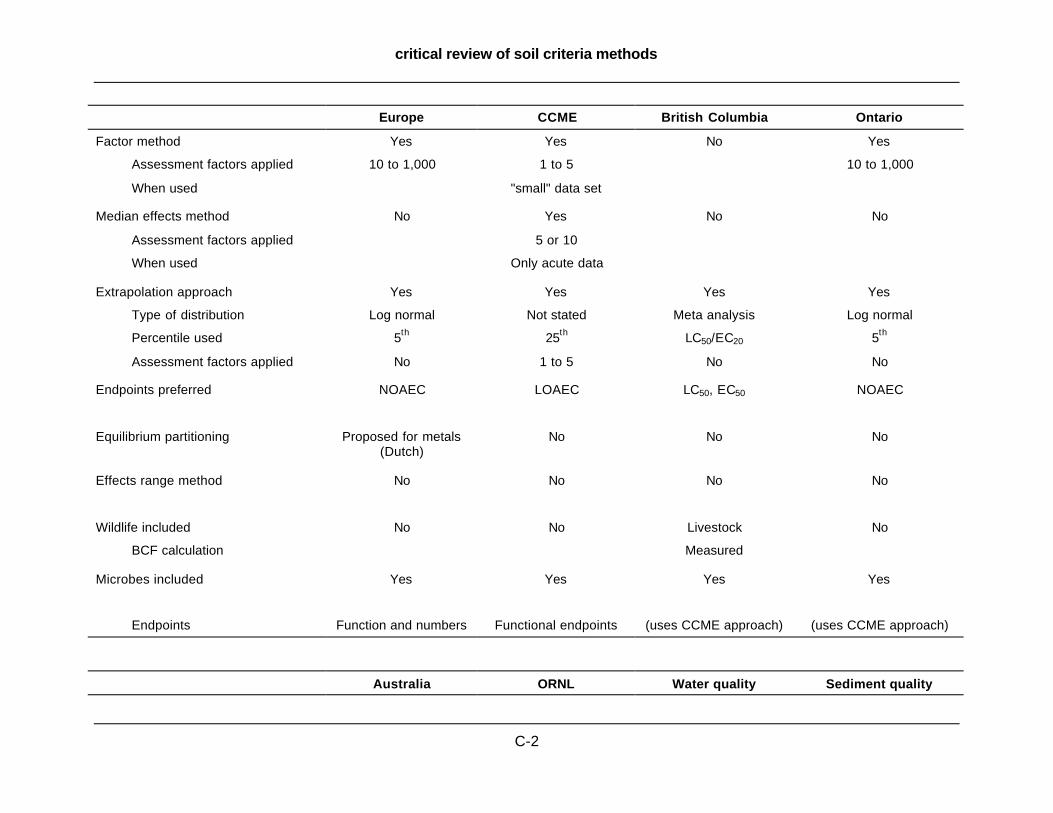
critical review of soil criteria methods
C-2
Europe CCME British Columbia Ontario
Factor method Yes Yes No Yes
Assessment factors applied 10 to 1,000 1 to 5 10 to 1,000
When used "small" data set
Median effects method No Yes No No
Assessment factors applied 5 or 10
When used Only acute data
Extrapolation approach Yes Yes Yes Yes
Type of distribution Log normal Not stated Meta analysis Log normal
Percentile used 5th 25th LC50/EC20 5th
Assessment factors applied No 1 to 5 No No
Endpoints preferred NOAEC LOAEC LC50, EC50 NOAEC
Equilibrium partitioning Proposed for metals(Dutch)
No No No
Effects range method No No No No
Wildlife included No No Livestock No
BCF calculation Measured
Microbes included Yes Yes Yes Yes
Endpoints Function and numbers Functional endpoints (uses CCME approach) (uses CCME approach)
Australia ORNL Water quality Sediment quality

critical review of soil criteria methods
C-3
Factor method Yes Yes No No
Assessment factors applied 10 to 1,000 5
When used Acute data; onlyLOACs
Acute data only
Median effects method No No No No
Assessment factors applied
When used
Extrapolation approach No No Yes No
Type of distribution Triangular
Percentile used 5th of lowest 4 values
Assessment factors applied 2
Endpoints preferred NOAEC LOAEC NOAEC NOAEC & LOAEC
Equilibrium partitioning No No No Yes
Effects range method No Yes No Yes
Wildlife included Yes Yes No
BCF calculation Median Measured
Microbes included No No No
Endpoints

critical review of soil criteria methods
D-1
Appendix D. Published soil values for use in screening, cleanup, or monitoringcontaminated sites.
All values taken from the Technical Guidance Documents referenced in this report
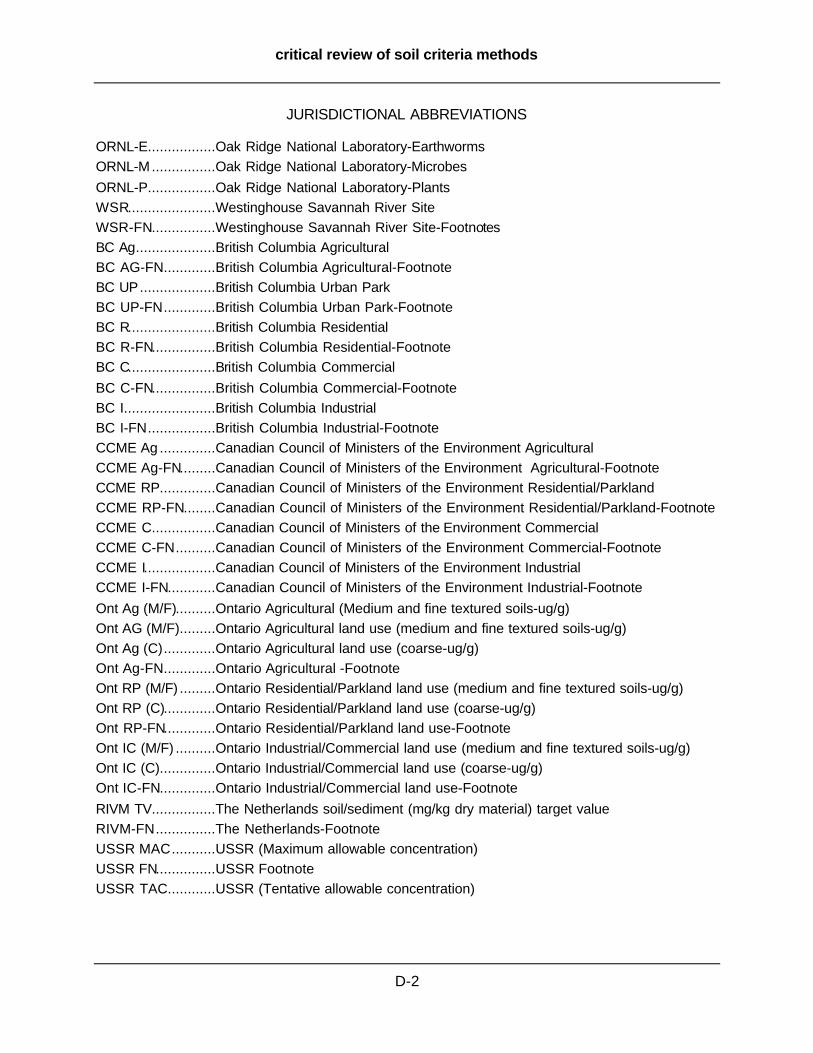
critical review of soil criteria methods
D-2
JURISDICTIONAL ABBREVIATIONS
ORNL-E.................Oak Ridge National Laboratory-Earthworms
ORNL-M................Oak Ridge National Laboratory-Microbes
ORNL-P.................Oak Ridge National Laboratory-Plants
WSR......................Westinghouse Savannah River Site
WSR-FN................Westinghouse Savannah River Site-Footnotes
BC Ag....................British Columbia Agricultural
BC AG-FN.............British Columbia Agricultural-Footnote
BC UP...................British Columbia Urban Park
BC UP-FN.............British Columbia Urban Park-Footnote
BC R......................British Columbia Residential
BC R-FN................British Columbia Residential-Footnote
BC C......................British Columbia Commercial
BC C-FN................British Columbia Commercial-Footnote
BC I.......................British Columbia Industrial
BC I-FN.................British Columbia Industrial-Footnote
CCME Ag ..............Canadian Council of Ministers of the Environment Agricultural
CCME Ag-FN.........Canadian Council of Ministers of the Environment Agricultural-Footnote
CCME RP..............Canadian Council of Ministers of the Environment Residential/Parkland
CCME RP-FN........Canadian Council of Ministers of the Environment Residential/Parkland-Footnote
CCME C................Canadian Council of Ministers of the Environment Commercial
CCME C-FN..........Canadian Council of Ministers of the Environment Commercial-Footnote
CCME I..................Canadian Council of Ministers of the Environment Industrial
CCME I-FN............Canadian Council of Ministers of the Environment Industrial-Footnote
Ont Ag (M/F)..........Ontario Agricultural (Medium and fine textured soils-ug/g)
Ont AG (M/F).........Ontario Agricultural land use (medium and fine textured soils-ug/g)
Ont Ag (C).............Ontario Agricultural land use (coarse-ug/g)
Ont Ag-FN.............Ontario Agricultural -Footnote
Ont RP (M/F) .........Ontario Residential/Parkland land use (medium and fine textured soils-ug/g)
Ont RP (C).............Ontario Residential/Parkland land use (coarse-ug/g)
Ont RP-FN.............Ontario Residential/Parkland land use-Footnote
Ont IC (M/F) ..........Ontario Industrial/Commercial land use (medium and fine textured soils-ug/g)
Ont IC (C)..............Ontario Industrial/Commercial land use (coarse-ug/g)
Ont IC-FN..............Ontario Industrial/Commercial land use-Footnote
RIVM TV................The Netherlands soil/sediment (mg/kg dry material) target value
RIVM-FN...............The Netherlands-Footnote
USSR MAC...........USSR (Maximum allowable concentration)
USSR FN...............USSR Footnote
USSR TAC............USSR (Tentative allowable concentration)
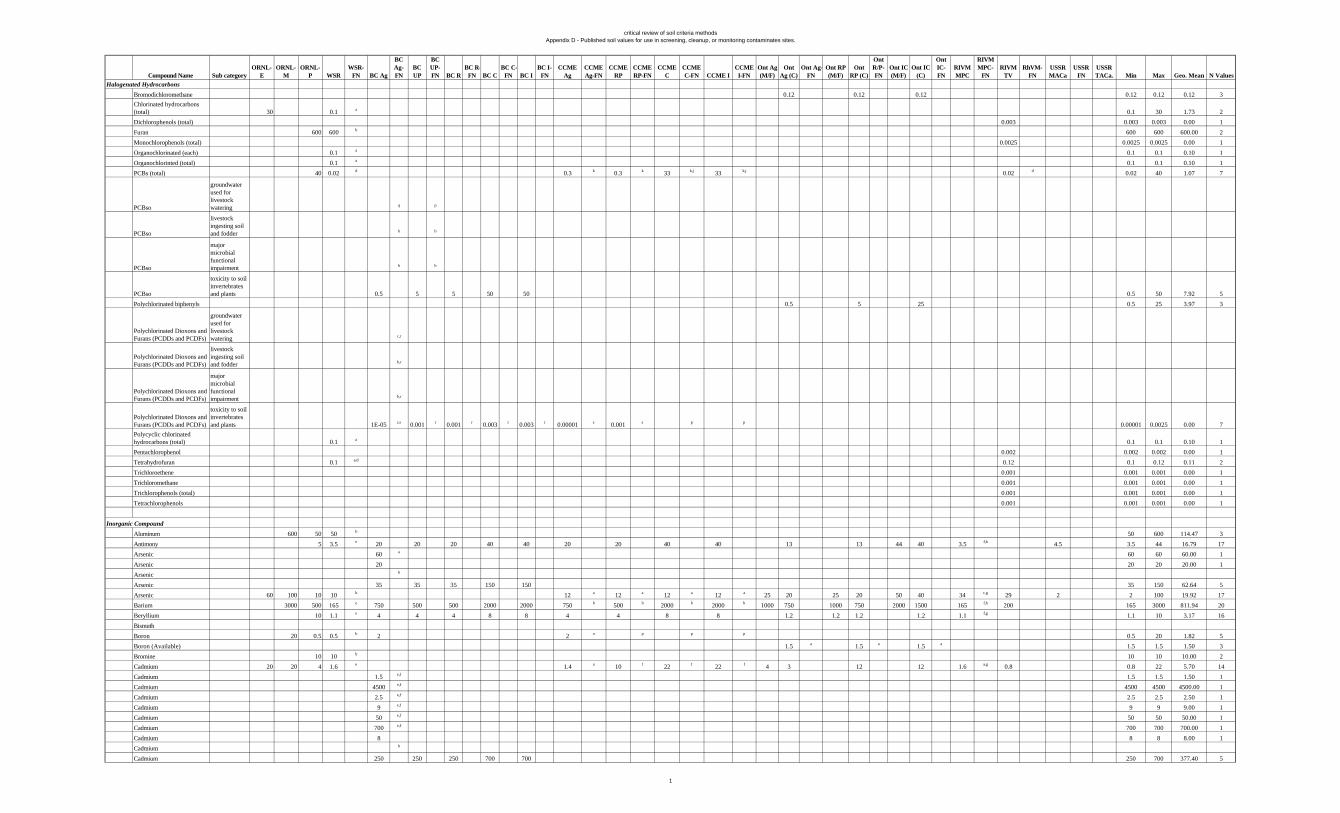
critical review of soil criteria methodsAppendix D - Published soil values for use in screening, cleanup, or monitoring contaminates sites.
Compound Name Sub categoryORNL-
EORNL-
MORNL-
P WSRWSR-
FN BC Ag
BC Ag-FN
BC UP
BC UP-FN BC R
BC R-FN BC C
BC C-FN BC I
BC I-FN
CCME Ag
CCME Ag-FN
CCME RP
CCME RP-FN
CCME C
CCME C-FN CCME I
CCME I-FN
Ont Ag (M/F)
Ont Ag (C)
Ont Ag-FN
Ont RP (M/F)
Ont RP (C)
Ont R/P-FN
Ont IC (M/F)
Ont IC (C)
Ont IC-FN
RIVM MPC
RIVM MPC-
FNRIVM
TVRhVM-
FNUSSR MACa
USSR FN
USSR TACa. Min Max Geo. Mean N Values
Halogenated Hydrocarbons
Bromodichloromethane 0.12 0.12 0.12 0.12 0.12 0.12 3Chlorinated hydrocarbons (total) 30 0.1 a 0.1 30 1.73 2
Dichlorophenols (total) 0.003 0.003 0.003 0.00 1
Furan 600 600 b 600 600 600.00 2
Monochlorophenols (total) 0.0025 0.0025 0.0025 0.00 1
Organochlorinated (each) 0.1 a 0.1 0.1 0.10 1
Organochlorinted (total) 0.1 a 0.1 0.1 0.10 1
PCBs (total) 40 0.02 d 0.3 k 0.3 k 33 k,j 33 k,j 0.02 d 0.02 40 1.07 7
PCBso
groundwater used for livestock watering q p
PCBso
livestock ingesting soil and fodder b b
PCBso
major microbial functional impairment b b
PCBso
toxicity to soil invertebrates and plants 0.5 5 5 50 50 0.5 50 7.92 5
Polychlorinated biphenyls 0.5 5 25 0.5 25 3.97 3
Polychlorinated Dioxons and Furans (PCDDs and PCDFs)
groundwater used for livestock watering c,r
Polychlorinated Dioxons and Furans (PCDDs and PCDFs)
livestock ingesting soil and fodder b,r
Polychlorinated Dioxons and Furans (PCDDs and PCDFs)
major microbial functional impairment b,r
Polychlorinated Dioxons and Furans (PCDDs and PCDFs)
toxicity to soil invertebrates and plants 1E-05 r,s 0.001 r 0.001 r 0.003 r 0.003 r 0.00001 s 0.001 s p p 0.00001 0.0025 0.00 7
Polycyclic chlorinated hydrocarbons (total) 0.1 a 0.1 0.1 0.10 1
Pentachlorophenol 0.002 0.002 0.002 0.00 1
Tetrahydrofuran 0.1 a,d 0.12 0.1 0.12 0.11 2
Trichloroethene 0.001 0.001 0.001 0.00 1
Trichloromethane 0.001 0.001 0.001 0.00 1
Trichlorophenols (total) 0.001 0.001 0.001 0.00 1
Tetrachlorophenols 0.001 0.001 0.001 0.00 1
Inorganic Compound
Aluminum 600 50 50 b 50 600 114.47 3
Antimony 5 3.5 e 20 20 20 40 40 20 20 40 40 13 13 44 40 3.5 f,h 4.5 3.5 44 16.79 17
Arsenic 60 a 60 60 60.00 1
Arsenic 20 20 20 20.00 1
Arsenic b
Arsenic 35 35 35 150 150 35 150 62.64 5
Arsenic 60 100 10 10 b 12 a 12 a 12 a 12 a 25 20 25 20 50 40 34 c,g 29 2 2 100 19.92 17
Barium 3000 500 165 e 750 500 500 2000 2000 750 b 500 b 2000 b 2000 b 1000 750 1000 750 2000 1500 165 f,h 200 165 3000 811.94 20
Beryllium 10 1.1 e 4 4 4 8 8 4 4 8 8 1.2 1.2 1.2 1.2 1.1 f,g 1.1 10 3.17 16
Bismuth
Boron 20 0.5 0.5 b 2 2 o p p p 0.5 20 1.82 5
Boron (Available) 1.5 a 1.5 a 1.5 a 1.5 1.5 1.50 3
Bromine 10 10 b 10 10 10.00 2
Cadmium 20 20 4 1.6 e 1.4 a 10 f 22 f 22 f 4 3 12 12 1.6 a,g 0.8 0.8 22 5.70 14
Cadmium 1.5 e,f 1.5 1.5 1.50 1
Cadmium 4500 e,f 4500 4500 4500.00 1
Cadmium 2.5 e,f 2.5 2.5 2.50 1
Cadmium 9 e,f 9 9 9.00 1
Cadmium 50 e,f 50 50 50.00 1
Cadmium 700 e,f 700 700 700.00 1
Cadmium 8 8 8 8.00 1
Cadmium b
Cadmium 250 250 250 700 700 250 700 377.40 5
1

critical review of soil criteria methodsAppendix D - Published soil values for use in screening, cleanup, or monitoring contaminates sites.
Compound Name Sub categoryORNL-
EORNL-
MORNL-
P WSRWSR-
FN BC Ag
BC Ag-FN
BC UP
BC UP-FN BC R
BC R-FN BC C
BC C-FN BC I
BC I-FN
CCME Ag
CCME Ag-FN
CCME RP
CCME RP-FN
CCME C
CCME C-FN CCME I
CCME I-FN
Ont Ag (M/F)
Ont Ag (C)
Ont Ag-FN
Ont RP (M/F)
Ont RP (C)
Ont R/P-FN
Ont IC (M/F)
Ont IC (C)
Ont IC-FN
RIVM MPC
RIVM MPC-
FNRIVM
TVRhVM-
FNUSSR MACa
USSR FN
USSR TACa. Min Max Geo. Mean N Values
Chloride d d d
Chromium 150 g,h 150 150 150.00 1
Chromium 9 i 9 9 9.00 1
Chromium b
Chromium 750 e,b 250 250 800 800 250 800 495.93 5
Chromium 0.4 10 1 0.4 b,c 64 a 64 a 87 a 87 a 1000 750 1000 750 1000 750 100 c,g 100 0.05 0.05 1000 44.49 17
Chromium (VI) 0.4 g 0.4 g 1.4 g 1.4 g 8 10 8 10 8 0.4 10 2.93 9
Cobalt 1000 20 20 a,b,d 40 50 50 300 300 40 50 300 300 50 40 50 40 100 80 33 c,g 20 20 1000 71.91 20
Copper 100 e,j 100 100 100.00 1
Copper 90000 e,j 90000 90000 90000.00 1
Copper 150 e,j 150 150 150.00 1
Copper 500 e,j 500 500 500.00 1
Copper 5000 e,j 5000 5000 5000.00 1
Copper 40 k 40 40 40.00 1
Copper 150 k 150 150 150.00 1
Copper b b
Copper 150 150 150 250 250 150 250 184.01 5
Copper 50 100 100 40 e 63 a 63 a 91 a 91 a 200 150 300 225 300 225 40 a,g 36 3 b 3 300 82.60 17
Cyanide (free) 0.9 a 0.9 a 8 a 8 a 100 100 100 1 0.9 100 9.21 8
Cyanide (SAD) 5 l 50 l 50 l 500 l 500 l 5 500 79.24 5
Cyanide (WAD) 0.5 m 10 m 10 m 100 m 100 m 0.5 100 13.80 5
Cynide Complex (pH<5) 5 a 5 5 5.00 1
Cyanide complex (pH>5) 5 5 5 5.00 1
Cyanide, comlex (total) 5 a 5 5 5.00 1
Cyanide, free (total) 0.9 c 0.9 0.9 0.90 1
Fluoride 200 400 400 2000 2000 200 400 2000 2000 200 2000 701.16 9
Fluorine 30 200 30 200 77.46 2
Iodine 4 4 4 4.00 1
Iron 200 200 b 200 200 200.00 2
Lanathum 50 b 50 50 50.00 1
Lead 150 e,n 150 150 150.00 1
Lead 30000 e,n 30000 30000 30000.00 1
Lead 250 e,n 250 250 250.00 1
Lead 1500 e,n 1500 1500 1500.00 1
Lead 350 350 350 350.00 1
Lead b
Lead 1000 1000 1000 2000 2000 1000 2000 1319.51 5
Lead 500 900 50 50 a,b 70 a 140 a 260 a 600 a 200 200 1000 140 a,g 85 20 20 1000 169.66 14
Lithium 10 2 2 b 2 10 3.42 3
Manganese 100 500 100 b 1500 100 1500 294.28 4
Mercury 0.1 30 0.3 0.8 2 2 10 10 10 10 10 0.3 2.1 0.1 30 2.54 13
Mercury (Inorganic) 0.1 b 6.6 a 6.6 a 24 a 50 a 2.2 a 0.1 50 4.75 6
Mercury (Methyl) 0.67 e 6.8 b 6.8 b 10 b 0.67 c,g 0.67 10 2.91 5
Molybdenum 200 2 2 b 5 10 10 40 40 5 10 40 40 5 40 40 254 f,h 10 2 254 17.23 17
Nickel 200 90 30 30 b 150 100 100 500 500 50 k 50 k 50 k 50 k 200 150 200 150 200 150 38 c 35 4 c 4 500 87.61 22
Nitrate d d d
Nitrates 130 130 130 130.00 1
Nitrite d d d
Phosphorus pentoxide 200 200 200 200.00 1
Selenium 70 100 1 0.81 e 2 3 3 10 10 2 3 10 10 2 10 10 0.81 f,h 0.81 100 5.08 17
Silver 50 2 2 b 20 20 20 40 40 20 20 40 40 25 20 25 20 50 40 2 50 21.31 18
Sodium d d d
Sulphur (elemental) 500 500 p p p 500 500 500.00 2
Technetium 0.2 0.2 b 0.2 0.2 0.20 2
Thallium 1 1 b 2 d 1 l 1 m 1 m 1 m 4.1 4.1 32 1.3 f,h 1 32 1.93 11
Thiocyanates 2 d 2 2 2.00 1
Thiocyanates Total)
Tin 2000 50 53 e 5 50 50 300 300 5 50 300 30 53 f,h 5 2000 68.35 13
Titanium 1000 1000 b 1000 1000 1000.00 2
Tungsten 400 400 b 400 400 400.00 2
Uranium 5 5 b 5 5 5.00 2
Vanadium 20 2 2 b 200 200 200 130 k 130 k 130 n 130 n 250 200 250 200 250 200 43 f,h 150 2 250 89.91 18
Zinc 450 e,t 450 450 450.00 1
Zinc 550 e,t 550 550 550.00 1
Zinc 1500 e,t 1500 1500 1500.00 1
Zinc 9000 e,t 9000 9000 9000.00 1
Zinc 70000 e,t 70000 70000 70000.00 1
2
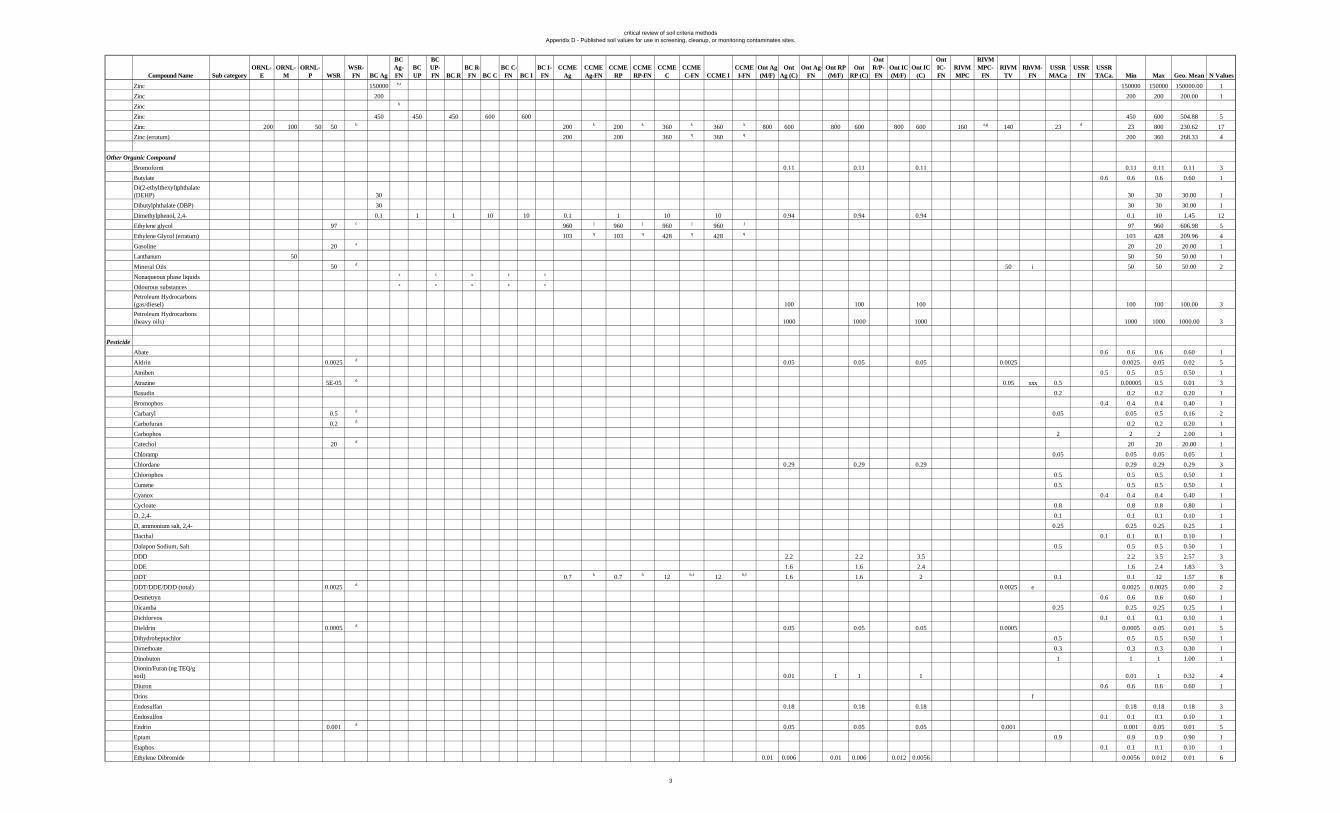
critical review of soil criteria methodsAppendix D - Published soil values for use in screening, cleanup, or monitoring contaminates sites.
Compound Name Sub categoryORNL-
EORNL-
MORNL-
P WSRWSR-
FN BC Ag
BC Ag-FN
BC UP
BC UP-FN BC R
BC R-FN BC C
BC C-FN BC I
BC I-FN
CCME Ag
CCME Ag-FN
CCME RP
CCME RP-FN
CCME C
CCME C-FN CCME I
CCME I-FN
Ont Ag (M/F)
Ont Ag (C)
Ont Ag-FN
Ont RP (M/F)
Ont RP (C)
Ont R/P-FN
Ont IC (M/F)
Ont IC (C)
Ont IC-FN
RIVM MPC
RIVM MPC-
FNRIVM
TVRhVM-
FNUSSR MACa
USSR FN
USSR TACa. Min Max Geo. Mean N Values
Zinc 150000 e,t 150000 150000 150000.00 1
Zinc 200 200 200 200.00 1
Zinc b
Zinc 450 450 450 600 600 450 600 504.88 5
Zinc 200 100 50 50 b 200 k 200 k 360 k 360 k 800 600 800 600 800 600 160 a,g 140 23 d 23 800 230.62 17
Zinc (erratum) 200 200 360 q 360 q 200 360 268.33 4
Other Organic Compound
Bromoform 0.11 0.11 0.11 0.11 0.11 0.11 3
Butylate 0.6 0.6 0.6 0.60 1Di(2-ethylthexyl)phthalate (DEHP) 30 30 30 30.00 1
Dibutylphthalate (DBP) 30 30 30 30.00 1
Dimethylphenol, 2,4- 0.1 1 1 10 10 0.1 1 10 10 0.94 0.94 0.94 0.1 10 1.45 12
Ethylene glycol 97 c 960 j 960 j 960 j 960 j 97 960 606.98 5
Ethylene Glycol (erratum) 103 q 103 q 428 q 428 q 103 428 209.96 4
Gasoline 20 a 20 20 20.00 1
Lanthanum 50 50 50 50.00 1
Mineral Oils 50 d 50 i 50 50 50.00 2
Nonaqueous phase liquids x x x x x
Odourous substances x x x x x
Petroleum Hydrocarbons (gas/diesel) 100 100 100 100 100 100.00 3Petroleum Hydrocarbons (heavy oils) 1000 1000 1000 1000 1000 1000.00 3
Pesticide
Abate 0.6 0.6 0.6 0.60 1
Aldrin 0.0025 d 0.05 0.05 0.05 0.0025 0.0025 0.05 0.02 5
Amiben 0.5 0.5 0.5 0.50 1
Atrazine 5E-05 d 0.05 xxx 0.5 0.00005 0.5 0.01 3
Basudin 0.2 0.2 0.2 0.20 1
Bromophos 0.4 0.4 0.4 0.40 1
Carbaryl 0.5 d 0.05 0.05 0.5 0.16 2
Carbofuran 0.2 d 0.2 0.2 0.20 1
Carbophos 2 2 2 2.00 1
Catechol 20 d 20 20 20.00 1
Chloramp 0.05 0.05 0.05 0.05 1
Chlordane 0.29 0.29 0.29 0.29 0.29 0.29 3
Chlorophos 0.5 0.5 0.5 0.50 1
Cumene 0.5 0.5 0.5 0.50 1
Cyanox 0.4 0.4 0.4 0.40 1
Cycloate 0.8 0.8 0.8 0.80 1
D, 2,4- 0.1 0.1 0.1 0.10 1
D, ammonium salt, 2,4- 0.25 0.25 0.25 0.25 1
Dacthal 0.1 0.1 0.1 0.10 1
Dalapon Sodium, Salt 0.5 0.5 0.5 0.50 1
DDD 2.2 2.2 3.5 2.2 3.5 2.57 3
DDE 1.6 1.6 2.4 1.6 2.4 1.83 3
DDT 0.7 h 0.7 h 12 h,I 12 h,I 1.6 1.6 2 0.1 0.1 12 1.57 8
DDT/DDE/DDD (total) 0.0025 d 0.0025 e 0.0025 0.0025 0.00 2
Desmetryn 0.6 0.6 0.6 0.60 1
Dicamba 0.25 0.25 0.25 0.25 1
Dichlorvos 0.1 0.1 0.1 0.10 1
Dieldrin 0.0005 d 0.05 0.05 0.05 0.0005 0.0005 0.05 0.01 5
Dihydroheptachlor 0.5 0.5 0.5 0.50 1
Dimethoate 0.3 0.3 0.3 0.30 1
Dinobuton 1 1 1 1.00 1Dionin/Furan (ng TEQ/g soil) 0.01 1 1 1 0.01 1 0.32 4
Diuron 0.6 0.6 0.6 0.60 1
Drins f
Endosulfan 0.18 0.18 0.18 0.18 0.18 0.18 3
Endosulfon 0.1 0.1 0.1 0.10 1
Endrin 0.001 d 0.05 0.05 0.05 0.001 0.001 0.05 0.01 5
Eptam 0.9 0.9 0.9 0.90 1
Etaphos 0.1 0.1 0.1 0.10 1
Ethylene Dibromide 0.01 0.006 0.01 0.006 0.012 0.0056 0.0056 0.012 0.01 6
3
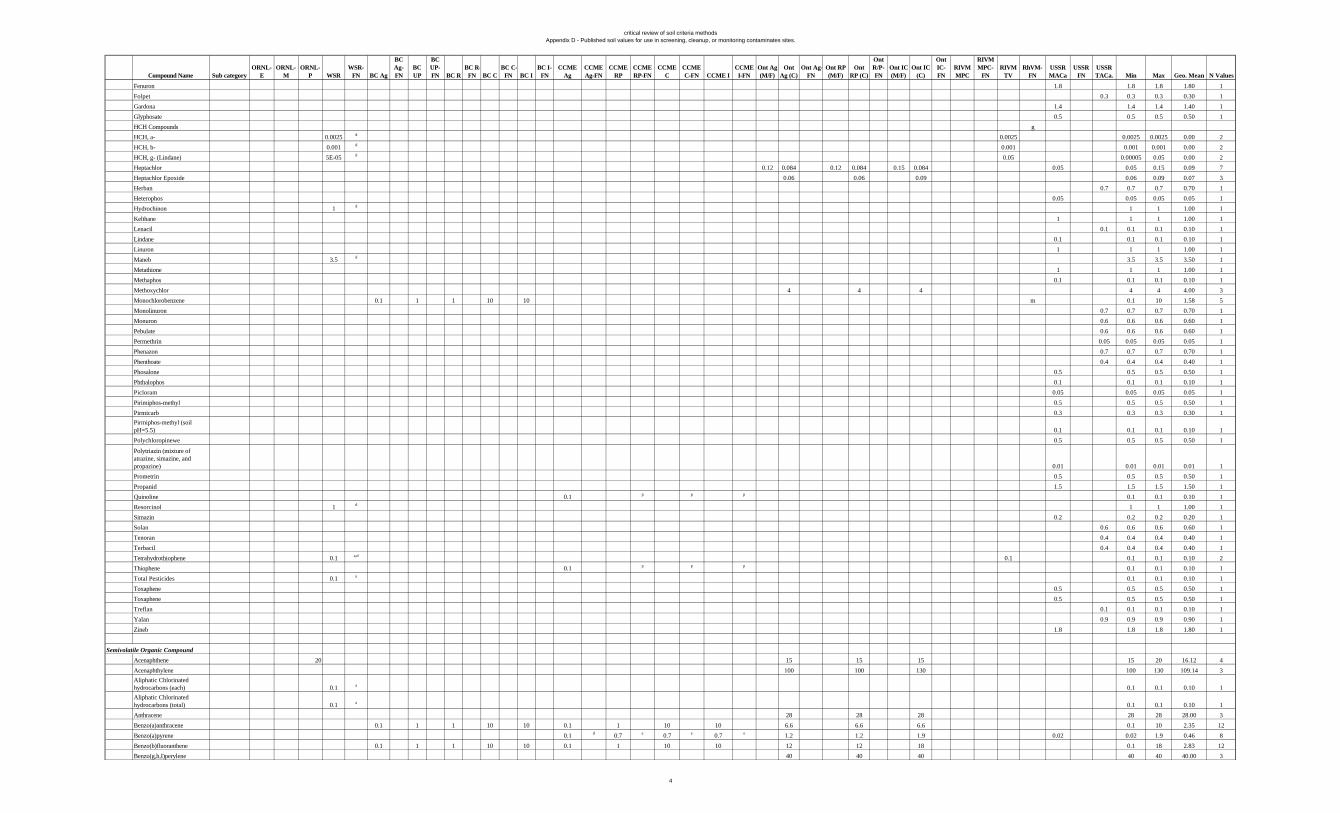
critical review of soil criteria methodsAppendix D - Published soil values for use in screening, cleanup, or monitoring contaminates sites.
Compound Name Sub categoryORNL-
EORNL-
MORNL-
P WSRWSR-
FN BC Ag
BC Ag-FN
BC UP
BC UP-FN BC R
BC R-FN BC C
BC C-FN BC I
BC I-FN
CCME Ag
CCME Ag-FN
CCME RP
CCME RP-FN
CCME C
CCME C-FN CCME I
CCME I-FN
Ont Ag (M/F)
Ont Ag (C)
Ont Ag-FN
Ont RP (M/F)
Ont RP (C)
Ont R/P-FN
Ont IC (M/F)
Ont IC (C)
Ont IC-FN
RIVM MPC
RIVM MPC-
FNRIVM
TVRhVM-
FNUSSR MACa
USSR FN
USSR TACa. Min Max Geo. Mean N Values
Fenuron 1.8 1.8 1.8 1.80 1
Folpet 0.3 0.3 0.3 0.30 1
Gardona 1.4 1.4 1.4 1.40 1
Glyphosate 0.5 0.5 0.5 0.50 1
HCH Compounds g
HCH, a- 0.0025 d 0.0025 0.0025 0.0025 0.00 2
HCH, b- 0.001 d 0.001 0.001 0.001 0.00 2
HCH, g- (Lindane) 5E-05 d 0.05 0.00005 0.05 0.00 2
Heptachlor 0.12 0.084 0.12 0.084 0.15 0.084 0.05 0.05 0.15 0.09 7
Heptachlor Epoxide 0.06 0.06 0.09 0.06 0.09 0.07 3
Herban 0.7 0.7 0.7 0.70 1
Heterophos 0.05 0.05 0.05 0.05 1
Hydrochinon 1 d 1 1 1.00 1
Kelthane 1 1 1 1.00 1
Lenacil 0.1 0.1 0.1 0.10 1
Lindane 0.1 0.1 0.1 0.10 1
Linuron 1 1 1 1.00 1
Maneb 3.5 d 3.5 3.5 3.50 1
Metathione 1 1 1 1.00 1
Methaphos 0.1 0.1 0.1 0.10 1
Methoxychlor 4 4 4 4 4 4.00 3
Monochlorobenzene 0.1 1 1 10 10 m 0.1 10 1.58 5
Monolinuron 0.7 0.7 0.7 0.70 1
Monuron 0.6 0.6 0.6 0.60 1
Pebulate 0.6 0.6 0.6 0.60 1
Permethrin 0.05 0.05 0.05 0.05 1
Phenazon 0.7 0.7 0.7 0.70 1
Phenthoate 0.4 0.4 0.4 0.40 1
Phosalone 0.5 0.5 0.5 0.50 1
Phthalophos 0.1 0.1 0.1 0.10 1
Picloram 0.05 0.05 0.05 0.05 1
Pirimiphos-methyl 0.5 0.5 0.5 0.50 1
Pirmicarb 0.3 0.3 0.3 0.30 1Pirmiphos-methyl (soil pH=5.5) 0.1 0.1 0.1 0.10 1
Polychloropinewe 0.5 0.5 0.5 0.50 1
Polytriazin (mixture of atrazine, simazine, and propazine) 0.01 0.01 0.01 0.01 1
Prometrin 0.5 0.5 0.5 0.50 1
Propanid 1.5 1.5 1.5 1.50 1
Quinoline 0.1 p p p 0.1 0.1 0.10 1
Resorcinol 1 d 1 1 1.00 1
Simazin 0.2 0.2 0.2 0.20 1
Solan 0.6 0.6 0.6 0.60 1
Tenoran 0.4 0.4 0.4 0.40 1
Terbacil 0.4 0.4 0.4 0.40 1
Tetrahydrothiophene 0.1 a,d 0.1 0.1 0.1 0.10 2
Thiophene 0.1 p p p 0.1 0.1 0.10 1
Total Pesticides 0.1 a 0.1 0.1 0.10 1
Toxaphene 0.5 0.5 0.5 0.50 1
Toxaphene 0.5 0.5 0.5 0.50 1
Treflan 0.1 0.1 0.1 0.10 1
Yalan 0.9 0.9 0.9 0.90 1
Zineb 1.8 1.8 1.8 1.80 1
Semivolatile Organic Compound
Acenaphthene 20 15 15 15 15 20 16.12 4
Acenaphthylene 100 100 130 100 130 109.14 3Aliphatic Chlorinated hydrocarbons (each) 0.1 a 0.1 0.1 0.10 1Aliphatic Chlorinated hydrocarbons (total) 0.1 a 0.1 0.1 0.10 1
Anthracene 28 28 28 28 28 28.00 3
Benzo(a)anthracene 0.1 1 1 10 10 0.1 1 10 10 6.6 6.6 6.6 0.1 10 2.35 12
Benzo(a)pyrene 0.1 d 0.7 e 0.7 e 0.7 e 1.2 1.2 1.9 0.02 0.02 1.9 0.46 8
Benzo(b)fluoranthene 0.1 1 1 10 10 0.1 1 10 10 12 12 18 0.1 18 2.83 12
Benzo(g,h,I)perylene 40 40 40 40 40 40.00 3
4

critical review of soil criteria methodsAppendix D - Published soil values for use in screening, cleanup, or monitoring contaminates sites.
Compound Name Sub categoryORNL-
EORNL-
MORNL-
P WSRWSR-
FN BC Ag
BC Ag-FN
BC UP
BC UP-FN BC R
BC R-FN BC C
BC C-FN BC I
BC I-FN
CCME Ag
CCME Ag-FN
CCME RP
CCME RP-FN
CCME C
CCME C-FN CCME I
CCME I-FN
Ont Ag (M/F)
Ont Ag (C)
Ont Ag-FN
Ont RP (M/F)
Ont RP (C)
Ont R/P-FN
Ont IC (M/F)
Ont IC (C)
Ont IC-FN
RIVM MPC
RIVM MPC-
FNRIVM
TVRhVM-
FNUSSR MACa
USSR FN
USSR TACa. Min Max Geo. Mean N Values
Benzo(k)fluoranthene 0.1 1 1 10 10 0.1 1 10 10 12 12 18 0.1 18 2.83 12
Benzo[a]pyrene c c c
Benzo[a]pyrene b
Benzo[a]pyrene d
Benzo[a]pyrene 0.1 1 1 10 10 0.1 10 1.58 5
Biphenyl 60 60 60 60.00 1
Biphenyl, 1,1- 0.89 0.89 0.89 0.89 0.89 0.89 3
Bis(2-Chloroethyl)ether 0.66 0.66 0.66 0.66 0.66 0.66 3
Bis(2-ethylhexyl)phthalate 100 100 100 100 100 100.00 3Aliphatics, Nonchlorinated (each) 0.3 p p p 0.3 0.3 0.30 1
Chloroacetamide 2 2 b 2 2 2.00 2
Chloroaniline, 3- 20 20 b 20 20 20.00 2
Chloroaniline, p- 1.3 1.3 1.3 1.3 1.3 1.30 3
Chlorobenzene 40 0.1 1 10 10 2.4 2.4 2.4 0.1 40 2.94 8
Chlorobenzene (each) 0.05 a 0.05 r 2 r 10 r 10 r 0.05 10 0.87 5
Chlorobenzene (total) 0.05 a c,j 0.05 0.05 0.05 1
Chlorophenol, 2- 0.1 0.1 0.1 0.1 0.1 0.10 3
Chlorophenol, 3- 10 7 7 10 8.37 2
Chlorophenol, 4-
Chlorophenol, meta 0.05 0.5 0.5 5 5 0.05 0.5 5 5 0.05 5 0.83 9
Chlorophenol, ortho 0.05 0.5 0.5 5 5 0.05 0.5 5 5 0.05 5 0.83 9
Chlorophenol, para 0.05 0.5 0.5 5 5 0.05 0.5 5 5 0.05 5 0.83 9
Chrysene 12 12 17 12 17 13.48 3
Dibenz(a,h)anthracene 0.1 1 1 10 10 0.1 1 10 10 1.2 1.2 1.9 0.1 10 1.60 12Dichloro-2-butene, 1,4- (Trans) 1000 1000 b 1000 1000 1000.00 2Dichloro-2-butene, 1-4- (Cis) 1000 1000 b 1000 1000 1000.00 2
Dichloroaniline, 2,4- 100 100 b 100 100 100.00 2
Dichloroaniline, 3,4- 20 20 b 20 20 20.00 2
Dichlorobenzene 0.01 d 0.01 0.01 0.01 1
Dichlorobenzene (total) 0.01 0.01 0.01 0.01 1
Dichlorobenzene, 1,2- 0.1 1 1 10 10 0.1 1 10 10 0.1 10 1.67 9Dichlorobenzene, 1,2- (o-DCB) 0.88 0.88 0.88 0.88 0.88 0.88 3
Dichlorobenzene, 1,3- 0.1 1 2 10 10 0.1 1 10 10 0.1 10 1.80 9Dichlorobenzene, 1,3- (m-DCB) 30 30 30 30 30 30.00 3
Dichlorobenzene, 1,4- 20 0.1 1 2 10 10 0.1 1 10 10 0.1 20 2.29 10Dichlorobenzene, 1,4- (p-DCB) 0.32 0.32 0.32 0.32 0.32 0.32 3
Dichlorobenzidine, 3,3- 1.3 1.3 1.3 1.3 1.3 1.30 3
Dichlorophenol, 2,3- 0.05 0.5 0.5 5 5 0.05 0.5 5 5 0.05 5 0.83 9
Dichlorophenol, 2,4- 0.05 0.5 0.5 5 5 0.05 0.5 5 5 0.3 0.3 0.3 0.05 0.05 5 0.53 13
Dichlorophenol, 2,5- 0.05 0.5 0.5 5 5 0.05 0.5 5 5 0.05 5 0.83 9
Dichlorophenol, 2,6- 0.05 0.5 0.5 5 5 0.05 0.5 5 5 0.05 5 0.83 9
Dichlorophenol, 3,4- 20 20 0.05 0.5 0.5 5 5 0.05 0.5 5 5 0.05 20 1.49 11
Dichlorophenol, 3,5- 0.05 0.5 0.5 5 5 0.05 0.5 5 5 0.05 5 0.83 9
Diethylphthalate 100 100 b 0.71 0.71 0.71 0.71 100 5.14 5
Dimethylphthalate 200 200 b 0.7 0.7 0.7 0.7 200 6.72 5
Di-n-butyl phthalate 200 200 b 200 200 200.00 2
Dinitrophenol, 2,4- 20 0.1 1 1 10 10 0.1 1 10 10 0.2 0.2 0.2 0.1 20 1.24 13
Dinitrophenol, 4,6- 2-methyl 0.1 1 1 10 10 0.1 1 10 10 0.1 10 1.67 9
Dinitrotoluene, 2,4- 0.66 0.66 0.66 0.66 0.66 0.66 3
Fluoranthene 40 40 40 40 40 40.00 3
Fluorene 30 340 340 340 30 340 185.31 4
HEPHs 1000 w 1000 w 1000 w 5000 w 5000 w 1000 5000 1903.65 5
Hexachlorobenzene 1000 0.0025 d 0.05 2 10 10 0.0025 0.0025 1000 0.67 7
Hexachlorobenzene 0.05 2 2 10 10 0.46 0.46 0.76 0.05 10 1.16 8
Hexachlorobutadiene 2.2 0.38 2.2 0.38 2.2 0.38 0.5 0.38 2.2 0.84 7
Hexachlorocyclohexane 0.01 0.01 p p p 0.1 0.01 0.1 0.02 3Hexachlorocyclohexane, Gamma 0.41 0.41 0.49 0.41 0.49 0.44 3
Hexachlorocyclopentadiene 10 10 b 10 10 10.00 2
Indeno(1,2,3-c,d)pyrene 0.1 1 1 10 10 0.1 1 10 10 12 12 19 0.1 19 2.84 12
LEPHs 1000 v 1000 v 1000 v 2000 v 2000 v 1000 2000 1319.51 5
Methylnaphthalene, 2-(*1-) 1.2 c 1.2 c 1.2 c 1.2 1.2 1.20 3
5
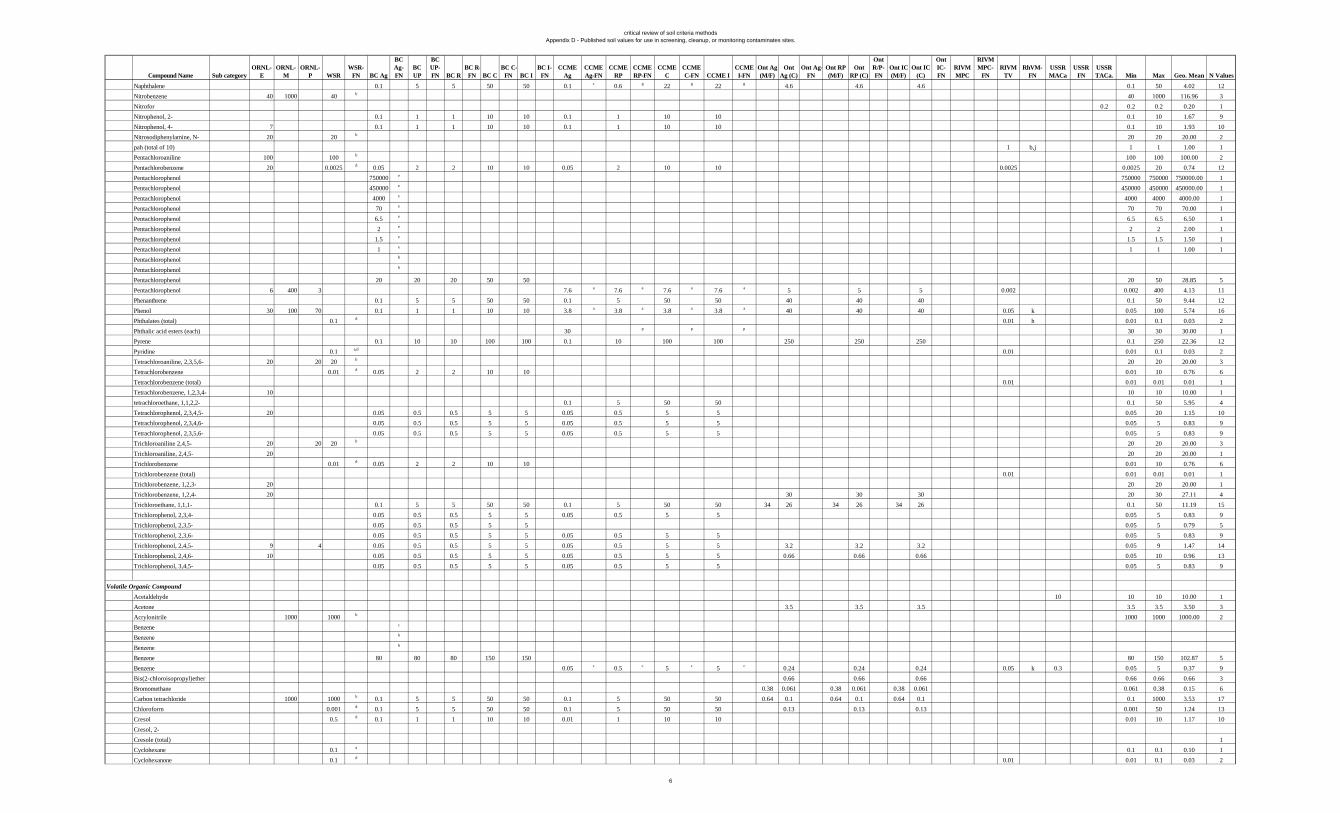
critical review of soil criteria methodsAppendix D - Published soil values for use in screening, cleanup, or monitoring contaminates sites.
Compound Name Sub categoryORNL-
EORNL-
MORNL-
P WSRWSR-
FN BC Ag
BC Ag-FN
BC UP
BC UP-FN BC R
BC R-FN BC C
BC C-FN BC I
BC I-FN
CCME Ag
CCME Ag-FN
CCME RP
CCME RP-FN
CCME C
CCME C-FN CCME I
CCME I-FN
Ont Ag (M/F)
Ont Ag (C)
Ont Ag-FN
Ont RP (M/F)
Ont RP (C)
Ont R/P-FN
Ont IC (M/F)
Ont IC (C)
Ont IC-FN
RIVM MPC
RIVM MPC-
FNRIVM
TVRhVM-
FNUSSR MACa
USSR FN
USSR TACa. Min Max Geo. Mean N Values
Naphthalene 0.1 5 5 50 50 0.1 c 0.6 g 22 g 22 g 4.6 4.6 4.6 0.1 50 4.02 12
Nitrobenzene 40 1000 40 b 40 1000 116.96 3
Nitrofor 0.2 0.2 0.2 0.20 1
Nitrophenol, 2- 0.1 1 1 10 10 0.1 1 10 10 0.1 10 1.67 9
Nitrophenol, 4- 7 0.1 1 1 10 10 0.1 1 10 10 0.1 10 1.93 10
Nitrosodiphenylamine, N- 20 20 b 20 20 20.00 2
pah (total of 10) 1 b,j 1 1 1.00 1
Pentachloroaniline 100 100 b 100 100 100.00 2
Pentachlorobenzene 20 0.0025 d 0.05 2 2 10 10 0.05 2 10 10 0.0025 0.0025 20 0.74 12
Pentachlorophenol 750000 e 750000 750000 750000.00 1
Pentachlorophenol 450000 e 450000 450000 450000.00 1
Pentachlorophenol 4000 e 4000 4000 4000.00 1
Pentachlorophenol 70 e 70 70 70.00 1
Pentachlorophenol 6.5 e 6.5 6.5 6.50 1
Pentachlorophenol 2 e 2 2 2.00 1
Pentachlorophenol 1.5 e 1.5 1.5 1.50 1
Pentachlorophenol 1 e 1 1 1.00 1
Pentachlorophenol b
Pentachlorophenol b
Pentachlorophenol 20 20 20 50 50 20 50 28.85 5
Pentachlorophenol 6 400 3 7.6 a 7.6 a 7.6 a 7.6 a 5 5 5 0.002 0.002 400 4.13 11
Phenanthrene 0.1 5 5 50 50 0.1 5 50 50 40 40 40 0.1 50 9.44 12
Phenol 30 100 70 0.1 1 1 10 10 3.8 a 3.8 a 3.8 a 3.8 a 40 40 40 0.05 k 0.05 100 5.74 16
Phthalates (total) 0.1 d 0.01 h 0.01 0.1 0.03 2
Phthalic acid esters (each) 30 p p p 30 30 30.00 1
Pyrene 0.1 10 10 100 100 0.1 10 100 100 250 250 250 0.1 250 22.36 12
Pyridine 0.1 a,d 0.01 0.01 0.1 0.03 2
Tetrachloroaniline, 2,3,5,6- 20 20 20 b 20 20 20.00 3
Tetrachlorobenzene 0.01 d 0.05 2 2 10 10 0.01 10 0.76 6
Tetrachlorobenzene (total) 0.01 0.01 0.01 0.01 1
Tetrachlorobenzene, 1,2,3,4- 10 10 10 10.00 1
tetrachloroethane, 1,1,2,2- 0.1 5 50 50 0.1 50 5.95 4
Tetrachlorophenol, 2,3,4,5- 20 0.05 0.5 0.5 5 5 0.05 0.5 5 5 0.05 20 1.15 10
Tetrachlorophenol, 2,3,4,6- 0.05 0.5 0.5 5 5 0.05 0.5 5 5 0.05 5 0.83 9
Tetrachlorophenol, 2,3,5,6- 0.05 0.5 0.5 5 5 0.05 0.5 5 5 0.05 5 0.83 9
Trichloroaniline 2,4,5- 20 20 20 b 20 20 20.00 3
Trichloroaniline, 2,4,5- 20 20 20 20.00 1
Trichlorobenzene 0.01 d 0.05 2 2 10 10 0.01 10 0.76 6
Trichlorobenzene (total) 0.01 0.01 0.01 0.01 1
Trichlorobenzene, 1,2,3- 20 20 20 20.00 1
Trichlorobenzene, 1,2,4- 20 30 30 30 20 30 27.11 4
Trichloroethane, 1,1,1- 0.1 5 5 50 50 0.1 5 50 50 34 26 34 26 34 26 0.1 50 11.19 15
Trichlorophenol, 2,3,4- 0.05 0.5 0.5 5 5 0.05 0.5 5 5 0.05 5 0.83 9
Trichlorophenol, 2,3,5- 0.05 0.5 0.5 5 5 0.05 5 0.79 5
Trichlorophenol, 2,3,6- 0.05 0.5 0.5 5 5 0.05 0.5 5 5 0.05 5 0.83 9
Trichlorophenol, 2,4,5- 9 4 0.05 0.5 0.5 5 5 0.05 0.5 5 5 3.2 3.2 3.2 0.05 9 1.47 14
Trichlorophenol, 2,4,6- 10 0.05 0.5 0.5 5 5 0.05 0.5 5 5 0.66 0.66 0.66 0.05 10 0.96 13
Trichlorophenol, 3,4,5- 0.05 0.5 0.5 5 5 0.05 0.5 5 5 0.05 5 0.83 9
Volatile Organic Compound
Acetaldehyde 10 10 10 10.00 1
Acetone 3.5 3.5 3.5 3.5 3.5 3.50 3
Acrylonitrile 1000 1000 b 1000 1000 1000.00 2
Benzene c
Benzene b
Benzene b
Benzene 80 80 80 150 150 80 150 102.87 5
Benzene 0.05 c 0.5 c 5 c 5 c 0.24 0.24 0.24 0.05 k 0.3 0.05 5 0.37 9
Bis(2-chloroisopropyl)ether 0.66 0.66 0.66 0.66 0.66 0.66 3
Bromomethane 0.38 0.061 0.38 0.061 0.38 0.061 0.061 0.38 0.15 6
Carbon tetrachloride 1000 1000 b 0.1 5 5 50 50 0.1 5 50 50 0.64 0.1 0.64 0.1 0.64 0.1 0.1 1000 3.53 17
Chloroform 0.001 d 0.1 5 5 50 50 0.1 5 50 50 0.13 0.13 0.13 0.001 50 1.24 13
Cresol 0.5 d 0.1 1 1 10 10 0.01 1 10 10 0.01 10 1.17 10
Cresol, 2-
Cresole (total) 1
Cyclohexane 0.1 a 0.1 0.1 0.10 1
Cyclohexanone 0.1 d 0.01 0.01 0.1 0.03 2
6
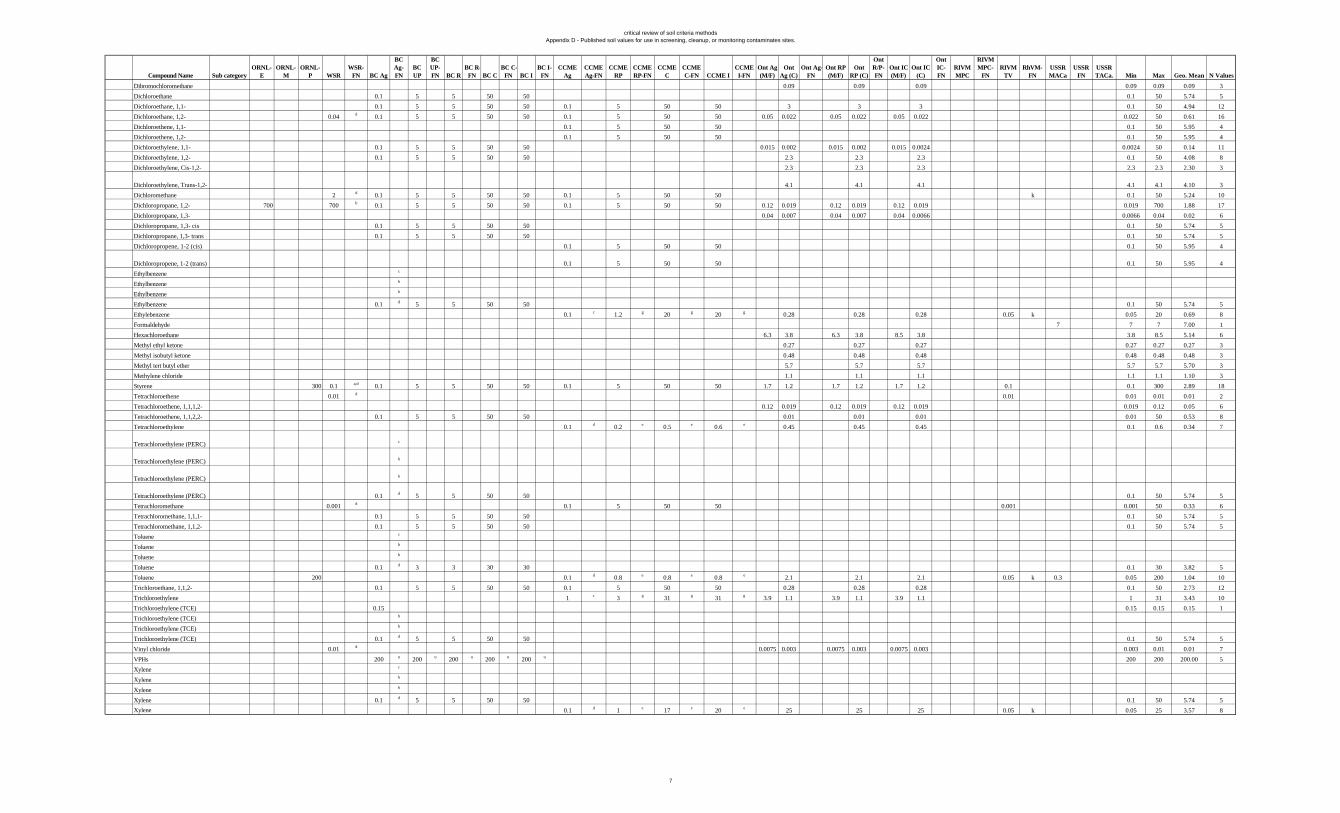
critical review of soil criteria methodsAppendix D - Published soil values for use in screening, cleanup, or monitoring contaminates sites.
Compound Name Sub categoryORNL-
EORNL-
MORNL-
P WSRWSR-
FN BC Ag
BC Ag-FN
BC UP
BC UP-FN BC R
BC R-FN BC C
BC C-FN BC I
BC I-FN
CCME Ag
CCME Ag-FN
CCME RP
CCME RP-FN
CCME C
CCME C-FN CCME I
CCME I-FN
Ont Ag (M/F)
Ont Ag (C)
Ont Ag-FN
Ont RP (M/F)
Ont RP (C)
Ont R/P-FN
Ont IC (M/F)
Ont IC (C)
Ont IC-FN
RIVM MPC
RIVM MPC-
FNRIVM
TVRhVM-
FNUSSR MACa
USSR FN
USSR TACa. Min Max Geo. Mean N Values
Dibromochloromethane 0.09 0.09 0.09 0.09 0.09 0.09 3
Dichloroethane 0.1 5 5 50 50 0.1 50 5.74 5
Dichloroethane, 1,1- 0.1 5 5 50 50 0.1 5 50 50 3 3 3 0.1 50 4.94 12
Dichloroethane, 1,2- 0.04 d 0.1 5 5 50 50 0.1 5 50 50 0.05 0.022 0.05 0.022 0.05 0.022 0.022 50 0.61 16
Dichloroethene, 1,1- 0.1 5 50 50 0.1 50 5.95 4
Dichloroethene, 1,2- 0.1 5 50 50 0.1 50 5.95 4
Dichloroethylene, 1,1- 0.1 5 5 50 50 0.015 0.002 0.015 0.002 0.015 0.0024 0.0024 50 0.14 11
Dichloroethylene, 1,2- 0.1 5 5 50 50 2.3 2.3 2.3 0.1 50 4.08 8
Dichloroethylene, Cis-1,2- 2.3 2.3 2.3 2.3 2.3 2.30 3
Dichloroethylene, Trans-1,2- 4.1 4.1 4.1 4.1 4.1 4.10 3
Dichloromethane 2 d 0.1 5 5 50 50 0.1 5 50 50 k 0.1 50 5.24 10
Dichloropropane, 1,2- 700 700 b 0.1 5 5 50 50 0.1 5 50 50 0.12 0.019 0.12 0.019 0.12 0.019 0.019 700 1.88 17
Dichloropropane, 1,3- 0.04 0.007 0.04 0.007 0.04 0.0066 0.0066 0.04 0.02 6
Dichloropropane, 1,3- cis 0.1 5 5 50 50 0.1 50 5.74 5
Dichloropropane, 1,3- trans 0.1 5 5 50 50 0.1 50 5.74 5
Dichloropropene, 1-2 (cis) 0.1 5 50 50 0.1 50 5.95 4
Dichloropropene, 1-2 (trans) 0.1 5 50 50 0.1 50 5.95 4
Ethylbenzene c
Ethylbenzene b
Ethylbenzene b
Ethylbenzene 0.1 d 5 5 50 50 0.1 50 5.74 5
Ethylebenzene 0.1 c 1.2 g 20 g 20 g 0.28 0.28 0.28 0.05 k 0.05 20 0.69 8
Formaldehyde 7 7 7 7.00 1
Hexachloroethane 6.3 3.8 6.3 3.8 8.5 3.8 3.8 8.5 5.14 6
Methyl ethyl ketone 0.27 0.27 0.27 0.27 0.27 0.27 3
Methyl isobutyl ketone 0.48 0.48 0.48 0.48 0.48 0.48 3
Methyl tert butyl ether 5.7 5.7 5.7 5.7 5.7 5.70 3
Methylene chloride 1.1 1.1 1.1 1.1 1.1 1.10 3
Styrene 300 0.1 a,d 0.1 5 5 50 50 0.1 5 50 50 1.7 1.2 1.7 1.2 1.7 1.2 0.1 0.1 300 2.89 18
Tetrachloroethene 0.01 d 0.01 0.01 0.01 0.01 2
Tetrachloroethene, 1,1,1,2- 0.12 0.019 0.12 0.019 0.12 0.019 0.019 0.12 0.05 6
Tetrachloroethene, 1,1,2,2- 0.1 5 5 50 50 0.01 0.01 0.01 0.01 50 0.53 8
Tetrachloroethylene 0.1 d 0.2 e 0.5 e 0.6 e 0.45 0.45 0.45 0.1 0.6 0.34 7
Tetrachloroethylene (PERC) c
Tetrachloroethylene (PERC) b
Tetrachloroethylene (PERC) b
Tetrachloroethylene (PERC) 0.1 d 5 5 50 50 0.1 50 5.74 5
Tetrachloromethane 0.001 d 0.1 5 50 50 0.001 0.001 50 0.33 6
Tetrachloromethane, 1,1,1- 0.1 5 5 50 50 0.1 50 5.74 5
Tetrachloromethane, 1,1,2- 0.1 5 5 50 50 0.1 50 5.74 5
Toluene c
Toluene b
Toluene b
Toluene 0.1 d 3 3 30 30 0.1 30 3.82 5
Toluene 200 0.1 d 0.8 e 0.8 e 0.8 e 2.1 2.1 2.1 0.05 k 0.3 0.05 200 1.04 10
Trichloroethane, 1,1,2- 0.1 5 5 50 50 0.1 5 50 50 0.28 0.28 0.28 0.1 50 2.73 12
Trichloroethylene 1 c 3 g 31 g 31 g 3.9 1.1 3.9 1.1 3.9 1.1 1 31 3.43 10
Trichloroethylene (TCE) 0.15 0.15 0.15 0.15 1
Trichloroethylene (TCE) b
Trichloroethylene (TCE) b
Trichloroethylene (TCE) 0.1 d 5 5 50 50 0.1 50 5.74 5
Vinyl chloride 0.01 d 0.0075 0.003 0.0075 0.003 0.0075 0.003 0.003 0.01 0.01 7
VPHs 200 u 200 u 200 u 200 u 200 u 200 200 200.00 5
Xylene c
Xylene b
Xylene b
Xylene 0.1 d 5 5 50 50 0.1 50 5.74 5
Xylene 0.1 d 1 e 17 e 20 e 25 25 25 0.05 k 0.05 25 3.57 8
7
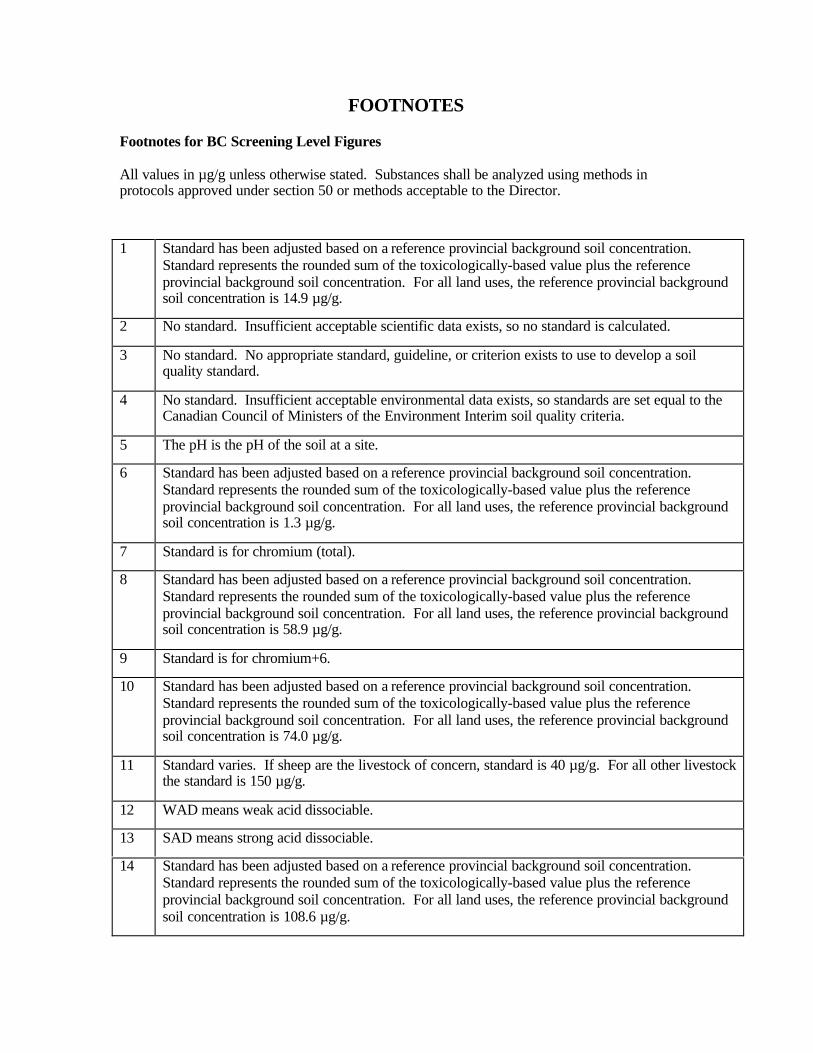
FOOTNOTES
Footnotes for BC Screening Level Figures
All values in µg/g unless otherwise stated. Substances shall be analyzed using methods inprotocols approved under section 50 or methods acceptable to the Director.
1 Standard has been adjusted based on a reference provincial background soil concentration.Standard represents the rounded sum of the toxicologically-based value plus the referenceprovincial background soil concentration. For all land uses, the reference provincial backgroundsoil concentration is 14.9 µg/g.
2 No standard. Insufficient acceptable scientific data exists, so no standard is calculated.
3 No standard. No appropriate standard, guideline, or criterion exists to use to develop a soilquality standard.
4 No standard. Insufficient acceptable environmental data exists, so standards are set equal to theCanadian Council of Ministers of the Environment Interim soil quality criteria.
5 The pH is the pH of the soil at a site.
6 Standard has been adjusted based on a reference provincial background soil concentration.Standard represents the rounded sum of the toxicologically-based value plus the referenceprovincial background soil concentration. For all land uses, the reference provincial backgroundsoil concentration is 1.3 µg/g.
7 Standard is for chromium (total).
8 Standard has been adjusted based on a reference provincial background soil concentration.Standard represents the rounded sum of the toxicologically-based value plus the referenceprovincial background soil concentration. For all land uses, the reference provincial backgroundsoil concentration is 58.9 µg/g.
9 Standard is for chromium+6.
10 Standard has been adjusted based on a reference provincial background soil concentration.Standard represents the rounded sum of the toxicologically-based value plus the referenceprovincial background soil concentration. For all land uses, the reference provincial backgroundsoil concentration is 74.0 µg/g.
11 Standard varies. If sheep are the livestock of concern, standard is 40 µg/g. For all other livestockthe standard is 150 µg/g.
12 WAD means weak acid dissociable.
13 SAD means strong acid dissociable.
14 Standard has been adjusted based on a reference provincial background soil concentration.Standard represents the rounded sum of the toxicologically-based value plus the referenceprovincial background soil concentration. For all land uses, the reference provincial backgroundsoil concentration is 108.6 µg/g.
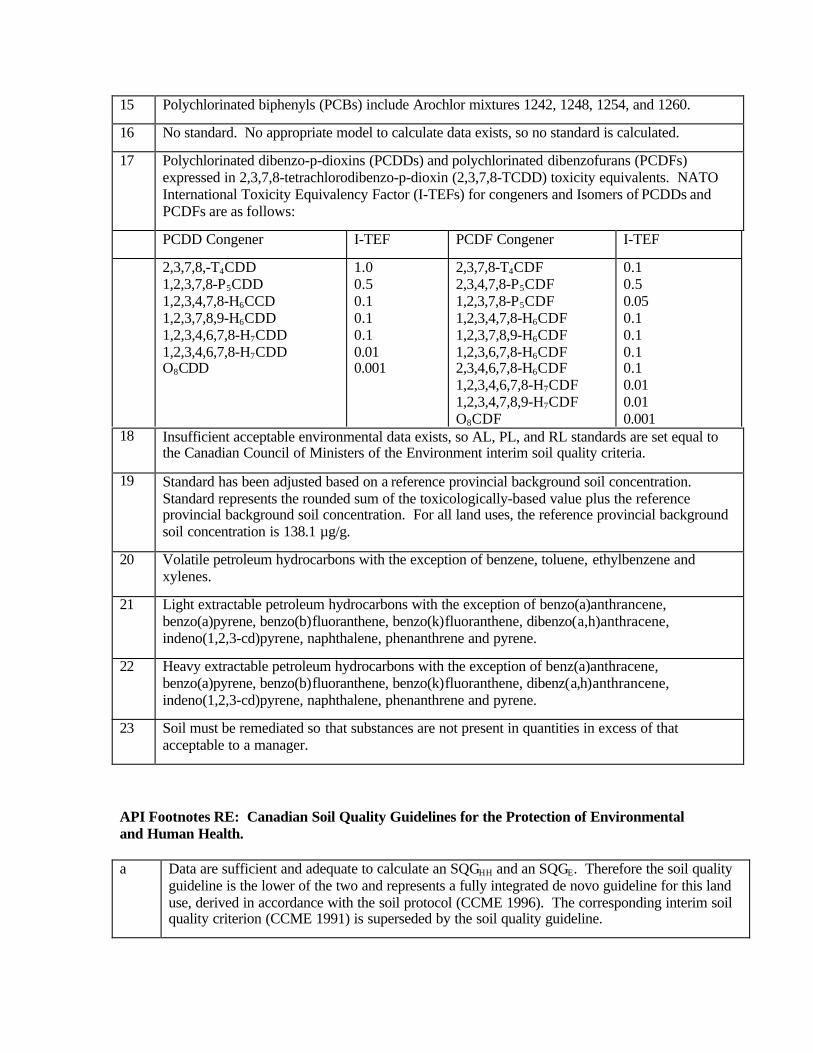
15 Polychlorinated biphenyls (PCBs) include Arochlor mixtures 1242, 1248, 1254, and 1260.
16 No standard. No appropriate model to calculate data exists, so no standard is calculated.
17 Polychlorinated dibenzo-p-dioxins (PCDDs) and polychlorinated dibenzofurans (PCDFs)expressed in 2,3,7,8-tetrachlorodibenzo-p-dioxin (2,3,7,8-TCDD) toxicity equivalents. NATOInternational Toxicity Equivalency Factor (I-TEFs) for congeners and Isomers of PCDDs andPCDFs are as follows:
PCDD Congener I-TEF PCDF Congener I-TEF
2,3,7,8,-T4CDD1,2,3,7,8-P5CDD1,2,3,4,7,8-H6CCD1,2,3,7,8,9-H6CDD1,2,3,4,6,7,8-H7CDD1,2,3,4,6,7,8-H7CDDO8CDD
1.00.50.10.10.10.010.001
2,3,7,8-T4CDF2,3,4,7,8-P5CDF1,2,3,7,8-P5CDF1,2,3,4,7,8-H6CDF1,2,3,7,8,9-H6CDF1,2,3,6,7,8-H6CDF2,3,4,6,7,8-H6CDF1,2,3,4,6,7,8-H7CDF1,2,3,4,7,8,9-H7CDFO8CDF
0.10.50.050.10.10.10.10.010.010.001
18 Insufficient acceptable environmental data exists, so AL, PL, and RL standards are set equal tothe Canadian Council of Ministers of the Environment interim soil quality criteria.
19 Standard has been adjusted based on a reference provincial background soil concentration.Standard represents the rounded sum of the toxicologically-based value plus the referenceprovincial background soil concentration. For all land uses, the reference provincial backgroundsoil concentration is 138.1 µg/g.
20 Volatile petroleum hydrocarbons with the exception of benzene, toluene, ethylbenzene andxylenes.
21 Light extractable petroleum hydrocarbons with the exception of benzo(a)anthrancene,benzo(a)pyrene, benzo(b)fluoranthene, benzo(k)fluoranthene, dibenzo(a,h)anthracene,indeno(1,2,3-cd)pyrene, naphthalene, phenanthrene and pyrene.
22 Heavy extractable petroleum hydrocarbons with the exception of benz(a)anthracene,benzo(a)pyrene, benzo(b)fluoranthene, benzo(k)fluoranthene, dibenz(a,h)anthrancene,indeno(1,2,3-cd)pyrene, naphthalene, phenanthrene and pyrene.
23 Soil must be remediated so that substances are not present in quantities in excess of thatacceptable to a manager.
API Footnotes RE: Canadian Soil Quality Guidelines for the Protection of Environmentaland Human Health.
a Data are sufficient and adequate to calculate an SQGHH and an SQGE. Therefore the soil qualityguideline is the lower of the two and represents a fully integrated de novo guideline for this landuse, derived in accordance with the soil protocol (CCME 1996). The corresponding interim soilquality criterion (CCME 1991) is superseded by the soil quality guideline.

b Data are insufficient/inadequate to calculate an SQGHH, an SQGE, or a provisional SQGE.Therefore the interim soil quality criterion (CCME 1991) is retained as the soil quality guidelinefor this land use.
e Data are sufficient and adequate to calculate only a provisional SQGE. It is greater than thecorresponding interim soil quality criterion (CCME 1991). Therefore, in consideration ofreceptors and/or pathways not examined, the interim soil quality criterion is retained as the soilquality guideline for this land use.
c Data are sufficient and adequate to calculate an SQGHH and a provisional SQGE. Both are greaterthan the corresponding interim soil quality criterion (CCME 1991). Therefore, in considerationof receptors and/or pathways not examined, the interim soil quality criterion is retained as the soilquality guideline for this land use.
e Data are sufficient and adequate to calculate an SQGHH and a provisional SQGE. Both are lessthan corresponding interim soil quality criterion (CCME 1991). Therefore, the soil qualityguideline supersedes the interim soil quality criterion for this land use.
f The soil-plant-human pathway was not considered in the guideline derivation. If produce gardensare present or planned, a site-specific objective must be derived to take into account thebioaccumulation potential (e.g., adopt the agricultural guideline as objective). The off-sitemigration check should be recalculated accordingly.
g Data are sufficient and adequate to calculate only a provisional SQGE, which is less than theexisting interim soil quality criterion (CCME 1991). Therefore, the soil quality guidelinesupersedes the interim soil quality criterion for this land use.
h Data are sufficient and adequate to calculate only an SQGE. An interim soil quality criterion(CCME 1991) was not established for this land use, therefore the SQGE becomes the soil qualityguideline.
i In site-specific situations where the size and/or the location of commercial and industrial landuses may impact primary, secondary, or tertiary consumers, the soil and food ingestion guidelineis recommended as the SQGE.
j Data are sufficient and adequate to calculate only a provisional SQGE.
k Data are sufficient and adequate to calculate only an SQGE, which is less than the interim soilquality criterion (CCME 1991) for this land use. Therefore the SQGE becomes the soil qualityguideline, which supersedes the interim soil quality criterion for this land use.
l Data are sufficient and adequate to calculate only an SQGHH and an SQGE. The provisionalSQGHH is equal to the SQGE and to the existing interim soil quality criterion (CCME 1991) andthus becomes the soil quality guideline, which supersedes the interim soil quality criterion for thisland use.
m Data are sufficient and adequate to calculate a provisional SQGHH and an SQGE. The provisionalSQGHH is less than the SQGE and thus becomes the soil quality guideline for this land use.
n Data are sufficient and adequate to calculate only an SQGE. An interim soil quality criterion(CCME 1991) was not established for this land use, therefore the SQGE becomes the soil qualityguideline.
o Hot water soluble.
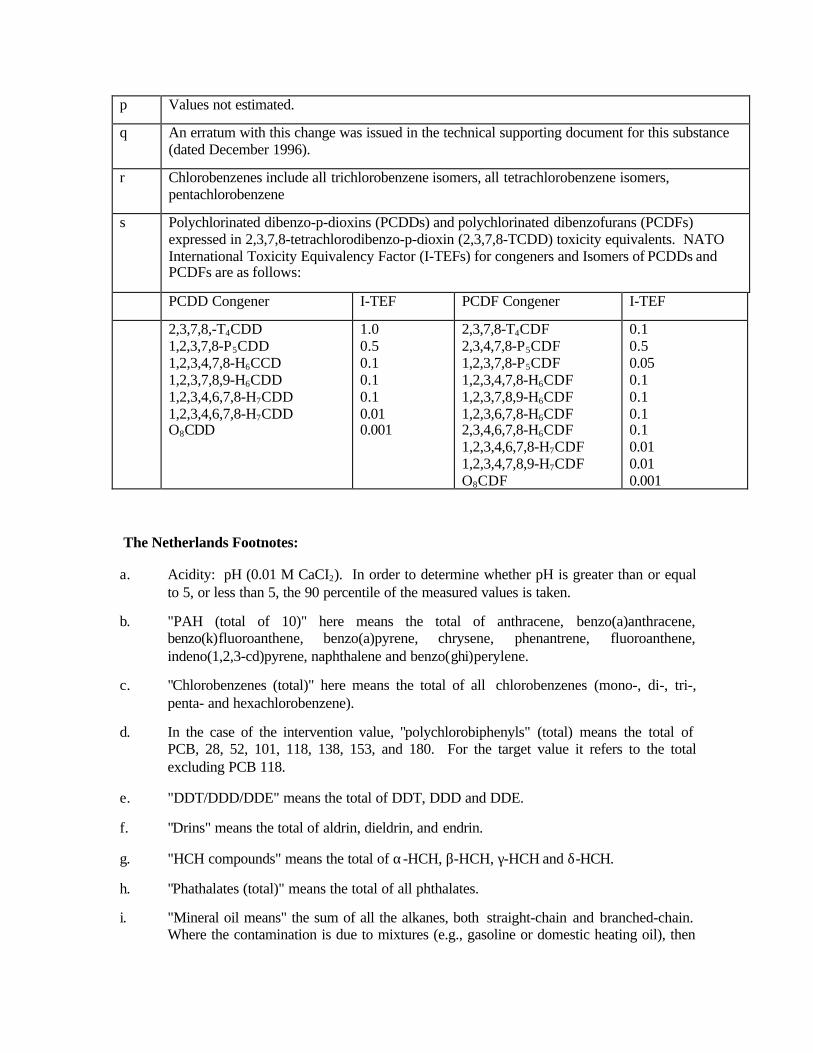
p Values not estimated.
q An erratum with this change was issued in the technical supporting document for this substance(dated December 1996).
r Chlorobenzenes include all trichlorobenzene isomers, all tetrachlorobenzene isomers,pentachlorobenzene
s Polychlorinated dibenzo-p-dioxins (PCDDs) and polychlorinated dibenzofurans (PCDFs)expressed in 2,3,7,8-tetrachlorodibenzo-p-dioxin (2,3,7,8-TCDD) toxicity equivalents. NATOInternational Toxicity Equivalency Factor (I-TEFs) for congeners and Isomers of PCDDs andPCDFs are as follows:
PCDD Congener I-TEF PCDF Congener I-TEF
2,3,7,8,-T4CDD1,2,3,7,8-P5CDD1,2,3,4,7,8-H6CCD1,2,3,7,8,9-H6CDD1,2,3,4,6,7,8-H7CDD1,2,3,4,6,7,8-H7CDDO8CDD
1.00.50.10.10.10.010.001
2,3,7,8-T4CDF2,3,4,7,8-P5CDF1,2,3,7,8-P5CDF1,2,3,4,7,8-H6CDF1,2,3,7,8,9-H6CDF1,2,3,6,7,8-H6CDF2,3,4,6,7,8-H6CDF1,2,3,4,6,7,8-H7CDF1,2,3,4,7,8,9-H7CDFO8CDF
0.10.50.050.10.10.10.10.010.010.001
The Netherlands Footnotes:
a. Acidity: pH (0.01 M CaCI2). In order to determine whether pH is greater than or equalto 5, or less than 5, the 90 percentile of the measured values is taken.
b. "PAH (total of 10)" here means the total of anthracene, benzo(a)anthracene,benzo(k)fluoroanthene, benzo(a)pyrene, chrysene, phenantrene, fluoroanthene,indeno(1,2,3-cd)pyrene, naphthalene and benzo(ghi)perylene.
c. "Chlorobenzenes (total)" here means the total of all chlorobenzenes (mono-, di-, tri-,penta- and hexachlorobenzene).
d. In the case of the intervention value, "polychlorobiphenyls" (total) means the total ofPCB, 28, 52, 101, 118, 138, 153, and 180. For the target value it refers to the totalexcluding PCB 118.
e. "DDT/DDD/DDE" means the total of DDT, DDD and DDE.
f. "Drins" means the total of aldrin, dieldrin, and endrin.
g. "HCH compounds" means the total of α-HCH, β-HCH, γ-HCH and δ-HCH.
h. "Phathalates (total)" means the total of all phthalates.
i. "Mineral oil means" the sum of all the alkanes, both straight-chain and branched-chain.Where the contamination is due to mixtures (e.g., gasoline or domestic heating oil), then

not only the alkane content but also the content of aromatic and/or polycyclic aromatichydrocarbons must be determined. This aggregate parameter has been adopted forpractical reasons. Further toxicological and chemical disaggregation is under study.
j. The values for total polycyclic aromatic hydrocarbons, total chlorophenols and totalchlorobenzenes in soil/sediment apply to the total concentration of the compoundsbelonging to the relevant category. If the contamination is due to only one compound ofa category, the value used is the intervention value for the compound, where there aretwo or more compounds the value for the total of these compounds applies, etc. Forsoil/sediment, effects are directly additive (i.e., 1 mg of substance A has the same effectas 1 meg of substance B) and can be checked/compared against an aggregate standard bysumming the concentrations of the substances involved. For further information aboutthis additivity see, for example, the Technical Committee for Soil Protection (1989) 1.
m. Detection threshold
MPC (Maximum Permissible Concentrations Footnotes
a. MPA based on statistical extrapolation, toxicity data follow a long-logistic distribution.
c. MPA based on modified EPA-method, applying a factor 10 on the lowest NOEC
f. MPA based on equilibrium partioning
g. Van de Meent et al., (1990)
h. Van de Plassche and De Bruijn (1992)
Westinghouse Savannah River Site Footnotes
1. Beyer (1990)2. Oak Ridge National Laboratory (Efroymson et al. 1997a,b)3. CCME (1997)4. Ministry of Housing, Spatial Planning and Environment (1994)5. Crommentuijn et al. (1997)
USSR Footnote:
1. Maximum allowable concentration (MAC) and tentative allowable concentrations (TAC)of pesticides and other substances in soil in the Soviet Union (from USSR StateCommittee for Science and Technology, 1984).
1 Technical Committee for Soil Protection (1989). Advies beoordeling van bodemverontreiniging metpolycyclische aromate (Advice regarding the assessment of soil contaminated with polycyclic aromatics)TCB A89-03


