

Ecology predicts life history evolution in birds
Mar Unzeta Lloret
Master en Ecologia Terrestre i Gestió de la Biodiversitat Especialitat: Ecologia Terrestre
Tutor: Daniel Sol Rueda
Departament de Biologia Animal, Vegetal i Ecologia. CREAF
13 de setembre de 2013


INFORMATION RELATIVE TO THE STUDY Beginning of the study: January 2013
Finding a relevant question: partially done by the student (with help and supervision of the director). January-February 2013 Literature search and establishment of variables and predictions: entirely done by the student (with supervision of the director). March–May 2013 Construction of birds global databases about 1) life-history traits, 2) ecology and 3) behavior: partially done by the student. March-June 2013 Construction of a database for the study: entirely done by the student. June–August 2013. Data analyses: entirely done by the student. July–September 2013 Results interpretation: entirely done by the student (with supervision of the director). August–September 2013 Report writing: entirely done by the student (with supervision of the director). August–September 2013


1
Ecology predicts life history evolution in birds
Mar Unzeta Lloret
Abstract:
Although a number of studies describe current evolutionary patterns concerning life-
history evolution, how historical changes in the way organisms interact with their
environment have shaped life-history evolution still remains unresolved. In this study, I
integrate prospective and retrospective comparative approaches to ask what ecological
factors have driven current variation in lifespan of bird passerines. An analysis of >500
species suggest that lifespan is higher in cooperative breeders and in species that build the
nest in more secure sites, consistent with the age-specific theory of life history evolution. A
retrospective analysis further indicated that these two traits likely evolved through a
Ornstein-Uhlenbeck evolutionary model with different optima for each selective regime.
Specifically, transitions to cooperative breeding behavior and to nesting in less exposed
sites resulted in changes towards longer lifespan optima. These results are the first
evidence that ecological and behavioral changes produced in life history strategies in the
past, and provide new insights to understand and predict current and future life-history
evolutionary patterns.
Key words:
Life-history, fast-slow continuum, Passerines, Ornstein-Uhlenbeck

2
3
INTRODUCTION
Evolution has led to a great diversity of life cycles. Such variety in life history strategies is
reflected in how all the living forms differ in the investment of energy to grow, reproduce
or survive. As different life history traits affect reproduction and survival, and therefore
fitness, the study of life history remains crucial to understand evolutionary processes.
However, how such diversity of life histories has evolved remains a major unresolved
question in biology.
There is consensus that the enormous diversity of life-history strategies results from
environmental factors influencing life history traits and tradeoffs that act as evolutionary
constrains (Stearns 2000). One of the major axis of life-history variation is explained by the
tradeoff between survival and fecundity, which defines the fast-slow continuum (Stearns
1983, Bielby et al. 2007). Thus, at the fast extreme there are species that prioritize
reproduction over survival through an earlier reproductive age, a greater reproductive
effort and a lower survival, whereas the slow extreme is represented by species prioritizing
survival over reproduction.
Life history theory regards age-specific mortality as a major agent of selection that drives
the fast-slow continuum evolution. This is based on demographic models and predicts life
history evolution depending on which age groups are selected. When adult mortality is
high, then earlier maturation age and higher reproductive effort should be selected, while
when adult mortality is low, selection should favor a later maturation age and a longer
lifespan because there is a lower risk to die before reproducing. On the contrary, increased
juvenile mortality rates should favor a slow-lived strategy, while increased adult mortality
rates should select for a fast-lived strategy (Charlesworth 1980, Reznick et al. 2002).
The age-specific hypothesis is supported by several empirical studies in different taxa. First,
there is evidence that in wild populations high mortality rates lead to an earlier maturation
age and higher reproductive effort, whereas at low mortality rates selection drives life-
history evolution to the slow extreme (Reznick et al. 1990, Crowl and Covich 1990). Second,
several comparative studies also support that species living in less risky environments are
associated with slow-lived strategies and viceversa (Shattuck and Williams 2000, Holmes
and Austad 1994, Martin 2011).
Although there are a number of prospective studies concerning the evolution of the fast-
slow continuum, there has been little effort to use retrospective analyses. However,
documenting current patterns of variation is insufficient to study evolutionary processes
because the processes we currently observe are not necessarily the same that occurred in
the past. Thus, some authors have highlighted the need to study adaptations with an
integrative approach that combines prospective and retrospective perspectives (Losos
1994). Admittedly, a major challenge of retrospective analyses is the need to infer
evolutionary changes that occurred millions of years ago. Yet, the current availability of life

4
history and ecological information, together with the development of new methods to
reconstruct past changes in a phylogeny (Revell 2012, Beaulieu et al. 2012), provide a
unique opportunity to address the evolution of life histories within a historical framework.
Here, I use these advances to ask how changes in ecology have shaped the fast-slow
continuum evolution in passerines. My focus is on maximum lifespan, defined as the
longest period any individual of a species has been recorded to survive, which is considered
a major component of the fast-slow continuum. According to theory, several ecological and
behavioral factors are predicted to affect lifespan. First, nesting behavior has been related
with juvenile and adult survival in several ways. For example, it has been suggested that
open nests or those located on the ground suffer higher predation rates than those located
in cavities or in tall trees or cliffs (Martin and Li 1992, Martin 1995, Shattuck and Williams
2010). Second, foraging behavior may also affect lifespan, increasing with height where
foraging activity is performed. Indeed, previous work in birds and mammals suggest that
both flight and arboreality are related with longer lifespan probably due to a reduced
exposure to terrestrial predators (Shattuck and Williams 2010, Pomeroy 1990). Third, social
factors such as cooperative breeding and colonial behavior are also hypothesized to be
related with lifespan, predicting longer lifespan for both cooperative breeders and colonial
species due to a reduction of mortality (Arnold and Owens 1998, Varela et al. 2007).
Fourth, relations between lifespan and both parental care and mating system have also
been reported; although in this case the underlying mechanisms remain unclear, these
could be related to the costs of the increment in mating competition and parental care
(Liker and Székely 2005). Fifth, classical theories predict fewer species at equilibrium on
islands rather than in the mainland and, therefore, islands should support fewer predators
(MacArthur and Wilson 1967, Blumstein 2002). Thus, insularity should be related with a
longer lifespan through a reduction in predation risk. Finally, it has been suggested that
migrant species should exhibit lower survival rates than residents because of the costs of
travelling long distances over unfamiliar regions (Sillett and Holmes 2002).
My initial goal is to use a prospective approach to identify which of the above ecological
and behavioral factors are related to lifespan. To this purpose, I use phylogenetic least
square regressions within a model selection framework as a way to assess the relative
importance of each factor.
Next, I reconstruct the most relevant factors in a phylogeny to test whether past
evolutionary changes have occurred several times independently across the phylogeny,
and if so, use new developed Brownian and Ornstein-Uhlenbeck evolutionary models to
directly assess whether and how changes in these factors bring associated changes in
lifespan, and, therefore, in the fast-slow continuum. Brownian motion models assume that
changes in life history randomly accumulate over time whereas Ornstein-Uhlenbeck
models instead assume that there is a single optimum value of life history or different
optima for each selective regime (Beaulieu et al. 2012). Integrating prospective and

5
retrospective approaches, I pretend to address how the variation of ecological and
behavioral patterns influenced evolutionary changes towards fast lived or slow lived
strategies in the past.
MATERIAL AND METHODS
Birds have played an important role in the study of life-history evolution because
ecological, behavioral, life history and phylogenetic information are easily available. For all
these reasons this study is focused on birds and in particular, on Passerines in order to
reduce the error resulting from the variation that exists in some traits, such as the mode of
development, between different orders.
Data collection
Records of lifespan, ecological, behavioral and confounding variables were obtained from
published literature for 555 species of passerines (see source references in Appendix S1).
However, because information of these variables was lacking for some species, the initial
dataset was reduced to 327 species in analyses where all the variables were tested
simultaneously. Phylogenies for the species analyzed were downloaded from the complete
phylogeny of extant birds, which comprises 9.993 species, compiled in a Bayesian
framework (Jetz et al. 2012). Subsets of 100 phylogenetic trees were obtained from the
complete phylogeny for both Hackett and Ericson pseudo-posterior distributions, to ensure
that the obtained results were not affected by phylogenetic uncertainties.
Description of variables
Lifespan records, obtained from published material (see sources in Appendix S1), included
both wild and captivity maximum longevity data. Previous work has shown that there is a
good correlation between wild and captivity maximum longevity data (Ricklefs 2000),
which justifies their use in comparative analyses. When both wild and captivity records
were available, then the maximum lifespan was used as it is a closer estimate of the
maximum potential lifespan (Shattuck and Williams 2010).
The ecological and behavioral variables hypothesized to affect either juvenile or adult
extrinsic mortality were: i. nest site (mean height where the nest is placed, categorized as
ground= 0m, shrub= 0-3m, canopy= >3m, cliff); ii. nest protection (open, dommed, non-
excavator= hole nesting); iii. parental care (biparental, female care); iv. cooperative
breeding (non-cooperative, occasional, cooperative breeder); v. foraging behavior (main
foraging substrate classified as: ground (0m), low vegetation (0-3m), arboreal (>3m), aerial,
generalist); vi. coloniality (colonial, loosecolonies, facultative, solitary); vii. mating system
(monogamous, monogamous/polygynous, polygynous); viii. insularity (mainland, islands);
ix. migration (migrant, resident). When one species could not be unambiguously assigned

6
to a unique category, I decided to assign it to the category where predation risk was lower,
assuming that these sites would be preferred when predation risk is high.
Body size, biogeographical region and diet were included as confounding factors. Body size
is related to lifespan in birds and mammals through extrinsic mortality effects (Calder 1983,
Ricklefs 2000) or intrinsic mortality effects associated with basal metabolic rates
(Speakman 2005, Hulbert et al. 2007). The biogeographic region (coded as Africa, Australia,
Indomalayan, Nearctic, Neotropical, Palearctic, Multiregion) can also affect life history
traits, with tropical species tending toward the slow extreme of the fast-slow continuum
compared with non-tropical species (Ghalambor and Martin 2001, Martin 2004). Finally,
diet (carnivorous, herbivorous, omnivorous) can also affect lifespan; the underlying
mechanisms still remain unclear, but these could be related with indirect effects on body
size and/or somatic maintenance effects (Munshi-South and Wilkinson 2006, Wasser and
Sherman 2010). The sources for all these variables are presented in Appendix S1.
Data analysis
PHILOGENETIC LEAST SQUARE REGRESSION
To identify what ecological and behavioral factors affect lifespan, I conducted a
Phylogenetic Least Square Regression Analysis (PGLS, hereafter) using the R Caper package
(Orme 2012). Lifespan and body size were log-transformed to improve the linearity of the
relationship. To assess what factors mostly affected lifespan, I first conducted univariate
analyses using the maximum sample size for each variable. To ensure that the results were
not affected by phylogenetic uncertainties, each univariate analysis was repeated 10 times
with different randomly selected trees of the posterior distribution of both Hackett and
Ericson phylogenies. Then, using the MuMIn R package (Barton 2012), I validated all the
possible combination of variables performing a model selection based on AICc values.
Because several “best models” models were selected (∆AICc < 4), I calculated the sum of
the AICw values over all the models where each variable was included to infer the relative
importance of the variable.
STOCHASTIC CHARACTER MAPPING AND EVOLUTIONARY MODELS
The factors selected in the PGLS analyses were reconstructed on the phylogenies using a
Stochastic Character Mapping procedure (Nielsen 2002, Huelsenbeck 2003). This method
uses a Bayesian approach to model character changes following a continuous-time Markov
process (Nielsen 2002, Huelsenbeck et al. 2003). In order to reconstruct the potential trait
changes on the phylogeny, the R package Phytools (Revell 2012) was used to obtain 300
stochastic character maps for each factor by running five simulations per each phylogenetic
tree obtained from subsets of the complete phylogeny of Hackett and Ericson distributions.
To test whether there are independent evolutionary changes across the phylogeny, the

7
number and type of character transitions were calculated for each factor from the
obtained character stochastic maps.
The stochastic character maps were then analyzed using the R package OUwie to assess
what evolutionary model best explains the evolution of lifespan under the different
selective regimes (Beaulieu et al. 2012). I considered a variety of both Brownian motion
(BM), and Ornstein-Uhlenbeck (OU) models (Beaulieu et al. 2012). The OU models fitted
were: 1) a simple OU model with a single optimum (θ) for all the species (“OU1” model), 2)
an “OUM” model with different optimum means and a single strength of selection (α) and
rate of stochastic motion around the optima (σ2), 3) OU models with different optimum
means and multiple σ2 (“OUMV” model) or α (“OUMA” model) across the selective
regimes, and 4) an “OUMVA” model that allows θ, σ2 and α variation.
Moreover, two different BM models were also fitted: a single rate “BM1” model and a
“BMS” model with different rate parameters for each state or phylogeny. Brownian motion
models can describe drift, drift-mutation balance and stabilizing selection toward a moving
optimum (Beaulieu et al. 2012). Although I hypothesize that the studied ecological changes
should lead to changes in the rate of lifespan change (BMS model) or to different optima
for each selection regime (OUM models), models assuming that different factors do not
affect differently lifespan changes (BM1 and OU1 models) were also fitted as control.
Furthermore, the rejection of BMS model would indicate that lifespan evolution has not
followed random processes.
The performance of evolutionary models was evaluated with 80 randomly selected
stochastic character maps obtained for both Hackett and Ericson phylogenies. To find the
best model supported by the data, a model selection based on Akaike weights (AICw) was
conducted through the calculation of the relative likelihood of each model in each
phylogeny, and then averaging the AICw of each model overall phylogenetic trees
(Burnham and Anderson 2002). Then, the parameter estimates of the models selected
were averaged to obtain their mean and their 2.5 and 97.5% quantiles.
RESULTS
PGLS
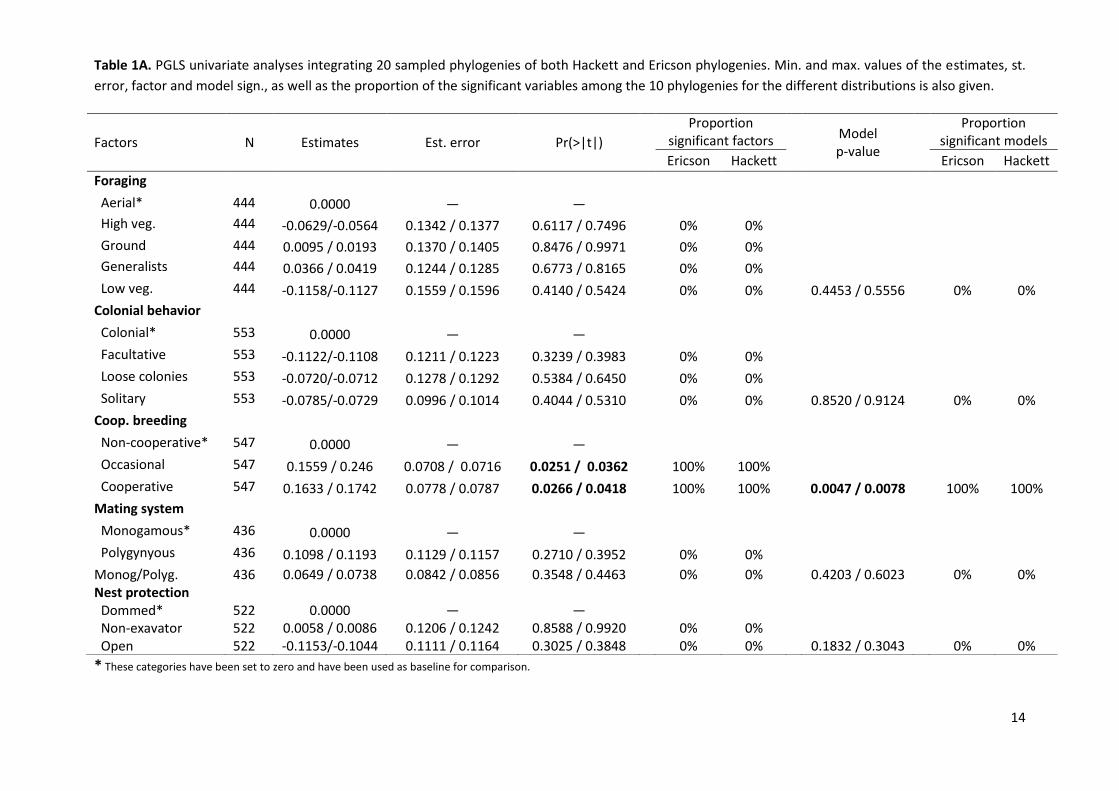
Univariate PGLS models revealed an association between lifespan and two of the studied
ecological factors: cooperative breeding and nest site. According to the models,
cooperative breeders exhibit a longer maximum life than non-cooperative breeders
whereas ground nesters showed shorter lives than canopy nesters (Table 1A). These results
are consistent regardless of the phylogenetic hypothesis used (Table 1A). A third variable,
diet, also seem to be associated with lifespan, yet in this case evidence is less clear. Thus,
8
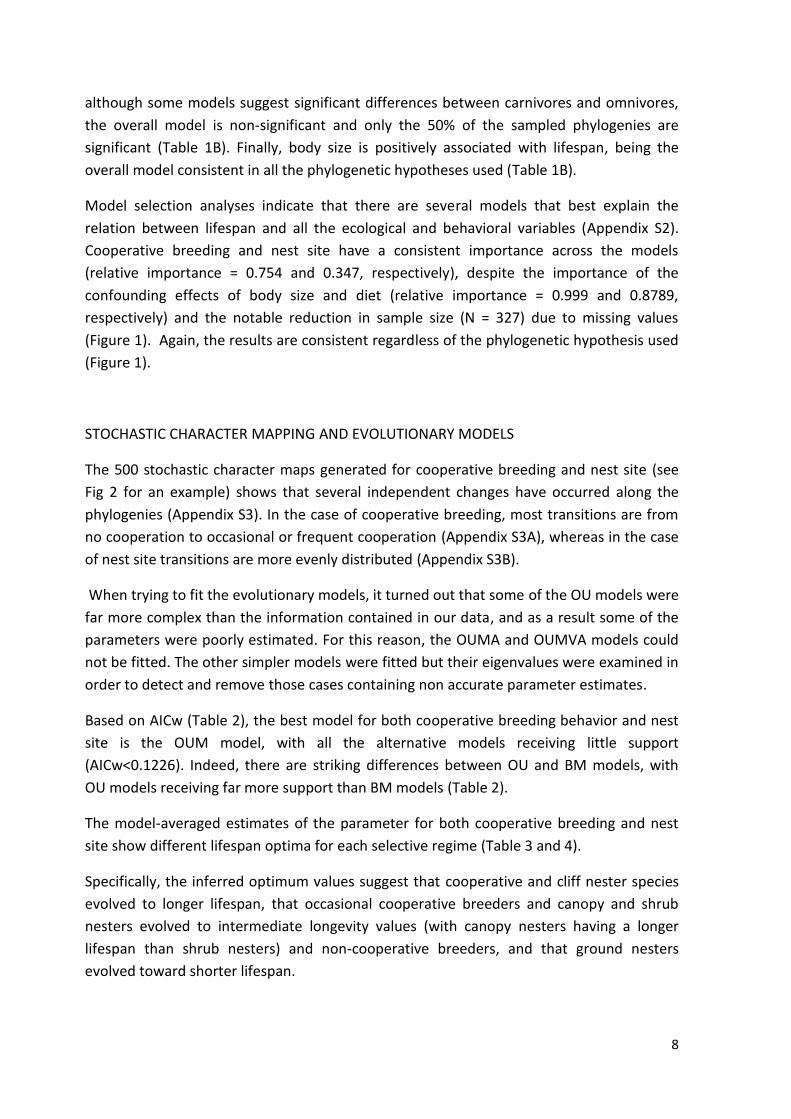
although some models suggest significant differences between carnivores and omnivores,
the overall model is non-significant and only the 50% of the sampled phylogenies are
significant (Table 1B). Finally, body size is positively associated with lifespan, being the
overall model consistent in all the phylogenetic hypotheses used (Table 1B).
Model selection analyses indicate that there are several models that best explain the
relation between lifespan and all the ecological and behavioral variables (Appendix S2).
Cooperative breeding and nest site have a consistent importance across the models
(relative importance = 0.754 and 0.347, respectively), despite the importance of the
confounding effects of body size and diet (relative importance = 0.999 and 0.8789,
respectively) and the notable reduction in sample size (N = 327) due to missing values
(Figure 1). Again, the results are consistent regardless of the phylogenetic hypothesis used
(Figure 1).
STOCHASTIC CHARACTER MAPPING AND EVOLUTIONARY MODELS
The 500 stochastic character maps generated for cooperative breeding and nest site (see
Fig 2 for an example) shows that several independent changes have occurred along the
phylogenies (Appendix S3). In the case of cooperative breeding, most transitions are from
no cooperation to occasional or frequent cooperation (Appendix S3A), whereas in the case
of nest site transitions are more evenly distributed (Appendix S3B).
When trying to fit the evolutionary models, it turned out that some of the OU models were
far more complex than the information contained in our data, and as a result some of the
parameters were poorly estimated. For this reason, the OUMA and OUMVA models could
not be fitted. The other simpler models were fitted but their eigenvalues were examined in
order to detect and remove those cases containing non accurate parameter estimates.
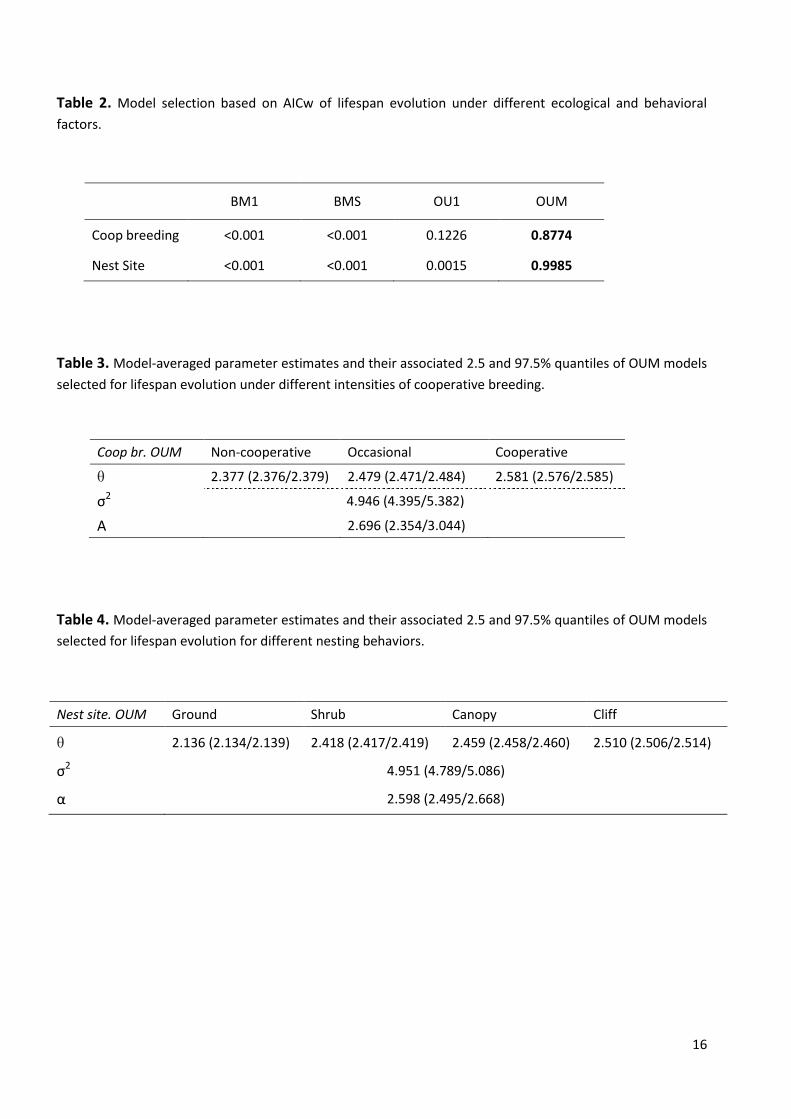
Based on AICw (Table 2), the best model for both cooperative breeding behavior and nest
site is the OUM model, with all the alternative models receiving little support
(AICw<0.1226). Indeed, there are striking differences between OU and BM models, with
OU models receiving far more support than BM models (Table 2).
The model-averaged estimates of the parameter for both cooperative breeding and nest
site show different lifespan optima for each selective regime (Table 3 and 4).
Specifically, the inferred optimum values suggest that cooperative and cliff nester species
evolved to longer lifespan, that occasional cooperative breeders and canopy and shrub
nesters evolved to intermediate longevity values (with canopy nesters having a longer
lifespan than shrub nesters) and non-cooperative breeders, and that ground nesters
evolved toward shorter lifespan.

9
DISCUSSION
The results presented here represents the first evidence to date that historical changes in
the ecology and behavior of animals have brought associated changes in their lifespan.
Specifically, changes in cooperative breeding and in nesting behavior appear to have been
associated with important lifespan adjustments in the direction predicted by life history
theory. Below I discuss the results and their implications for life history evolution.
OU models received more support that BM models, indicating that lifespan evolution has
not followed random processes. Moreover, OUM support shows that different optima for
each selective regime have driven lifespan evolution in the past.
Changes from non-cooperative breeding to occasional cooperative breeding, and from
occasional cooperative breeding to cooperative breeding seem to have resulted in an
increment of lifespan whereas changes from lower nests sites to higher or inaccessible
nests sites have also resulted in changes to an increment of lifespan.
The findings that cooperative breeding behavior brought associated changes in lifespan are
in agreement with Arnold and Owens (1998), who showed that cooperative breeding is
related with low adult mortality, and therefore, long lifespan. In winter helpers contribute
in sentinel behavior to detect predators, so that pairs can decrease their sentinel behavior
and increase foraging time, and during the breeding season pairs with helpers are
benefited through a greater nest protection than lone pairs (Hailman et al. 1994). Thus,
cooperative breeding seems to imply a reduction of predation, and, therefore, extrinsic
mortality. Although this finding was supported by posterior studies (Wasser and Sherman
2010), others found no relationship between cooperative breeding and lifespan (Blumstein
and Moller 2008). My results not only show that cooperative breeding is associated with
lifespan, but also yield evidence that past evolutionary changes from non-cooperative to
cooperative breeding are associated with changes towards longer lifespan.
Taken together, the results indicate that historical changes in cooperative breeding
brought associated changes in the fast-slow continuum, favoring long-lived strategies
presumably through mortality effects.
The results concerning lifespan changes associated with the different nest site selective
regimes also support previous predictions that adult survival is associated to nest sites
(Martin 1995). The results are consistent with predictions that arboreality is related with
longer lifespan due to a reduction of terrestrial predators while species living on the
ground are associated with shorter lifespan as they suffer lower survival due to higher
predation rates (Shattuck and Williams 2010). Moreover, songbirds inhabiting in cliffs
exhibited longer lifespan than canopy nesters, suggesting that cliffs are probably a more
secure nest site than canopies as they are more inaccessible to predators. Thus, as changes
in nest site brought associated changes in lifespan through extrinsic mortality effects,

10
results show how changes from nest sites exposed to high predation risk to nest sites with
lower predation risk resulted in changes towards long lived strategies in the past. My
results however show some discrepancies with Martin 1995, who found that due to
reduced predation effects, ground nesters exhibited greater adult survival than canopy and
shrub nesters, and that survival of canopy nesters was higher than shrub nesters. Although
the present results also show greater lifespan for canopy nesters respect shrub nesters,
ground nesters exhibit the lowest lifespan, and, therefore the lowest survival.
Inferring which factors have affected past evolutionary changes in the fast-slow continuum
is of great importance to understand current evolutionary patters of life history variation or
to predict evolutionary patterns in the future. The integration of prospective and
retrospective perspectives has allowed me to show how past changes in ecological and
behavioral variables brought associated changes towards fast or slow strategies, and,
therefore can contribute to the understanding of current patterns associated with life
history evolution and to the prediction of future evolutionary patterns.
However, the unbalanced data resulting from focusing the study on passerines have not
allowed the possibility to fit complex evolutionary models. Thus, it would be interesting to
analyze in the future how variation in the strength of selection and in the rate of stochastic
motion has explained transitions towards the different selective regimes optimums.
Further research is also needed to understand how ecology and behavior have shaped life
history evolution through both adult and juvenile mortality. While there is currently
abundant information on adult survival, how changes in ecological and behavioral patterns
influenced past changes in life-history evolution trough juvenile mortality still remains
unresolved due to the paucity of mortality information for this age-stage. Filling this gap
can represent an important avenue for future research.
ACKNOWLEDGEMENTS
I’m grateful to Sol’s lab for their helpful support and discussions. Moreover, I would like to
thank all the previous studies in which this study is based, as without the important work of
experimental studies, comparative approaches would not be possible.

11
REFERENCES
Arnold, K.E. and Owens, I.P.F. 1998. Cooperative breeding in birds: a comparative test of the life history hypothesis. Proc. Roy. Soc. Lond. Ser. B, 265, 739–745.
Barton, K., 2012. Model selection and model averaging based on information criteria (AICc
and alike). R package version 1.9.5
Beaulieu, J. M., Jhueng, D-C., Boettiger, C., O’Meara, B. C. 2012. Modeling stabilizing selection: expanding the Ornstein–Uhlenbeck model of adaptive evolution. , 66, 2369–2383.
Bielby, J., Mace, G. M., Bininda-Emonds, O. R. P., Cardillo, M., Gittleman, J. L., Jones, K.
E., Orme, C. D. L. and Purvis, A. 2007. The fast–slow continuum in mammalian life history: an empirical reevaluation. American Naturalist, 169, 748–757.
Blumstein, D.T. 2002. Moving to suburbia: ontogenetic and evolutionary consequences of
life on predator-free islands. J. Biogeogr, 29, 685–692. Blumstein, D. T. and Moller, A. P. 2008. Is sociality associated with high longevity in North
American birds? Biol. Lett, 4, 146–148. Burnham, K. P., Anderson, D. R. 2002. Model selection and multi-model inference: a
practical information-theoretic approach. New York, NY: Springer.
Calder, W. A. 1983. Body size, mortality, and longevity. J. theor. Biol, 102, 135–144. Charlesworth, B. 1980. Evolution in Age-structured Populations. Cambridge University
Press, Cambridge, United Kingdom. Crowl, T. A., and A. P. Covich. 1990. Predator-induced life-history shifts in a freshwater
snail. Science, 247, 949–951. Ghalambor, C. K. and Martin, T. E. 2001. Fecundity-survival trade-offs and parental risk-
taking in birds. Science, 292, 494–497 Hailman, J. P., McGowan, K. J. and Woolfenden, G. E. 1994. Role of helpers in the sentinel
behaviour of the Florida scrub jay (Aphelocoma c. coerulescens). Ethology, 97, 119–140. Holmes, D. J., Austad, S. N. 1994. Fly now, die later: life-history correlates of gliding and
flying in mammals. J. Mammal, 75, 224–226. Huelsenbeck, J. P., Nielsen, R., Bollback, J.P. 2003. Stochastic mapping of morphological
characters. Syst. Biol, 52, 131–158. Hulbert, A. J., Pamplona, R., Buffenstein, R. and Buttemer, W. A. 2007. Life and death:
metabolic rate, membrane composition, and life span of animals. Physiol. Rev., 87, 1175–1213.
12
Jetz, W., Thomas, G. H., Joy, J. B., Hartmann, K., Mooers, A. O. 2012. The global diversity of
birds in space and time. Nature, 491, 444-8. Liker, A. and Székely, T. 2005. Mortality costs of sexual selection and parental care in
natural populations of birds. Evolution, 59, 890–897.
Losos, J. B. 1994. Integrative approaches to evolutionary ecology: Anolis lizards as model
systems. Annual Review of Ecology and Systematics, 25, 467-493.
MacArthur, R. H. and Wilson, E. O. 1967. The theory of island biogeography. Princeton
University Press, Princeton.
Martin, T. E., and P. Li. 1992. Life history traits of open- versus cavity-nesting birds. Ecology,
73, 579-592.
Martin, T. E. 1995. Avian life history evolution in relation to nest sites, nest predation and
food. Ecological Monographs, 65, 101-127.
Martin, T. E. 2004. Avian life-history evolution has an eminent past: Does it have a bright
future? The Auk, 121, 289–301.
Martin, T. E. 2011. The cost of fear. Science, 334, 1353–1354.
Munshi-South, J. and Wilkinson, G. S. (2006). Diet influences life span in parrots. The Auk, 123, 108–118.
Nielsen, R. 2002. Mapping mutations on phylogenies. Syst. Biol, 51, 729–739. Orme, C. D. L. 2012. The caper package: comparative analysis of phylogenetics and
evolution in R. R Development Core Team. Pomeroy, D. 1990. Why fly? The possible benefits for lower mortality. Biol. J. Linn. Soc, 40,
53–65.
Revell, L. J. 2012. Phytools: an R package for phylogenetic comparative biology (and other things). Methods Ecol. Evol, 3, 217–223.
Reznick, D. A., Bryga, H., Endler, J. A. 1990. Experimentally induced life-history evolution in
a natural population. Nature, 346, 357-359. Reznick, D., Bryant, M. J., Bashey, F. 2002. R- and K-selection revisited: The role of
population regulation in life-history evolution. Ecology, 83, 1509–1520. Ricklefs, R. E. 2000. Intrinsic aging-related mortality in birds. J. Avian Biol, 31, 103–111.
Shattuck, M. R., Williams, S. A. 2010. Arboreality has allowed for the evolution of increased
longevity in mammals. Proc. Nat. Acad. Sci. U. S. A., 107, 4635–4639
13
Sillett, T. S. and Holmes, R. T. 2002. Variation in survivorship of a migratory songbird
throughout its annual cycle. J. Anim. Ecol, 71, 296–308.
Speakman, J. R. 2005. Body size, energy metabolism and lifespan. J. Exp. Biol, 208, 1717–
1730.
Stearns, S. C. 1983. The influence of size and phylogeny on patterns of covariation among
life-history traits in mammals. Oikos, 41, 173–187.
Stearns, S. C. 2000. Life history evolution: successes, limitations, and prospects.
Naturwissenschaften, 47, 476–486.
Varela, S. A. M., Danchin, É. and Wagner, R. H. 2007. Does predation select for or against
avian coloniality? A comparative analysis. Journal of Evolutionary Biology, 20, 1490–
1503.
Wasser, D. E., Sherman, P. W. 2010. Avian longevities and their interpretation under evolutionary theories of senescence. J Zool, 280, 103–155.
14
Table 1A. PGLS univariate analyses integrating 20 sampled phylogenies of both Hackett and Ericson phylogenies. Min. and max. values of the estimates, st.
error, factor and model sign., as well as the proportion of the significant variables among the 10 phylogenies for the different distributions is also given.
* These categories have been set to zero and have been used as baseline for comparison.
Factors N Estimates Est. error Pr(>|t|)
Proportion significant factors
Model p-value
Proportion significant models
Ericson Hackett Ericson Hackett
Foraging
Aerial* 444 0.0000 ― ―
High veg. 444 -0.0629/-0.0564 0.1342 / 0.1377 0.6117 / 0.7496 0% 0%
Ground 444 0.0095 / 0.0193 0.1370 / 0.1405 0.8476 / 0.9971 0% 0%
Generalists 444 0.0366 / 0.0419 0.1244 / 0.1285 0.6773 / 0.8165 0% 0%
Low veg. 444 -0.1158/-0.1127 0.1559 / 0.1596 0.4140 / 0.5424 0% 0% 0.4453 / 0.5556 0% 0%
Colonial behavior
Colonial* 553 0.0000 ― ―
Facultative 553 -0.1122/-0.1108 0.1211 / 0.1223 0.3239 / 0.3983 0% 0%
Loose colonies 553 -0.0720/-0.0712 0.1278 / 0.1292 0.5384 / 0.6450 0% 0%
Solitary 553 -0.0785/-0.0729 0.0996 / 0.1014 0.4044 / 0.5310 0% 0% 0.8520 / 0.9124 0% 0%
Coop. breeding
Non-cooperative* 547 0.0000 ― ―
Occasional 547 0.1559 / 0.246 0.0708 / 0.0716 0.0251 / 0.0362 100% 100%
Cooperative 547 0.1633 / 0.1742 0.0778 / 0.0787 0.0266 / 0.0418 100% 100% 0.0047 / 0.0078 100% 100%
Mating system
Monogamous* 436 0.0000 ― ―
Polygynyous 436 0.1098 / 0.1193 0.1129 / 0.1157 0.2710 / 0.3952 0% 0%
Monog/Polyg. 436 0.0649 / 0.0738 0.0842 / 0.0856 0.3548 / 0.4463 0% 0% 0.4203 / 0.6023 0% 0% Nest protection Dommed* 522 0.0000 ― ― Non-exavator 522 0.0058 / 0.0086 0.1206 / 0.1242 0.8588 / 0.9920 0% 0% Open 522 -0.1153/-0.1044 0.1111 / 0.1164 0.3025 / 0.3848 0% 0% 0.1832 / 0.3043 0% 0%

15
Table 1B. PGLS univariate analyses integrating 20 sampled phylogenies of both Hackett and Ericson phylogenies. Min. and max. values of the estimates, st. error, factor and model sign., as well as the proportion of the significant variables among the 10 phylogenies for the different distributions is also given.
* These categories have been set to zero and have been used as baseline for comparison.
Factors N Estimates Est. error Pr(>|t|) Proportion
significant factors
Model p-value
Proportion significant models
Ericson Hackett Ericson Hackett
Nest Site Canopy* 553 0.0000 ― ― Clift 553 0.0326 / 0.0385 0.1042 / 0.1069 0.6847 / 0.8008 0% 0% Ground 553 -0.2907/-0.2849 0.0784 / 0.0805 <0.001 / <0.001 100% 100% Shrub 553 -0.0135/-0.0051 0.0499 / 0.05036 0.7444 / 0.9459 0% 0% <0.001 / 0.0014 100% 100% Parental Care Biparental* 529 0.0000 ― ― Female only 529 -0.1428/-0.1282 0.1217 / 0.1233 0.2355 / 0.3052 0% 0% 0.2449 / 0.3495 0% 0% Insularity Island* 552 0.0000 ― ― Mainland 552 -0.0214/-0.0071 0.0848 / 0.0865 0.8037 / 0.9325 0% 0% 0.9400 / 0.9928 0% 0% Migration Migrant* 543 0.0000 ― ― Resident 543 0.0113 / 0.0229 0.0502 / 0.0508 0.6494 / 0.8237 0% 0% 0.8132 / 0.9515 0% 0%
Diet Carnivores* 520 0.0000 ― ― Herbivores 520 0.1242 / 0.1270 0.0739 / 0.0755 0.0602 / 0.1290 0% 0% Omnivores 0.1128 / 0.1162 0.0547 / 0.0556 0.0196 / 0.0570 50% 60% 0.0244 / 0.1005 0% 10% Biogeogr. Region Africa 552 -0.3007/-0.2575 0.4843 / 0.4953 0.5368 / 0.5999 0% 0% Australia 552 -0.2165/-0.1744 0.4823 / 0.4934 0.6560 / 0.7214 0% 0% Nearctic 552 -0.0316/0.00260 0.4749 / 0.4859 0.9472 / 0.9984 0% 0% Palearctic 552 -0.2557/-0.2274 0.4755 / 0.4868 0.5929 / 0.6373 0% 0% Indomalayan 552 -0.3341/-0.2876 0.4827 / 0.4939 0.4913 / 0.5569 0% 0% Neotropical 552 -0.1372/-0.1001 0.4776 / 0.4885 0.7751 / 0.8363 0% 0% Multiregion 552 -0.0293/-0.0008 0.4849 / 0.4955 0.9521 / 0.9987 0% 0% 0.0136 / 0.0366 0% 0% Body size (log) 552 0.1765 / 0.1874 0.0225 / 0.0287 <0.001 / <0.001 100% 100% <0.001 / <0.001 100% 100%
16
Table 2. Model selection based on AICw of lifespan evolution under different ecological and behavioral
factors.
BM1 BMS OU1 OUM
Coop breeding <0.001 <0.001 0.1226 0.8774
Nest Site <0.001 <0.001 0.0015 0.9985
Table 3. Model-averaged parameter estimates and their associated 2.5 and 97.5% quantiles of OUM models
selected for lifespan evolution under different intensities of cooperative breeding.
Table 4. Model-averaged parameter estimates and their associated 2.5 and 97.5% quantiles of OUM models
selected for lifespan evolution for different nesting behaviors.
Nest site. OUM Ground Shrub Canopy Cliff
θ 2.136 (2.134/2.139) 2.418 (2.417/2.419) 2.459 (2.458/2.460) 2.510 (2.506/2.514)
σ2 4.951 (4.789/5.086)
α 2.598 (2.495/2.668)
Coop br. OUM Non-cooperative Occasional Cooperative
θ 2.377 (2.376/2.379) 2.479 (2.471/2.484) 2.581 (2.576/2.585)
σ2 4.946 (4.395/5.382)
Α 2.696 (2.354/3.044)

17
Fig 1. Relative importance of each variable based on AICw of the model selection performed for 327
species of passerines.
Fig2. Sampled stochastic character map showing cooperative breeding behavior changes on an
Ericson phylogeny. Colored branches indicate cooperative breeding behaviors estimated in each
branch (blue = non-cooperative breeding; green = occasional cooperative breeding; red =
cooperative breeding).
0 0.2 0.4 0.6 0.8
1 1.2
Re
lati
ve im
po
rtan
ce
Ecological and behavioral factors
Relative importance of factors in model selection
Hackett
Ericson
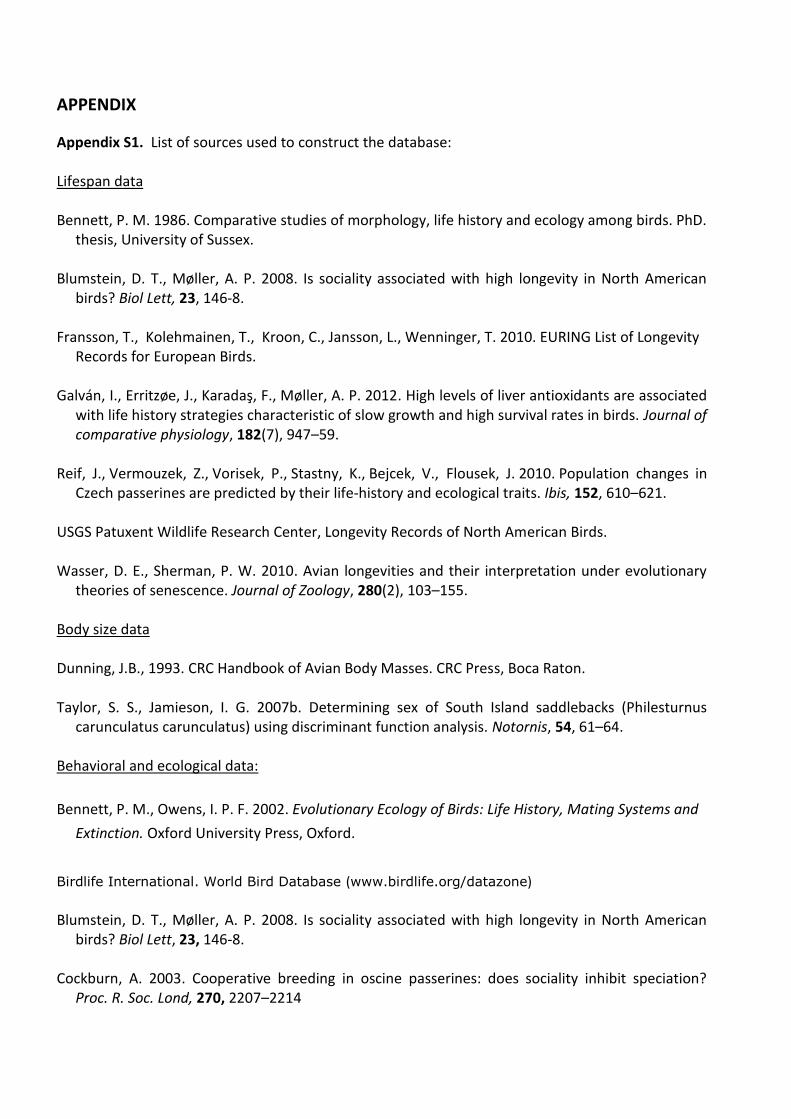
APPENDIX
Appendix S1. List of sources used to construct the database: Lifespan data Bennett, P. M. 1986. Comparative studies of morphology, life history and ecology among birds. PhD.
thesis, University of Sussex. Blumstein, D. T., Møller, A. P. 2008. Is sociality associated with high longevity in North American
birds? Biol Lett, 23, 146-8. Fransson, T., Kolehmainen, T., Kroon, C., Jansson, L., Wenninger, T. 2010. EURING List of Longevity
Records for European Birds. Galván, I., Erritzøe, J., Karadaş, F., Møller, A. P. 2012. High levels of liver antioxidants are associated
with life history strategies characteristic of slow growth and high survival rates in birds. Journal of comparative physiology, 182(7), 947–59.
Reif, J., Vermouzek, Z., Vorisek, P., Stastny, K., Bejcek, V., Flousek, J. 2010. Population changes in
Czech passerines are predicted by their life-history and ecological traits. Ibis, 152, 610–621. USGS Patuxent Wildlife Research Center, Longevity Records of North American Birds. Wasser, D. E., Sherman, P. W. 2010. Avian longevities and their interpretation under evolutionary
theories of senescence. Journal of Zoology, 280(2), 103–155. Body size data Dunning, J.B., 1993. CRC Handbook of Avian Body Masses. CRC Press, Boca Raton. Taylor, S. S., Jamieson, I. G. 2007b. Determining sex of South Island saddlebacks (Philesturnus
carunculatus carunculatus) using discriminant function analysis. Notornis, 54, 61–64. Behavioral and ecological data:
Bennett, P. M., Owens, I. P. F. 2002. Evolutionary Ecology of Birds: Life History, Mating Systems and
Extinction. Oxford University Press, Oxford.
Birdlife International. World Bird Database (www.birdlife.org/datazone) Blumstein, D. T., Møller, A. P. 2008. Is sociality associated with high longevity in North American
birds? Biol Lett, 23, 146-8. Cockburn, A. 2003. Cooperative breeding in oscine passerines: does sociality inhibit speciation?
Proc. R. Soc. Lond, 270, 2207–2214

Cockburn, A. 2006. Prevalence of different modes of parental care in birds. Proc. R. Soc. Lond., B:
Biol. Sci, 273, 1375–1383. Covas, R. 2011. Evolution of reproductive life histories in island birds worldwide. Proc. R. Soc. Lond.,
B: Biol. Sci,, 279(1733), 1531–1537. Del Hoyo, J., Elliot, A. and Christie, D.A. (eds.) 2003. Handbook of the birds of the world. Barcelona:
Lynx Edicions. Fonderflick, J., Besnard, A., and Martin, J.L. 2013. Species traits and the response of open-habitat
species to forest edge in landscape mosaics. Oikos, 122(1), 42–51. Galván, I., Erritzøe, J., Karadaş, F., Møller, A. P. 2012. High levels of liver antioxidants are associated
with life history strategies characteristic of slow growth and high survival rates in birds. Journal of comparative physiology, 182(7), 947–59.
Lind, J., Danz, N., Jones, M. T., Hanowski, J. M., and Niemi, G. J. 2001. 2000 annual update report:
Breeding bird monitoring in Great Lakes National Forests: 1991-2000. NRRI/TR – 2001/04 McNab, B. K. 2009. Ecological factors affect the level and scaling of avian BMR. Comparative
biochemistry and physiology. Part A, Molecular & integrative physiology, 152(1), 22–45. Meiri, S., Dayan, T., and Aviv, T. 2003. On the validity of Bergmann’s rule, Journal of Biogeography,
30, 331-351. Pereira, H. M., Daily, G. C. and Roughgarden, J. 2004. A framework for assessing the relative
vulnerability of species to land-use change. Ecological Applications, 14, 730-742. Reif, J., Vermouzek, Z., Vorisek, P., Stastny, K., Bejcek, V., Flousek, J. 2010. Population changes in
Czech passerines are predicted by their life-history and ecological traits. Ibis, 152, 610–621. Remeš V., Matysioková B. and Cockburn A. 2012. Nest predation in New Zealand songbirds: exotic
predators, introduced prey and long-term changes in predation risk. Biol. Conserv, 148: 54–60. Remeš, V., Matysioková, B. and Cockburn A. 2012. Long-term and large-scale analyses of nest
predation patterns in Australian songbirds and a global comparison of nest predation rates. J. Avian Biol, 43: 435–444.
Shultz, S., and Dunbar, R. I. M. 2010. Social bonds in birds are associated with brain size and
contingent on the correlated evolution of life-history and increased parental investment. Biological Journal of the Linnean Society, 100(1), 111–123.
Sibly, R. M., Witt, C. C., Wright, N. , Venditti, C., Jetz, W., and Brown, J. H. 2012. Energetics, lifestyle,
and reproduction in birds. Proceedings of the National Academy of Sciences of the United States of America, 109(27), 10937–41.

Appendix S2. Model selection based on AICc values to find the best model defining the relation between lifespan and ecological and behavioral factors (N=327).
model (Intercept) Biogeogr. Colonial
beh Coop. Breed.
Diet Foraging Insularity log_bodySize Migration Mat. Syst.
Nest prot.
Nest site P.care AICc delta weight
78 1.6486 +
+ +
0.1689
401.0610 0 0.0875
1102 1.6093 +
+ +
0.1687
+
402.3779 1.3168 0.0453
110 1.5880 +
+ +
+ 0.1692
402.9342 1.8731 0.0343
206 1.6682 +
+ +
0.1711 +
402.9542 1.8932 0.0340
74 1.6640 +
+
0.1725
403.0157 1.9547 0.0329
80 1.6143 + + + +
0.1718
403.2037 2.1427 0.0300
2126 1.6473 +
+ +
0.1684
+ 403.2183 2.1573 0.0298
1230 1.6411 +
+ +
0.1717 +
+
403.9473 2.8862 0.0207
1104 1.5905 + + + +
0.1680
+
404.1387 3.0777 0.0188
1134 1.5445 +
+ +
+ 0.1689
+
404.2434 3.1824 0.0178
3150 1.6079 +
+ +
0.1681
+ + 404.5744 3.5134 0.0151
590 1.6839 +
+ +
0.1728
+
404.6021 3.5411 0.0149
208 1.6457 + + + +
0.1752 +
404.7601 3.6991 0.0138
1098 1.6292 +
+
0.1722
+
404.7619 3.7008 0.0138
112 1.5220 + + + +
+ 0.1725
404.8469 3.7859 0.0132
106 1.6049 +
+
+ 0.1730
404.8834 3.8224 0.0129
238 1.6130 +
+ +
+ 0.1710 +
404.9232 3.8622 0.0127
202 1.6751 +
+
0.1740 +
405.0635 4.0025 0.0118
334 1.6527 +
+ +
0.1726
+
405.0665 4.0055 0.0118
1232 1.6377 + + + +
0.1721 +
+
405.0829 4.0219 0.0117
2158 1.5873 +
+ +
+ 0.1687
+ 405.1089 4.0479 0.0116
2254 1.6668 +
+ +
0.1705 +
+ 405.1209 4.0599 0.0115
2122 1.6660 +
+
0.1732
+ 405.1290 4.0680 0.0114
70 1.6900 +
+
0.1886
405.1426 4.0816 0.0114
2128 1.6111 + + + +
0.1709
+ 405.3682 4.3072 0.0102

Appendix S3. Number and types of transitions for each phylogenetic tree between the different cooperative breeding (a) and nest site strategies (b) for Hackett and Ericson phylogenies, resulting from 300 stochastic character maps for each factor and phylogeny. In cooperative breeding behavior no= non-cooperative breeding.
Appendix S4. Code used for the different analyses.
#CODE (PGLS, STOCHASTIC CHARACTER MAPING & OUwie)
#1.PGLS###
setwd("C:/Users/Mar/Desktop/LifespanTOT")
library(ape)
library(caper)
library(MuMIn)
#PGLS with 1 phylogenetic tree:
tree<-read.nexus("TotesBS.214.Ericson.tre") #100 phylogenies
PGLSpasser<-read.csv("PGLS.N552.csv",sep=";")
attach(PGLSpasser)
Num <- row.names(PGLSpasser)
dades <- cbind(Num, PGLSpasser)
passeriformes <- comparative.data(phy=tree[[16]],data=dades,names.col=SpeciesPhylo,vcv=TRUE,
na.omit = F, warn.dropped = TRUE, vcv.dim=3)
model<-pgls(log(lifespanMax)~log_bodySize+DietGroup+F2+C1+CB1+NP2+NS2+MS2+PC1+Insularity
+Migration+Biogeography,data=passeriformes,lambda="ML")
#Model Selection and relative importance calculations:

model.selection<-dredge(pgls(log(lifespanMax)~
log_bodySize+DietGroup+F2+C1+CB1+NP2+NS2+MS2+PC1+Insularity+Migration+Biogeography
,data=passeriformes,lambda="ML"))
imp.modSel <- importance(model.selection)
#2.STOCHASTIC CHARACTER MAPPING##
setwd("C:/Users/Mar/Desktop/LifespanTOT/StochCharMap")
library(phytools)
library(OUwie)
trees100<-read.nexus("CB1.N547.Ericson.tre")#100 phylogenies
tree_sample <- sample(trees100,5) # 5 phylogenies
passer<-read.csv("CB1.N547.csv",sep=";")
dades <- data.frame(passer[,2:3])
rownames(dades) <- passer[,1]
attach(dades)
names(CB1) <- rownames(dades)
names(log_lifespanMax) <- rownames(dades)
# 10 simulations for 5 phylogenies:
CB1Simmap50<-make.simmap(tree_sample,CB1,model="ER",nsim=10,message=FALSE)
CB1_colors <-c("blue", "green", "red"); names(CB1_colors)<-c("1","2","3")
plotSimmap(CB1Simmap50[[1]], CB1_colors, pts=FALSE, lwd=5)
# Calculation of transitions:
describeCB1 <- describe.simmap(CB1Simmap50)
#3.EVOLUTIONARY MODELS##
setwd("C:/Users/Mar/Desktop/LifespanTOT/StochCharMap")
library(phytools)
library(OUwie)
trees<-read.simmap("CB1Simmap50.trees",format="phylip")
tree_sample <- sample(trees,10) # sample with 5 phylogenetic trees
CB1<-read.csv("CB1.N547.csv",sep=";")

#OUwie models with one phylogeny:
BM1Output = OUwie(trees[[1]], CB1, model = "BM1", simmap.tree = TRUE)
BMSOutput = OUwie(trees[[1]], CB1, model = "BMS", simmap.tree = TRUE)
OU1Output = OUwie(trees[[2]], CB1, model = "OU1", simmap.tree = TRUE)
OUMVOutput = OUwie(trees[[1]], CB1, model = "OUMV", simmap.tree = TRUE)
OUMAOutput = OUwie(trees[[1]], CB1, model = "OUMA", simmap.tree = TRUE)
OUMVAOutput = OUwie(trees[[1]], CB1, model = "OUMVA", simmap.tree = TRUE)
#MultiOUwie with several phylogenies:
require (OUwie)
multiOUwie <- function(phy, data, model, nregimes, simmap.trees){
if(model=="BMS"){
num.cols <- (nregimes*2) + (nregimes+1)
}else{
num.cols <- (nregimes*3)
}
#res<-matrix(,nrow=length(phy),ncol=3+num.cols)
res<-matrix(,nrow=length(phy),ncol=7+num.cols)
for(i in 1:length(phy)){
print(i)
tmp<-OUwie(phy[[i]], data, model=model, simmap.tree=TRUE)
rownames(tmp$theta)<-colnames(tmp$solution)
res[i,] <- c(i, tmp$eigval[1:4], tmp$loglik, tmp$AICc,
tmp$solution[1,order(colnames(tmp$solution))], tmp$solution[2,order(colnames(tmp$solution))],
tmp$theta[order(rownames(tmp$theta)),1])
}
return(res)
}
Multi.OUM <- multiOUwie(phy=tree_sample, data=CB1, model=c("OUM"), nregimes=3,
simmap.trees=TRUE)


