

Economic Activity Index (“GDB-EAI”)
January and February 2016

Special Comment – March 2016 Benchmark Revision of Payroll Employment
Every March the BLS publishes the benchmark revision of the payroll employment. Each revision
changes the employment figures for the previous 21 months.
The revision released in March 2015 decreased the 2014 average level of payroll employment by 17,333
employees with respect to the previous employment estimates published until December 2014.
Moreover, the revision released in March 2016 decreased the 2015 level of payroll
employment by 9,017 jobs with respect to the estimates released until December
2015.
2
In March 2016 the benchmark revision of the payroll employment data for 2015
showed a considerable downward adjustment.
Calendar
Year
Average Total Payroll
Employment
(Previous)
Average Total Payroll
Employment
(Revised)
Change in the Number of
Employees
2005 1,019,871 1,043,822 23,951
2006 1,041,574 1,042,833 1,259
2007 1,027,833 1,028,767 934
2008 1,004,635 1,009,975 5,340
2009 967,642 961,133 (6,509)
2010 929,683 926,842 (2,841)
2011 918,550 922,617 4,067
2012 916,800 935,233 18,433
2013 904,575 925,850 21,275
2014 924,833 907,500 (17,333)
2015 908,975 899,958 (9,017)
Special Comment – March 2016 Benchmark Revision of Payroll Employment (2)
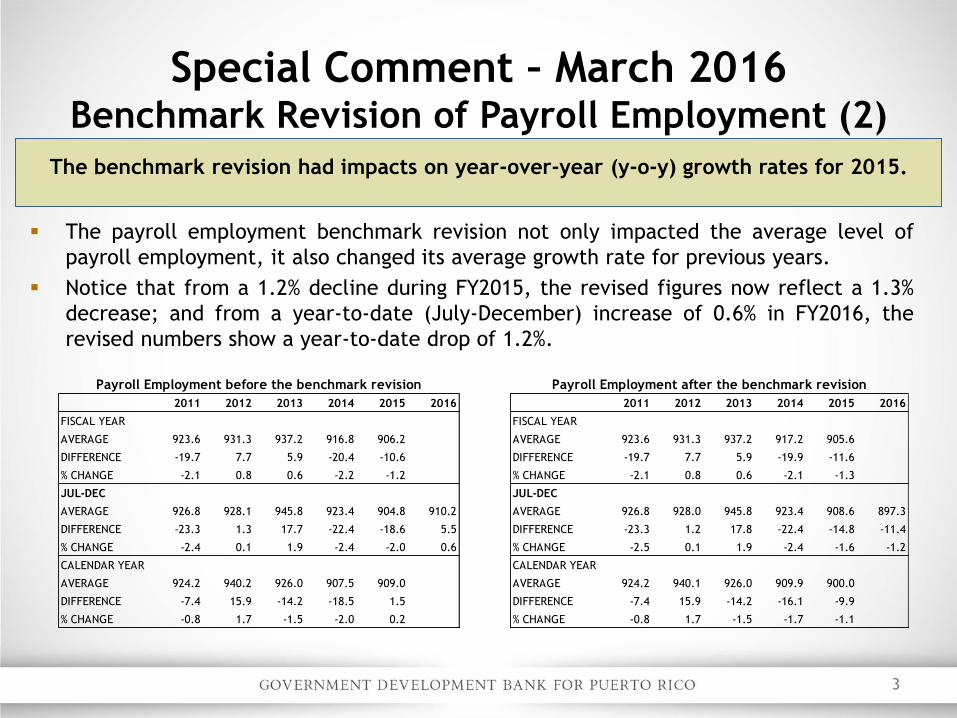
The payroll employment benchmark revision not only impacted the average level of
payroll employment, it also changed its average growth rate for previous years.
Notice that from a 1.2% decline during FY2015, the revised figures now reflect a 1.3%
decrease; and from a year-to-date (July-December) increase of 0.6% in FY2016, the
revised numbers show a year-to-date drop of 1.2%.
3
The benchmark revision had impacts on year-over-year (y-o-y) growth rates for 2015.
2011 2012 2013 2014 2015 2016 2011 2012 2013 2014 2015 2016
FISCAL YEAR FISCAL YEAR
AVERAGE 923.6 931.3 937.2 916.8 906.2 AVERAGE 923.6 931.3 937.2 917.2 905.6
DIFFERENCE -19.7 7.7 5.9 -20.4 -10.6 DIFFERENCE -19.7 7.7 5.9 -19.9 -11.6
% CHANGE -2.1 0.8 0.6 -2.2 -1.2 % CHANGE -2.1 0.8 0.6 -2.1 -1.3
JUL-DEC JUL-DEC
AVERAGE 926.8 928.1 945.8 923.4 904.8 910.2 AVERAGE 926.8 928.0 945.8 923.4 908.6 897.3
DIFFERENCE -23.3 1.3 17.7 -22.4 -18.6 5.5 DIFFERENCE -23.3 1.2 17.8 -22.4 -14.8 -11.4
% CHANGE -2.4 0.1 1.9 -2.4 -2.0 0.6 % CHANGE -2.5 0.1 1.9 -2.4 -1.6 -1.2
CALENDAR YEAR CALENDAR YEAR
AVERAGE 924.2 940.2 926.0 907.5 909.0 AVERAGE 924.2 940.1 926.0 909.9 900.0
DIFFERENCE -7.4 15.9 -14.2 -18.5 1.5 DIFFERENCE -7.4 15.9 -14.2 -16.1 -9.9
% CHANGE -0.8 1.7 -1.5 -2.0 0.2 % CHANGE -0.8 1.7 -1.5 -1.7 -1.1
Payroll Employment before the benchmark revision Payroll Employment after the benchmark revision

Special Comment – March 2016 Benchmark Revision of Payroll Employment (3)
4
Below are the impacts of the benchmark revision on payroll employment. The revision
changed the average payroll employment growth of 2015 from 0.2% to -1.1%
Before the benchmark revision After the benchmark revision
Total Non-Farm Payroll Employment
-6
-4
-2
0
2
4
6
700
800
900
1,000
1,100
'95 '97 '99 '01 '03 '05 '07 '09 '11 '13 15
% C
hange
Thousa
nds
Fiscal Years
Total Payroll Employment % Change
Total Non-Farm Payroll Employment
-6
-4
-2
0
2
4
6
700
800
900
1,000
1,100
'95 '97 '99 '01 '03 '05 '07 '09 '11 '13 15
% C
hange
Thousa
nds
Fiscal Years
Total Payroll Employment % Change
Total Non-Farm Payroll Employment
-4
-3
-2
-1
0
1
2
800
840
880
920
960
1,000
Y-O
-Y %
Ch.
Thousa
nds
Months
Total Payroll Employment Y-O-Y % Ch.
Total Non-Farm Payroll Employment
-4
-3
-2
-1
0
1
2
800
840
880
920
960
1,000
Y-O
-Y %
Ch.
Thousa
nds
Months
Total Payroll Employment Y-O-Y % Ch.
Special Comment – March 2016 Benchmark Revision of Payroll Employment (4)
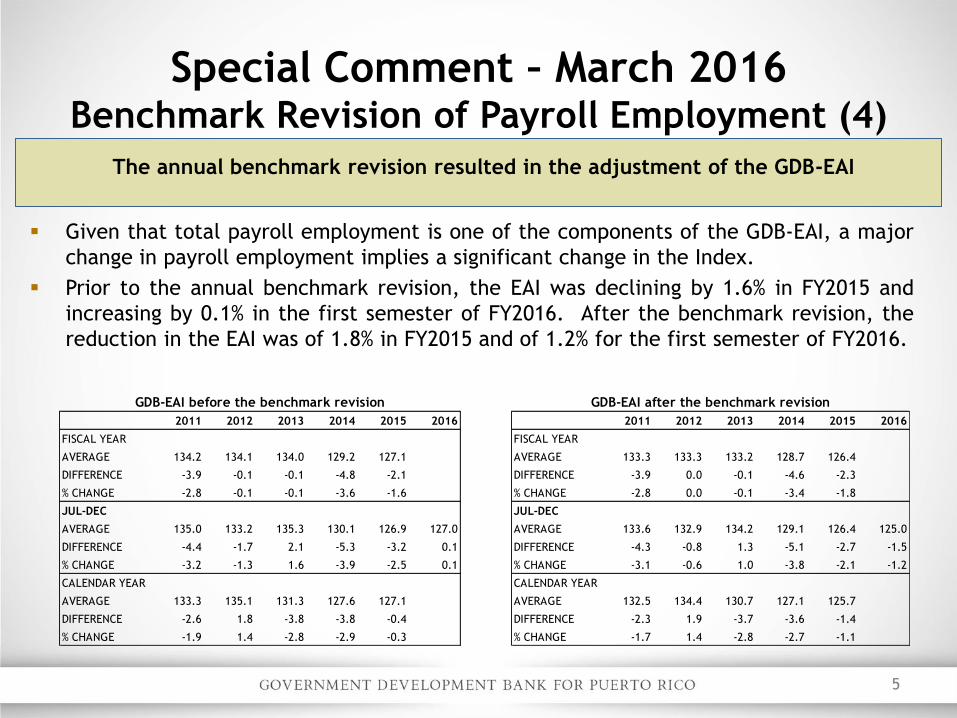
Given that total payroll employment is one of the components of the GDB-EAI, a major
change in payroll employment implies a significant change in the Index.
Prior to the annual benchmark revision, the EAI was declining by 1.6% in FY2015 and
increasing by 0.1% in the first semester of FY2016. After the benchmark revision, the
reduction in the EAI was of 1.8% in FY2015 and of 1.2% for the first semester of FY2016.
5
The annual benchmark revision resulted in the adjustment of the GDB-EAI
2011 2012 2013 2014 2015 2016 2011 2012 2013 2014 2015 2016
FISCAL YEAR FISCAL YEAR
AVERAGE 134.2 134.1 134.0 129.2 127.1 AVERAGE 133.3 133.3 133.2 128.7 126.4
DIFFERENCE -3.9 -0.1 -0.1 -4.8 -2.1 DIFFERENCE -3.9 0.0 -0.1 -4.6 -2.3
% CHANGE -2.8 -0.1 -0.1 -3.6 -1.6 % CHANGE -2.8 0.0 -0.1 -3.4 -1.8
JUL-DEC JUL-DEC
AVERAGE 135.0 133.2 135.3 130.1 126.9 127.0 AVERAGE 133.6 132.9 134.2 129.1 126.4 125.0
DIFFERENCE -4.4 -1.7 2.1 -5.3 -3.2 0.1 DIFFERENCE -4.3 -0.8 1.3 -5.1 -2.7 -1.5
% CHANGE -3.2 -1.3 1.6 -3.9 -2.5 0.1 % CHANGE -3.1 -0.6 1.0 -3.8 -2.1 -1.2
CALENDAR YEAR CALENDAR YEAR
AVERAGE 133.3 135.1 131.3 127.6 127.1 AVERAGE 132.5 134.4 130.7 127.1 125.7
DIFFERENCE -2.6 1.8 -3.8 -3.8 -0.4 DIFFERENCE -2.3 1.9 -3.7 -3.6 -1.4
% CHANGE -1.9 1.4 -2.8 -2.9 -0.3 % CHANGE -1.7 1.4 -2.8 -2.7 -1.1
GDB-EAI before the benchmark revision GDB-EAI after the benchmark revision

Special Comment – March 2016 Benchmark Revision of Payroll Employment (5)
6
Below are the changes of the benchmark revision on the GDB-EAI. This revision changed
the GDB-EAI growth of 2015 from -0.3% to -1.1%
Before the benchmark revision After the benchmark revision
GDB Economic Activity Index
-6
-4
-2
0
2
4
6
120
122
124
126
128
130
Y-O
-Y %
Ch.
Index ‘
80=100
Months
Index Y-O-Y % Ch.
GDB Economic Activity Index
-10
-8
-6
-4
-2
0
2
4
6
8
10
115
120
125
130
135
140
145
150
155
160
% C
hange
Index ‘
80=100
Fiscal Years
Index % Change
GDB Economic Activity Index
-6
-4
-2
0
2
4
6
120
122
124
126
128
130
Y-O
-Y %
Ch.
Index ‘
80=100
Months
Index Y-O-Y % Ch.
GDB Economic Activity Index
-10
-8
-6
-4
-2
0
2
4
6
8
10
115
120
125
130
135
140
145
150
155
160
% C
hange
Index ‘
80=100
Fiscal Years
Index % Change

7
Special Comment – March 2016 Benchmark Revision of Payroll Employment (6)
The benchmark revision implies year-over-year reductions of larger magnitudes.
-5
-4
-3
-2
-1
0
1
2
3
100
105
110
115
120
125
130
135
140
Jan-1
2
Feb-1
2
Mar-
12
Apr-
12
May-1
2
Jun-1
2
Jul-
12
Aug-1
2
Sep-1
2
Oct-
12
Nov-1
2
Dec-1
2
Jan-1
3
Feb-1
3
Mar-
13
Apr-
13
May-1
3
Jun-1
3
Jul-
13
Aug-1
3
Sep-1
3
Oct-
13
Nov-1
3
Dec-1
3
Jan-1
4
Feb-1
4
Mar-
14
Apr-
14
May-1
4
Jun-1
4
Jul-
14
Aug-1
4
Sep-1
4
Oct-
14
Nov-1
4
Dec-1
4
Jan-1
5
Feb-1
5
Mar-
15
Apr-
15
May-1
5
Jun-1
5
Jul-
15
Aug-1
5
Sep-1
5
Oct-
15
Nov-1
5
Dec-1
5
Jan-1
6
Feb-1
6
Perc
ent
Change
Index
(January
1980=100)
GDB Economic Activity Index(Before and After the Payroll Benchmark Revision of March 2016)
GDB-EAI before GDB-EAI after Y-O-Y %C EAI before Y-O-Y %C EAI after

When it is annualized, the level of the EAI is highly correlated with the level of real
GNP (with a Pearson correlation coefficient of 0.9824, for FY1981-FY2014).
Annual growth rates of both variables are also highly correlated (with a Pearson
correlation coefficient of 0.9489, for FY1982-FY2014).
Nevertheless, the annual growth rate of the EAI IS NOT the same as the annual growth
rate of real GNP. Being highly correlated does not mean being equal.
In order to approximate real GNP growth from EAI annual growth, we estimate a linear
regression model relating both variables.
Plugging in EAI annual growth rates into the resulting equation, we obtain estimates for
the annual growth rates of real GNP, which approximate real GNP annual growth figures
published by the Planning Board.
8
The GDB-EAI is an indicator of general economic activity, not a direct measurement of
real GNP. The annual growth rate of the EAI is not the same as the annual growth rate of
real GNP.
About the interpretation of the GDB-EAI
About the interpretation of the GDB-EAI (2)
9
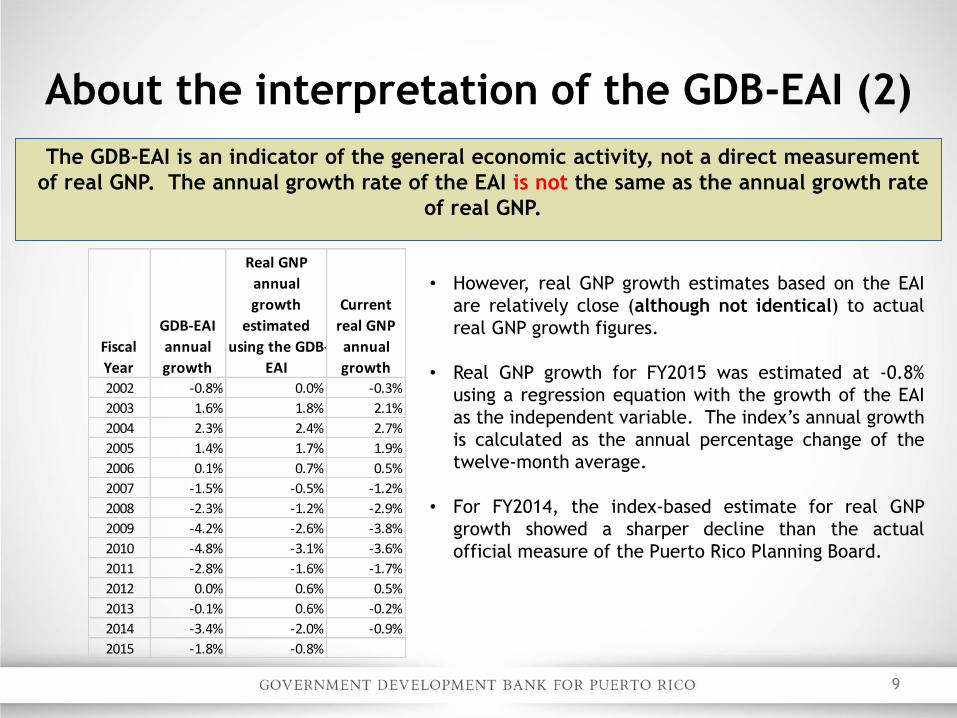
The GDB-EAI is an indicator of the general economic activity, not a direct measurement
of real GNP. The annual growth rate of the EAI is not the same as the annual growth rate
of real GNP.
• However, real GNP growth estimates based on the EAI
are relatively close (although not identical) to actual
real GNP growth figures.
• Real GNP growth for FY2015 was estimated at -0.8%
using a regression equation with the growth of the EAI
as the independent variable. The index’s annual growth
is calculated as the annual percentage change of the
twelve-month average.
• For FY2014, the index-based estimate for real GNP
growth showed a sharper decline than the actual
official measure of the Puerto Rico Planning Board.
Fiscal
Year
GDB-EAI
annual
growth
Real GNP
annual
growth
estimated
using the GDB-
EAI
Current
real GNP
annual
growth
2002 -0.8% 0.0% -0.3%
2003 1.6% 1.8% 2.1%
2004 2.3% 2.4% 2.7%
2005 1.4% 1.7% 1.9%
2006 0.1% 0.7% 0.5%
2007 -1.5% -0.5% -1.2%
2008 -2.3% -1.2% -2.9%
2009 -4.2% -2.6% -3.8%
2010 -4.8% -3.1% -3.6%
2011 -2.8% -1.6% -1.7%
2012 0.0% 0.6% 0.5%
2013 -0.1% 0.6% -0.2%
2014 -3.4% -2.0% -0.9%
2015 -1.8% -0.8%

10
The graph compares actual real GNP growth rates with projected real GNP growth rates
based on the GDB-EAI.
3.0%
1.5%
-0.3%
2.1%
2.7%
1.9%
0.5%
-1.2%
-2.9%
-3.8%-3.6%
-1.7%
0.5%
-0.2%
-0.9%
2.0%
1.2% 0.0%
1.8%
2.4%
1.7%0.7%
-0.5%-1.2%
-2.6%-3.1%
-1.6%
0.6%0.6%
-2.0%
-0.8%
-5%
-4%
-3%
-2%
-1%
0%
1%
2%
3%
4%
2000 2001 2002 2003 2004 2005 2006 2007 2008 2009 2010 2011 2012 2013 2014 2015
Pe
rce
nt
chan
ge(y
-oy)
Annual Growth Rate Comparisons:Real GNP, and real GNP estimated with the GDB-EAI
Real GNP annual growth rate Real GNP annual growth rate estimated with the GDB-EAI
Real GNP data source: Puerto Rico Planning Board
About the interpretation of the GDB-EAI (3)
Overview – January 2016
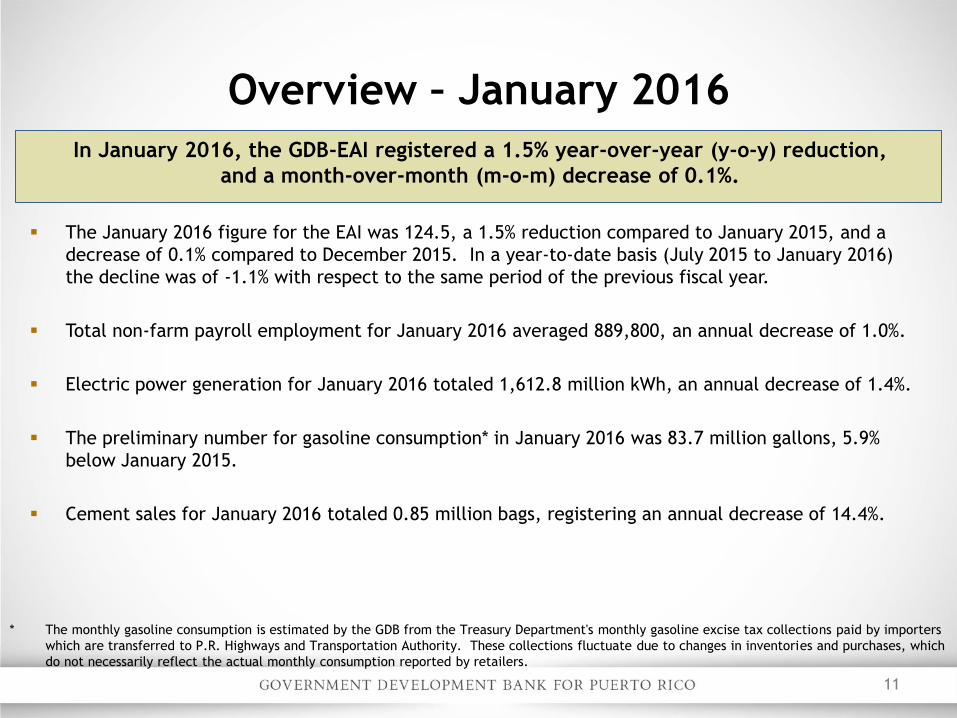
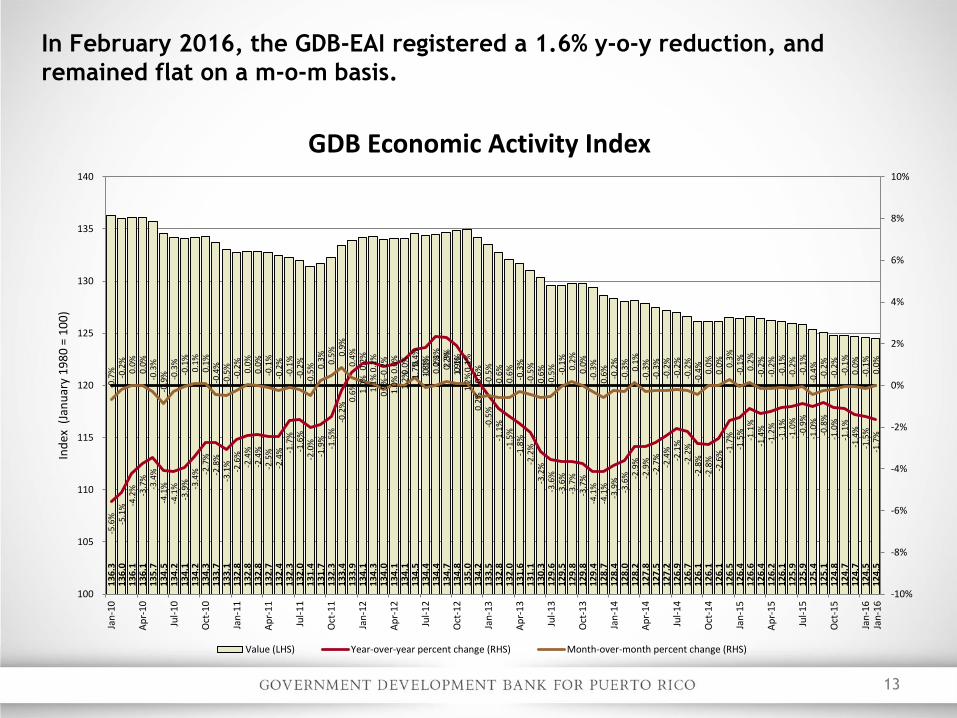
The January 2016 figure for the EAI was 124.5, a 1.5% reduction compared to January 2015, and a
decrease of 0.1% compared to December 2015. In a year-to-date basis (July 2015 to January 2016)
the decline was of -1.1% with respect to the same period of the previous fiscal year.
Total non-farm payroll employment for January 2016 averaged 889,800, an annual decrease of 1.0%.
Electric power generation for January 2016 totaled 1,612.8 million kWh, an annual decrease of 1.4%.
The preliminary number for gasoline consumption* in January 2016 was 83.7 million gallons, 5.9%
below January 2015.
Cement sales for January 2016 totaled 0.85 million bags, registering an annual decrease of 14.4%.
11
In January 2016, the GDB-EAI registered a 1.5% year-over-year (y-o-y) reduction,
and a month-over-month (m-o-m) decrease of 0.1%.
* The monthly gasoline consumption is estimated by the GDB from the Treasury Department's monthly gasoline excise tax collections paid by importers
which are transferred to P.R. Highways and Transportation Authority. These collections fluctuate due to changes in inventories and purchases, which
do not necessarily reflect the actual monthly consumption reported by retailers.

The February 2016 figure for the EAI was 124.5, a 1.6% reduction compared to February 2015, and
remained flat compared to January 2016. In a year-to-date basis (July 2015 to February 2016) the
decline was of -1.2% with respect to the same period of the previous fiscal year.
Total non-farm payroll employment for February 2016 averaged 891,900, an annual decrease of
1.1%.
Electric power generation for February 2016 totaled 1,561.6 million kWh, an annual increase of
2.6%.
The preliminary number for gasoline consumption* in February 2016 was 88.0 million gallons, 1.2%
above February 2015.
Cement sales for February 2016 totaled 1.06 million bags, registering an annual decrease of 4.3%.
12
In February 2016, the GDB-EAI registered a 1.6% y-o-y reduction,
and no change in a m-o-m basis.
* The monthly gasoline consumption is estimated by the GDB from the Treasury Department's monthly gasoline excise tax collections paid by importers
which are transferred to P.R. Highways and Transportation Authority. These collections fluctuate due to changes in inventories and purchases, which
do not necessarily reflect the actual monthly consumption reported by retailers.
Overview – February 2016
13
In February 2016, the GDB-EAI registered a 1.6% y-o-y reduction, and
remained flat on a m-o-m basis.
13
6.3
13
6.0
13
6.1
13
6.1
13
5.7
13
4.5
13
4.2
13
4.1
13
4.2
13
4.3
13
3.7
13
3.1
13
2.8
13
2.8
13
2.8
13
2.7
13
2.4
13
2.3
13
2.0
13
1.4
13
1.7
13
2.3
13
3.4
13
3.9
13
4.1
13
4.3
13
4.0
13
4.1
13
4.1
13
4.5
13
4.4
13
4.4
13
4.7
13
4.8
13
5.0
13
4.2
13
3.5
13
2.8
13
2.0
13
1.6
13
1.1
13
0.3
12
9.6
12
9.5
12
9.8
12
9.8
12
9.4
12
8.7
12
8.4
12
8.0
12
8.2
12
7.8
12
7.5
12
7.2
12
6.9
12
6.7
12
6.1
12
6.1
12
6.1
12
6.5
12
6.4
12
6.6
12
6.4
12
6.2
12
6.1
12
5.9
12
5.9
12
5.4
12
5.1
12
4.8
12
4.7
12
4.7
12
4.5
12
4.5
-5.6
%-5
.1% -4
.2% -3.7
%-3
.4%
-4.1
%-4
.1%
-3.9
% -3.4
% -2.7
%-2
.8%
-3.1
%-2
.6%
-2.4
%-2
.4%
-2.5
%-2
.4% -1
.7%
-1.6
%-2
.0%
-1.9
%-1
.5%
-0.2
%0.
6% 1.0%
1.1%
0.9% 1.0% 1.
2% 1.7%
1.8% 2.
3%2.
3%1.
9%1.
2%0.
2%-0
.5%
-1.1
%-1
.5%
-1.8
%-2
.2%
-3.2
%-3
.6%
-3.6
%-3
.7%
-3.7
%-4
.1%
-4.1
%-3
.9%
-3.6
% -2.9
%-2
.9%
-2.7
%-2
.4%
-2.1
%-2
.2%
-2.8
%-2
.8%
-2.6
% -1.7
%-1
.5%
-1.1
%-1
.4%
-1.2
%-1
.1%
-1.0
%-0
.9%
-1.0
%-0
.8%
-1.0
%-1
.1%
-1.4
%-1
.5%
-1.7
%
-0.7
% -0.2
%0.
0%0.
0%-0
.3%
-0.9
% -0.3
%-0
.1%
0.1
%0.
1%-0
.4%
-0.5
%-0
.2%
0.0%
0.0%
-0.1
%-0
.2%
-0.1
%-0
.2%
-0.5
% 0.3% 0.
5% 0.9%
0.4%
0.2%
0.1
%-0
.2%
0.0%
0.0% 0.
4%-0
.1%
0.0% 0.2%
0.1%
0.1%
-0.6
%-0
.5%
-0.6
%-0
.6%
-0.3
%-0
.5%
-0.6
%-0
.5% -0.1
%0.
2%0.
0%-0
.3%
-0.6
%-0
.2%
-0.3
%0.
1%-0
.3%
-0.3
%-0
.2%
-0.2
%-0
.2%
-0.4
%0.
0%0.
0% 0.3%
-0.1
%0.
2%-0
.2%
-0.2
%-0
.1%
-0.2
%-0
.1%
-0.4
%-0
.2%
-0.2
%-0
.1%
0.0%
-0.1
%0.
0%
-10%
-8%
-6%
-4%
-2%
0%
2%
4%
6%
8%
10%
100
105
110
115
120
125
130
135
140
Jan
-10
Ap
r-1
0
Jul-
10
Oct
-10
Jan
-11
Ap
r-1
1
Jul-
11
Oct
-11
Jan
-12
Ap
r-1
2
Jul-
12
Oct
-12
Jan
-13
Ap
r-1
3
Jul-
13
Oct
-13
Jan
-14
Ap
r-1
4
Jul-
14
Oct
-14
Jan
-15
Ap
r-1
5
Jul-
15
Oct
-15
Jan
-16
Ind
ex(J
anu
ary
19
80
= 1
00
)
GDB Economic Activity Index
Value (LHS) Year-over-year percent change (RHS) Month-over-month percent change (RHS)
Jan
-16
14
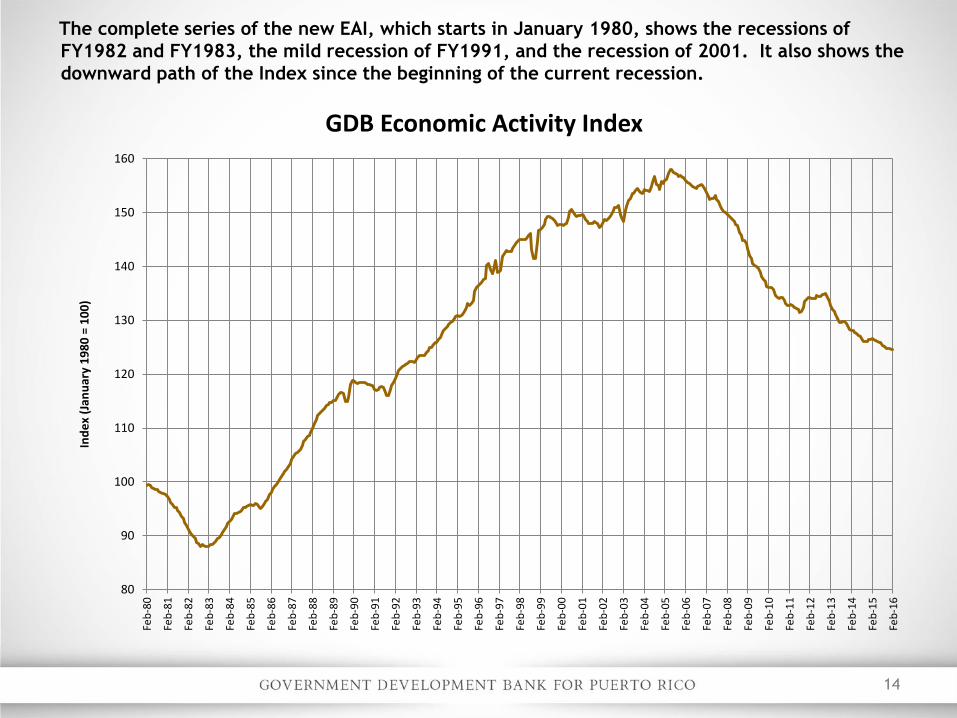
The complete series of the new EAI, which starts in January 1980, shows the recessions of
FY1982 and FY1983, the mild recession of FY1991, and the recession of 2001. It also shows the
downward path of the Index since the beginning of the current recession.
80
90
100
110
120
130
140
150
160Fe
b-8
0
Feb
-81
Feb
-82
Feb
-83
Feb
-84
Feb
-85
Feb
-86
Feb
-87
Feb
-88
Feb
-89
Feb
-90
Feb
-91
Feb
-92
Feb
-93
Feb
-94
Feb
-95
Feb
-96
Feb
-97
Feb
-98
Feb
-99
Feb
-00
Feb
-01
Feb
-02
Feb
-03
Feb
-04
Feb
-05
Feb
-06
Feb
-07
Feb
-08
Feb
-09
Feb
-10
Feb
-11
Feb
-12
Feb
-13
Feb
-14
Feb
-15
Feb
-16
Ind
ex
(Jan
uar
y1
98
0 =
10
0)
GDB Economic Activity Index

15
GDB Economic Activity Index: Data for the past decadePUERTO RICO ECONOMIC INDICATORS GOVERNMENT DEVELOPMENT BANK
GDB Economic Activity Index ECONOMIC ANALYSIS DIVISION
(January 1980 = 100)
FISCAL YEAR * 2007 2008 2009 2010 2011 2012 2013 2014 2015 2016
JULY 154.6 153.1 147.8 139.9 134.2 132.0 134.4 129.6 126.9 125.9
AUGUST 154.4 152.5 147.5 139.6 134.1 131.4 134.4 129.5 126.7 125.4
SEPTEMBER 154.8 152.1 146.4 138.9 134.2 131.7 134.7 129.8 126.1 125.1
OCTOBER 155.1 151.1 145.7 138.1 134.3 132.3 134.8 129.8 126.1 124.8
NOVEMBER 155.2 150.8 144.8 137.5 133.7 133.4 135.0 129.4 126.1 124.7
DECEMBER 155.1 150.2 144.9 137.3 133.1 133.9 134.2 128.7 126.5 124.7
JANUARY 154.5 150.0 144.3 136.3 132.8 134.1 133.5 128.4 126.4 124.5
FEBRUARY 153.7 149.7 143.4 136.0 132.8 134.3 132.8 128.0 126.6 124.5
MARCH 153.0 149.5 142.1 136.1 132.8 134.0 132.0 128.2 126.4
APRIL 152.5 149.1 141.4 136.1 132.7 134.1 131.6 127.8 126.2
MAY 152.6 148.8 140.5 135.7 132.4 134.1 131.1 127.5 126.1
JUNE 152.6 148.3 140.3 134.5 132.3 134.5 130.3 127.2 125.9
FISCAL YEAR * 2007 2008 2009 2010 2011 2012 2013 2014 2015 2016
JULY -1.8 -1.0 -3.5 -5.3 -4.1 -1.6 1.8 -3.6 -2.1 -0.8
AUGUST -1.8 -1.3 -3.3 -5.4 -3.9 -2.0 2.3 -3.6 -2.2 -1.0
SEPTEMBER -1.5 -1.8 -3.7 -5.1 -3.4 -1.9 2.3 -3.7 -2.8 -0.8
OCTOBER -1.1 -2.6 -3.6 -5.2 -2.7 -1.5 1.9 -3.7 -2.8 -1.0
NOVEMBER -1.0 -2.9 -4.0 -5.0 -2.7 -0.2 1.2 -4.1 -2.6 -1.1
DECEMBER -0.9 -3.2 -3.5 -5.3 -3.1 0.6 0.2 -4.1 -1.7 -1.4
JANUARY -1.3 -2.9 -3.8 -5.6 -2.6 1.0 -0.5 -3.9 -1.5 -1.5
FEBRUARY -1.5 -2.6 -4.2 -5.1 -2.4 1.1 -1.1 -3.6 -1.1 -1.6
MARCH -1.7 -2.3 -5.0 -4.2 -2.4 0.9 -1.5 -2.9 -1.4
APRIL -1.9 -2.2 -5.2 -3.7 -2.5 1.0 -1.8 -2.9 -1.2
MAY -1.7 -2.5 -5.5 -3.4 -2.4 1.2 -2.2 -2.7 -1.1
JUNE -1.5 -2.8 -5.4 -4.1 -1.7 1.7 -3.2 -2.4 -1.0
FISCAL YEAR * 2007 2008 2009 2010 2011 2012 2013 2014 2015 2016
JULY -2.8 -1.5 -5.3 -7.9 -5.8 -2.2 2.4 -4.8 -2.7 -1.1
AUGUST -2.8 -1.9 -5.0 -8.0 -5.5 -2.7 3.1 -4.9 -2.9 -1.3
SEPTEMBER -2.3 -2.8 -5.7 -7.4 -4.8 -2.5 3.0 -4.9 -3.6 -1.1
OCTOBER -1.7 -4.0 -5.4 -7.6 -3.7 -2.0 2.5 -5.0 -3.7 -1.3
NOVEMBER -1.6 -4.4 -6.0 -7.3 -3.8 -0.3 1.6 -5.6 -3.3 -1.4
DECEMBER -1.4 -5.0 -5.3 -7.6 -4.2 0.8 0.3 -5.5 -2.2 -1.8
JANUARY -2.0 -4.5 -5.7 -8.0 -3.6 1.4 -0.6 -5.2 -1.9 -1.9
FEBRUARY -2.3 -4.1 -6.3 -7.3 -3.2 1.5 -1.5 -4.8 -1.4 -2.1
MARCH -2.7 -3.5 -7.5 -6.0 -3.2 1.2 -2.0 -3.9 -1.7
APRIL -3.0 -3.4 -7.7 -5.3 -3.4 1.4 -2.4 -3.8 -1.6
MAY -2.7 -3.8 -8.2 -4.8 -3.3 1.6 -3.0 -3.6 -1.3
JUNE -2.3 -4.2 -8.1 -5.7 -2.3 2.3 -4.2 -3.1 -1.3
2007 2008 2009 2010 2011 2012 2013 2014 2015 2016
FISCAL YEAR *
AVERAGE 154.0 150.4 144.1 137.2 133.3 133.3 133.2 128.7 126.4
DIFFERENCE -2.3 -3.6 -6.3 -6.9 -3.9 0.0 -0.1 -4.6 -2.3
% CHANGE -1.5 -2.3 -4.2 -4.8 -2.8 0.0 -0.1 -3.4 -1.8
JUL-FEB
AVERAGE 154.7 151.2 145.6 138.0 133.6 132.9 134.2 129.1 126.4 125.0
DIFFERENCE -2.1 -3.5 -5.6 -7.7 -4.3 -0.8 1.3 -5.1 -2.7 -1.5
% CHANGE -1.3 -2.3 -3.7 -5.3 -3.1 -0.6 1.0 -3.8 -2.1 -1.2
CALENDAR YEAR
AVERAGE 152.4 147.7 140.3 134.9 132.5 134.4 130.7 127.1 125.7
DIFFERENCE -2.9 -4.7 -7.4 -5.4 -2.3 1.9 -3.7 -3.6 -1.4
% CHANGE -1.8 -3.1 -5.0 -3.9 -1.7 1.4 -2.8 -2.7 -1.1
JAN-FEB
AVERAGE 154.1 149.8 143.9 136.2 132.8 134.2 133.2 128.2 126.5 124.5
DIFFERENCE -2.1 -4.3 -6.0 -7.7 -3.4 1.4 -1.1 -5.0 -1.7 -2.0
% CHANGE -1.4 -2.8 -4.0 -5.3 -2.5 1.1 -0.8 -3.7 -1.3 -1.6
YEAR OVER YEAR PERCENTAGE CHANGE
YEAR OVER YEAR DIFFERENCE
SUMMARY DATA

16
Total non-farm payroll employment for
February 2016 averaged 891,900, an
annual decrease of -1.1%.
Sources: BLS and PREPA
* Not seasonally adjusted.
GDB Economic Activity Index Components
Total Non-Farm Payroll Employment*(Thousands of jobs)
820
840
860
880
900
920
940
960
980
Jan-1
3
Jun-1
3
Nov-1
3
Apr-
14
Sep-1
4
Feb-1
5
Jul-
15
Dec-1
5
Electric power generation for February
2016 averaged 1,561.6 million kWh, an
annual increase of 2.6%.
Electric Power Generation*(Millions of kWh)
0
500
1,000
1,500
2,000
2,500
Jan-1
3
Jun-1
3
Nov-1
3
Apr-
14
Sep-1
4
Feb-1
5
Jul-
15
Dec-1
5
Feb-1
6Feb-1
6
17
Sources: PRHTA and GDB
* Not seasonally adjusted.
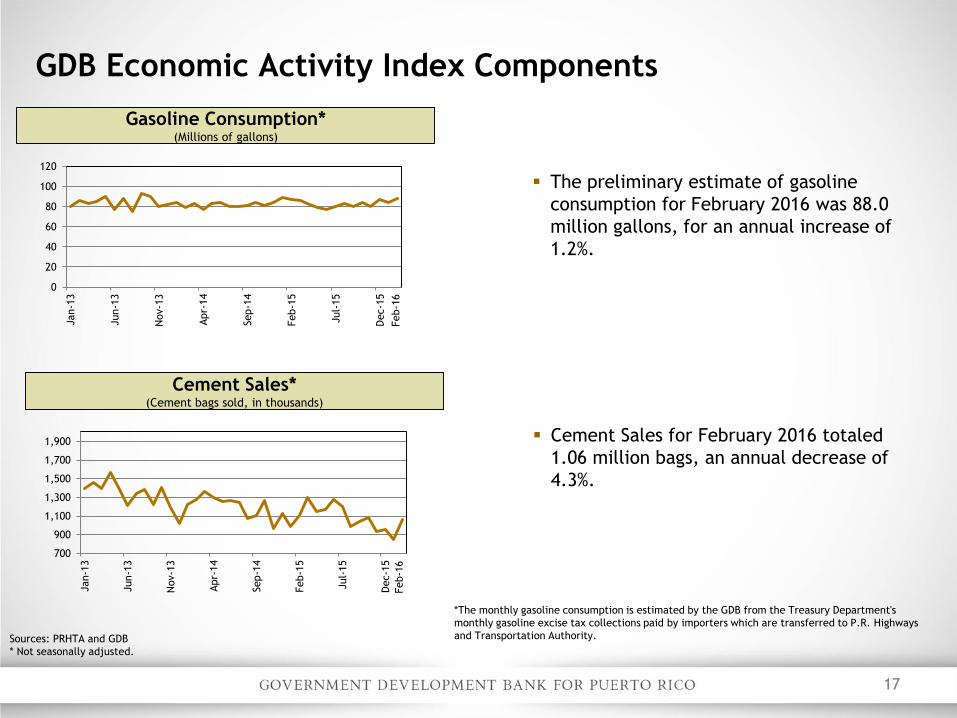
Cement Sales for February 2016 totaled
1.06 million bags, an annual decrease of
4.3%.
GDB Economic Activity Index Components
Cement Sales*(Cement bags sold, in thousands)
700
900
1,100
1,300
1,500
1,700
1,900
Jan-1
3
Jun-1
3
Nov-1
3
Apr-
14
Sep-1
4
Feb-1
5
Jul-
15
Dec-1
5
The preliminary estimate of gasoline
consumption for February 2016 was 88.0
million gallons, for an annual increase of
1.2%.
Gasoline Consumption*(Millions of gallons)
0
20
40
60
80
100
120
Jan-1
3
Jun-1
3
Nov-1
3
Apr-
14
Sep-1
4
Feb-1
5
Jul-
15
Dec-1
5
*The monthly gasoline consumption is estimated by the GDB from the Treasury Department's
monthly gasoline excise tax collections paid by importers which are transferred to P.R. Highways
and Transportation Authority.
Feb-1
6Feb-1
6
18
Description of the
GDB-Economic Activity Index
19
Advantages of the GDB-EAI:
Readily available
Highly correlated to Puerto Rico’s real GNP
Reliable tool to monitor actual trend of Puerto Rico economy
The GDB-EAI is made up of 4 indicators:
Total Payroll Employment (Establishment Survey/ Thousand of employees)
Total Electric Power Generation (Millions of kWh)
Cement Sales (Millions of bags)
Gas Consumption (Millions of gallons)
GDB-EAI Highlights and Composition
GDB Economic Activity Index Highlights

20
The GDB-EAI is a coincident index for the economic activity of Puerto Rico. It is highly correlated
to Puerto Rico’s real GNP in both, levels and annual growth rates.
This index’s methodology is similar to that used in The Conference Board’s coincident index of he
US economy. This methodology follows a standard procedure to adjust the data for seasonality and
volatility factors.
Description of the GDB-EAI
Relationship on the levels: FY1981-FY2014
y = 49.751x – 515.95.42 R² = 0.9651
Real Gross National Product as a function of the
GDB Economic Activity Index
Relationship on the growth rates: FY1982-FY2014
y = 0.7688x + 0.0061 R² = 0.9003
Sources: GDB
3,500
4,500
5,500
6,500
7,500
80
90
100
110
120
130
140
150
160
GN
P54
(Million o
f dollars
at
1954 p
rices)
GDB-EAI(January 1980=100)
-5%
-4%
-3%
-2%
-1%
0%
1%
2%
3%
4%
5%
-6% -4% -2% 0% 2% 4% 6% 8%
GN
P54 A
nnual
Gro
wth
GDB-EAI annual growth

21
The GDB-EAI and its indicators are subject to
revisions. While the information comprising the GDB EAI
has been obtained from sources GDB believes to be
reliable, GDB is not responsible for any errors or
omissions, or for the results obtained from the use of this
information.
Disclaimer


