

Economic benefits of the Doha round for The Netherlands
Report submitted to the Ministry of Economic Affairs, Directorate-General for
Foreign Economic Relations
December 2002
Prof. Dr. Joseph Francois, Tinbergen Institute Rotterdam and CEPR
Dr. Hans van Meijl, LEI, Wageningen University and Research Centre
Dr. Frank van Tongeren, LEI, Wageningen University and Research Centre
Contact: Dr. Frank W. van Tongeren, LEI, Wageningen University and Research Centre P.O. Box 29703, 2502 LS The Hague, The Netherlands, ph: +31 70 335 8330, fax: +31 70 36156 24

2
SUMMARY
This study provides insights into the nature and magnitude of the impacts of the WTO
Doha Round for international trade and the related welfare improvements. The
methodology used is comparable with recent trade policy analyses of the World Bank,
the IMF, the OECD, involving a similar quantitative modelling framework. The
analysis of specific economic consequences for the Netherlands is a special feature of
this study. These effects at the national level are considered in the context of overall
effects at the EU and world level.
For a proper comparison of the situation before and after the Doha Round, it is
necessary to account for the effects resulting from separate developments.
Considerable attention was therefore given in the study to the development of a
realistic "baseline". This baseline already takes into account events such as the entry
of China into the WTO and the addition of new members to the EU. In this way it is
possible to estimate those effects that are specifically attributable only to further trade
liberalisation in the Doha Round.
No matter how complex, an economic model remains a necessary
simplification of reality. Thus this model is heavily dominated by clearly quantifiable
factors, such as reduced import tariffs. Non-quantitative trade restrictions, such as
those facing the services sector, are usually not included in quantitative analyses. This
carries the risk of underestimating the importance of these less visible trade
restrictions. For this reason, this study attempts to quantify the effects of both
liberalising trade in services and reducing administrative barriers facing exporters and
importers at border-crossings.
A review of the international tariff situation reveals that the specific modalities
of tariff reductions are at least as important as the actual amount reduced. Reduction
3
modalities that target peak tariffs result in a different tariff landscape compared to
more simple reductions in average tariffs. Furthermore, developing countries have a
particular interest in reducing tariffs that currently hamper South-South trade. This
results from the fact that many developing countries have maintained a high level of
protection under the Uruguay Round.
The increase in global income from trade liberalization is estimated at between
$210 billion for partial liberalization to $670 billion for a full liberalization scenario.1
The analysis underlines the importance of trade policy reform by developing countries
for achieving these benefits. About one quarter of the global gains can only be
realized if developing countries actively participate. At the same time, developing
countries can achieve high gains relative to their current income levels.
A third of the estimated benefit of $210 to $670 billion is attributable to trade
facilitation, a third to agricultural liberalization and the remaining third approximately
equally to both reductions in industrial tariffs and liberalization in services. Leaving
aside trade facilitation and services liberalization, industrialized countries have the
most interest in seeing agricultural liberalization in other OECD economies as well as
a reduction in industrial tariffs by developing countries. For developing countries, the
benefits arise primarily from trade liberalization with other developing countries,
especially in manufactured goods.
The results for the agricultural sector are mixed: net benefits at a global level,
with particularly the EU, Africa and the majority of Asia profiting, but potentially
negative effects in the long-term for the Asia-Pacific region and North America. This
is a striking results that seems at odds with the current positions taken in the
1 This compares to recent study from the IMF and the World Bank, which forecasts a welfare increase of $280 billion in the middle term and $650 billion in the long term.

4
agricultural negotiations. However, the results highlight the importance of taking a
long-term structural view, including effects beyond agriculture. CAIRNS group
countries should perhaps be cautious about expecting long-term economy-wide gains
if, as a result of liberalization, the agricultural sector draws more resources away from
other productive uses. Developing countries also need to think carefully about the
risks of reinforcing an emphasis on primary exports with consequent de-
industrialization.
The potential increase in world income from reducing agricultural import
tariffs could reach $60 billion, but 60 percent of this is dependent on effective
dismantling of market protection in developing countries. Additional reduction of
internal agricultural support results in an economy-wide increase in income that is
greater for the EU than for North America. Within Europe this is more relevant for
France, Germany and Eastern Europe than for the Netherlands. Dutch agriculture,
with its own particular specialisations, is less dependent on European production
support than the typical agricultural sectors of other countries.
The worldwide results are consistently positive for the industrial sector, with
regards to both short- and long-run effects. The benefits of reducing industrial tariffs,
estimated at about $35 billion with partial liberalisation, and $55 billion with full
liberalisation, are (especially in the long term) greater than those for the agricultural
sector due to the relatively larger investment spending released in the industrial sector.
The readiness of developing countries to reduce effectively their own tariffs is
crucial to realizing prospective worldwide benefits in this area. While many
developing countries engaged in significant liberalization in the 1980s and 1990s,
many of these countries still maintain tariffs at relatively high (albeit reduced) levels.
The wide gap between bound and applied tariff rates limits the bargaining power of

5
developing countries and means that the debate as to which tariffs (bound, applied, or
historic) to use as the reference point in market access negotiations is particularly
important. A noteworthy exception in the general pattern of results is China, which is
found to meet stiffer competition from other developing countries, with its export
prices under consequently pressure. These results highlight the critical role that
determination of market access modalities (including benchmark or base negotiating
rates) will play in securing benefits for developing countries.
Impacts on the Netherlands
The Netherlands, being a very trade-oriented economy, could enjoy a disproportionate
share of world welfare gains. With further liberalization, national income would be
about 2 percent higher over the long term. An important part of the Dutch economy,
including the transport and food processing sectors, benefits from greater trade flows.
Relevant tariffs facing Dutch exporters are on average higher than the protection
granted to them on EU markets. Breaking down tariff barriers provides these
exporters with relatively large export opportunities.
Dutch output would expand particularly in the food processing and the
transport and logistics sectors. The higher than average growth in exports in transport
services reflects the general dependence of the Dutch economy on the size of
international trade flows. On the other hand, the Dutch manufacturing sectors, in
particular the metal and electrotechnical industry, will face stiff competition from
Asia. Asian producers can benefit from a growing domestic market and also from
growing export market that enables them to achieve more cost-effective scales of
production.
6
A noteworthy result is that the study does not point to any general
vulnerability of the Dutch agricultural sector to trade liberalization within the WTO.
Sectors that are heavily dependent on European agricultural subsidies, such as grain
and beef production, do not occupy a major share of the Dutch agri-food sector. In
some other agricultural sectors, such as dairy (certainly with the lifting of production
quotas), there is even room for expansion. Reform of the European sugar regime will
almost certainly lead to diminished production in the Netherlands but sugar remains a
possibility for crop diversification if grains become less attractive due to falling
prices. The results confirm the comparative advantage of the Netherlands in
agriculture, food processing and transport and the large dependence of the Dutch
economy on international trade.
Despite the dominance of services in the Dutch GDP (accounting for about
three quarters of GDP), the preliminary estimates indicate that liberalization would
have a relatively limited impact on this sector, certainly in comparison to a region
such as North America. The projected export growth rates in services are positive, and
their contribution to the trade balance rises. However, the predominantly national
orientation, combined with a low share of international trade, yields only a minor
impact on domestic production.
In this regard, it should be noted that the analysis is restricted to the cross-border
trade effects of liberalization in services while potentially considerable benefits from
Dutch foreign investment are not incorporated fully.

7
Table of contents
1 Introduction............................................................................................................8
2 Dutch foreign trade ..............................................................................................10
2.1 Composition of trade....................................................................................10
2.2 Revealed comparative advantage.................................................................16
2.3 Import protection and export barriers ..........................................................19
2.4 Services ........................................................................................................19
3 Trade Liberalization Scenarios ............................................................................23
3.1 The Policy Landscape ..................................................................................23
3.2 Trading costs ................................................................................................28
3.3 Policy scenarios ...........................................................................................29
4 The Model and Data.............................................................................................35
4.1 Model Data...................................................................................................35
4.2 Theoretical structure ....................................................................................37
5 Results..................................................................................................................40
5.1 Global effects ...............................................................................................40
5.2 Results for the (enlarged) European Union ................................................51
5.3 Results for the Netherlands..........................................................................61
6 References............................................................................................................71
Technical annex: An overview of the computational model
Annex: Supplementary tables
8
1 Introduction
After the failed attempt in Seattle in late 1999, the Ministerial Meeting of the World
Trade Organization (WTO) in Doha, in November 2001 launched the agenda for a
new comprehensive round of multilateral trade negotiations. The ministerial
declaration emphasizes that his new round provides a major opportunity for
developing countries. Consequently the agenda for new WTO round has been coined
the ‘Doha Development Agenda’.
This study provides insights in the economic effects of the new WTO Doha
round for the Netherlands. It places the analysis for the Netherlands against the
background of worldwide effects and effects for the European Union.
The study provides insights into the nature and magnitude of the impacts of
the WTO Doha Round for international trade and the resulting welfare improvements.
The methodology used is comparable with recent trade policy analyses of the World
Bank, the IMF, and the OECD, involving a similar quantitative modelling framework.
The analysis of specific economic consequences for the Netherlands is a special
feature of this study. These effects at national level are considered in the context of
overall effects at EU and world levels. The study covers the areas of agricultural
liberalization, liberalization in industrial tariffs and liberalization in services trade.
No matter how complex, an economic model remains a necessary
simplification of reality. Thus this model is heavily dominated by clearly quantifiable
factors, such as reduced import tariffs and reduced export subsidies. Non-quantitative
trade restrictions, such as those facing the services sector, are usually not included in
quantitative analyses. This carries the risk of underestimating the importance of these

9
less visible trade restrictions. For this reason, this study attempts to quantify the
effects of both liberalizing trade in services and reducing administrative barriers
facing exporters and importers at border-crossings.
This study was prepared at the request of the Dutch Ministry of Economic
Affairs, directorate foreign economic relations. The authors benefited greatly from the
discussions with the advisory committee, which consisted of:
Dr. Marko Bos, deputy director Economic Affairs, Social and Economic Council
(SER )
Dr. Arjan Lejour, senior researcher international affairs, CPB Netherlands Bureau for
Economic Analysis
Prof. Dr. Gerrit Meester, senior policy advisor international affairs, Ministry of
Agriculture Nature Management and Fisheries
The report is organized as follows: Chapter two provides a background on the
importance of trade for the Dutch economy. A picture of the global policy landscape
follows in chapter three. This chapter also develops the liberalization scenarios for the
subsequent quantitative analysis. Chapter four describes briefly the modeling
framework used. Chapter five discusses the results of our liberalization scenarios. It
starts with a section on global results, proceeding with the results for the EU and
finally discussing the estimated impact on the Netherlands.

10
2 Dutch foreign trade
2.1 Composition of trade
The Dutch economy is open to foreign trade. Like many small countries its ratio of
trade to GDP is high. Because of greater variety in goods produced domestically, big
countries with a large domestic market, in general, can exploit scale economies and
they can exploit a wider range of available resources. Smaller countries rely on trade
to enable them to benefit from their comparative advantage. In The Netherlands, the
value of imports represents 56% of GDP, which stands in stark contrast to its large
neighbour Germany, where this indicator is just 26% (Table 3.1). The Netherlands is
also a net exporting country, with exports representing 62% of GDP. The high import
and export ratio highlights also the ‘mainport ‘ feature of The Netherlands, which
serves as a distribution centre for the populous European hinterland. This important
part of the Ducth economy can be expected to benefit from an expansion of global
trade volumes in the wake of further trade liberalisation.
Table 2-1: Trade openness
Exports/ GDP (%) Imports/ GDP (%)
Netherlands 62 56
France 26 23
Germany 27 26
Rest EU15 32 32
Rest OECD 16 16
Developing countries 25 27
Rest of World 30 30
Source: GTAP v5 database. Calculations LEI

11
It is essential for small economies to specialise in the production of a relatively
narrow product range in order to import a large variety of foreign goods. The
Netherlands is traditionally specialised in exports of products in the petro-chemical
complex and the agri-food complex. The production factors ‘sea location’ and ‘soil
and climate’ have in the past stimulated the growth of the transport sector, agriculture
and food processing. The growth of the petrochemical complex has also been
stimulated by the sea location which provided good access to raw materials, but this
can only be a partial explanation of their success. Those capital-intensive processing
industries depend also on the exploitation of economies of scale and the availability of
skilled labour. With a small domestic market, economies of scale can only be realised
if the market is expanded and a significant portion of production is exported.
Scale economies play also a dominant role in the development of basic metal
industries and aluminium industries. In contrast, industries such as electrotechnical
and small scale manufacturing sectors are more dependent on technological progress
and a diversified and highly skilled labour base. Although these sectors are not very
capital intensive in production, they often require substantial R&D investments to
develop new and diversified product niches. These sunk costs can only be recuperated
if the product market is large enough.
A partial picture of Dutch foreign trade is provided in Figure 2-1. With the
exception of some agricultural exports, especially cut flowers, tomatoes and pork
products, which have a large contribution to the countries’ net exports, most products
that rank high on the exports also register high import values. For agricultural primary
products the explanation can be found in the specialisation pattern following
traditional arguments. Location specific factors, combined with external scale
economies that can be realized horticultural clusters have spurred the growth of
12
horticultural products, such as greenhouse vegetables and cut flowers. Likewise,
intensive livestock farming does not depend on the scarce production factor land, and
has benefited from the cheap availability of imported feedstuff (e.g. tapioca and soya
meals).
The simultaneous occurrence of large export and import figures outside
primary agriculture can be attributed to two factors, both of which are partial
explanations. First, at the level of aggregation used here, we will observe some intra-
industry trade. With product differentiation and firm specific scale economies the
production of each variety of the same product tends to be concentrated in one
particular country. If consumers have acquired a taste for variety, the whole range of
varieties will be in demand, and each country simultaneously imports and exports
some part of the variety spectrum. (Helpman and Krugman, 1989).

13
Figu
re 2
-1: T
op 2
0 im
ports
and
exp
orts
Top
20 im
port
and
exp
ort 2
001
-500
00
-400
00
-300
00
-200
00
-100
00
010
000
2000
030
000
4000
050
000
Mac
hine
s an
d pa
rtsEl
ectri
cal a
pplia
nces
Min
eral
fuel
Plas
tics
Opt
ical
inst
runm
ents
Mot
or v
ehic
les
Org
anic
che
mic
als
Live
pla
nts
and
flow
ers
Phar
mac
eutic
al p
rodu
cts
Milk
and
dai
ryM
eat
Pape
rIro
n an
d st
eel
Vege
tabl
esTo
bacc
oC
hem
ical
pro
duct
s n.
e.s.
Iron
and
stee
l pro
duct
sAl
umin
um a
nd p
rodu
cts
Proc
esse
d ve
geta
bles
Beve
rage
sFe
edst
uffs
and
food
was
te
Mill
ion
euro
Net
exp
ort
Impo
rt 20
01Ex
port
2001
Tota
l im
port
valu
e 20
01:
€ 21
8 33
0 m
il To
tal e
xpor
t val
ue 2
001:
€ 24
1 33
9 m
il

14
Second, an important issue for The Netherlands is re-exports, as recently
highlighted by the Central Planning Bureau. According to CPB (2001, 2002b), re-
exports2 have soared in the 1990s to account for an impressive 40% of total Dutch
exports in 2000. In 1990 the estimated share of re-exports was just 20%. The feature
of the Dutch economy as an ‘entrepot economy’ is realized by international
distribution centres which distribute goods from America and Asia to the Northern
European hinterland.
This function of The Netherlands as a logistics and distribution centre points
towards potential gains from worldwide trade liberalisation. The Dutch transport and
logistics sector can benefit from an expansion of global trade volumes, which can be
the result of further trade liberalisation.
The European hinterland dominates the structure of Dutch exports. More than
75% of exports find their way to European destinations, as highlighted in Table 2-2.
While the regional structure of exports has been quite stable over time, the structure of
imports has changed notably during the 1990s. An increasing share of imports is
sourced from the Far East, where especially, the P.R. China, Taiwan and South Korea
have witnessed impressive growth rates (from € 14 billion in 1996 to € 41 billion in
2001). Imports from developing countries have also risen during the 1990s.
The portion of Dutch exports destined for European markets is even larger for
those products that are re-exported to a large extent. A good example is ‘office
equipment and computers’, which account for one quarter of total re-exports, but
hardly register domestically produced exports. Another example is tropical fruit
2 Re-exports are traded goods that are transported through the Netherlands without further significant industrial processing. In order to be accounted as re-exports, the ownership of goods has to be transferred to a Dutch resident. Without such transfer of ownership, the good would be classified as transit good, which is not included in the National Accounts. For further discussion of technical matters, please refer to CPB (2001).

15
juices, which are imported in large quantities through Rotterdam harbour, but the bulk
of it is again exported to European destinations. Re-exports occur mainly in those
products where the Netherlands does not have an obvious comparative advantage.
Table 2-2: Source and destination of trade in goods
Regional structure of Dutch exports (%)
1996 1998 2000 2001
Total 100 100 100 100
European Union 77 76 75 77
USA 3 4 4 4
Far East (Japan, S.E. Asia, Taiwan)
5 4 5 4
Rest of World 14 16 16 15
Regional structure of Dutch imports (%)
1996 1998 2000 2001
Total 100 100 100 100
European Union 63 60 54 54
USA 8 9 9 9
Far East (Japan, S.E. Asia, Taiwan)
13 16 18 19
Rest of World 16 15 17 18
Source: CBS, International Trade Statistics 2001, calculations LEI.
Table 2-3: Structure of commodity exports by product group, 2000 (%)
%
Domestically produced goods Re-exports
Total exports
Agriculture and food 27 6 19Chemicals 23 14 19Machinery, electronic equipment and transport equipment 27 65 43
of which: office equipment and computers 1 25 11Other goods 23 15 19Total 100 100 100
Source: CPB (2001), calculations LEI.

16
2.2 Revealed comparative advantage
Identifying those products that perform well in the international competition can give
some indication as to which products and sectors might gain from a multilateral
lowering of trade barriers. On the other hand, identifying products in which The
Netherlands does not have a comparative advantage will help to flag tougher
international competition in the face of lowering import protection.
One measure that helps to identify the competitive strength of a country is the
so-called ‘Revealed Comparative Advantage Index” (RCA) (Balassa, 1965). This
index shows if an exported commodity performs above the average Dutch export
product in terms of world market shares. If the product has a large world market share
-adjusted for the total participation if Dutch exports in world trade- than the product is
said to reveal a comparative advantage.3
The RCA index can be criticized in various grounds. For example, it does not
take product differentiation and intra-industry trade into account. Another
disadvantage of this indicator in the Dutch context is that it only takes exports into
consideration and does not account for import penetration. The fact that a substantial
portion of Dutch exports is re-exports should be taken into account in this type of
analysis. By supplementing the RCA with the ratio of exports to imports gives a better
picture of the strengths and weaknesses, but is obviously still incomplete. If the RCA
is high, but the ratio of exports to imports low, it is an indication that this product is
mainly re-exported or product differentiation features are significant. Nevertheless the
RCA supplemented with the export/import ratio can provide a useful guideline to
assess export performance. A schematic presentation is provided in Figure 2-2.
3 The RCA for good i from the Netherlands is defined as: [(export good i, NL)/(world exports good i) ]/ [total exports NL)/ (world exports)] * 100

17
displays a grouping of commodities according to their RCAs and export values. The
data represent averages for the period 1993 and use the full list of 261 products from
the UNCTAD trade statistics. The commodties shown represent 80% of the total
export value in each quadrant of the table, and provide a very complete picture.
The picture emerging from this ‘roadmap’ confirms the observations made earlier.
Products with a revealed comparative advantage and whose exports are mostly
domestically produced (the North-East corner of the table) are predominantly in
certain agricultural products, food processing and in petro-chemicals. The analysis
also reconfirms for the more recent period of observation the findings by van Hulst
and Soete (1989) who carried out a similar exercise at a more aggregate level and at
during the mid-1980s. Ottens (2001) has conducted a similar study but at a more
aggregate level and covering data up to 1996.
Figure 2-2: Schematic classification of traded products
Export/import <1 Export/import >1
RCA > 100 Revealed comparative advantage, but
exports dependent on imports. Little
added value and/or large re-exports
Revealed comparative advantage and
mainly indigenous products
RCA < 100 Revealed comparative disadvantage.
Net import product
Revealed comparative disadvantage
and mainly indigenous products

18
Table 2-4: Revealed comparative advantage roadmap Export/import < 1 Export/import ≥ 1
SITC Commodity Avg
RCA
Avg ratio exp/ imp
Avg exp
mln $ SITC Commodity Avg
RCA
Avg ratio exp/ imp
Avg exp
mln $ 752 Automatc.data proc.equip 212 0.97 10424 334 Petroleum products 331 3.15 8218 759 Parts,for office machins 139 0.85 4720 292 Crude veg.materials, nes 957 5.00 4655 542 Medicaments 120 0.96 2279 343 Natural gas 332 8.18 3662 641 Paper and paperboard 100 0.89 2220 054 Vegetables 453 2.50 3031 022 Milk and cream 284 0.91 1388 012 Other meat, meat offal 345 5.58 2653 893 Articles,nes,of plastics 101 0.86 1355 122 Tobacco, manufactured 462 6.06 2615
575 Oth.plastic,primary form 209 1.92 2068 511 Hydrocarbons,nes,derivts 322 2.07 1995 081 Animal feed stuff 264 1.48 1940 024 Cheese and curd 506 5.82 1916 898 Musical instruments,etc. 170 1.49 1766 574 Polyacetal,polycarbonate 349 3.31 1728 684 Aluminium 116 1.09 1550 598 Misc.chemical prodts.nes 144 1.36 1505 011 Bovine meat 280 3.38 1423 783 Road motor vehicles nes 253 5.05 1401 582 Plastic plate,sheets,etc 145 1.24 1374 751 Office machines 286 1.37 1370 098 Edible prod.preprtns,nes 235 2.95 1367 056 Vegtables,prpd,prsvd,nes 394 3.70 1356 112 Alcoholic beverages 128 1.54 1236 541 Medicines,etc.exc.grp542 119 1.08 1149 571 Polymers of ethylene 228 3.37 1139 533 Pigments, paints, etc. 163 1.80 1132 774 Electro-medcl,xray equip 248 2.19 1111 673 Flat-rolled iron etc. 112 1.48 1047 872 Medical instruments nes 136 1.16 1024 744 Mechanical handlng equip 102 1.28 971 881 Photograph appar.etc.nes 222 2.88 969 882 Photo.cinematogrph.suppl 158 1.44 937 516 Other organic chemicals 239 1.39 909 513 Carboxylic acids,derivts 174 1.03 891
RCA ≥100
SITC Commodity Avg
RCA
Avg ratio exp/ imp
Avg exp
mln $ SITC Commodity Avg
RCA
Avg ratio exp/ imp
Avg exp
mln $ 781 Pass.motor vehcls.ex.bus 34 0.46 3113 776 Transistors,valves,etc. 86 1.43 5375 764 Telecomm.equip.parts nes 54 0.85 2546 931 Spec.transact.not classd 84 10.43 3270 784 Parts,tractors,motor veh 32 0.55 1377 778 Electric.mach.appart.nes 78 1.01 2036 772 Elec.switch.relay.circut 55 0.96 1281 874 Measure,control instrmnt 84 1.00 1647 845 Othr.textile apparel,nes 71 0.63 1112 728 Oth.mach,pts,spcl indust 61 1.48 1223 792 Aircraft,assoctd.equipnt 38 0.81 1079 515 Organo-inorganic compnds 88 1.15 988 782 Goods,spcl transport veh 60 0.77 1057 892 Printed matter 94 1.18 826 699 Manufacts.base metal,nes 70 0.86 980 741 Heatng,coolng equip,part 60 1.11 777 894 Baby carriage,toys,games 90 0.70 909 714 Engines,motors non-elect 73 0.84 860 821 Furniture,cushions,etc. 53 0.50 842 775 Dom.elec,non-elec.equipt 72 0.59 759 625 Rubber tyres,tubes,etc. 89 0.75 713 841 Mens,boys clothng,x-knit 53 0.53 626 743 Pumps nes,centrifugs etc 52 0.90 619 842 Women,girl clothng,xknit 51 0.50 601 851 Footwear 46 0.54 598 723 Civil engineering equipt 54 0.89 572 713 Intrnl combus pstn engin 27 0.58 559 651 Textile yarn 52 0.62 515 679 Tubes,pipes,etc.iron,stl 62 0.71 490 773 Electr distribt.eqpt nes 45 0.85 482 762 Radio-broadcast receiver 88 0.76 481 844 Women,girls clothng.knit 84 0.67 453 747 Taps,cocks,valves,etc. 58 0.75 402 553 Perfumery,cosmetics,etc. 59 0.66 398 761 Television receivers etc 50 0.44 393 675 Flat-rolled, alloy steel 64 0.59 377 763 Sound recorder,phonogrph 53 0.57 376 664 Glass 79 0.90 373 663 Mineral manufactures,nes 85 0.94 370 742 Pumps for liquids,parts 57 0.92 350
RCA < 100

19
2.3 Import protection and export barriers
The trade openness of the Netherlands seems to be underscored by low (trade
weighted) average applied import tariffs in Figure 2-3. However, this is also due to
the large share of intra-EU trade, which is duty free. On average, the level of
protection that Dutch firms encounter on their export markets is higher than the
barriers imposed on imports into the Netherlands. Broadly speaking, this points to a
potential Dutch interest in improved market access. The global protection landscape is
more elaborately described in chapter two
Figure 2-3: Applied trade protection
0
5
10
15
20
25
30
Extra_
EUNLD FRA
DEU
REU15CEEC
MEDNAM
SAMCHIN
AIN
DIA
HINCAS
OASPAC
AUSNZSAF
SSAROW
Levied on importsEncountered on exports
Source: GTAP v5 database, calculations LEI.
2.4 Services
Trade in services has received a growing attention in recent years, and stands firmly
on the Doha agenda. Structural changes in developed market economies naturally lead
to an increasing share of services in GDP. In OECD countries, services typically
represent 60-70% of GDP (OECD, 2001), and in The Netherlands this percentage is
even as high as 75% (including publicly provided services, such as education and

20
health care). Even in the lowest income countries, services account for more than a
third of GDP. Economists have observed that the demand for services is relatively
highly income elastic, and productivity growth lags behind productivity growth in
agriculture and manufacturing (Baumol et al. 1989). As incomes grow, and people
become richer their demand for services expands more rapidly than their demand for
food products and manufacturing goods. Although services represent an increasing
share in the economy and in international trade, services sectors operate
predominantly at the national level, and are typically less traded internationally.
Within the General Agreement of Trade in Services (GATS), WTO members
have made agreements to liberalize trade in services. The main aspect of these
agreements is that countries promise to grant national treatment to foreign service
providers in certain sectors. An important aspect of trade in services is the fact that it
is broader than trans-boundary supply, as in the case of trade in goods. In the services
sectors, one speaks of international trade if the supplier (or buyer) crosses the border.
A case in point is international tourism, where the consumer of the service typically
crosses the border to enjoy the service in another country. But also direct foreign
investment (FDI) is often involved, in which case the supplier of service crosses the
border. The GATS distinguishes four modes of supply.4 The European Commission
(2002) provides a concise summary of the state of play in the services negotiations.
Information on trade protection in services is even less readily available from
statistical sources than protection information for agriculture and manufactures. In our
subsequent modeling exercise we provide estimates trade protection in services trade
and estimates of the effects of reducing these barriers.
4 Mode 1: cross border supply (e.g. banking services supplied via e-mail); Mode 2: consumption abroad (e.g. tourism); Mode 3: commercial presence (e.g. foreign branch of a bank); Mode 4: presence of natural persons (e.g. non-national employees of foreign bank branch)

21
The thin borderline between trade and foreign investment in the case of
services also hampers statistical analysis of trade in services. Only recently has the
Dutch Statistical office (CBS) started a joint initiative with the Dutch Central Bank
(DNB) to provide improved estimates of trade in services. These new estimates reveal
that the international distribution function of the the Netherlands is gaining weight in
the economy. Between 1995-1999 the export of services has risen faster that exports
of goods. Exports of services has risen 48% while exports of goods has increased by
23%. (CBS, 2002). Transport services have contributed the largest share to the rising
services exports.
However, despite impressive growth rates, services are still less traded
internationally than goods. Estimates in Table 2-5 show that the ratio of services
exports to output equals about 11% in 1999, while the economy-wide average is about
20%. Within services, transport services take the lead with a share of more than 40%
of the export value. This is followed by business services, such as insurance, financial
services and computer- and ICT services. Also included in this category are royalty
and license fee receipts. In total services represent about one fifth of trade values.
The geographical composition of trade in services is comparable to the
composition of trade in goods, but compared to goods closer trade links exist with the
USA. According to data from DNB, the USA absorbs 15% of total services exports
from The Netherlands and it supplies 16% of services imports. As in goods trade, the
largest share goes to other European countries, with Germany being the most
important trading partner, followed by France.

22
Table 2-5: Dutch services trade
1996 1997 1998 1999 (as % of output value 1999)(*)
Services exports Transport&Trade 16724 19920 20320 21340 19%Business 13479 16672 17205 20097 13%Other private and public 6967 7942 8929 9007 4%Total exports 37170 44534 46454 50444 11%(as % of total goods & services exports) 20% 21% 21% 22% Services imports Transport&Trade 11976 13827 15322 15855 14%Business 13003 16104 15279 19089 12%Other private and public 10141 10850 12552 11640 6%Total imports 35121 40781 43152 46583 10%Source: DNB, note: (*) output value calculated from Input Output table 1999
Table 2-6: Geographical composition of services trade 1999
Exports (% of total) Imports (% of total)World 100 100
EU15 58 59Germany 17 14
UK 14 16France 5 7
CEECs 2 2USA 15 16Asia 11 8South America 1 1Source: DNB, calculations LEI

23
3 Trade Liberalization Scenarios
The core of our analysis is structured around a set of scenarios. These scenarios are
based on alternative liberalization approaches for agriculture, manufactured goods, and
services trade. They are meant to illustrate the implications of alternative approaches to
market access liberalization. They are stylized rather than exact representations. In part,
this is because we are working with an aggregate model (i.e. we do not model trade at
the 6-digit HS level), and as such detailed treatment of all product-specific proposals is
simply impossible. In addition, the actual market access modalities remain to be worked
out. In agriculture, domestic support may or may not be affected, developing countries
may or may not have to liberalize, and certain politically sensitive sectors may yet again
escape from meaningful liberalization. Our scenarios are themselves decomposed into
different components, related to specific sets of countries and specific sectors and
instruments. This offers the advantage of allowing us (or the reader) to construct rough
representations of hybrid liberalization experiments later, since individual components
can be taken from different scenarios and combined.5
3.1 The Policy Landscape
Tariff negotiations in the GATT/WTO have generally been based on tariff bindings,
or schedules of concessions tabled under GATT rules, and the coverage and level of
these bindings is an important element of the initial conditions for the negotiations.
Table 3-1 provides information on the share of industrial-product tariffs (on a trade-
5 Technically, decomposition of general equilibrium-related effects of policy scenarios exhibits path dependence, meaning that the decomposition can be sensitive to the ordering of the elements of the experiment set. The impact of a particular instrument is also sensitive to the other members of the set. We employ a linear decomposition method here that does not exhibit path dependence (Harrison et al 2000). As such, individual experiment elements are roughly additive.

24
weighted basis) that remains either unbound or bound above applied rates. While
tariffs in the OECD (and Latin America) are generally bound, many Asian and
African economy tariffs remain unbound despite more than a four-fold increase in the
coverage of developing-country tariff bindings in the Uruguay Round (Abreu 1996).
For almost all developing countries, existing bindings are, on average, well above
applied rates, reflecting a combination of relatively high initial bindings, and the
subsequent wave of reductions in applied rates. (See Blackhurst et al 1996, Francois
2001).
In addition to general Uruguay Round commitments, there have also been
efforts for sector-based commitments to implement zero tariffs (called “zero-for-
zero”). This is reflected in the next-to-last column of Table 3-1. As a result of zero-
for-zero efforts, OECD economies have between roughly 10% and 30% of tariff lines
bound at zero percent. Most developing countries have opted out of this process.
Zero-for-zero increased developed country duty-free imports to 43% of total imports
(Laird 1998). The process itself ground to a halt after the initial Information
Technology Agreement (ITA). This seems to have been for two reasons: (i) the
sectors in which OECD economies could easily reach agreement had already been
included, and (ii) those sectors remaining involve North-South issues not susceptible
to this approach. In other words, the cherries have been picked, leaving us with the
hard nuts.
With the implementation of Uruguay Round commitments, average ad
valorem tariffs in the industrial countries generally are around 3 percent. This is
reflected in the first columns of Table 3-2. However, there are important exceptions.
One of these is textiles and clothing, where the average rate is roughly three times this
average. This is reflected in the standard deviation and maximum tariff columns.

25
With full implementation of current commitments, we estimate a simple average
industrial tariff in the United States of 3.2 percent, a standard deviation of 4.3, and a
maximum tariff of 37.5 percent. The European Union has a higher average, but less
dispersion. (The EU has an average of 3.7 percent, a standard deviation of 3.6 percent,
and a maximum tariff of 17 percent. For the developing countries in Table 3-1,
average industrial tariffs range from a low of 3 to 4 percent to a high of more than 20
percent. Table 3-2 presents detailed data for three developing countries: Brazil,
India, and Thailand. These countries span the spectrum of developing country
bindings as reflected in Table 3-1. Brazil’s tariffs are all bound, though the average
rate for industrial products is 14.9 percentage points above the current applied rate.
This gap is called a “binding overhang.” India and Thailand’s tariffs are partially
covered by bindings, again with significant binding overhang. In general, for
developing countries, binding overhang is large enough that reductions in the range of
50% are necessary to force reductions in average applied rates for countries like
Brazil. For many countries, even this will have little for no effect, as tariffs are
largely unbound. For example, note that one-third of India’s manufacturing tariffs
and 90 percent of Sri Lanka’s tariffs are unbound. Of course, this limits severely the
negotiating leverage of developing countries in the WTO. This is also why the debate
of using bound, applied, or “historic” rates as a starting point is important.
As in the case of industrial tariffs, the stage for any future agriculture
negotiations was also set by the Uruguay Round outcome-- this time by the Uruguay
Round Agreement on Agriculture (URAA). One key difference from industrial
products is that essentially all agricultural tariffs are bound. However, in both
industrial and developing countries, there is a large degree of binding overhang
resulting from “dirty tariffication” or the use of “ceiling bindings” (Hathaway and

26
Ingco 1996). The next round of agricultural negotiations was scheduled in the URAA,
while the negotiating parameters (tariffs, tariff-rate-quota levels, subsidy
commitments, etc.) must also be viewed in the context of the schedules of URAA
commitments. The system that has emerged is complex and similar to arrangements
in the textile and clothing sectors, featuring a mix of bilaterally allocated tariff-rate-
quotas (with associated quota rents) and tariffs. Viewed in conjunction with industrial
protection, the basic pattern is that the industrial countries protect agriculture and
processed food, while protection in developing countries is more balanced (though
also higher overall) in its focus on food and non-food manufactured goods.
The URAA had a stated goal of no backsliding and modest liberalization.
However, negotiating parties (generally the relevant agriculture ministries) gave
considerable leeway to themselves with regard to selection of the appropriate reference
period from which to measure export subsidy reductions. In addition, the move to a
price-based system for protection has, in many cases, been subsumed into an effective
adoption of explicit quotas. The disciplines on domestic subsidies have also been
weakened by a relatively soft definition of the AMS vis-à-vis individual subsidies and
the scope for reallocation of expenditures within the AMS. (See Tangermann 1998 for
discussion.) Commitments not to erode current market access were meant to limit the
scope for increased protection through dirty tariffication. As the name implies, dirty
tariffication involved violations of the spirit, if not the letter, of the URAA text. It
involved setting tariff bindings at rates far above then current effective protection rates.
The practice of setting high bindings complicated the problem of measuring the impact
of further commitments to reduce bindings. Basically, in agriculture, we are in a world
that allows scope for great policy discretion and uncertainty as a result of the loose
nature of the commitments made. In addition, the setting of high bound rates made

27
possible the conversion of NTBs into even more restrictive import tariffs. This in turn
made quantity disciplines necessary to avoid backsliding. Despite the goals of subsidy
reductions and a shift toward price-based border measures, one of the more striking
features of the regime that has actually emerged is the prominent role that quantity
measures have taken in the new architecture. Basically, the agricultural trading system is
complicated and still evolving. Policy measurement in this area has converged on the use
of price-based measurements that emphasize the tax/subsidy equivalent of policy. (As
this approach reflects available data, this is the approach we employ in this study as
well.)
For services, “market access” is a problematic concept. From the outset,
service negotiations have been "qualitative." They have not targeted numeric
measures, but rather commitments in the cross-border movement of consumers and
providers and the establishment of foreign providers. In fact, the GATS actually
confuses FDI with international trade. As a result, efforts to quantify market access in
service sectors (a basic requirement if we want to then quantify liberalization) have
been problematic at best. The standard approach (an example is Hoekman 1995) has
been to produce inventory measures.
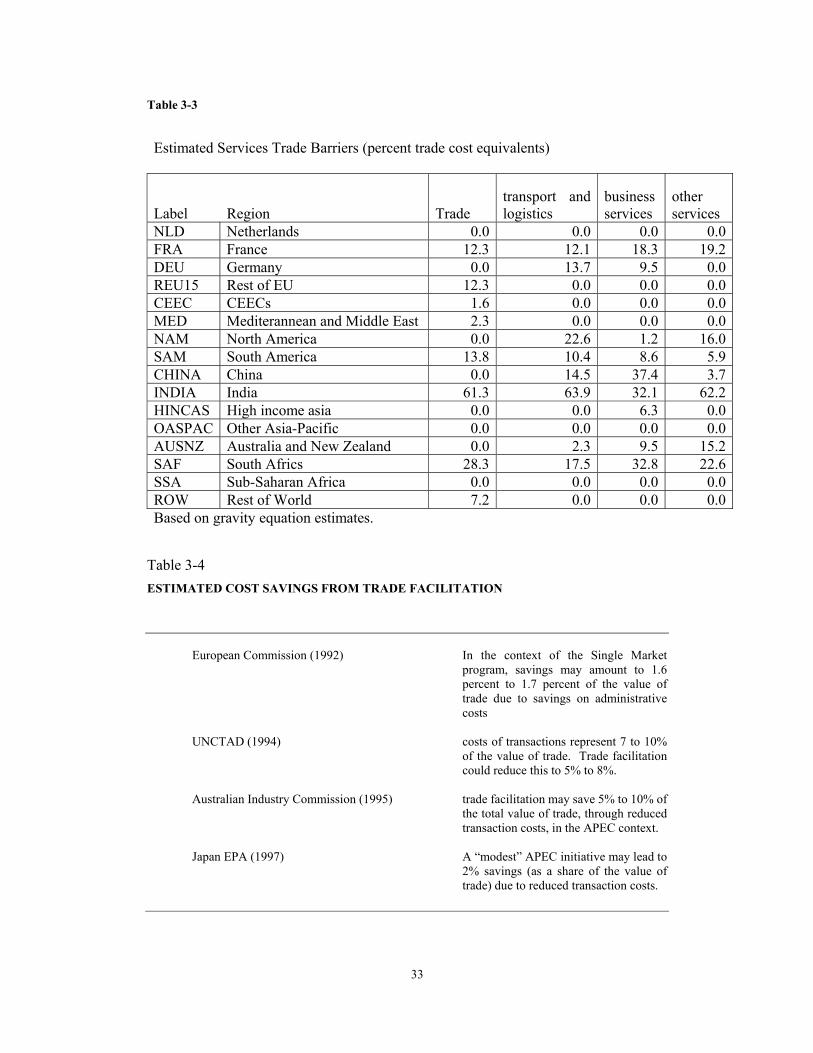
As an alternative perspective, we follow Francois (2001) and have produced
estimates of "tariff equivalents" for services trade. These are based on a simple
simple gravity model, estimated from detailed global trade data for services trade in
1997. The basic approach is described in the annex to this report. The resulting
estimates are summarized in Table 3-3. The estimates are admittedly crude. The
pattern that emerges is consistent with that for industrial tariffs. It appears that
barriers to services trade are higher (often much higher) in developing countries than
in the OECD. Hence, as in the case of industrial tariffs, the effects of further GATS

28
negotiations will hinge critically on developing country participation or non-
participation, and the extent to which they commit to actual liberalization rather than
stand-stills (the qualitative equivalent of ceiling bindings).
3.2 Trading costs
With the reduction in traditional trade barriers, attention in the regional and
multilateral trade arenas has not only shifted to quantity restrictions, but also to trade
facilitation measures. These are meant to target less transparent trade barriers, such as
customs procedures, product standards and conformance certifications, licensing
requirements, and related administrative sources of trading costs. Studies of regional
integration initiatives (Baldwin and Francois 1997, Smith and Venables 1988) have
emphasized the potential for liberalization initiatives to substantially reduce such
barriers. Conceptually, these costs are different from the price and quantity measures
used for manufactures and agriculture. They are a pure global deadweight loss.
The estimates of trading costs are very rough (at best). Nonetheless, they
provide some sense of the magnitudes involved. An overview of estimates is
provided in Table 3-4. In the context of the EC single market program, elimination
of internal customs procedures and related administrative streamlining were projected
to reduced trading costs by up to 2 percent of the value of trade (EC 1988). Globally,
UNCTAD (1994) has noted that trading costs represent 7 to 10 percent of the cost of
delivered goods. Like the EC, UNCTAD also estimates that simple trade facilitation
measures could reduce these costs by 2 percent of the value of trade. The Australian
Industry Commission (1995) has estimated potentially higher savings in the context of
APEC, ranging from 5 to 10 percent of the value of trade. Under more modest
facilitation initiatives, the Japanese Economic Planning Agency (1997) has estimated

29
savings at 2 percent in an APEC context, while Francois (2001) has employed a
similar range of estimates.
3.3 Policy scenarios
To bring these elements together, we define three sets of scenarios (See, Table 3-5).
The first two are partial liberalization scenarios. In the “Linear 50%” all trade
instruments are reduced by 50%. This involves a 50% reduction in agricultural and
industrial tariffs and export subsidies, a 50% reduction in OECD domestic support for
agriculture, a 50% reduction in the tariff-equivalent of services barriers, and a partial
reduction in trading costs, related to trade facilitation measures. Services
liberalization involves a 50% or a full reduction in the barriers shown in Table 3-3.
The second partial liberalization experiment is called the “Swiss formula” experiment.
In this experiment the reduction in import tariffs in agriculture and manufacture is
based on a straight Swiss formula with a coefficient of 0.25, meaning the maximum
tariff is reduced to 25%. (See Francois and Martin forthcoming). The third scenario
simply involves full elimination of all trade barriers. Trade facilitation, based on the
range of available estimates, is assumed to range between 1.5 percent of the value of
trade (partial liberalization) and 3 percent (full liberalization).
Each experiment is decomposed, both in terms of sectors and instruments, and
also in terms of country grouping. An example is given in Table 3-6 were the world
welfare effect (equivalent variation) is decomposed across sectoral instruments and
regions. Because of the decomposition method used, this means that the reader can
pick and choose, combining the results of hybrid experiments involving elements
from different experiments, for a rough sense of possible effects. For example, if in
the next WTO round, the outcome will be only 50% liberalization in manufactures in

30
all regions and trade facilitation only in OECD countries, the world welfare effect will
be approximately $80 billion ($34 billion due to liberalization in manufacturing and
$46 billion due to trade facilitation in the OECD).
Finally, for each of the experiments we can choose between certain model features
(these model features are discussed in more detail in section 4.2). First, we can study
short-run versus long-run effects. In the short run capital is fixed and in the long run
capital can adjust (Baldwin closure). Second, we can assume perfect competition
versus imperfect competition in the manufacturing and services sectors. With perfect
competition we assume constant returns to scale and with imperfect competition we
assume monopolistic competition with increasing returns to scale. For the agricultural
sectors (except for the food processing industry) we always assume constant returns to
scale. In this study we use the constant returns to scale scenario mainly as a
benchmark scenario to assess the impact of the increasing returns to scale features and
it facilitates comparison with other studies that mainly use constant returns to scale in
all sectors.

31
Table 3-1
Industrial tariff rates and bindings -- post UR and ITA
Percent of MFN imports that are subject to: Tariff lines bound tariffs unbound tariffs tariffs bound
above applied rates
tariffs unbound or bound above
applied rates
Share of bound duty free tariff lines to total
tar. lines
Total tariff lines
Argentina 100.0 0.0 99.9 99.9 0.0 10530 Australia 96.9 3.1 31.7 34.8 17.7 5520 Brazil 100.0 0.0 91.0 91.0 0.5 10860 Canada 99.8 0.2 45.7 45.9 34.5 6261 Chile 100.0 0.0 99.7 99.7 0.0 5055 Colombia 100.0 0.0 97.7 97.7 0.0 6145 El Salvador 97.1 2.9 96.0 98.9 0.0 4922 European Union 100.0 0.0 17.7 17.7 26.9 7635 Hungary 93.6 6.4 3.3 9.7 10.4 5896 India 69.3 30.7 14.8 45.5 0.0 4354 Indonesia 92.3 7.7 86.6 94.3 0.0 7735 Japan 95.9 4.1 0.1 4.2 47.4 7339 Korea 89.8 10.2 3.4 13.6 11.6 8882 Malaysia 79.3 20.7 31.0 51.7 1.6 10832 México 100.0 0.0 98.4 98.4 0.0 11255 New Zealand 100.0 0.0 46.5 46.5 39.5 5894 Norway 100.0 0.0 36.5 36.5 46.6 5326 Peru 100.0 0.0 98.5 98.5 0.0 4545 Phillipines 67.4 32.6 15.5 48.1 0.0 5387 Poland 92.8 7.2 44.6 51.8 2.2 4354 Singapore 36.5 63.5 11.7 75.2 15.2 4963 Sri Lanka 9.2 90.8 1.4 92.2 0.1 5933 Thailand 67.4 32.6 8.9 41.5 0.0 5244 Tunisia 67.9 32.1 41.5 73.6 0.0 5087 Turkey 49.3 50.7 0.0 50.7 1.4 15479 United States 100.0 0.0 14.0 14.0 39.4 7872 Uruguay 100.0 0.0 96.3 96.3 0.0 10530 Venezuela 100.0 0.0 90.3 90.3 0.0 5974 Zimbabwe 13.6 86.4 3.9 90.3 3.0 1929
source: Francois (2001), based on WTO and World Bank data on Uruguay Round and post-Information Technology Agreement schedules.

32
Tab
le 3
-2
Sum
mar
y of
Eff
ects
of B
asic
Sw
iss F
orm
ula
Red
uctio
ns
App
lied
tari
ffs b
efor
e an
d af
ter
a 50
% c
ut in
ave
rage
tari
ff b
indi
ngs
Agr
icul
ture
post
-UR
and
ITA
tarif
fs
ef
fect
of b
asic
Sw
iss-
form
ula
appl
icat
ion
on ta
riffs
sim
ple
aver
age
stan
dard
de
viat
ion
max
imum
ta
riff
bind
ing
over
hang
si
mpl
e av
erag
e st
anda
rd
devi
atio
n m
axim
um
tarif
f bi
ndin
g ov
erha
ng
Perc
ent
redu
ctio
n in
av
erag
e Eu
rope
an
Uni
on
5.9
7.5
74.9
0.
3 3.
0 2.
9 10
.9
0.1
-48.
6
Japa
n 6.
2 8.
1 43
.3
1.2
3.5
3.7
13.9
0.
2 -4
3.0
Uni
ted
Stat
es
3.5
7.4
90.0
0.
5 1.
9 2.
4 11
.5
0.1
-46.
6
Bra
zil
12.9
5.
1 27
.0
22.6
12
.4
4.6
22.3
5.
3 -3
.7
Indi
a 31
.0
20.8
15
0.0
90.7
29
.5
14.9
70
.8
31.3
-4
.8
Thai
land
26
.5
14.4
65
.0
7.1
15.1
6.
3 30
.1
1.7
-43.
0 N
on-a
gric
ultu
re
post
-UR
and
ITA
tarif
fs
ef
fect
of b
asic
Sw
iss-
form
ula
appl
icat
ion
on ta
riffs
sim
ple
aver
age
stan
dard
de
viat
ion
max
imum
ta
riff
bind
ing
over
hang
si
mpl
e av
erag
e st
anda
rd
devi
atio
n m
axim
um
tarif
f bi
ndin
g ov
erha
ng
Perc
ent
redu
ctio
n in
av
erag
e Eu
rope
an
Uni
on
3.7
3.6
17.0
0.
4 1.
9 1.
4 5.
0 0.
1 -4
7.7
Japa
n 2.
3 3.
4 30
.9
0.1
1.2
1.4
5.6
0.0
-48.
5 U
nite
d St
ates
3.
2 4.
3 37
.5
0.2
1.7
1.6
6.1
0.0
-48.
3
Bra
zil
15.9
6.
0 35
.0
14.9
13
.5
4.2
16.7
1.
9 -1
5.4
Indi
a 19
.2
16.5
40
.0
3.9
11.3
9.
2 30
.5
0.3
-41.
3 Th
aila
nd
10.5
10
.8
80.0
7.
8 7.
2 6.
1 20
.7
2.0
-31.
6 So
urce
: Fra
ncoi
s and
Mar
tin (2
003,
forth
com
ing)
.
33
Table 3-3
Estimated Services Trade Barriers (percent trade cost equivalents)
Label Region Trade transport and logistics
business services
other services
NLD Netherlands 0.0 0.0 0.0 0.0FRA France 12.3 12.1 18.3 19.2DEU Germany 0.0 13.7 9.5 0.0REU15 Rest of EU 12.3 0.0 0.0 0.0CEEC CEECs 1.6 0.0 0.0 0.0MED Mediterannean and Middle East 2.3 0.0 0.0 0.0NAM North America 0.0 22.6 1.2 16.0SAM South America 13.8 10.4 8.6 5.9CHINA China 0.0 14.5 37.4 3.7INDIA India 61.3 63.9 32.1 62.2HINCAS High income asia 0.0 0.0 6.3 0.0OASPAC Other Asia-Pacific 0.0 0.0 0.0 0.0AUSNZ Australia and New Zealand 0.0 2.3 9.5 15.2SAF South Africs 28.3 17.5 32.8 22.6SSA Sub-Saharan Africa 0.0 0.0 0.0 0.0ROW Rest of World 7.2 0.0 0.0 0.0Based on gravity equation estimates.
Table 3-4 ESTIMATED COST SAVINGS FROM TRADE FACILITATION
European Commission (1992) In the context of the Single Market
program, savings may amount to 1.6 percent to 1.7 percent of the value of trade due to savings on administrative costs
UNCTAD (1994) costs of transactions represent 7 to 10%
of the value of trade. Trade facilitation could reduce this to 5% to 8%.
Australian Industry Commission (1995) trade facilitation may save 5% to 10% of
the total value of trade, through reduced transaction costs, in the APEC context.
Japan EPA (1997) A “modest” APEC initiative may lead to
2% savings (as a share of the value of trade) due to reduced transaction costs.

34
Table 3-5
Scenario definitions
Instruments Linear 50% Swiss formula Full liberalisation
Import tariffs in agriculture and manufacturing 50% reduction
Swiss formula reduction (with a max 25% tariff) 100% reduction
Estimated border measures in services 50% reduction 50% reduction 100% reduction
Export subsidies 50% reduction 50% reduction 100% reduction Domestic agricultural support in OECD countries 50% reduction 50% reduction 100% reduction
Trade facilitation 1.5% of value of trade
1.5% of value of trade
3% of value of trade
Table 3-6: Total welfare gains of linear 50% experiment decomposed by sectoral instruments and regions OECD LDCs Interaction
effects Total
Agricultural liberalization (border measures) 24482 32446 56928
Agricultural liberalization (domestic support) 8744 8744
Manufactures (border measures) 12057 22230 34287
Services liberalization
17225 6907 24132
Trade facilitation
46159 26152 72311
Interaction effects
15974
Total
108667 87735 15974 212376
Source model simulations

35
4 The Model and Data
This section provides a brief overview of the global computable general equilibrium
(CGE) model used in this study. The model is characterized by an input-output
structure (based on regional and national input-output tables) that explicitly links
industries in a value added chain from primary goods, over continuously higher stages
of intermediate processing, to the final assembling of goods and services for
consumption. Inter-sectoral linkages are direct, like the input of steel in the
production of transport equipment, and indirect, via intermediate use in other sectors.
The model captures these linkages by modeling firms' use of factors and intermediate
inputs. The most important aspects of the model can be summarized as follows: (i) it
covers all world trade and production; (ii) it allows for scale economies and imperfect
competition; (iii) it includes intermediate linkages between sectors; (iv) and it allows
for trade to affect capital stocks through investment effects. The last point means we
model medium to long-run investment effects. The inclusion of scale economies and
imperfect competition implies agglomeration effects like those emphasized in the
recent economic geography literature.
4.1 Model Data
The data come from a number of sources. Data on production and trade are based on
national social accounting data linked through trade flows (see Reinert and Roland-
Holst 1997). These social accounting data are drawn directly from the most recent
version of the Global Trade Analysis Project (GTAP) dataset, version 5.2.
(Dimaranan and McDougall, 2002). The GTAP version 5 dataset is benchmarked to
1997, and includes detailed national input-output, trade, and final demand structures.

36
The basic social accounting and trade data are supplemented with trade policy data,
including additional data on tariffs and non-tariff barriers.
The data on tariffs are taken from the WTO's integrated database, with
supplemental information from the World Bank's recent assessment of detailed pre-
and post-Uruguay Round tariff schedules and from the UNCTAD/World Bank WITS
dataset. All of this tariff information has been concorded to GTAP model sectors.
Services trade barriers are based on the estimates described in chapter three and the
technical annex. We also work with the schedule of China accession commitments
(Francois and Spinanger 2001).
While the basic GTAP dataset is benchmarked to 1997, and reflects applied
tariffs actually in place in 1997, we of course want to work with a representation of a
post-Uruguay Round world. We also want to include the accession of China, the
enlargement of the EU, and Adenda 2000 reforms as part of the baseline. To
accomplish this, before conducting any policy experiments we first run a "pre-
experiment" in which we do the following:
implement the rest of the Uruguay Round tariff commitments,
implement the ATC phaseout,
implement China’s accession to the WTO,
implement Agenda 2000,
and Implement the EU enlargement.
As such, the dataset we work with for actual experiments is a representation of a
notional world economy (with values in 1997 dollars) wherein we have realized many
of the trade policy reforms already programmed for the next few years.

37
The social accounting data have been aggregated to 17 sectors and 16 regions.
The sectors and regions for the 17x16 aggregation of the data are given in Table 4.1 (a
more detailed mapping between the aggregated sectors and regions and the original
GTAP regions and sectors is given in technical annex Table 5).
Table 4.1 Sectors and regions Label Region Label Sector NLD Netherlands CERE* Cerals FRA France HORT* Horticulture & other crops DEU Germany SUGA* Sugar, plants and processed REU15 Rest of EU INTLIV* Intensive livestock &products CEEC CEECs CATLE* Cattle & beef products
MED Mediterannean and Middle East DAIRY* Milk & dairy
NAM North America OAGR* Other agriculture SAM South America PROCF Processed food products CHINA China TEXT Textiles, leather & clothing INDIA India EXTR Extraction industries HINCAS High income asia CHEM Petro & chemicals OASPAC Other Asia-Pacific MELE Metal and electotechnical ind AUSNZ Australia and New Zealand OIND Other industries
SAF South Africs TRAD Trade services SSA Sub-Saharan Africa TRAN Transport services
ROW Rest of World BSVC Business, financial & communnications services
OSVC Other private and public services
* denotes a competitive sector
4.2 Theoretical structure
We turn next to the basic theoretical features of the model. More discussion is
provided in the separate technical annex. In all regions there is a single representative,
composite household in each region, with expenditures allocated over personal
consumption and savings (future consumption). The composite household owns
endowments of the factors of production and receives income by selling them to
firms. It also receives income from tariff revenue and rents accruing from
38
import/export quota licenses (when applicable). Part of the income is distributed as
subsidy payments to some sectors, primarily in agriculture.
On the production side, in all sectors, firms employ domestic production
factors (capital, labor and land) and intermediate inputs from domestic and foreign
sources to produce outputs in the most cost-efficient way that technology allow.
Perfect competition is assumed in the agricultural sectors as indicated in Table 4.1
(notice that the processed food products sector is characterized by increasing returns
to scale). In these sectors, products from different regions are assumed to be imperfect
substitutes in accordance with the so-called "Armington" assumption. Production
under imperfect competition is discussed below.
Prices on goods and factors adjust until all markets are simultaneously in
(general) equilibrium. This means that we solve for equilibria in which all markets
clear. While we model changes in gross trade flows, we do not model changes in net
international capital flows. Rather our capital market closure involves fixed net capital
inflows and outflows. (This does not preclude changes in gross capital flows). To
summarize, factor markets are competitive, and labor and capital are mobile between
sectors but not between regions.
We model manufacturing and services as involving imperfect competition.
The approach followed involves monopolistic competition. Monopolistic competition
involves scale economies that are internal to each firm, depending on its own
production level. In particular, based on estimates of price-cost markups (see the
annex), we model the sector as being characterized by Chamberlinian large-group
monopolistic competition. (For more on this approach, see Francois and Nelson
2002.) An important property of the monopolistic competition model is that increased
specialization at intermediate stages of production yields returns due to specialization,

39
where the sector as a whole becomes more productive the broader the range of
specialized inputs. These gains spill over through two-way trade in specialized
intermediate goods. With these spillovers, trade liberalization can lead to global scale
effects related to specialization. With international scale economies, regional welfare
effects depend on a mix of efficiency effects, global scale effects, and terms-of-trade
effects (for more on this, see Francois and Roland-Holst 1997). Similar gains follow
from consumer good specialization.
Another important feature involves a dynamic link, whereby the static or
direct income effects of trade liberalization induce shifts in the regional pattern of
savings and investment. These effects have been explored extensively in the trade
literature, and relate to classical models of capital accumulation and growth, rather
than to endogenous growth mechanisms. Research in this area includes Baldwin and
Francois (1999), Smith (1976, 1977), and Srinivasan and Bhagwati (1980). Several
studies of the Uruguay Round have also incorporated variations on this mechanism.
Such effects compound initial output welfare effects over the medium-run, and can
magnify income gains or losses. How much these "accumulation effects" will
supplement static effects depends on a number of factors, including the marginal
product of capital and underlying savings behavior. In the present application, we
work with a classical savings-investment mechanism (discussed briefly in the
appendix, and also in Francois et al 1997). This means we model long-run linkages
between changes in income, savings, and investment. The results reported here
therefore include changes in the capital stock, and the medium- to long-run
implications of such changes.

40
5 Results
5.1 Global effects
We now turn to the results of the experiments outlines in chapter two. Tables 5-1 to 5-
4 present a summary of results at the global level. The tables present a breakdown of
the national income effects (technically measured as equivalent variation) resulting
from the various policy experiments along the lines of major sector components.
Table 5-1 is focused on agriculture, Table 5-2 is focused on manufactures, Tables 5-3
is focused on services liberalization, and Table 5-4 focusses on trade facilitation. The
Tables also give a breakdown of the effects of scale economies, through a comparison
of a perfect competition version of the model to the one with scale economies and
imperfect competition. We consider the increasing returns case to be the most
relevant, and unless indicated otherwise, the discussion of results pertains to this
version of the model. A different breakdown of national income effects is provided in
a separate Annex, which also provides details on the ‘Swiss formula“ results.
From the initial set of income effect tables, we can see that agricultural
liberalization offers a mixed set of results. Liberalization of domestic support in the
OECD, on the other hand, is generally positive for the OECD, though with negative
consequences for sub-Saharan Africa. We find that significant, though limited,
liberalization yields positive results globally, and regionally for Europe, Africa, and
most of Asia. However, on net agricultural liberalization is a mixed-bag, with gains
in most areas from elimination of domestic support, but with more mixed results from
the elimination of border measures. Static results are consistently positive if constant
returns to scale (CRS) are assumed, but induced changes in investment, combined
with the imperfect competition features of the model, point to negative effects over
the longer-run.

41
Specifically, we find unexpected welfare effects from agricultural liberalisation in the
following cases:
• Australia and New Zealand, who are both net agricultural exporters, and are
generally favouring agricultural liberalization. Those countries are usually
expected to gain from improved market access in other countries.
• Mediterranean countries who are close to the EU and are usually expected to
gain from liberalization in the heavily protected EU agricultural markets.
• Other non-OECD countries (India, China, South Africa, SSA) who do not
liberalize themselves and loose when their access to OECD markets is
improved.
• Gains for South America are very limited. As a big agricultural exporter, they
are generally expected to gain more from liberalization.
In order to understand these unexpected results it is important to distinguish the
standard perfect competition and CRS case, which most other studies use, from our
modeling of industrial sectors as exhibiting imperfect competition and IRS.
For almost all regions the explanation of the negative welfare results under
imperfect competition is straightforward: Due to trade liberalization in agriculture
their agricultural sectors expand, because they gain by getting better access to OECD
markets. However, the agricultural sectors are all perfectly competitive sectors with
constant returns to scale. The expanding agricultural sectors draw resources from
industrial sectors. As a consequence, the industrial sectors have to contract, which has
negative implications for welfare because they cannot achieve cost effective scales of
production. Therefore, the unexpected negative welfare effects are due to the presence
of scale economies in some parts of the economy. This is a general point: If

42
liberalization leads to specialization and expansion of CRS sectors, this is often
inferior compared to a policy-induced expansion in IRS sectors. In the latter case, the
traditional gains from liberalization are magnified by additional opportunities to
utilize economies of scale.
Our results highlight the importance of taking a long-term structural view.
CAIRNS group countries should perhaps be cautious about expecting long-term
economy-wide gains if, as a result of liberalization, the agricultural sector draws more
resources away from other productive uses. Developing countries also need to think
carefully about the risks of reinforcing an emphasis on primary exports.
The pattern for manufacturing liberalization is more consistent and positive,
both in the initial static results, and over the long-term. From Table 5-2, the most
important area for manufacturing tariff liberalization is the developing countries.
Recall from the discussion in chapter three that OECD tariffs are, on average, below 3
percent for manufacturing. As a result, the impact of a Swiss-formula (which targets
high tariffs) yields only limited effects on the OECD, while directly proportional cuts
have a more dramatic effect. At the extreme, we identify between an initial (static)
effect of between $35 and $55 billion. The one region consistently, and significantly,
hurt by significant manufacturing liberalization is China. This follows from an
erosion of its terms of trade, driven by its growth in textile exports, combined with
increased competition from other low wage countries (see the export effects in the
annex tables). Natural competitors, such as India, currently limit their participation on
world markets through a mix of import and export barriers. Rationalization in this
area by developing countries leads to heightened competition against China in a
number of sectors, with the result being income losses for China driven almost
entirely by manufacturing and agricultural liberalization in the developing world.

43
Another important source of gains is services, which yields static income gains
on a par with remaining manufacturing tariffs, ranging, potentially, to over $50 billion
globally. One obvious winner from services liberalization is the United States, which
is projected to pick up a substantial share of total gains. Another big winner in
services, however, is somewhat less obvious. India, which has moved in recent years
to become a major exporter in services (including software and back office services)
is projected to be a bigger potential winner from services liberalization than North
America. In fact, as a share of GDP, services is a more important source of gains for
India than agriculture and manufacturing liberalization combined. The other
important source of gains for India (and for much of the world) is trade facilitation. In
the Asia-Pacific region, where exports alone are often 50 percent of GDP, trade
facilitation yields a dramatic short-run effects as well as a long-run impact driven by
investment effects (Table 5-4). For the Asia-Pacific developing countries, the single
most important issue is trade facilitation, particularly by other developing countries.
Further detail on labor market and trade effects is provided in the annex tables.
In general, both unskilled and skilled workers gain from the partial and full
liberalization scenarios in most regions, except for some cases in the CEEC
economies and China. In China, the results are linked to the trade and income effects
following from competition with other low-wag exporters, as discussed above. The
general pattern of wage effects is summarized in Figure 5.1, which shows percent
changes in wages for unskilled workers in all regions, under all three scenarios.
While this figure is somewhat difficult to read in detail, the basic pattern is clear –
positive wage effects everywhere, under all scenarios, except for China in all cases
and the CEECs in some cases.

44
The general pattern of export effects, reported in detail in the annex tables, is
summarized in Figure 5.2. Like the Figure 5.2, the emphasis here is not on individual
values, but the general pattern of results. Export growth, under all scenarios, is
greatest in the developing countries, especially in Asia and the Pacific (including
India and China), but also in the Mediterranean, African, and Latin American
economies. The CEECs suffer from trade-erosion with respect to market access to the
EU15 economies.
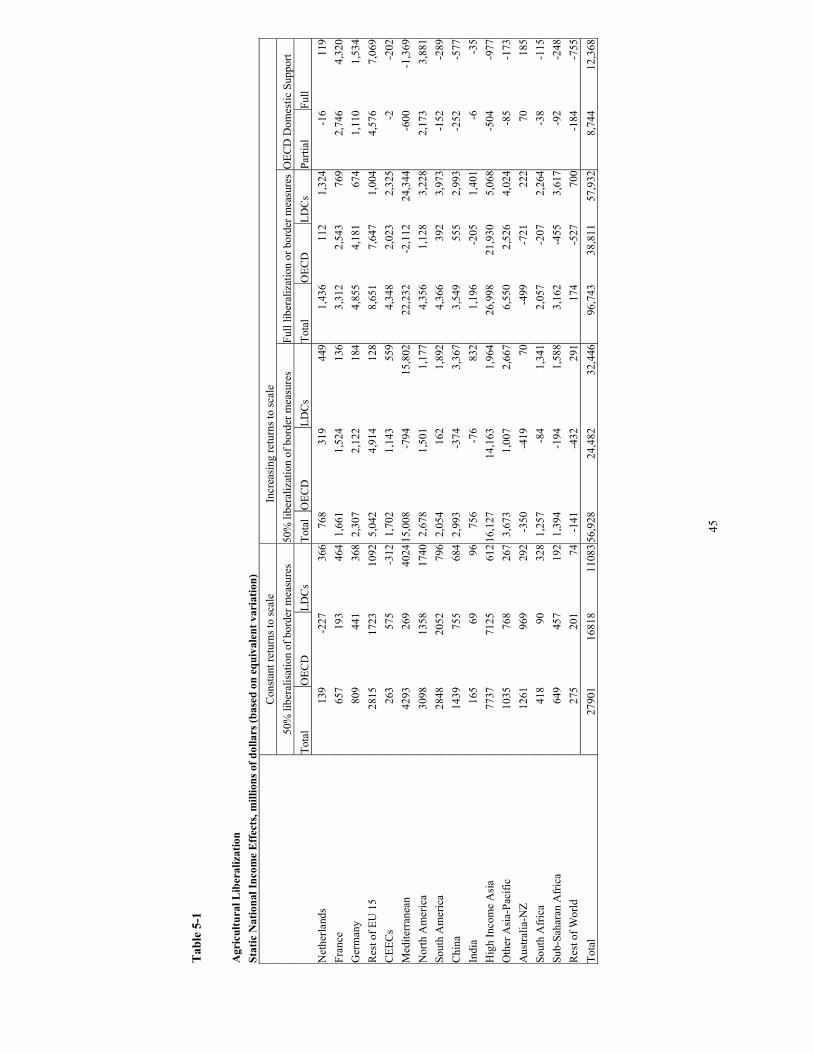
45
Tab
le 5
-1
Agr
icul
tura
l Lib
eral
izat
ion
Stat
ic N
atio
nal I
ncom
e E
ffec
ts, m
illio
ns o
f dol
lars
(bas
ed o
n eq
uiva
lent
var
iatio
n)
C
onst
ant r
etur
ns to
scal
e In
crea
sing
retu
rns t
o sc
ale
50
% li
bera
lisat
ion
of b
orde
r mea
sure
s 50
% li
bera
lizat
ion
of b
orde
r mea
sure
s Fu
ll lib
eral
izat
ion
or b
orde
r mea
sure
sO
ECD
Dom
estic
Sup
port
To
tal
OEC
D
LDC
s To
tal
OEC
D
LDC
s To
tal
OEC
D
LDC
s Pa
rtial
Fu
ll N
ethe
rland
s 13
9-2
2736
676
831
9 44
91,
436
112
1,32
4-1
611
9 Fr
ance
65
719
346
41,
661
1,52
4 13
63,
312
2,54
376
92,
746
4,32
0 G
erm
any
809
441
368
2,30
72,
122
184
4,85
54,
181
674
1,11
01,
534
Res
t of E
U 1
5 28
1517
2310
925,
042
4,91
4 12
88,
651
7,64
71,
004
4,57
67,
069
CEE
Cs
263
575
-312
1,70
21,
143
559
4,34
82,
023
2,32
5-2
-202
M
edite
rran
ean
4293
269
4024
15,0
08-7
94
15,8
0222
,232
-2,1
1224
,344
-600
-1,3
69
Nor
th A
mer
ica
3098
1358
1740
2,67
81,
501
1,17
74,
356
1,12
83,
228
2,17
33,
881
Sout
h A
mer
ica
2848
2052
796
2,05
416
2 1,
892
4,36
639
23,
973
-152
-289
C
hina
14
3975
568
42,
993
-374
3,
367
3,54
955
52,
993
-252
-577
In
dia
165
6996
756
-76
832
1,19
6-2
051,
401
-6-3
5 H
igh
Inco
me
Asi
a 77
3771
2561
216,
127
14,1
63
1,96
426
,998
21,9
305,
068
-504
-977
O
ther
Asi
a-Pa
cific
10
3576
826
73,
673
1,00
7 2,
667
6,55
02,
526
4,02
4-8
5-1
73
Aus
tralia
-NZ
1261
969
292
-350
-419
70
-499
-721
222
7018
5 So
uth
Afr
ica
418
9032
81,
257
-84
1,34
12,
057
-207
2,26
4-3
8-1
15
Sub-
Saha
ran
Afr
ica
649
457
192
1,39
4-1
94
1,58
83,
162
-455
3,61
7-9
2-2
48
Res
t of W
orld
27
520
174
-141
-432
29
117
4-5
2770
0-1
84-7
55
Tota
l 27
901
1681
811
0835
6,92
824
,482
32
,446
96,7
4338
,811
57,9
328,
744
12,3
68

46
Tab
le 5
-2
Man
ufac
turi
ng T
ariff
Red
uctio
ns
Stat
ic N
atio
nal I
ncom
e E
ffec
ts, m
illio
ns o
f dol
lars
(bas
ed o
n eq
uiva
lent
var
iatio
n)
C
onst
ant r
etur
ns to
scal
e In
crea
sing
retu
rns t
o sc
ale
50
% li
bera
lisat
ion
of b
orde
r mea
sure
s50%
libe
raliz
atio
n of
bor
der m
easu
res F
ull l
iber
aliz
atio
n or
bor
der m
easu
res
To
tal
OEC
D
LDC
s To
talO
ECD
LD
Cs
Tota
l O
ECD
LD
Cs
Net
herla
nds
303
-178
481
947
-18
965
1,58
6-3
151,
901
Fran
ce
981
-134
1115
2,18
938
61,
803
4,64
943
14,
218
Ger
man
y 19
10
-125
2035
3,39
732
23,
075
6,00
2-7
196,
721
Res
t of E
U 1
5 26
89
-964
3653
7,36
753
46,
833
12,0
18-2
,016
14,0
33C
EEC
s -3
418
-215
9-1
259
4,10
22,
118
1,98
4 12
,755
6,71
56,
040
Med
iterr
anea
n 18
9 13
62-1
173
-1,1
331,
310
-2,4
43
-3,2
062,
186
-5,3
92N
orth
Am
eric
a 54
3 -3
917
4460
13,2
262,
590
10,6
36
22,1
0454
821
,556
Sout
h A
mer
ica
203
1088
-885
-2,4
5083
9-3
,289
-7
,286
1,76
5-9
,051
Chi
na
1477
41
75-2
698
-23,
717
-9,4
44-1
4,27
3 -3
7,82
6-1
0,39
8-2
7,42
8In
dia
357
548
-191
-499
427
-926
-3
,991
778
-4,7
69H
igh
Inco
me
Asi
a 96
42
2088
7554
22,8
598,
473
14,3
86
37,6
6911
,327
26,3
43O
ther
Asi
a-Pa
cific
16
01
3140
-153
93,
244
2,32
092
4 1,
701
3,93
2-2
,231
Aus
tralia
-NZ
-169
-1
9829
787
130
657
704
-471
1,17
4So
uth
Afr
ica
240
9414
662
124
837
3 1,
013
446
567
Sub-
Saha
ran
Afr
ica
-128
75
-203
-156
242
-398
-5
7445
2-1
,026
Res
t of W
orld
12
14
727
487
3,50
31,
579
1,92
4 6,
928
2,70
54,
222
Tota
l 17
634
5622
1201
2
34,2
8712
,057
22,2
30
54,2
4717
,367
36,8
80

47
Tab
le 5
-3
Serv
ices
Lib
eral
izat
ion
Stat
ic N
atio
nal I
ncom
e E
ffec
ts, m
illio
ns o
f dol
lars
(bas
ed o
n eq
uiva
lent
var
iatio
n)
C
onst
ant r
etur
ns to
scal
e In
crea
sing
retu
rns t
o sc
ale
50
% li
bera
lisat
ion
of b
orde
r mea
sure
s50%
libe
raliz
atio
n of
bor
der m
easu
res F
ull l
iber
aliz
atio
n or
bor
der m
easu
res
To
tal
OEC
D
LDC
s To
tal
OEC
D
LDC
s To
tal
OEC
D
LDC
s N
ethe
rland
s 98
6731
814
637
178
1,13
089
223
8Fr
ance
22
8122
1269
4,82
54,
576
249
2,80
22,
262
540
Ger
man
y 22
9622
2076
4,45
14,
431
20
4,41
24,
092
320
Res
t of E
U 1
5 79
858
721
12,
830
3,03
4-2
05
4,34
23,
390
953
CEE
Cs
172
193
-21
3,32
72,
623
704
970
623
347
Med
iterr
anea
n 63
655
878
2,86
32,
290
573
2,52
52,
146
379
Nor
th A
mer
ica
8742
8461
281
11,8
7214
,856
-2,9
85
16,2
6014
,805
1,45
6So
uth
Am
eric
a 20
2631
517
115,
556
1,28
84,
268
4,10
91,
258
2,85
2C
hina
79
327
951
44,
647
-1,5
966,
243
1,52
4-9
31,
617
Indi
a 19
5744
1913
21,6
01-1
9921
,800
4,
657
132
4,52
5H
igh
Inco
me
Asi
a 17
2215
7714
51,
444
2,67
0-1
,225
4,
257
3,96
029
7O
ther
Asi
a-Pa
cific
32
532
9-4
197
-1,3
001,
497
1,52
21,
252
270
Aus
tralia
-NZ
670
654
161,
541
1,61
2-7
1 1,
569
1,52
346
Sout
h A
fric
a 55
536
519
971
117
854
1,08
619
689
0Su
b-Sa
hara
n A
fric
a 10
273
2949
034
114
9 39
433
262
Res
t of W
orld
35
431
341
688
730
-42
1,49
31,
277
216
Tota
l 23
527
1791
856
0968
,116
36,1
0932
,007
53
,053
38,0
4615
,007

48
Tab
le 5
-4
Tra
de fa
cilit
atio
n St
atic
Nat
iona
l Inc
ome
Eff
ects
, mill
ions
of d
olla
rs (b
ased
on
equi
vale
nt v
aria
tion)
Con
stan
t ret
urns
to sc
ale
Incr
easi
ng re
turn
s to
scal
e
50%
libe
ralis
atio
n of
bor
der m
easu
res5
0% li
bera
lizat
ion
of b
orde
r mea
sure
s Ful
l lib
eral
izat
ion
or b
orde
r mea
sure
s
Tota
l O
ECD
LD
Cs
Tota
lOEC
D
LDC
s To
tal
OEC
D
LDC
s N
ethe
rland
s 10
58
944
114
1,43
61,
123
313
2,91
02,
314
596
Fran
ce
1858
16
7018
82,
183
1,85
832
5 4,
615
3,92
269
3G
erm
any
2607
23
6624
13,
475
2,70
976
6 7,
161
5,68
31,
478
Res
t of E
U 1
5 66
54
6050
604
8,18
86,
431
1,75
7 16
,462
13,2
013,
261
CEE
Cs
-13
84-9
71,
804
1,25
355
1 4,
576
3,10
81,
469
Med
iterr
anea
n 39
74
205
3769
4,30
568
13,
624
8,62
11,
248
7,37
3N
orth
Am
eric
a 10
952
9938
1014
14,1
5010
,857
3,29
3 27
,519
21,6
265,
893
Sout
h A
mer
ica
4863
94
639
174,
440
884
3,55
6 9,
365
1,80
07,
565
Chi
na
6046
13
9946
47-1
,675
-775
-900
3,
097
682
2,41
5In
dia
1197
28
890
91,
189
320
869
2,42
464
91,
775
Hig
h In
com
e A
sia
1455
6 13
622
934
19,7
5515
,419
4,33
6 37
,790
30,6
867,
104
Oth
er A
sia-
Paci
fic
5451
11
4643
057,
545
2,24
65,
299
15,3
204,
516
10,8
04A
ustra
lia-N
Z 13
43
1271
721,
348
1,07
727
1 2,
589
2,13
445
5So
uth
Afr
ica
638
135
503
799
198
601
1,62
540
11,
223
Sub-
Saha
ran
Afr
ica
868
9077
81,
052
178
874
2,34
239
51,
947
Res
t of W
orld
11
05
1050
552,
315
1,69
861
7 4,
454
3,32
41,
130
Tota
l 63
157
4120
421
953
72
,311
46,1
5926
,152
15
0,87
095
,690
55,1
79

49
Figure 5-1
Unskilled wages, percent change
-20.00 -10.00 0.00 10.00 20.00 30.00 40.00
Netherlands France Germany Rest of EU 15 CEECs Mediterranean North America South America China India High Income Asia
Other Asia-Pacific
Australia-NZ South Africa Sub-Saharan Africa
Rest of World
experiment 3 long-runexperiment 3 short-runexperiment 2 long-runexperiment 2 short-runexperiment 1 long-runexperiment 1 short-run

50
Figure 5-2
Exports, percent change
-20.00 0.00 20.00 40.00 60.00 80.00 100.00 120.00 140.00 160.00
Netherlands
France
Germany
Rest of EU 15
CEECs
Mediterranean
North America
South America
China
India
High Income Asia
Other Asia-Pacific
Australia-NZ
South Africa
Sub-Saharan Africa
Rest of World
experiment 3 long-runexperiment 3 short-runexperiment 2 long-runexperiment 2 short-runexperiment 1 long-runexperiment 1 short-run

51
5.2 Results for the (enlarged) European Union
The European Union is a customs union, with a common external tariff against
supplies from third countries, and practically zero tariffs within the union. Lower
external trade barriers affect producers and consumers in member states in two related
ways. First there is the direct boost to competition on home markets through improved
market access for suppliers from outside the European Union. Second, the relative
position of suppliers within the EU might change. The formation of the EU customs
union leads, by definition, to trade preferences amongst the members of the free trade
area. As a consequence the share of trade that is within the EU (intra-EU trade) is
typically biased upward, and trade within the EU is larger than might be expected on
the basis of geographic proximity and other trade promoting factors alone. With the
recent eastward enlargement the preferences are extended from the current 15 EU
members to the new member states.6 Recall that the enlargement process has been
incorporated in our baseline scenario.
The lowering of external trade barriers by the EU will inevitably lead to the
erosion of the intra-EU trade preferences. Suppliers with lower cost will be able to
enter the EU markets once the tariff barriers have come down that currently shield
domestic producers from foreign competition. Consequently, we can expect the
current bias towards intra-EU trade to be reduced. Table 5-5 nicely illustrates this
effect by breaking down the simulated change in EU27 import values for one of the
more modest liberalisation scenarios.
The 2% growth in EU27 exports is small compared to the 12% growth in
world trade. A first driver of this result is that EU countries mostly trade amongst
themselves. The benefits from removing the intra-EU barriers have already been
6 Our simulations include all 12 accession candidates newcomers, i.e. we also include Bulgaria and Romania, although these two countries will not enter the EU with the first wave of new member countries.

52
realised in the past and there are no additional gains for intra-EU trade in a new WTO
round. A second driver of this result is the increased competition from non-EU
countries on EU markets. Simulated intra-EU27 trade shrinks by -6% as other
suppliers enter the EU markets.
Table 5-5: Percent change in value of bilateral exports (f.o.b.), linear 50% cuts (*) from to EU27 LDCs Other Total exports
EU27 -6 21 13 2(4)
LDCs 30 39 25 30(38)
Other 12 26 8 14(15)
Total imports 3 (5)
28 (35)
14(15)
12(15)
Source: Model simulations. Note: (*) Short run results with scale economies. Long run results in brackets.
The most impressive growth in markets share is realized by suppliers from
LDCs, who are simulated to expand their exports to the EU by 30%, compared to the
12% increase of imports from other developed countries.
Because there is no positive growth to be expected from intra-EU trade,
European exports can only by increased by expansion in non-EU markets. Exports to
LDCs grow with 21% and exports to the other regions grow with 13%. Although
these growth figures are high, this is insufficient to significantly boost total exports as
their weight in total EU27 exports is limited.
LDCs obtain the highest growth in exports (30%). They are simulated to
expand exports to all destinations, but the largest trade surge is observed for intra-
LDC trade. Global trade creation in this experiment amounts to 12% in short run and
15% in long run. While the trade increase materialises already in the short run for the
EU and other developed economies, LDCs see even larger growth in their exports in
the longer term. Dynamic capital accumulation enables them to specialise more in
exportable goods.

53
Figu
re 5
-3: P
erce
ntag
e ch
ange
in E
U27
impo
rts b
y so
urce
(50%
line
ar c
uts i
n ta
riff
s and
dom
estic
agr
icul
tura
l sup
port
)
-50%
0%50
%10
0%15
0%20
0%
Cer
eals
Hor
ticul
ture
Suga
r
Inte
nsiv
e liv
esto
ck
Cat
tle
Dai
ry
Oth
er a
gric
ultu
re
Proc
esse
d fo
ods
Text
iles
and
clot
hing
Extra
ctio
n
Che
mic
als
Met
al a
nd e
lect
roni
c eq
uip
Oth
er in
dust
ry
Trad
e
Tran
spor
t and
logi
stic
s
Busi
ness
ser
vice
s
Oth
er s
ervi
ces
Tota
l im
ports
EU
26
Oth
erLD
Cs
Intra
EU
27
Sour
ce: M
odel
sim
ulat
ions

54
Figu
re 5
-4: P
erce
ntag
e ch
ange
in E
U27
exp
orts
by
dest
inat
ion
(50%
line
ar c
uts i
n ta
riffs
and
dom
estic
agr
icul
tura
l sup
port
)
-50%
0%50
%10
0%15
0%20
0%
Cere
als
Horti
cultu
re
Suga
r
Inte
nsiv
e liv
esto
ck
Cattl
e
Dairy
Oth
er a
gric
ultu
re
Proc
esse
d fo
ods
Text
iles
and
clot
hing
Extra
ctio
n
Chem
ical
s
Met
al a
nd e
lect
roni
c eq
uip
Oth
er in
dust
ry
Trad
e
Tran
spor
t and
logi
stic
s
Busi
ness
ser
vice
s
Oth
er s
ervi
ces
Tota
l exp
orts
EU2
6
Oth
er
LDCs
Intra
EU2
7
Sour
ce: M
odel
sim
ulat
ions

55
On balance, imports into the EU increase slightly faster than exports. What
does this imply for individual industries in the European Union? A rise of imports in
some highly protected sectors is to be expected. The pre-simulation landscape of
import tariffs shows that the average import barriers for agricultural products (cereals,
sugar, cattle, dairy and processed food) and textiles are the highest. Figure 5-3 shows
that simulated imports rise as expected for these industries. The import growth for
sugar and dairy is lower than might be expected on the basis of the initial import
protection. This is caused by the output quota system, which limits the production
decline as long as there are positive quota rents. The immediate impact of increased
import competition is lower quota rents, and therefore lower internal EU prices.
Production would only fall dramatically if quota rents were fully eroded, and this is
not the case in our simulations. The lower internal prices make EU a less attractive
export destination, and hence imports raise less than expected.
The pre-simulation landscape of import tariffs also shows that average barriers
encountered on EU exports are sometimes higher than the barriers erected by the EU
(Figure 5-5). Hence, we can expect a growth of extra-EU exports to some
destinations. Export growth may even occur for agricultural exports that are currently
subject to export subsidies, which we reduce in the liberalisation scenario.
Remarkable is the surge of trade in processed food. While it is consistent with
recent empirical observations on the shifting composition of agri-food trade towards
more trade in processed products (Hertel et al, 1999, Berkum and van Meijl, 2001),
the explanation of this simulation result can be found in the data modelling
assumptions.
Figure 5-5 shows that the average tariff on processed food in the EU27 equals
a significant 23% of the value of the product. But also processed food products

56
exported from the EU have to climb an even higher barrier: 33%. Consequently, a
simulated tariff reduction of 50% leads to a notable reduction of import prices, both in
the EU as elsewhere. Another factor contributing to the expansion of trade is the
assumption of scale economies in the processed food industry. Scale economies tend
to promote more regional specialisation, and therefore they lead to more trade. As
production is more concentrated in certain regions, rather than being spread out over
diverse locations each serving a relatively narrow home market, more trade between
regions will occur. An export-oriented region, with an existing specialisation in this
sector can be expected to see food processing activities expanding. Within the EU this
leads to the Netherlands, and to a lesser extent France, to expand in processed foods,
while other EU regions see a slight contraction of the industry (Table 5-6). Other
regions seeing an expanding food processing industry are South America and
Australia-New Zealand. All these regions have already a comparative advantage in
processed food (see Annex Table A-3, where the self-sufficiency indicator may be
seen as an indicator of comparative advantage) and protection encountered on their
exports is relatively high (see Annex Tables A-1 and A-2). An expanding processed
food sector stimulates both domestic production and imports of primary agriculture
from LDCs.

57
Figure 5-5: Average import tariffs (%) on extra-EU trade (base situation)
Source: GTAP database, author’s calculations Note: Tariffs are given as trade-weighted averages of ad valorem tariff equivalents.
Trade (both exports and imports) between the EU and LDCs is growing
relatively faster in our experiments than trade with developed countries. Already low
trade barriers amongst OECD countries explain this. An interesting case is Textile and
Clothing. Recall that our experiment assumes that MFA is already phased out (this is
part of the baseline simulation), and the trade liberalisation experiment subsequently
lowers the import tariffs on textiles and clothing. This greatly boosts exports from
LDCs into the EU, and it crowds out the imports from developed economies.
The services industries are the only sub sector within the EU that does not see
intra-trade shrinking. Especially transport services display positive growth rates in
wake of rising trade volumes.
The greater openness to imports and the opening of new export opportunities
for products form the EU has some consequences for the development of output.
These output developments are triggered on the one hand by trade developments
0102030405060708090
Cereals
Horticu
lture
Sugar
Inten
sive l
ivesto
ckCatt
leDair
y
Other a
gricu
lture
Proces
sed f
oods
Textile
s
Extrac
tion
Chemica
ls
Metal a
nd el
ec
Other in
dustr
yTrad
e
Transp
ort
Busine
ss se
rv
Other s
ervice
s
Averag
e
Tariff on imports to EU
Tariff encounterd on exports from EU

58
induced by reduction in trade protection and, on the other hand, by the importance of
international trade in sales. Only when a relatively large share of domestic production
is exported, does export growth coincide with growth in production. Table 5-6 shows
the percent change in output for the EU regions. As can be expected from the initial
high protection on agricultural products, output developments for cereals are negative
for all EU countries. Those EU members that rely heavily on imports and face heavy
import competition, such as Germany, Rest EU15 and especially the Netherlands (see
self-sufficiency index in Annex table A-3), witness the highest reduction in
production. Production in France is decreasing as it faces stiffer competition on EU
markets. For the Central and Eastern European countries production is almost
unaltered because they are self-sufficient and an increase in trade does not change
domestic production. The cattle and beef sector in the EU declines due to increased
imports from especially South America and NAFTA. Production in the quota
regulated dairy and sugar sectors does not change in the EU regions because
production stays on quota and quota rents decline but remain positive. The
development in production of processed food is explained before. The big net
exporters within the EU, France and especially the Netherlands, increase output while
output contracts in the other regions.
Textile production in the EU decreases due to increased import competition
from China and India. This is especially affecting the only big net exporting textile
producer within the enlarged EU, Central and Eastern European Countries (CEEC),
whose production declines with 36%. However, we have to be aware that the
enlargement impact is already part of the baseline. During the enlargement process
textile production in CEEC countries expanded rapidly, driven by increased exports to
the EU15 countries. The new WTO round erodes the preferences associated wit EU

59
membership reduces and therefore reverses the process. A similar observation could
be made for textile and clothing imports from Turkey, which currently enjoys
preferential access to EU markets.
Table 5-6: Percent change output (volume index), linear 50% cuts
Netherlands France Germany Rest of EU15 CEEC candidate countries
Cereals -19 -10 -12 -12 2Horticulture -1 4 4 4 2Sugar 0 0 0 0 -4Intensive livestock 1 2 -1 1 1Cattle -2 -8 -5 -8 0Dairy 0 0 0 0 3Other agriculture 0 2 0 0 6Processed foods 8 3 -3 -1 1Textiles 7 -11 -24 -26 -36Extraction -2 -3 -1 -2 6Chemicals -2 0 -1 -1 2Metal and elec -15 1 1 -1 454Other industry -2 1 -2 0 47Trade 0 0 0 0 3Transport 18 1 0 5 17Business serv 0 -1 0 0 4Other services 0 0 0 0 3Source: Model simulations.
For manufacturing and services, we simulate rather limited production
responses within the EU. Small production effects are observed for trade services,
business services and other services. Although these sectors obtain a positive growth
in their exports, this does not significantly influence their production because these
services are still predominantly operating at the national level. Their exports and
imports form are a relatively small share of production (Their self-sufficiency
indicator equals about 1 for all services sectors in every EU region).
An exception is transport and logistics, where we observe notable production
increases within the EU due increased trade volumes. The transport and logistics

60
sector facilitates the shipment and distribution of larger trade volumes. Production
expands especially in the Netherlands.
Within manufacturing the only big change in production is in the Metal and
electro technical industries, which contract in the Netherlands and expand in CEECs.
One should not overestimate the effect in CEECs. The sector in the CEECs is very
small and it partly recovers from the simulated production slump during the
enlargement process. The case for the Netherlands will be explained in the next
chapter.

61
5.3 Results for the Netherlands
Sectoral effects of liberalisation basically follow existing specialisation patterns,
as discussed in chapter three. Changes in export values (Table 5-7) reveal that the
processed foods industry and services are able to significantly expand their exports,
while manufacturing industries and agriculture, except dairy, clearly experience
tougher international competition. We have already elaborated in the previous section
on the shrinking intra-EU trade, which accounts for about three quarters of Dutch
exports. While the European integration has created preferential trade amongst EU
members, this advantage is eroded in the process of multilateral trade liberalisation.
However, the diversion effects are not large, since in general, OECD tariffs on
manufactures have already come down to low levels during the past decades, and
current barriers on Dutch exports are already low. As a consequence of less trade with
EU members, most products can only increase their exports by finding new markets
outside the EU. The scope for such compensation is, however, limited to a few sectors
and regions.
We find that export growth is a main driver for output growth in the following
sectors:
• Processed food: the sector is highly dependent on exports and currently
encounters relatively high barriers on its export markets. Hence lower barriers
enable the sector to gain better access to export markets, which allows
utilisation of returns to scale.
• Transport services: the sector benefits from global trade expansion. It also
benefits from lowering of currently high barriers in other countries. This
provides improved access for Dutch companies in foreign markets.

62
Other sectors are not simulated to expand their production to a significant extent,
or are even contracting (Figure 5-6 and Table 5-9). This is explained by the current
specialisation patterns as measured by the self-sufficiency index7 (Figure 5-7). Those
products where The Netherlands imports a large share of domestic consumption, such
as in the metal and electrotechnical sector have a self-sufficiency ratio below one.8
Here, we observe an intensified competition with foreign suppliers and an increase in
imports as trade barriers into the EU are lowered. As Dutch firms find it more difficult
to realize enough sales volumes within the EU, they have to contract output and they
are less able to exploit economies of scale (Comparing the second and third column in
Table 5-9 highlights the importance of scale economies). As a consequence, their
average cost rise relative to international competitors. This can be seen as a
continuation of the trend of increasing imports from High Income Asia (Taiwan,
South Korea), but also from the upcoming Asian economies, such as China and
Vietnam. With lower external protection of the EU, the slight tariff advantage for
Dutch producers on the EU market vanishes. This in turn, implies that Dutch
producers in the metal and electrotechnical industries find it increasingly difficult to
realize their economies of scale, and consequently their competitive position is
eroding. To a lesser extent this reasoning also holds in the chemical industries,
extraction - and other industries.
7 Self-sufficiency is defined as the ratio of domestic production over domestic absorption.
8 In chapter three we have discussed the issue of re-exports, which is an important phenomenon in Dutch international trade. In our model re-exports are approximated by the share of imports that goes directly to the exporting industry. For example the share of MELE imports that is directly delivered to the Dutch MELE industry equals 80%. Apart from imports of machine parts these imports can be assumed be re-exported after minimal processing.

63
On the other hand, we have the processed food industry and transport services.
These are clear net-export products, where self-sufficiency exceeds one, and which
are able to expand production. In the processed food industries this is driven by export
growth which materializes as barriers to Dutch exports come down. This enables the
industry to expand production and to realize further scale economies. In the transport
services, the main driver is expansion of trade volumes.
The middle ground is occupied by those sectors where the Netherlands is
approximately self-sufficient in production, i.e. where trade does not play a large role.
Here, we cannot expect a large impact from improved market access. The share of
exports in sales is simply too low to yield a huge production impact from export
growth. This is true a fortiori for services. While their simulated export growth rates
are positive, and their contribution to the trade balance rises, the current low share of
international trade yields only a minor impact on domestic production. For example,
business services are simulated to expand their sales into South America and Asia
Pacific, by respectively 4% and 5.5% in the case of a halving of trade barriers, but this
is insufficient to compensate for the loss of sales into EU markets.
There is another factor that contributes to the limited export expansion in
services, and indeed in other labour intensive sectors. Real wages in the Netherlands
are simulated grow slightly faster under the liberalisation experiments than in the
neighbouring countries. This is related to the great expansion of the food processing
and transport sectors, which tend to absorb increasing amounts of labour.
Consequently economy-wide wages and household incomes are simulated to rise. At
the same time this positive income effect translates into slight price rises for the
products of labour intensives sectors, such as services. While the terms of trade
improve, that is one unit of a commodity produced in The Netherlands earns more on

64
the export market than before liberalisation, it becomes harder to compete
internationally.
Figure 5-6: Simulated output effects, The Netherlands (% change, linear 50% cuts)
-25-20-15-10-505
101520
Cereals
Horticu
lture
Sugar
Inten
sive l
ivesto
ckCatt
leDair
y
Other a
gricu
lture
Proces
sed f
oods
Textile
s
Extrac
tion
Chemica
ls
Metal a
nd el
ec
Other in
dustr
yTrad
e
Transp
ort
Busine
ss se
rv
Other s
ervice
s
Source: model simulations
Figure 5-7: Self-sufficieny ratios, The Netherlands (base situation)
00.20.40.60.8
11.21.41.61.8
Cereals
Horticu
lture
Sugar
Inten
sive l
ivesto
ckCatt
leDair
y
Other a
gricu
lture
Proces
sed f
oods
Textile
s
Extrac
tion
Chemica
ls
Metal a
nd el
ec
Other in
dustr
yTrad
e
Transp
ort
Busine
ss se
rv
Other s
ervice
s
Source: GTAP v5, calculations LEI,
Note: self-sufficiency is defined as the ratio of domestic production over domestic absorption

65
It is often believed that trade liberalisation and limits to domestic agricultural
support under WTO disciplines would threaten the agricultural sector in The
Netherlands. The findings obtained from the simulations do not support such
pessimism in general. In this regard, our findings are in line with a recent report by
the Dutch Ministry of Agriculture Nature Management and Fisheries (Meester and
Massink, 2002). The EU CAP is predominantly supporting agricultural activities that
do not play an important role in the Dutch agri-food complex (cereals, oilseeds, beef).
Indeed, our simulations show a decline in those sectors, in the wake of domestic
liberalisation, but this decline is not dramatic. Dutch dairy producers appear to be still
quota constraint, even in the radical liberalisation scenario. If the quota were removed,
and if no environmental restrictions become binding, Dutch dairy production could
grow in the long run. Even the heavily protected sugar crop remains to be profitably
included in the cropping plan. With cereals becoming the less attractive crop, farmers
are simulated to switch to sugar to some extent, in spite of quota rents to be reduced.
This is not to say that the sugar trade balance will not deteriorate under the various
scenarios. In fact, imports are rising significantly in all agricultural sectors, where
import barriers are reduced the most. However, scale economies are less relevant in
agricultural sectors and this tends to lead to smaller regional specialisation tendencies
and output changes as compared to manufacturing sectors.
For the horticultural sector (food and non-food) we find that the deeper the
liberalisation, and the longer the time perspective, the more positive are the growth
prospects. Here, the effects are mainly of an indirect nature, since the trade barriers
are already quite low.
Although not apparent from our discussion so far, the simulation results also
indicate that the Dutch economy stands to gain from eastward enlargement of the EU.

66
Since enlargement precedes the implementation of the next global trade liberalisation
round, Dutch firms can take advantage of the trade preferences within the enlarged
EU. A pro-active stance will enable Dutch firms to create a foothold in a growing
market.9 A similar conclusion is reached by CPB (2001c).
Static national income effects for the Netherlands can be substantial and range
from 1% to 2% of base GDP (roughly 4 to 7.5 billion USD per year), depending on
the size of the cuts and assumptions on scale economies (Table 5-10). These income
gains translate into substantial gains in the order of magnitude of several hundred
euros per (current) Dutch household. The Netherlands benefits more from trade
liberalisation than can be expected on the basis of its share in world GDP. In other
words, its share in the global income gains (roughly 2%) exceeds its share in world
GDP (1.2%).
The large contributors to this result are services liberalisation and trade
facilitation. This is not surprising, since trade facilitation will tend to support the
logistic and distribution function in The Netherlands.
9 Recall that our baseline simulation includes EU enlargement. In the baseline, Dutch exports to CEECs grow with double-digit figures in all sectors except cereals, sugar and textiles.

67
Tab
le 5
-7: P
erce
nt c
hang
e in
dol
lar
valu
e of
exp
orts
sh
ort-r
un
long
-run
vxw
fob[
*NLD
] lin
ear
50%
ta
riff c
uts
Swis
s fo
rmul
a fo
r ta
riffs
, 50
%
for
othe
r ba
rrier
s fu
ll lib
eral
izat
ion
linea
r 50
%
tarif
f cut
s
Swis
s fo
rmul
a fo
r ta
riffs
, 50
%
for
othe
r ba
rrier
s fu
ll lib
eral
izat
ion
Cer
eals
-3
-0.2
-4.3
24.
62.
4H
ortic
ultu
re
-2.4
-1.3
0.8
0.9
1.9
5.4
Suga
r -7
.4-5
.6-1
0.6
-4.5
-2.5
-7.5
inte
nsiv
e liv
esto
ck
1.4
1.9
3.7
44.
47.
7C
attle
4.
54.
17
66.
18.
9D
airy
7.
615
.924
.59.
417
.926
.8ot
her a
gric
ultu
re
-2-2
-1.8
1.7
2.4
1.7
proc
esse
d fo
ods
21.1
25.5
50.8
24.4
28.4
53.9
text
iles
& cl
othi
ng
9.1
1-2
95.3
105.
928
.3Ex
tract
ion
-3.8
-3.6
-6.6
0.3
0.1
-1.7
Che
mic
als
-2.4
-1.9
-4.7
-1-0
.6-2
.5m
etal
s an
d el
ectri
cal m
achi
nery
-1
3.7
-14
-33.
6-1
4.2
-16
-27.
9ot
her i
ndus
try
-1.8
-1.5
-2.5
-1.8
-2.4
-0.6
trade
(who
lesa
le, r
etai
l) 2.
72.
55.
37.
25.
713
trans
port
and
logi
stic
s 28
.124
.465
30.1
28.8
64.7
busi
ness
ser
vice
s 1.
92
4.7
2.7
2.9
5ot
her s
ervi
ces
5.5
5.6
127.
57.
614
.5So
urce
: mod
el si
mul
atio
ns.

68
Tab
le 5
-8:
Perc
ent c
hang
e in
the
dolla
r va
lue
of im
port
s by
sect
or, N
ethe
rlan
ds
sh
ort-r
un
long
-run
Vxw
cif
linea
r 50
%
tarif
f cut
s
Swis
s fo
rmul
a fo
r ta
riffs
, 50
%
for
othe
r bar
riers
fu
ll lib
eral
izat
ion
linea
r 50
%
tarif
f cut
s
Swis
s fo
rmul
a fo
r ta
riffs
, 50
%
for
othe
r bar
riers
fu
ll lib
eral
izat
ion
C
erea
ls
1417
3118
2036
Hor
ticul
ture
3
510
78
15Su
gar
1426
4124
3554
inte
nsiv
e liv
esto
ck
66
139
917
Cat
tle
1220
3815
2443
Dai
ry
814
2212
1827
othe
r agr
icul
ture
2
36
67
11pr
oces
sed
food
s 29
3287
3235
93te
xtile
s &
clot
hing
1
03
98
8Ex
tract
ion
-4-4
-8-1
-1-3
Che
mic
als
-1-1
-21
11
met
als
and
elec
trica
l mac
hine
ry
-1-1
-31
01
othe
r ind
ustry
2
24
43
7tra
de (w
hole
sale
, ret
ail)
10
1-2
-1-2
trans
port
and
logi
stic
s -2
-1-4
00
-1bu
sine
ss s
ervi
ces
11
14
47
othe
r ser
vice
s 3
36
54
9So
urce
: mod
el si
mul
atio
ns.

69
Tabl
e 5-
9: P
erce
nt c
hang
e in
out
put b
y se
ctor
, Net
herla
nds
Sh
ort r
un
long
-run
long
-run
C
onst
ant r
etur
ns to
sca
leIn
crea
sing
retu
rns
to s
cale
Incr
easi
ng re
turn
s to
sca
le
Qo_
lrge[
*NLD
] lin
ear 5
0% ta
riff c
uts
linea
r 50
%
tarif
f cu
ts
Swis
s fo
rmul
a fo
r ta
riffs
, 50
%
for
othe
r bar
riers
fu
ll lib
eral
izat
ion
linea
r 50
%
tarif
f cut
s
Swis
s fo
rmul
a fo
r ta
riffs
, 50
% f
or o
the r
ba
rrier
s fu
ll lib
eral
izat
ion
Cer
eals
-3
0.4
-18.
6-1
6.8
-29.
7-1
5.8
-14.
3-2
6.5
Hor
ticul
ture
-3
-0.9
0.1
1.1
1.6
2.4
4.4
Suga
r 0
00
00
00
inte
nsiv
e liv
esto
ck
-11
1.4
1.8
3.5
3.7
5.6
Cat
tle
-11.
6-1
.8-3
.8-7
.5-0
.2-2
.1-5
.7D
airy
0
00
00
00
othe
r agr
icul
ture
-0
.1-0
.2-0
.1-0
.71.
61.
81.
3pr
oces
sed
food
s 0.
47.
89.
916
.510
.212
18.9
text
iles
& cl
othi
ng
-2.7
7.1
-0.1
-4.1
88.7
98.9
25.1
Extra
ctio
n -0
.9-1
.7-1
.5-3
0.3
0.2
-0.2
Che
mic
als
-0.3
-2-1
.6-3
.7-0
.4-0
.2-1
.2m
etal
s an
d el
ectri
cal m
achi
nery
-1
.2-1
4.9
-14.
8-3
5.1
-15.
4-1
6.9
-29.
6ot
her i
ndus
try
-0.3
-2.2
-1.6
-4.3
-1.1
-1-1
.5tra
de (w
hole
sale
, ret
ail)
0-0
.1-0
.1-0
.62
1.8
3.2
trans
port
and
logi
stic
s 4.
118
.415
.842
.720
.419
.343
.8bu
sine
ss s
ervi
ces
-0.1
-0.1
00
1.2
1.2
2O
ther
ser
vice
s 0.
10.
30.
40.
42.
42.
44.
1

70
Table 5-10: National income effects, based on equivalent variation
TOTAL as % ofGlobal income effects
TOTAL as % of base GDP
TOTAL as dollar per household
TOTAL as dollar per person
TOTAL, USD mil.
Short run, static IRTS Linear 50% cuts 1.8% 1.1% 572 245 3 889Swiss formula cuts 1.7% 1.1% 556 238 3 779Full liberalisation 1.9% 2.1% 1109 476 7 544Source: model simulations.

71
6 References
Balassa, B. (1965), Trade liberalisation and revealed comparative advantage,
Manchester School of Economics and Social Studies, 33:2: pp. 99-123.
Baldwin, R.E. and J. Francois, "Is it time for a TRAMP? Quantitative perspectives on
transatlantic liberalization," in O.G.Mayer abd H-E Scharrer, eds., Transatlantic
Relations in a Global Economy, Hamburg: Nomos Verlagsgesellschaft, ISBN: 3-
7890-5935-8, 1999, pp. 69-77.
Baumol, W.J, S.A. Batey Blackmasn and E.N. Wolff (1989), Productivity and
American leadership. The Long view. Cambridge Ma.: The MIT Press.
Blackhurst, R., A. Enders and J.F. Francois, (1996)"The Uruguay Round and market
access: opportunities and challenges for developing countries," in W. Martin and A
Winters, eds., The Uruguay Round and Developing Countries, Cambridge University
Press, Cambridge.
Centraal Planbureau, (2001a), Reexports and the Dutch market position, The Hague:
CPB Report 2001/4.
Centraal Planbureau, (2001b), Macro-economische verkenning 2002, The Hague:
CPB.
CPB (2001c), EU elnlargement: economic implications for countries and industries,
The Hague: CPB report 011 (September).
Commission of the European Communities (1988), The Cost of Non-Europe,
Brussels.
Decomposing simulation results with respect to exogenous shocks, Computational
Economics, Vol. 15 (2000), pp. 227-249 (with W. Jill Harrison and J. Mark Horridge).
72
Dimaranan, B. V. and R. A. McDougall, (2002). Global Trade, Assistance, and
Production: The GTAP 5 Data Base, Center for Global Trade Analysis, Purdue
University.
Economic Planning Agency (1997), "Economic Effects of Selected Trade Facilitation
Measures in APEC Manila Action Plan," mimeo prepared for APEC secretariat,
Japan.
European Commission (2002), WTO members’ requests to the EC and its member
states for improved market access for services. Consultation document, Brussels: EC.
DG-trade.
Francois, J.F., (2001), THE NEXT WTO ROUND: North-South stakes in new market
access negotiations , CIES Adelaide and the Tinbergen Institute, CIES: Adelaide,
ISBN: 0 86396 474 5.
Francois, J.F. and Martin, W. “Commercial policy variability, bindings, and market
access,” European Economic Review, forthcoming.
Hathaway, D. and Ingco, M. (1996), “Agricultural Liberalization under the Uruguay
Round.” In W. Martin and A. Winters, eds, The Uruguay Round and the Developing
Economies, Cambridge University Press: New York.
Helpman, E. and P. Krugman (1989), Trade policy and market structure, Cambridge,
MA.: MIT Press.
Hoekman, B. (1995), "Liberalizing trade in services," in W. Martin and A. Winters,
eds. The Uruguay Round and the Developing Economies, The World Bank discussion
paper 201.
Industry Commission (1995), "The Impact of APEC's Free Trade Commitment,"
IC95, Australia: Canberra.

73
Laird, S. (1998), ‘Multilateral Approaches to Market Access Negotiations,” WTO-
TPRD staff working paper TPRD-98-02, Geneva.
Massink H, G. Meester (2002), Boeren bij vrijhandel. De Nederlandse agrosector bij
handelsliberalisatie en EU-uitbreiding: een verkenning. Den Haag: Ministerie van
Landbouw Natuurbeheer en Visserij.
OECD (2001), Open services matter, Paris: OECD, Working party of the trade
committee, TD/TC/WP (2001)24/REV2.
OECD (2002), The Medium-term impact of trade liberalisation in OECD countries on
the food security of non-member countries, Joint working party on agriculture and trade,
Paris: OECD, COM/AGR/TD/WP(2001)74/FINAL.
Ottens, D. (2001), Sterke sectoren in Nederland, ESB, vol 86, no. 4302, p.296.
Tangermann, S. (1998), "Implementation of the Uruguay Round Agreement on
Agriculture by Major Developed Countries," in Uruguay Round Results and the
Emerging Trade Agenda, UNCTAD: Geneva.
Smith, M.A.M (1977), "Capital Accumulation in the Open Two-Sector Economy," The
Economic Journal 87 (June), 273-282.
Smith, M.A.M. (1976), "Trade, Growth, and Consumption in Alternative Models of
Capital Accumulation," Journal of International Economics 6, (November), 385-388.
Srinivasan, T.N. and J.N. Bhagwati (1980), "Trade and Welfare in a Steady-State,"
Chapter 12 in J.S. Chipman and C.P Kindelberger, eds., Flexible Exchange Rates and the
Balance of Payments, North-Holland Publishing.
United Nations Committee on Trade and Development (1994), "Columbus Ministerial
Declaration on Trade Efficiency."
74
Van Berkum, S., H. van Meijl (2001), The application of trade and growth theories to
agriculture: a survey, The Australian Journal of Agricultural and Resource
Economics, 44:4, pp. 505-542.
Van Hulst, N. and L. Soete (1989), Export en technologische ontwikkeling in de
industrie, in: Export, Koninklijke vereniging voor de Staathuishoudkunde,
Preadviezen 1989.
Van Meijl, H. and F.W. van Tongeren (2001), The Agenda 2000 CAP reform, world
prices and URAA GATT-WTO export constraints, European Review of Agricultural
Economics Vol. 29 (4) (2002) pp. 445-470.
Van Meijl, J.C.M. and F.W. van Tongeren (2001) Multilateral trade liberalisation and
developing countries: A North-South perspective on agriculture and processing sectors.
The Hague: LEI report 6.01.07 (July 2001)
Van Tongeren, F., H. van Meijl, Y. Surry, (2001) “Global models of trade in agriculture:
a review and assessment”, Agricultural Economics, Vol 26:2 : pp 149-172.
World Trade Organization, (2001). Ministerial Declaration, Ministerial Conference,
Fourth Session, Doha, 9-14 November 2001. Geneva: WTO, WT/MIN(01)/DEC/W/1


