

| [Presentation title] | [Client Name] | [Date] 1
Economic Indicators
Last update 20.1.2015
| Economic Indicators | 2
Economic Outlook Monthly Overview – January 2015
Europe:
• Consensus January GDP forecast for WE remained on 1,5% for 2015, for 2016 1,8% growth are
being forecasted.
• The EU industrial confidence decreased slightly in December while the consumer confidence
improved somewhat.
• The IFO Business Climate index for Germany rose in December– the dropping oil price and a
falling Euro exchange rate are seasonal gifts to the German economy.
• The Euro area remains beset by deflation. Still, the hope is, that the dramatic drop in oil prices
will give households a modest boost.
US:
• Consensus January GDP forecast for the US improved by 0,2%point to 3,2% for 2015, the
forecast for 2016 amounts to 2,8%.
• In Q3 2014 the economy expanded at a 5% pace, its fastest annualized increase in 11 years. The
drop in fuel prices is likely to continue supporting consumer expenditure in H1 2015, an improving
job market is also helping expectations. The strong USD and economic gloom in Europe could
affect exports but thus far it looks like the oil price effect is outweighing the external downturn.
Japan:
• The January GDP growth forecast for Japan remained stable on 1,2% for 2015, forecast for
2016 is 1,5%.
• Despite the economy plunging into recession in Q3 2014, the Japanese public backed Prime
Minister Shinzo Abe in December’s snap election. On the back of his triumph, the Japanese
leader announced a further Yen 3.5 tn stimulus package for the economy.
3 | Economic Indicators |
Eurostat Data
| Economic Indicators | 4
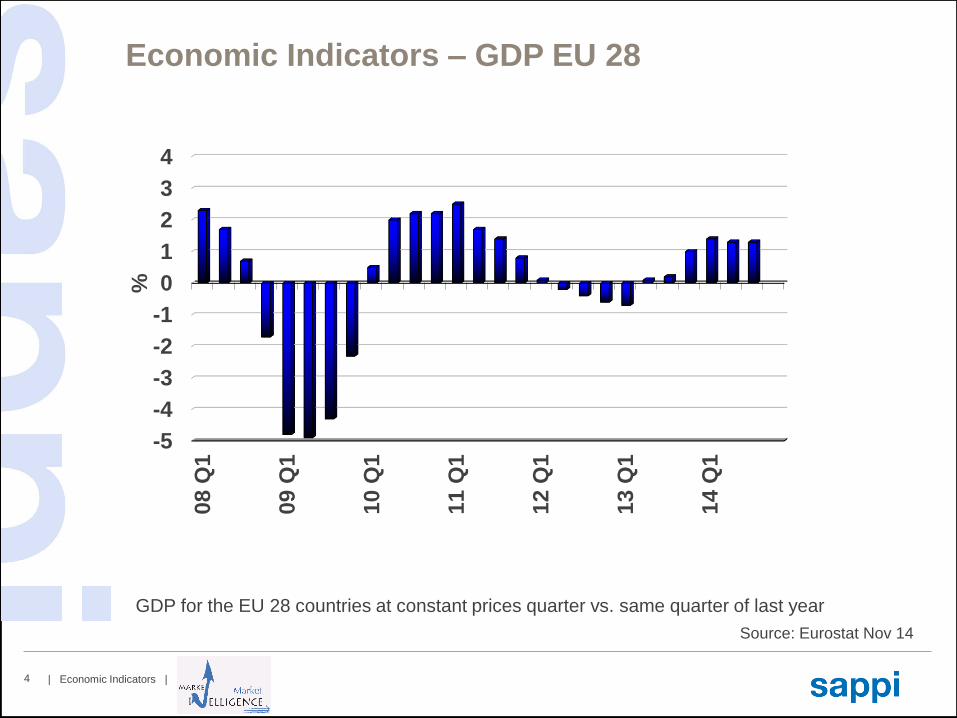
Economic Indicators – GDP EU 28
Source: Eurostat Nov 14
-5
-4
-3
-2
-1
0
1
2
3
4
08
Q1
09
Q1
10
Q1
11
Q1
12
Q1
13
Q1
14
Q1
%
GDP for the EU 28 countries at constant prices quarter vs. same quarter of last year
| Economic Indicators | 5
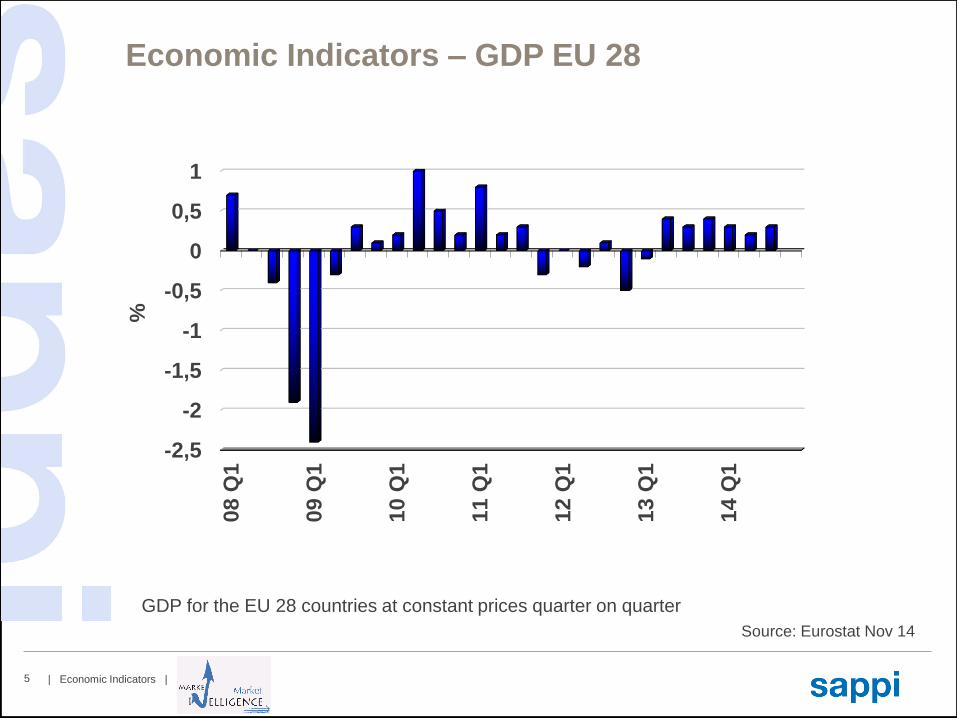
Economic Indicators – GDP EU 28
Source: Eurostat Nov 14
-2,5
-2
-1,5
-1
-0,5
0
0,5
1
08
Q1
09
Q1
10
Q1
11
Q1
12
Q1
13
Q1
14
Q1
%
GDP for the EU 28 countries at constant prices quarter on quarter
| Economic Indicators | 6
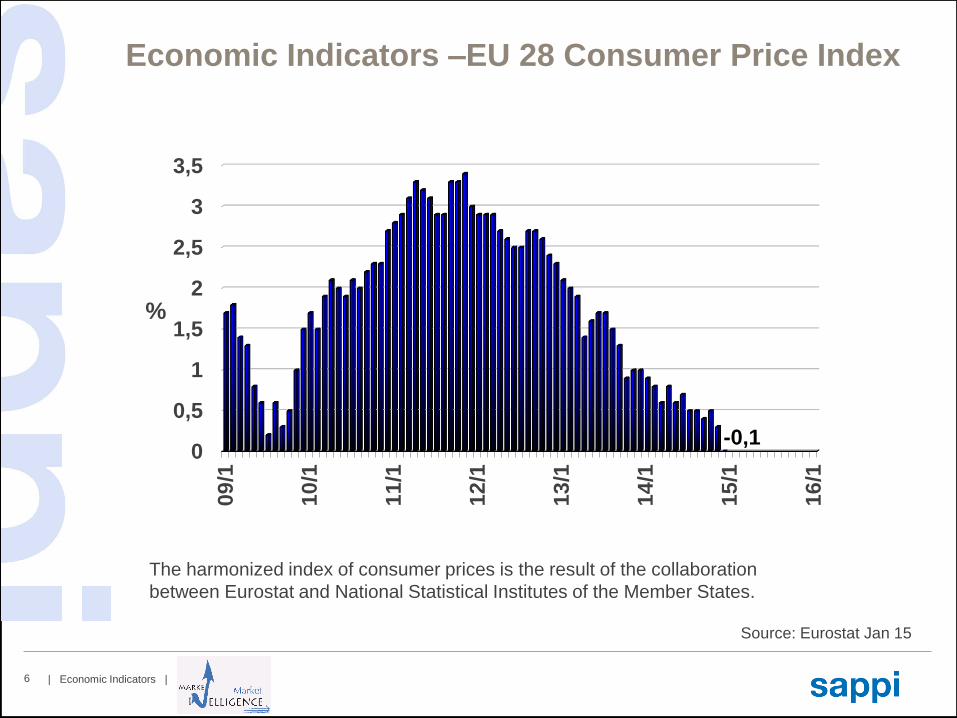
Economic Indicators –EU 28 Consumer Price Index
Source: Eurostat Jan 15
0
0,5
1
1,5
2
2,5
3
3,5
09
/1
10
/1
11
/1
12
/1
13
/1
14
/1
15
/1
16
/1
-0,1
%
The harmonized index of consumer prices is the result of the collaboration
between Eurostat and National Statistical Institutes of the Member States.
| Economic Indicators | 7
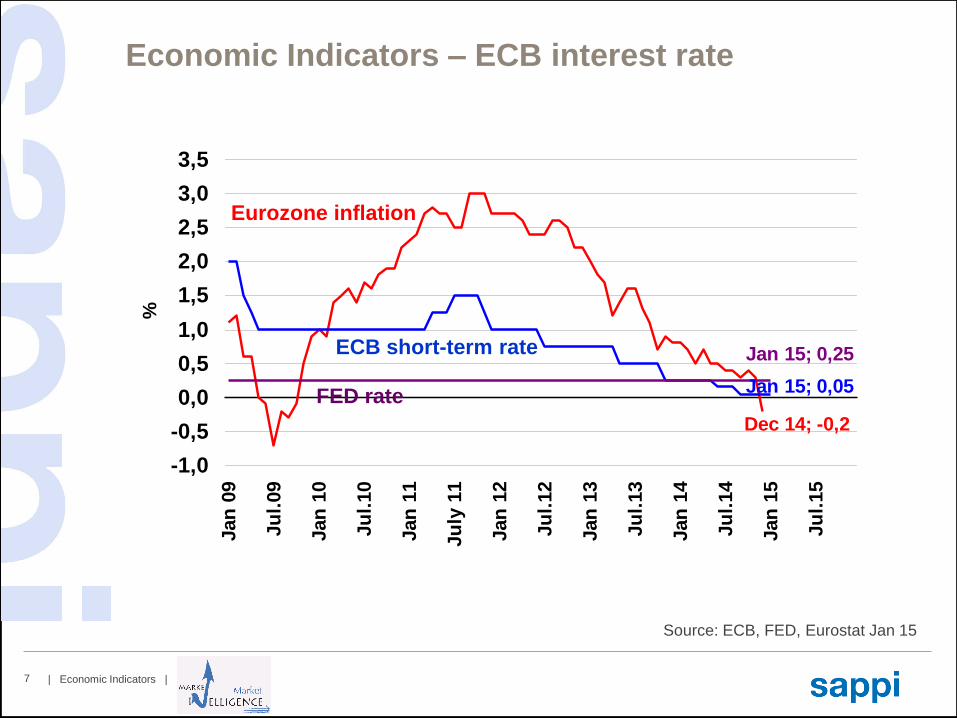
Economic Indicators – ECB interest rate
Source: ECB, FED, Eurostat Jan 15
Dec 14; -0,2
Jan 15; 0,05
Jan 15; 0,25
-1,0
-0,5
0,0
0,5
1,0
1,5
2,0
2,5
3,0
3,5
Jan
09
Ju
l.09
Jan
10
Ju
l.10
Jan
11
Ju
ly 1
1
Jan
12
Ju
l.12
Jan
13
Ju
l.13
Jan
14
Ju
l.14
Jan
15
Ju
l.15
%
ECB short-term rate
Eurozone inflation
FED rate
| Economic Indicators | 8
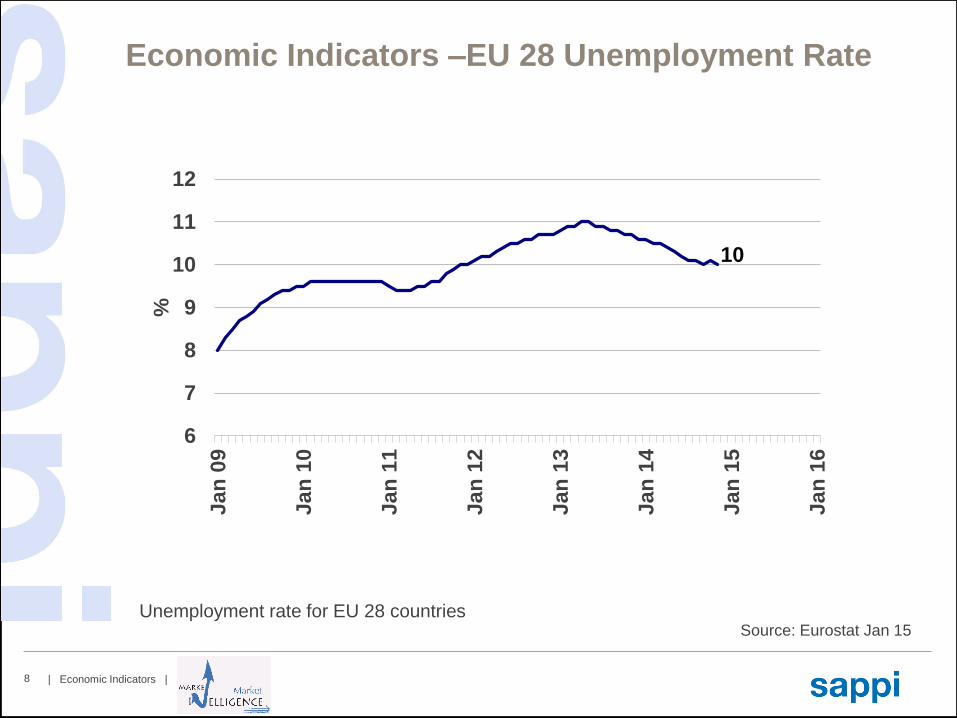
Economic Indicators –EU 28 Unemployment Rate
Source: Eurostat Jan 15
10
6
7
8
9
10
11
12
Jan
09
Jan
10
Jan
11
Jan
12
Jan
13
Jan
14
Ja
n 1
5
Jan
16
%
Unemployment rate for EU 28 countries
| Economic Indicators | 9
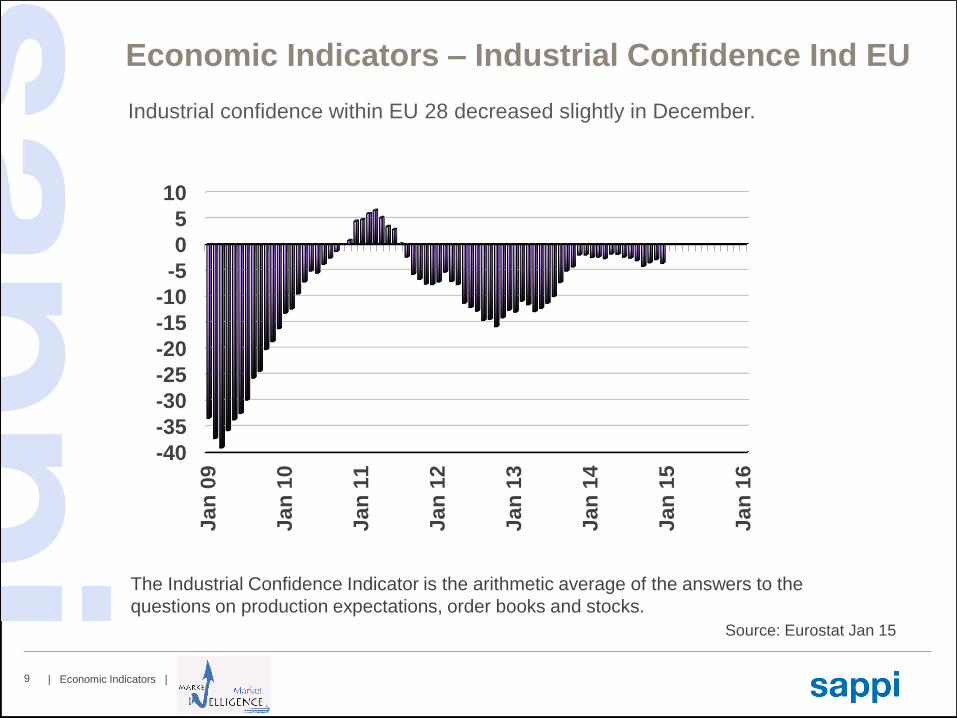
Economic Indicators – Industrial Confidence Ind EU
Source: Eurostat Jan 15
-40
-35
-30
-25
-20
-15
-10
-5
0
5
10Jan
09
Jan
10
Jan
11
Jan
12
Jan
13
Jan
14
Jan
15
Jan
16
Industrial confidence within EU 28 decreased slightly in December.
The Industrial Confidence Indicator is the arithmetic average of the answers to the
questions on production expectations, order books and stocks.
| Economic Indicators | 10
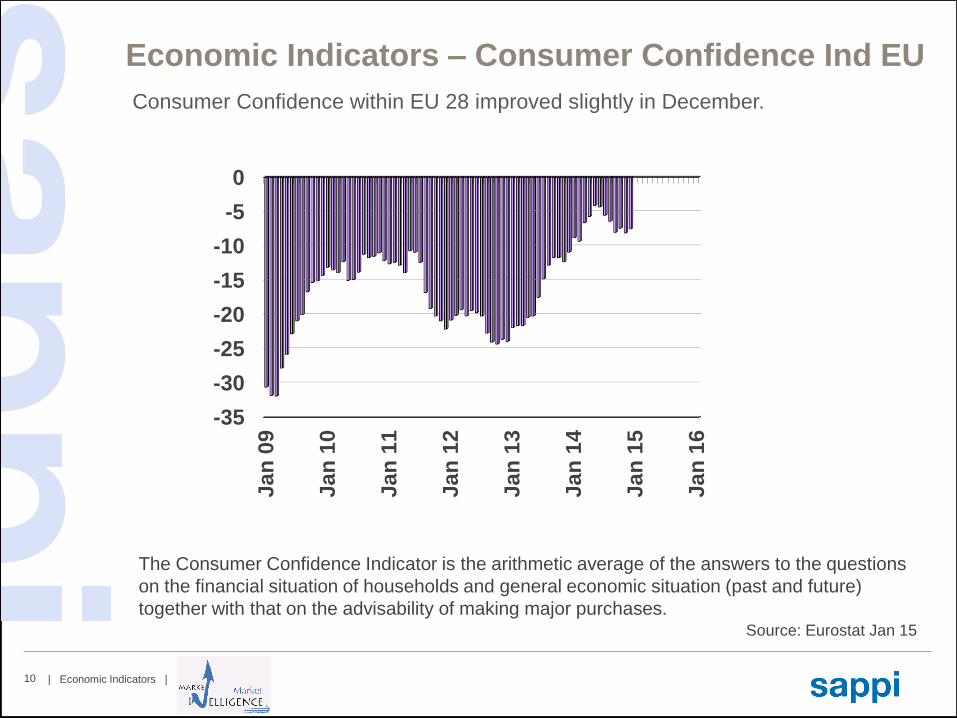
Economic Indicators – Consumer Confidence Ind EU
Source: Eurostat Jan 15
Consumer Confidence within EU 28 improved slightly in December.
-35
-30
-25
-20
-15
-10
-5
0
Ja
n 0
9
Ja
n 1
0
Ja
n 1
1
Ja
n 1
2
Ja
n 1
3
Ja
n 1
4
Ja
n 1
5
Ja
n 1
6
The Consumer Confidence Indicator is the arithmetic average of the answers to the questions
on the financial situation of households and general economic situation (past and future)
together with that on the advisability of making major purchases.
| Economic Indicators | 11
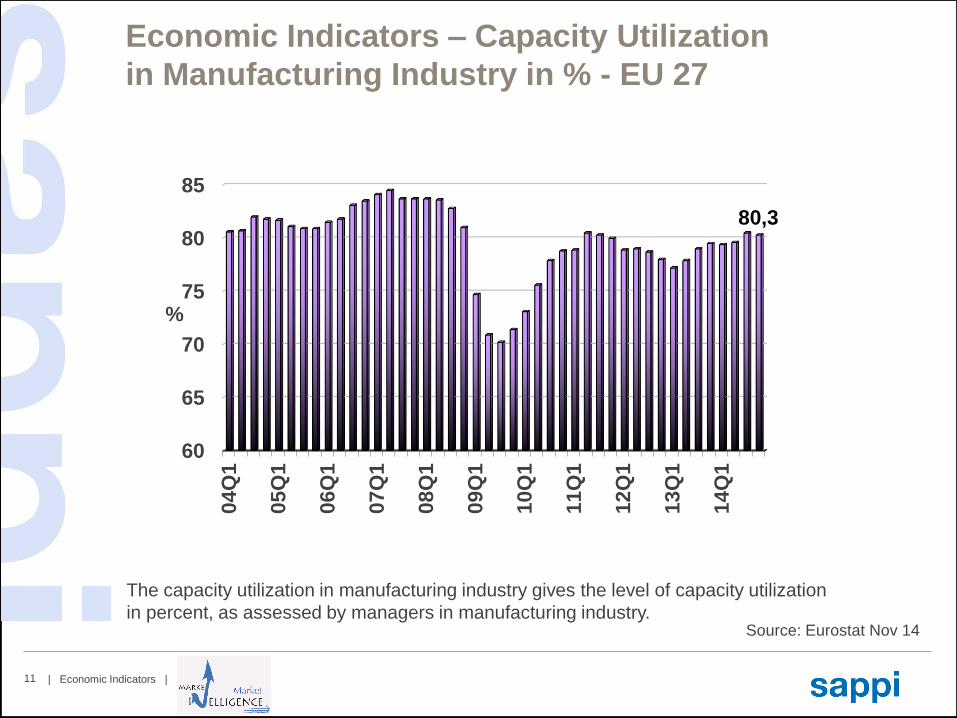
Economic Indicators – Capacity Utilization
in Manufacturing Industry in % - EU 27
Source: Eurostat Nov 14
60
65
70
75
80
85
04
Q1
05
Q1
06
Q1
07
Q1
08
Q1
09
Q1
10
Q1
11
Q1
12
Q1
13
Q1
14
Q1
80,3
%
The capacity utilization in manufacturing industry gives the level of capacity utilization
in percent, as assessed by managers in manufacturing industry.

| Economic Indicators | 12
Ifo Data
| Economic Indicators | 13
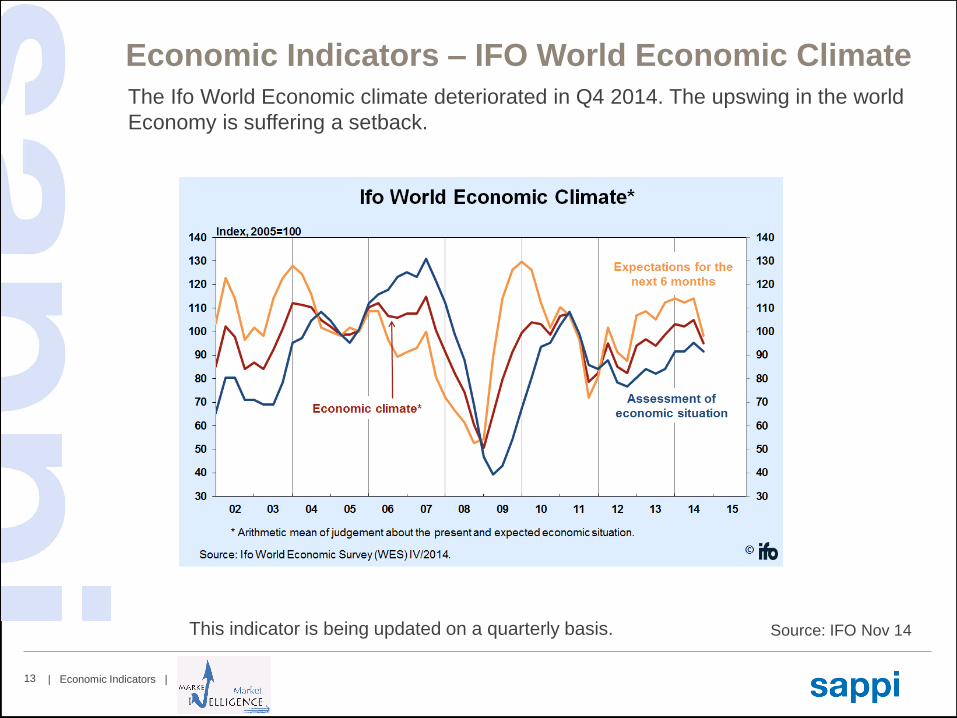
Economic Indicators – IFO World Economic Climate
Source: IFO Nov 14
The Ifo World Economic climate deteriorated in Q4 2014. The upswing in the world
Economy is suffering a setback.
This indicator is being updated on a quarterly basis.
| Economic Indicators | 14
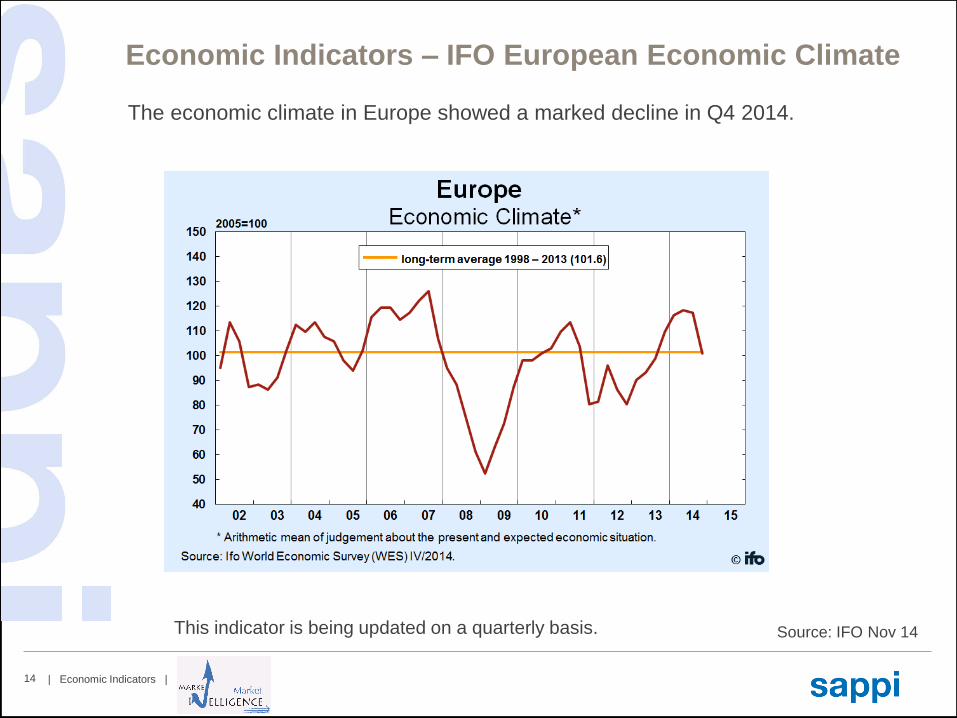
Economic Indicators – IFO European Economic Climate
Source: IFO Nov 14
The economic climate in Europe showed a marked decline in Q4 2014.
This indicator is being updated on a quarterly basis.

| Economic Indicators | 15
Economic Indicators – IFO NA Economic Climate
Source: IFO Nov 14 This indicator is being updated on a quarterly basis.
| Economic Indicators | 16
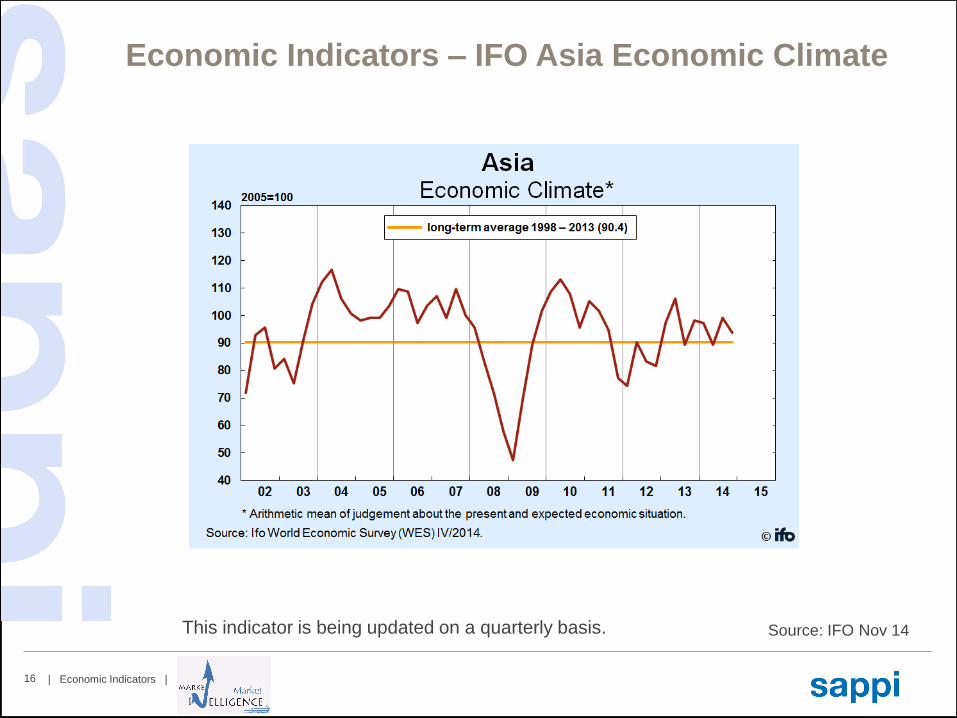
Economic Indicators – IFO Asia Economic Climate
Source: IFO Nov 14 This indicator is being updated on a quarterly basis.
| Economic Indicators | 17
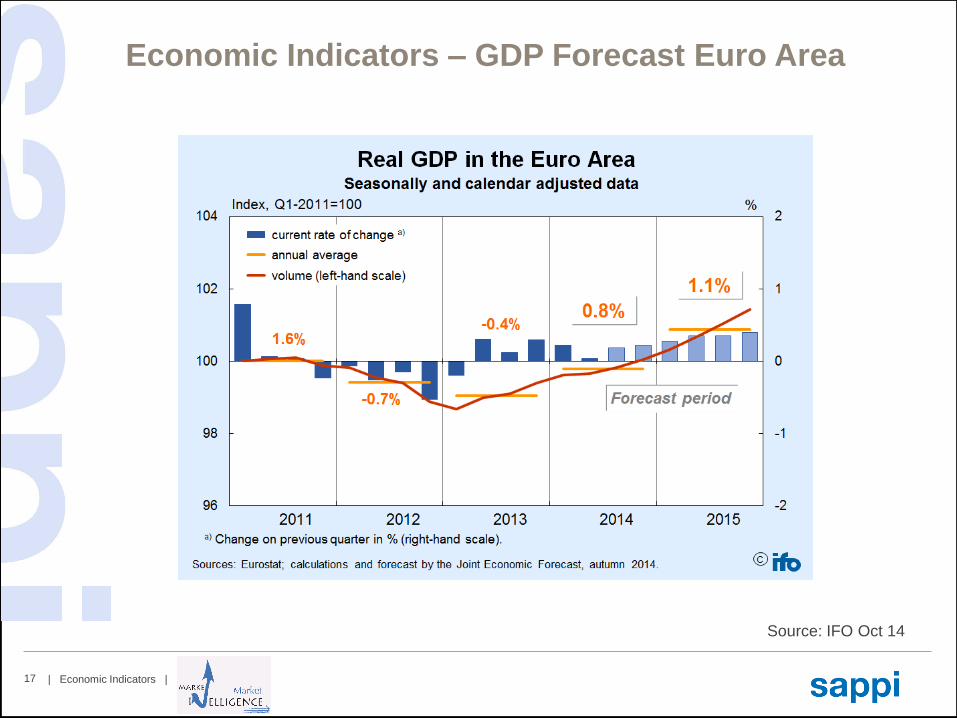
Economic Indicators – GDP Forecast Euro Area
Source: IFO Oct 14
| Economic Indicators | 18
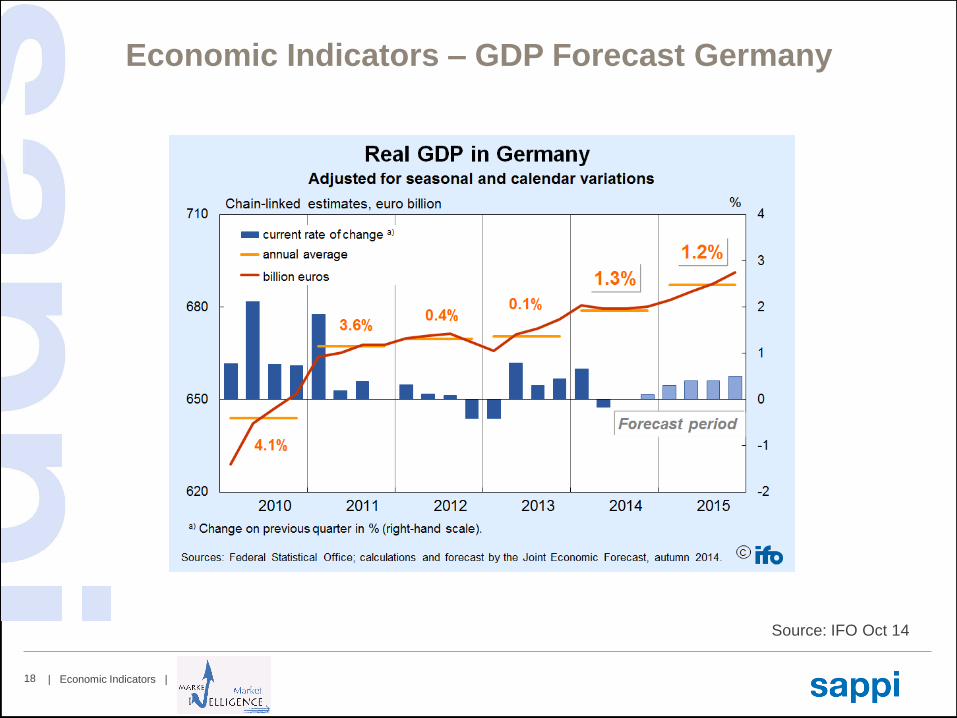
Economic Indicators – GDP Forecast Germany
Source: IFO Oct 14
| Economic Indicators | 19
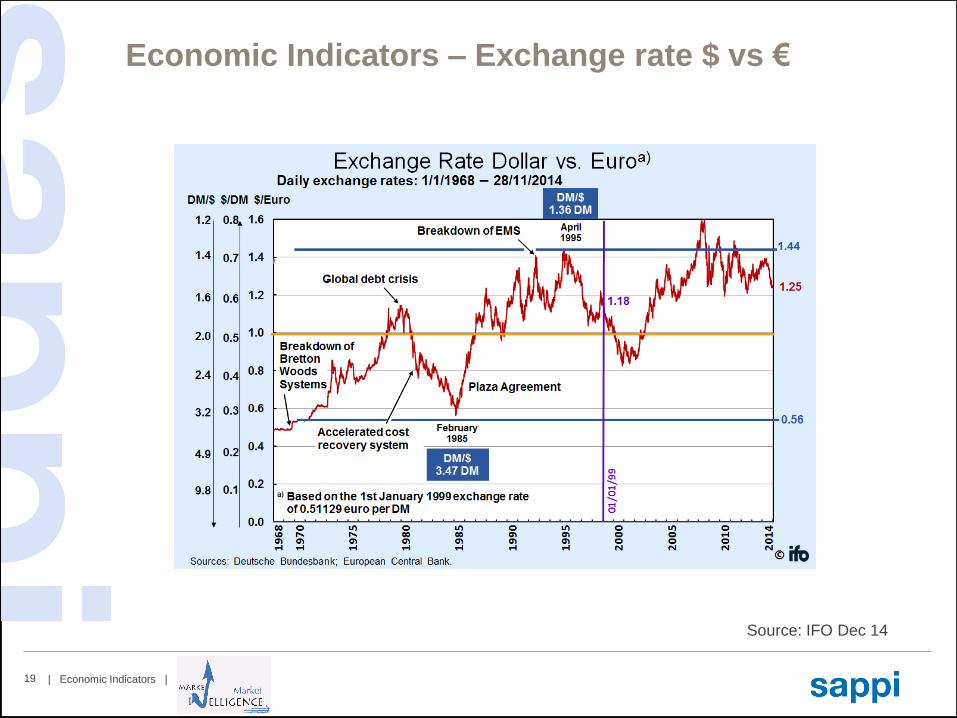
Economic Indicators – Exchange rate $ vs €
Source: IFO Dec 14
| Economic Indicators | 20
Economic Indicators –
Ifo business situation and 6 month expectations
Source: IFO Dec 14
75
80
85
90
95
100
105
110
115
Jan
08
Jan
09
Jan
10
Jan
11
Jan
12
Jan
13
Jan
14
Jan
15
80
85
90
95
100
105
110
115
120
125
Jan
08
Jan
09
Jan
10
Jan
11
Jan
12
Jan
13
Jan
14
Jan
15
Business situation 6 months expectations
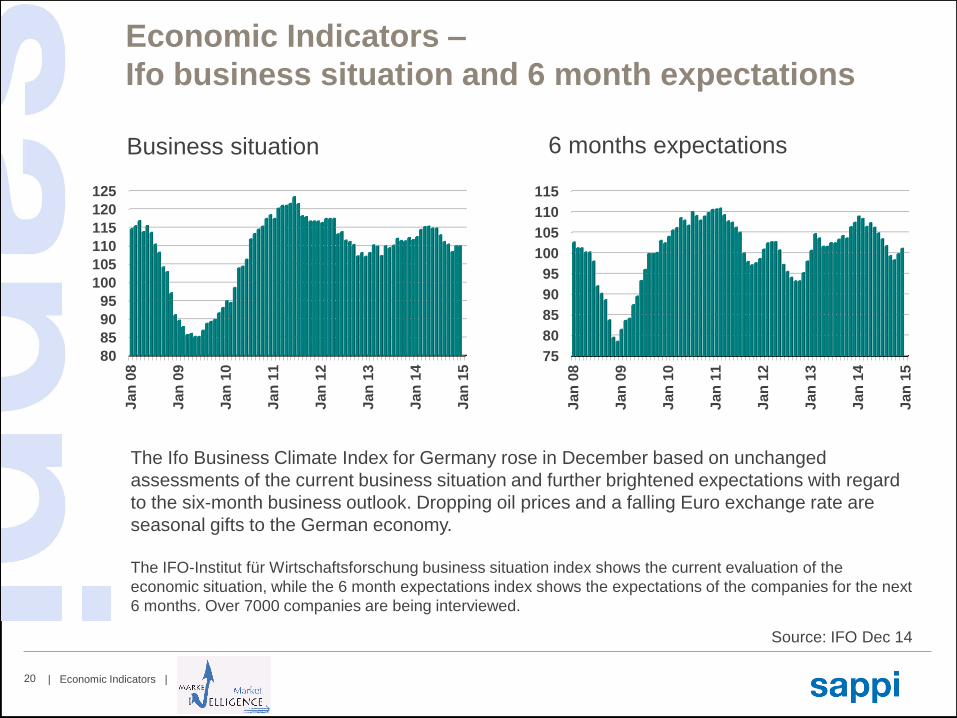
The IFO-Institut für Wirtschaftsforschung business situation index shows the current evaluation of the
economic situation, while the 6 month expectations index shows the expectations of the companies for the next
6 months. Over 7000 companies are being interviewed.
The Ifo Business Climate Index for Germany rose in December based on unchanged
assessments of the current business situation and further brightened expectations with regard
to the six-month business outlook. Dropping oil prices and a falling Euro exchange rate are
seasonal gifts to the German economy.
| Economic Indicators | 21
Economic Indicators – IFO Assessment of Current
Business Situation
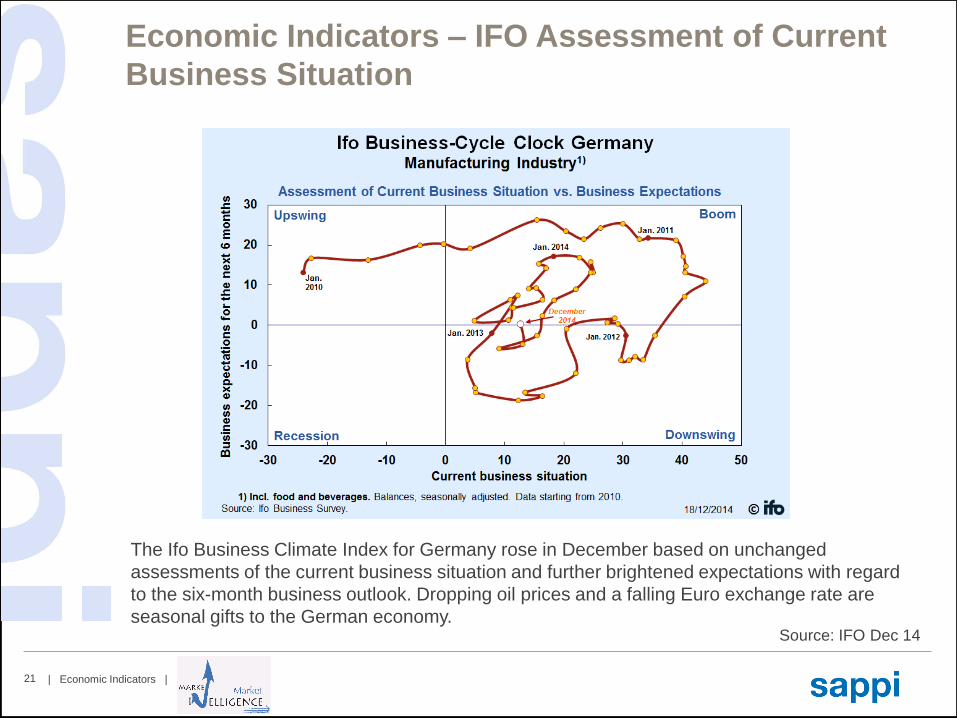
The Ifo Business Climate Index for Germany rose in December based on unchanged
assessments of the current business situation and further brightened expectations with regard
to the six-month business outlook. Dropping oil prices and a falling Euro exchange rate are
seasonal gifts to the German economy. Source: IFO Dec 14
| Economic Indicators | 22
Economic Indicators – IFO business climate index
printing industry
Source: IFO Jan 15, bundesverband druck und medien
-60
-50
-40
-30
-20
-10
0
10
20
Jan
09
Jan
10
Jan
11
Jan
12
Jan
13
Jan
14
Jan
15
Jan
16
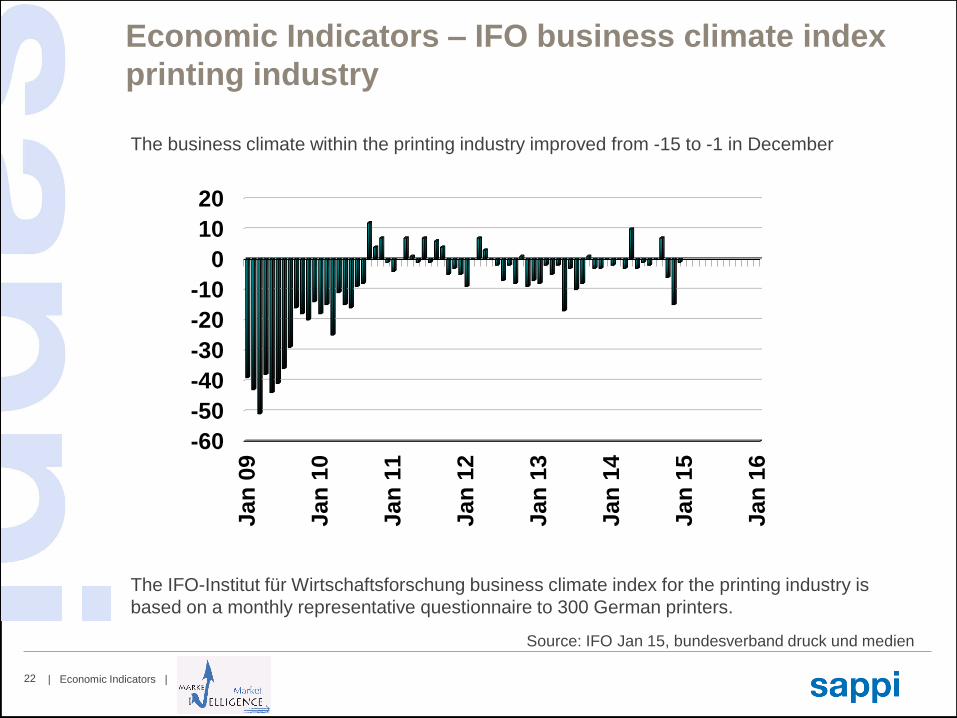
The IFO-Institut für Wirtschaftsforschung business climate index for the printing industry is
based on a monthly representative questionnaire to 300 German printers.
The business climate within the printing industry improved from -15 to -1 in December
| Economic Indicators | 23
Economic Indicators – IFO business climate index
printing industry
The IFO-Institut für Wirtschaftsforschung business climate index for the printing industry is
based on a monthly representative questionnaire to 300 German printers.
Business Development at German Printers – December 2014:
The assessment of the current business situation in the printing
industry further improved from +21% to now +22%, its highest level in
2014, but still slightly below the December 2013 value (+25%).
The business expectations for the coming 6 months turned their
negative trend from the previous months, improving from -45% to now
-21%.
The business climate – an indicator for the development in
the next quarter – returned close to the zero line, reaching -1%.
Source: IFO Dec 14, bundesverband druck und medien

| Economic Indicators | 24
Zenith Data
| Economic Indicators | 25
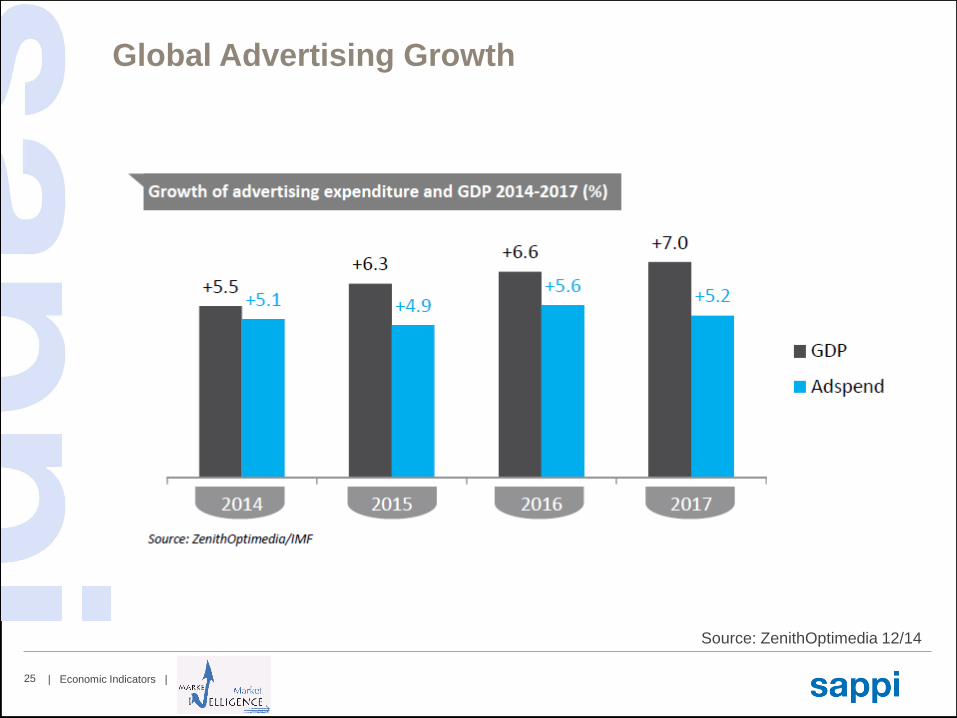
Global Advertising Growth
Source: ZenithOptimedia 12/14

| Economic Indicators | 26
Regional Advertising Development
Source: ZenithOptimedia 12/14
| Economic Indicators | 27
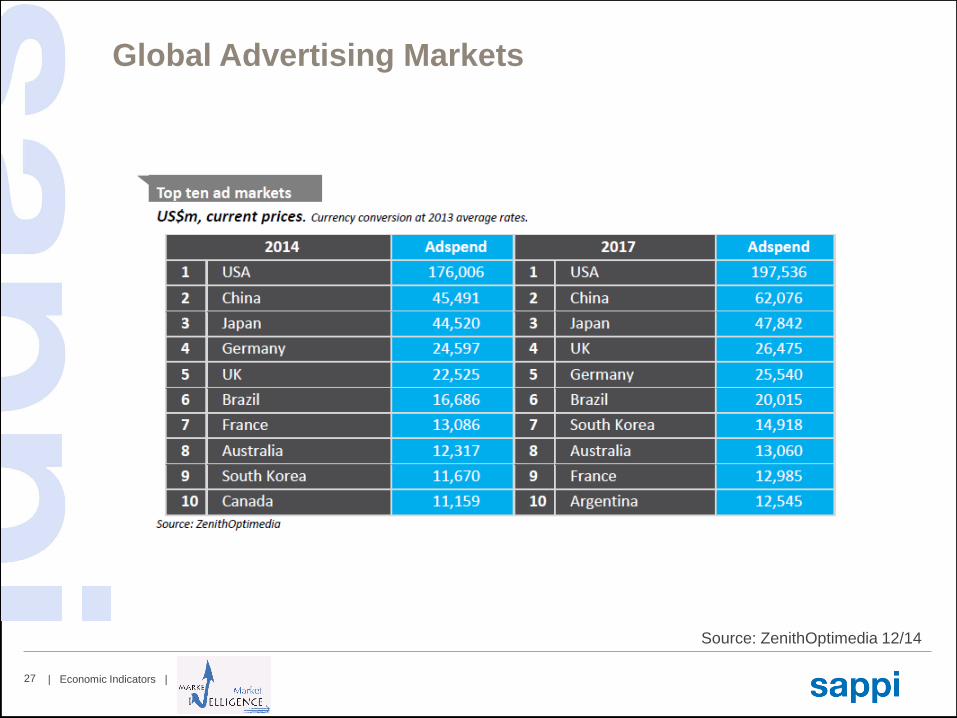
Global Advertising Markets
Source: ZenithOptimedia 12/14
| Economic Indicators | 28
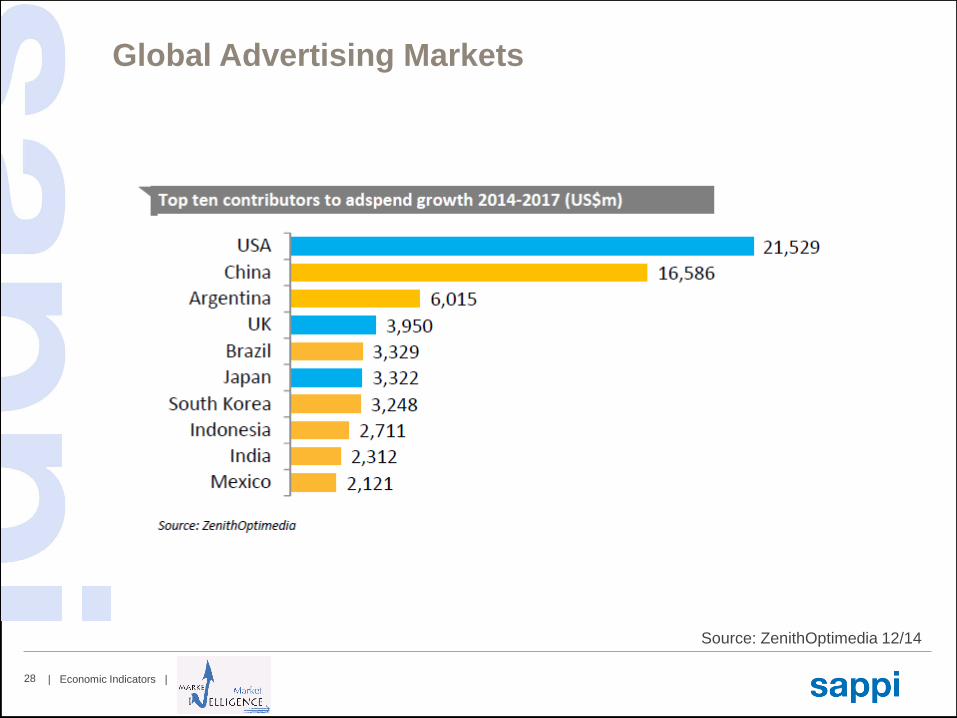
Global Advertising Markets
Source: ZenithOptimedia 12/14
| Economic Indicators | 29
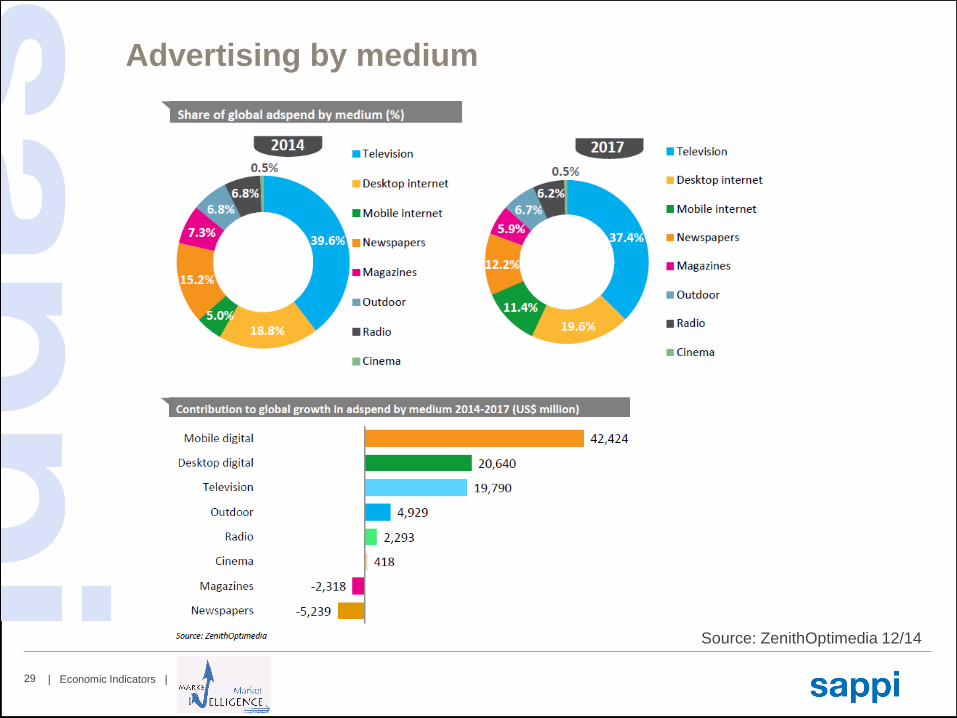
Advertising by medium
Source: ZenithOptimedia 12/14


