

1
Economy in Review Southeastern Washington
Southeast Regional Academy- PWB & CERB
Ajša Suljić-Regional Labor Economist
Employment Security Department
May 22nd , 2013
2
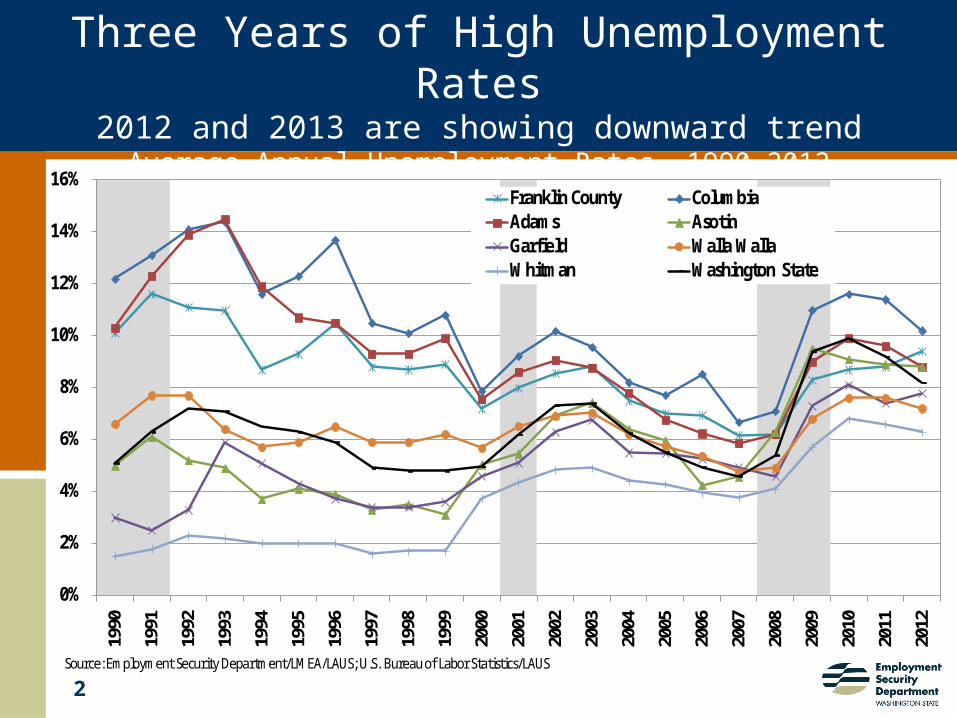
Three Years of High Unemployment Rates2012 and 2013 are showing downward trend
Average Annual Unemployment Rates, 1990-2012
0%
2%
4%
6%
8%
10%
12%
14%
16%
1990
1991
1992
1993
1994
1995
1996
1997
1998
1999
2000
2001
2002
2003
2004
2005
2006
2007
2008
2009
2010
2011
2012
Source: Employment Security Department/LMEA/LAUS; U.S. Bureau of Labor Statistics/LAUS
Franklin County Columbia Adams AsotinGarfield Walla Walla Whitman Washington State

3
Unemployment rate by County

4
Local counties in recovery stateNonfarm employment (Indexed trend, Dec 2007=100)
90%
95%
100%
105%
110%
1 8 15 22 29 36 43 50 57 64
Non
farm
Em
ploy
men
t Ind
ex (D
ec 2
007=
100)
Months ( Dec 2007=1 and Mar 2013=64)
Poly. (Garfield) Poly. (Columbia) Poly. (Asotin) Poly. (Adams)Poly. (Walla Walla) Poly. (Whitman) Poly. (Benton-Franklin) Poly. (Washington)

5
Uneven growth across the area…
-25%
-20%
-15%
-10%
-5%
0%
5%
10%
15%
20%
25%
Adams Asotin Columbia Franklin Garfield Walla Walla Whitman
2010-2011 2009-2010 2008-2009
2007-2008 2006-2007 2005-2006

6
Key Industries• Government is
the largest sector in all nine counties
• Garfield 60.2% • Whitman 44.7% • Columbia 36.5% • Asotin 20.8% • Walla Walla
20.8%• Adams 21.7%• Franklin 19.2%
• Second Largest Industries are:
• Agriculture (Adams 23.3%, Franklin 19.7%, Columbia 11.9%, WW 13.6%)
• Health care (Asotin-17.0%, Walla Walla-14.4% and Whitman-8.5%)
• Retail trade ( All Counties (7.8% to 19.0%)
Gove
rnm
ent,
25.6
%
Transportation and warehousing, 2.3%
Professional and technical services,
1.8%
Finance and insurance, 1.7%
Admin. & waste services, 1.7%
Educational services, 1.5%
Information, 0.8%Arts, entertainment, and
recreation, 0.8%Real estate and rental and
leasing, 0.8%
Source: Bureau of Labor Statistics-QCEW, Employment Security Department-LMEA
7
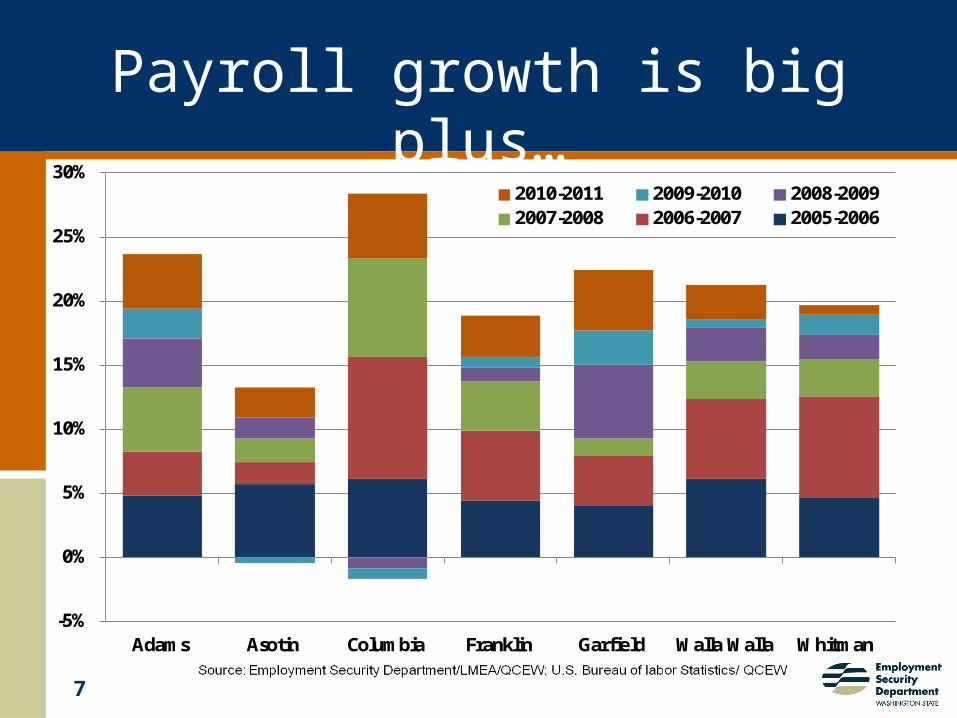
Payroll growth is big plus…
-5%
0%
5%
10%
15%
20%
25%
30%
Adams Asotin Columbia Franklin Garfield Walla Walla Whitman
2010-2011 2009-2010 2008-20092007-2008 2006-2007 2005-2006
8
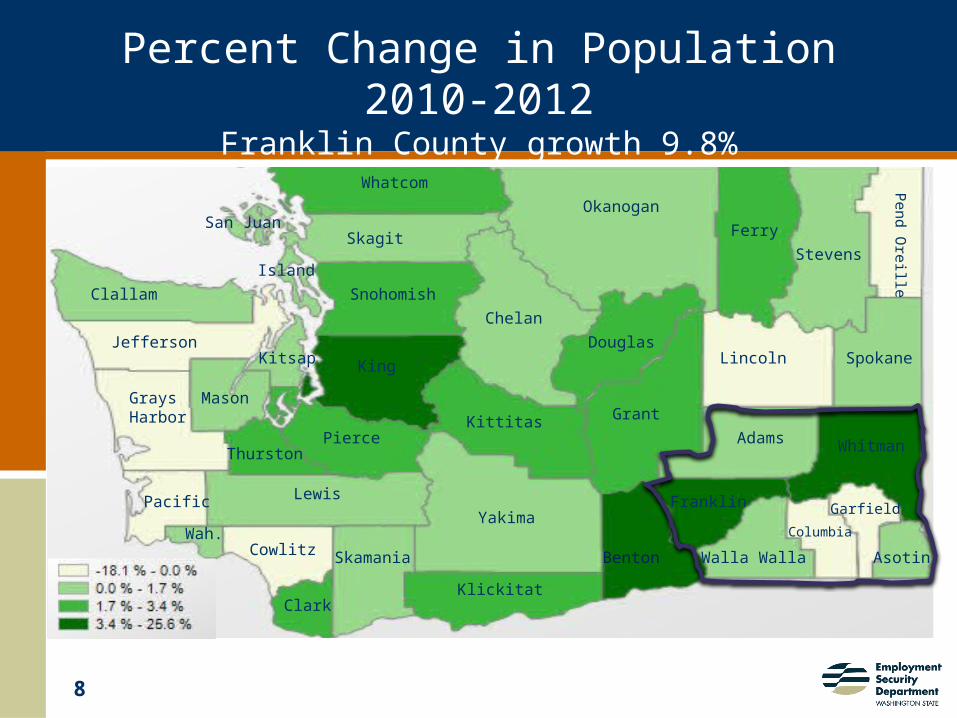
Percent Change in Population 2010-2012Franklin County growth 9.8%Columbia County loss 2.0%
Benton
Franklin
Walla Walla
Columbia
Garfield
Asotin
WhitmanAdams
SpokaneLincoln
Ferry
Stevens
Pend O
reille
Grant
Okanogan
Douglas
Chelan
Kittitas
Yakima
Klickitat
Skamania
Lewis
Clark
CowlitzWah.
Pacific
ThurstonPierce
King
Snohomish
Skagit
Whatcom
Grays Harbor
Mason
Jefferson
Clallam
Kitsap
Island
San Juan

9
2011 PCP and MH Incomes
State MH income $56,537 and national MH of $50,502. State PCP income of $43,878 and national PCP of $45,560.
AreaMedian Household Income (2011)
Per Capita Personal Income (2011)
Adams $ 40,675 $ 31,704 Asotin $ 41,864 $ 35,230 Columbia $ 42,463 $ 39,259 Franklin $ 48,904 $ 29,711 Garfield $ 46,302 $ 35,999 Walla Walla $ 47,570 $ 35,276 Whitman $ 35,860 $ 30,379

10
Going forward…
▶ Most of the counties are on the road to recovery, but very slow and uneven
▶ Replacement employment need▶ Industries that will be leading growth
▶ Health Care and Social Assistance▶ Employment in manufacturing (incl. food proc.),
health services, transportation (distr. chain), financial services, forest services and mining will continue to dominate employment in number and percentage of the labor force.

11
Thank You
Ajša Suljić Regional Labor Economist
esd.wa.gov/employmentdata


