

Risenga Maluleke
Statistician-General
Statistics South Africa
Education Series Volume iv
Early childhood development in South Africa,
2016

Our children are the rock on which our future will be built, our greatest asset as a nationNelson Mandela (3 June 1995)

The National Integrated Policy for
Early Childhood Development
(2015)
The National Plan for Action in
South Africa (2012-2017)
The National Development Plan:
Vision for 2030
National legal and
operational child
related framework
National plans
related to ECDInternational
agreements and
protocols
The South African
Constitution
The Children’s Act (Act No.
38 of 2005)
South African Schools Act
(Act No. 84 of 1996)
Maintenance Act (Act No.
99 of 1998)
Social Assistance Act (Act
No. 13 of 2004)
The African Charter on the
Rights and Welfare of the Child
(RSA ratified 2000)
The United Nations Declaration
on Human Rights
The United Nations
Conventions on the Rights of
the Child and associated
protocols (RSA ratified 1995)
Sustainable Development Goals
Context

1
5
4
2
3
6
N u t r i t i o n a l
S u p p o r t
M a t e r n a l
h e a l t h
S o c i a l
S e r v i c e s
S u p p o r t f o r
p r i m a r y
c a r e - g i v e r s
C h i l d
h e a l t h
S t i m u l a t i o n
f o r e a r l y
l e a r n i n g
Approved by cabinet in 2015, the ECD Policy emphasises 6 essential components to promote optimal child development from conception to 9 years
This release illustrates the current status utilising the General Household Survey and Administrative records
ECD Policy
0
0,2
0,4
0,6
0,8
1
1,2
0 2 4 6 8 10 12 14 16 18 20 22 24 26 28 30 32 34 36 38 40 42 44 46 48 50 52 54 56 58 60 62 64 66 68 70 72 74 76 78 80 82 84 86 88 90
Mill
ion
s
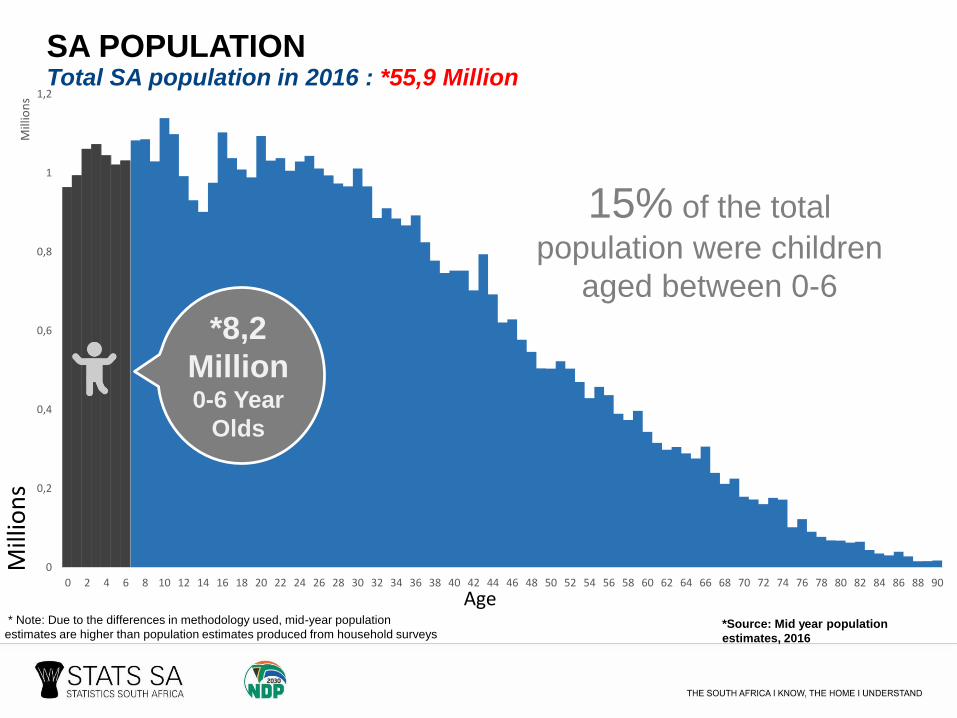
*8,2
Million0-6 Year
Olds
Mill
ion
s
15% of the total
population were children
aged between 0-6
Age*Source: Mid year population
estimates, 2016
SA POPULATIONTotal SA population in 2016 : *55,9 Million
* Note: Due to the differences in methodology used, mid-year population
estimates are higher than population estimates produced from household surveys

34% 35%
25% 23%
37% 40%
4% 3%
Age 0 Age 1 Age 2 Age 3 Age 4 Age 5 Age 6
Pe
rce
nta
ge
Traditional
Formal Urban Non Metro
Formal Urban Metro
Farm
Geographic Location4 out of 7 young children lived in urban areas
Source: GHS, 2016

Children aged 0-6 by level of overcrowding,
2016LP
24%
MP
25%
KZN
37%
EC
45%
FS
33%
NW
38%
NC
40%
WC
37%
GP
26%
By Population Group
Coloured: 38%
Black African: 35%
White: 9%
Indian/Asian: 6%
* Overcrowding: more than two
persons-per-room in a dwelling
regardless of the size of the dwelling
units. Source: GHS, 2016

84%
86% 86%
89%
90% 90%
91%
94%
97%
EC KZN GP WC FS NW MP NC LP
RSA Average at 88,6 %
Households connected to the mains Children aged 0–6 in households connected
to the mains electricity supply by province,
2016
35%
46%
57%
67%
72%
78%
87%89%
94%
0
10
20
30
40
50
60
70
80
90
100
EC LP KZN NW RSA MP NC FS WC GP
RSA
Ave
rage
at
67
,2%
Households with children aged 0-6 by main source of water Households with children aged 0-6 by main source of
water (piped water in dwelling/on site) and province, 2016
Source: GHS, 2016

57,2%
66,8%
73,7%
78,2%
82,3%
87,3%
91,5%
93,0%
95,8%
LP
MP
NW
KZN
RSA
FS
NC
EC
GP
WC
Households with children aged 0-6 with access to improved
sanitation, 2016
Nearly 8 children out of 10 (81,4%) aged 0–6 had access to * improved sanitation.
RSA Average at 81,4%
* Flush-toilets connected to public sewerage; flush-toilets connected to a septic tank; pit latrine/toilet with ventilation pipe; and ecological sanitation systems are recognised as better improved sanitation in terms of the criteria Source: GHS, 2016

Source: South Africa’s young children: their family and home environment, 2012
Marital Status of Fathers and Mothers

Number of children aged 0–6 living with their biological parents, 2016
With Mother With Both With NeitherW
ith
Fa
the
r12%46% 40%
2%
Source: GHS, 2016

49%
39%
8%
11%
35%
53%
89%
86%
14%
6%
4%
2%
0% 50% 100%
Black African
Coloured
Indian/Asian
White
Number of children aged 0–6 living with their biological parents by Population group 2016
With Father
With NeitherWith Mother With Both
Source: GHS, 2016

One third of large (more than 6 members)
households with young children aged 0-6 did not have a
single employed member
Main source of household income:
Salaries: 51%
Grants: 34%Other income: 7%
Remittance: 7%
Pension: 1%
None: 0%
Source: GHS, 2016
Children aged 0-6 by the number of employed
household members and main source of income, 2016

22%
13%
4%
2%
24%
16%
5%
9%
18%
24%
13%
13%
21%
19%
10%
11%
15%
28%
67%
66%
0,0 10,0 20,0 30,0 40,0 50,0 60,0 70,0 80,0 90,0 100,0
Black African
Coloured
Indian/Asian
White
Lowest income quintile Quintile 2 Quintile 3 Quintile 4 Highest income quintile
Large household income inequalities by population group
Source: GHS, 2016
Children aged 0-6 by monthly household income quintile
and population group, 2016

Early childhood nutrition, child
and maternal health
N u t r i t i o n a l
S u p p o r t

72,6%
31,1%
5,0%
1,3%
Aged 0
Aged 1
Aged 2
Aged 3
Aged 4
Aged 5
Aged 6
0,0 10,0 20,0 30,0 40,0 50,0 60,0 70,0 80,0 90,0 100,0
Source: GHS, 2016
Nutritional Support: Children who are still breastfed by age, 2016
73% of babies
less than one year
were still breastfed;
32% were
exclusively breastfed

21,4%
21,5%
21,9%
22,9%
24,8%
27,4%
28,5%
33,5%
34,2%
0 10 20 30
NC
MP
LP
WC
EC
NW
KZN
FS
GP
Height-for-age (stunted)
3,4%
3,8%
4,7%
4,9%
5,8%
8,0%
8,4%
11,9%
12,6%
0 5 10 15
EC
KZN
MP
LP
GP
FS
NC
WC
NW
Weight-for-age (underweight)
Nutritional Support: Stunting, Underweight and WastingAround a third of children in GP and the FS were stunted, NW had the highest rates of Wasting and Underweight children
Source: SADHS, 2016
0,5%
1,3%
1,5%
1,7%
2,1%
2,5%
4,1%
4,6%
5,9%
0 2 4 6
MP
GP
EC
WC
NC
KZN
LP
FS
NW
Weight-for-height (wasted)
Figures for weight-for height for the WC was based on 25-49 unweighted cases.
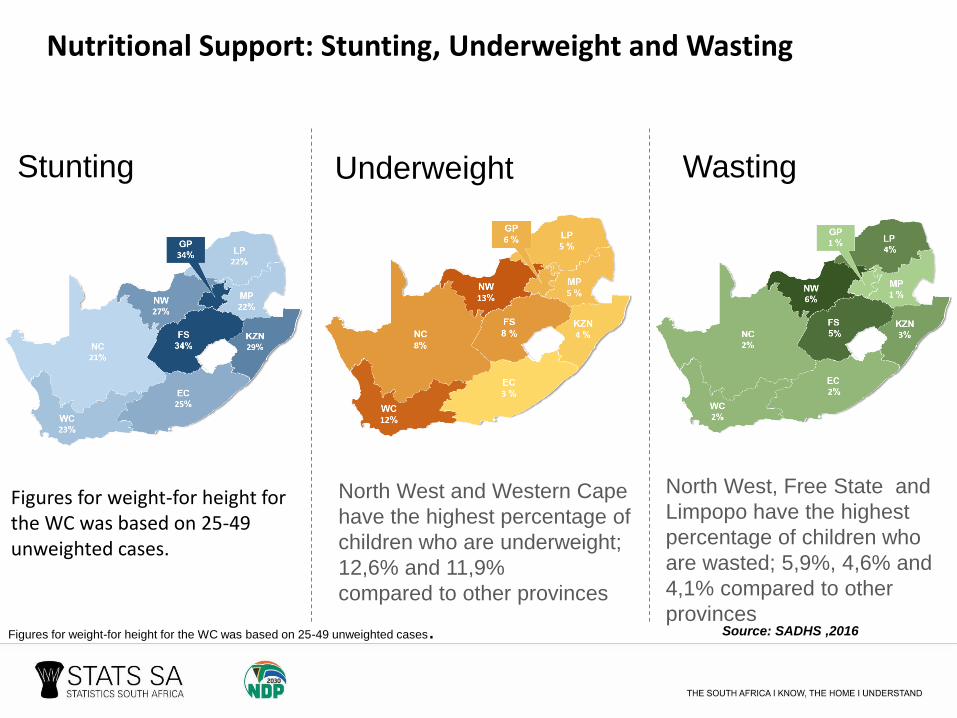
Nutritional Support: Stunting, Underweight and Wasting
Figures for weight-for height for the WC was based on 25-49 unweighted cases.
North West and Western Cape
have the highest percentage of
children who are underweight;
12,6% and 11,9%
compared to other provinces
Stunting Underweight Wasting
North West, Free State and
Limpopo have the highest
percentage of children who
are wasted; 5,9%, 4,6% and
4,1% compared to other
provincesSource: SADHS ,2016Figures for weight-for height for the WC was based on 25-49 unweighted cases.
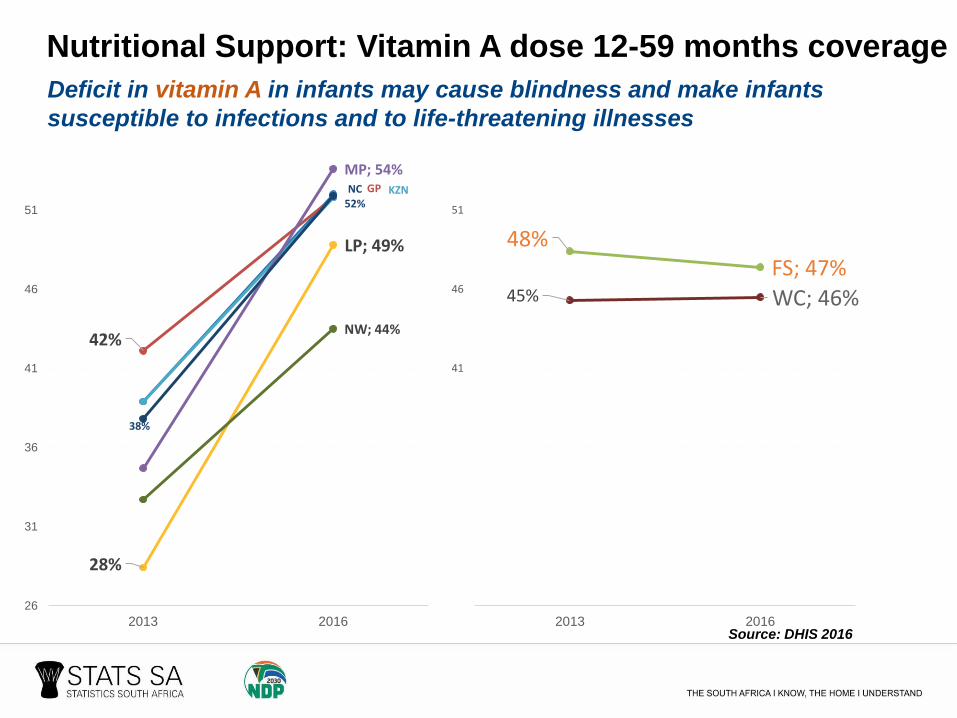
42%
KZN
28%
LP; 49%
MP; 54%
38%
NC52%
NW; 44%
26
31
36
41
46
51
2013 2016
48%FS; 47%
45% WC; 46%
26
31
36
41
46
51
2013 2016
Nutritional Support: Vitamin A dose 12-59 months coverage
Deficit in vitamin A in infants may cause blindness and make infants
susceptible to infections and to life-threatening illnesses
Source: DHIS 2016
GP

21,1%
25,5%
17,3%
0 10 20 30 40 50
RSA
Female headed households
Male headed households
Past 12 months
35,7%
36,8%
34,3%
0 10 20 30 40 50
RSA
Female headed households
Male headed households
5 days or more in past 30 days
Female headed
households were more
likely to have members of
the household who
skipped a meal
Percentage of households with children aged 0-6 who skipped
any meal by gender of the household head, 2016
Source: GHS, 2016

15,3%
17,4%
22,1%
16,3%
0,0
5,0
10,0
15,0
20,0
25,0
Urban Traditional Farm RSA
Pe
rce
nta
ge
One of the main implications of the integrated ECD policy in South Africa is its emphasis on
child nutrition starting from the womb
Nationally 16,3% of pregnant
women stayed in households
where members experienced
hunger
Source: GHS, 2016
Nutritional Support: Pregnant women, aged 12-50 who stayed in households
where members experienced hunger by settlement type (2016)

93%
76%
61%
0,0 20,0 40,0 60,0 80,0 100,0
Antenatal women on ART
Mother postnatal visit within 6 days
First antenatal visit before 20 weeks
Percentage
Source: DHIS, 2016
Antenatal and postnatal care for pregnant women, 2015-2016
The MTSF seeks to achieve higher targets by 2019
70% by 2019
80% by 2019
98% by 2019
2019 MTSF Targets2016 Status

71
Under 5 mortality rate
44
48
Infant mortality rate
34
0,0
10,0
20,0
30,0
40,0
50,0
60,0
70,0
80,0
2002 2003 2004 2005 2006 2007 2008 2009 2010 2011 2012 2013 2014 2015 2016 2017 2018 2019
Dea
ths
per
1 0
00
live
bir
ths
D
eath
s/B
irth
s p
er 1
00
0 p
eop
le
Child Health: Under 5 and Infant Mortality RatesIn spite of the progress achieved in child survival both the UMR and the IMR were still very high by developed countries standard
The MTSF
targets under 5
mortality rate at
33 per 1000
livebirths by 2019
Source: Mid-year population estimates, 2016
The MTSF targets
infant mortality
rate at
23 per 1000
livebirths by 2019

11,4%
10,0%
8,3%
4,5%
4,0%
3,9%
3,5%
2,7%
1,8%
1,8%
1,7%
1,6%
9,1%
Respiratory and cardiovascular disorders specific…
Intestinal infectious diseases
Influenza and pneumonia
Malnutrition
Disorders related to length of gestation and fetal…
Other disorders originating in the perinatal period
Infections specific to the perinatal period
Fetus and newborn affected by maternal factors…
Congenital malformations of the circulatory system
Other acute lower respiratory infections
Other viral diseases
Other bacterial diseases
Other natural causes
Non-natural causes
The common underlying cause of death amongst young children was respiratory and cardiovascular disorders specific to the perinatal period
35,8%
Source: Causes of death, 2015
The underlying causes of deaths (aged 0–6), 2015
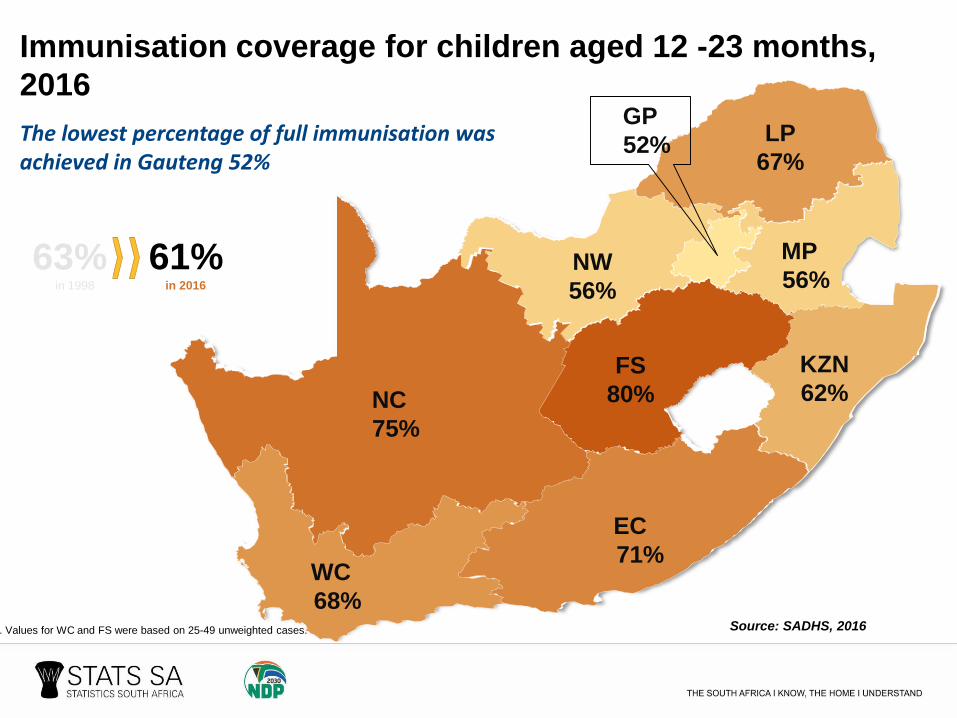
Immunisation coverage for children aged 12 -23 months,
2016
LP
67%
MP
56%
KZN
62%
EC
71%
FS
80%
NW
56%
NC
75%
WC
68%
GP
52%
Source: SADHS, 2016
The lowest percentage of full immunisation was achieved in Gauteng 52%
61% in 2016
63% in 1998
. Values for WC and FS were based on 25-49 unweighted cases.

Social Services and ECD
Interventions
S o c i a l
S e r v i c e s

57%
65%
66%
69%
73%
76%
79%
81%
85%
95%
EC
KZN
RSA
NW
FS
GP
MP
WC
LP
NC
EC is significantly below
the SA average for
delivery in facility
Social Services: Delivery in health facility rate, 2016
Source: DHIS, 2016
2 out of 3 births took place at health facilities

11,5%
6,2%5,0%
0,0
2,0
4,0
6,0
8,0
10,0
12,0
14,0
16,0
18,0
20,0
0 1 2
Pe
rce
nta
ge
Age
Children aged 0-2 with or without birth certificates, 2016Overall, 7,5% of young children aged 0-2 did not have birth certificates
By age two 34,9% of those that did not receive a birth certificate indicated they had still not applied.
Source: GHS, 2016

117 048
95 575
73 797
54 355
32 680
0
20 000
40 000
60 000
80 000
100 000
120 000
140 000
2011 2012 2013 2014 2015
Extent of late birth registration, 2011-2015
Source: Recorded live Births, 2016
late
birth
regis
tration

Number of crimes committed against children 18 years and younger and
conviction rate, 2015/2016
Murder
Attempted
murder
Sexual
offences
Complaints
reported
Complaints
in courtConvictions
906
20 254
884 1 835 248
758 128
20 048 3 007
Sexual offences
were the largest crime
committed against
children
Source: SAPS, 2015/2016
*Data for age bracket 0–6 only was not available for analysis

Percentage of grant recipients children
aged 0-6 by province, 2017LP
89%
MP
72%
KZN
73%
EC
77%
FS
80%
NW
66%
NC
80%
WC
54%
GP
52%
Source: SOCPEN 2017, Own
Calculations
Limpopo, Free State and Northern Cape have the highest percentage of grant recipients
RSA
69%

Orphanhood among children aged 0-6, 2016
95,6%
3,1%
0,9%
0,4%
Not orphan
Paternal orphan
Maternal orphan
Double orphan
Source: GHS, 2016
• Maternal Orphan: Mother deceased
• Paternal Orphan: Father deceased

Source: GHS, 2016
78%
65%
77%
73%
13%
23%
13%
17%
4%
7%
5%
5%
0,0 20,0 40,0 60,0 80,0 100,0
Urban
Traditional
Farms
RSA
The majority of households in traditional areas had a disproportionately large burden of care for young children by grandparents and other family members
Gra
nd
pare
nt
Au
nt/U
nc
le
Percentage main person who takes care of the child aged 0–6 by
geographical location, 2016
Sis
. Bro
.Co
us
inBiological/Adoptive/Foster

74%
81%
89%
76%
Talk to him/her
53%
46%
58%
51%
Distract him/her
46%
43%
41%
33%
Shout at him/her
36%
36%
24%
19%
Physical
12%
11%
20%
28%
Isolate the child
5%
4%
2%
6%
Black -African
Coloured
Indian/Asian
White
Do Nothing
Physical punishment was mostly practiced amongst Black Africans and Coloureds
Parenting techniques utilised for children aged 0-6 years by population group,
2016
Source: GHS, 2016

33%
20%
30%
85%76%
63%49%
29%
13% 13%
0
10
20
30
40
50
60
70
80
90
100
Age 0 Age 1 Age 2 Age 3 Age 4 Age 5 Age 6
Pe
rce
nta
ge
Grade R
None
Pre-school
Edu-care
Attendance of ECD and school, by children aged 0-6
Other
49 out of 100 children aged 3 did not attend any ECD facility
Source: GHS, 2016

Inequalities in early learning opportunities. Close to half of the children in the lower income quintiles did not participate in any learning activity
12%
11%
12%
14%
12%
9%
11%
10%
10%
Pre-school17%
20%
21%
22%
21%
23%
3%
3%
3%
3%
6%
5%
6%
5%
50%
49%
46%
48%
41%
0,0 10,0 20,0 30,0 40,0 50,0 60,0 70,0 80,0 90,0 100,0
Lowest income quintile
Quintile 2
Quintile 3
Quintile 4
Highest income quintile
Day
M
oth
er
Oth
er
Source: GHS, 2016
Attendance of ECD facility by monthly household income quintile, 2016
Grade R Crèche/Educare None

13%
9%
7%
12%
10%
11%
20%
26%
22%
19%
17%
18%
3%
3%
4%
3%
47%
55%
49%
38%
0,0 20,0 40,0 60,0 80,0 100,0
Black African
Coloured
Indian/Asian
White
Grade R
Pre-school/NurseryschoolCreche/EducarecentreDay mother/Gogo
Home-basedplaygroupOther
None
Attendance of ECD facility by population group 0-6, 2016
Source: GHS, 2016
44% of white children attended out-of-home
early learning programmes.
Black/African children, close to 32% attended
out-of-home early learning programmes

Source: GHS, 2016
22%
33%
34%
34%
37%
26%
32%
29%
32%
31%
16%
12%
14%
13%
12%
36%
23%
22%
21%
20%
0% 10% 20% 30% 40% 50% 60% 70% 80% 90% 100%
Highest income quintile
Quintile 4
Quintile 3
Quintile 2
Lowest income quintile
Never Sometimes Often Every Day
36% of children within highest income quintiles were told stories or read to daily,
as opposed to only 20% of children in the lowest income quintiles
Type of stimulation received by children aged 0–6 by
monthly households’ income quintile, 2016

BA= Black African C= Coloured I/A= Indian/Asian W= White
46%
58% 59%61%
52%
63%
69%73%
34%
53%
67%
75%
63%
79%77% 78%
84%87%
89% 88%
BA C I/A W BA C I/A W BA C I/A W BA C I/A W BA C I/A W
Encouraged to do/imitatedaily activities
Read/tell story to child Explanation given whenpoints to ask
Someone talk/have aconversation with the child
Someone sing to child
Response: often or everyday
Differences in population groups regarding the type and frequency of stimulation received by children aged 0-6 can be observed
Source: GHS, 2016
Type of stimulation received by children0-6 year olds, 2016

CONCLUSION

The Children of 1996 Generation provide insight into importance of long term planning

Source: Community Survey 2016
Age structure based on CS 2016

First demographic wave: Children of 1996
The life circumstances of first demographic wave have not achieved full potentialHigh Unemployment/Poor Educational outcomes
Second demographic wave
Need to invest in second demographic
wave to achieve outcomes not seen in
their parents generation
Source: Community Survey 2016
Age structure based on CS 2016

Malnutrition at very young age needs immediate attention (North West, Free State and KwaZulu-Natal
had most young children who were underweight and stunted).
Government feeding programmes target mostly primary and secondary schools with limited service to
only some ECD centres.
More targeted feeding scheme interventions need to be done either through the primary health care
system or through social services to reach all children at risk of malnutrition.
Nutrition interventions needed for pregnant women at risk.
Infant and under five mortality need interventions aimed at prevention.
Improvement required in birth registrations so that households with young children are able to receive
their children’s birth certificates within the required 30 day period.
Access to electricity in Eastern Cape, KwaZulu-Natal and Gauteng has to be improved to avoid unsafe
source of energy for cooking.
Access to piped water onsite for households need to be improved in Eastern Cape and Limpopo.
Access to improved sanitation for households need to be improved in Limpopo, Mpumalanga and
North West.
Increased efforts are needed to strengthen the protection and safety of children.
Access to ECD programmes for young children need to be expanded.

Ndzi hela kwala!


