

1 | US DOE Geothermal Office eere.energy.gov
Public Service of Colorado Ponnequin Wind Farm
Geothermal Technologies Office 2015 Peer Review
Geothermal Play-Fairway Analysis of Washington State Prospects
Principal Investigator: Dave Norman
Presenter Name: Corina Forson
Organization: Washington Division of Geology and Earth Resources
Other Participants: AltaRock Energy Inc., Temple University, BOS Technologies, Gifford Pinchot National Forest
Hydrothermal
Project Officer: Eric Hass
Total Project Funding: $244,536
May 12, 2015
This presentation does not contain any proprietary
confidential, or otherwise restricted information.
Geothermal Favorability
2 | US DOE Geothermal Office eere.energy.gov
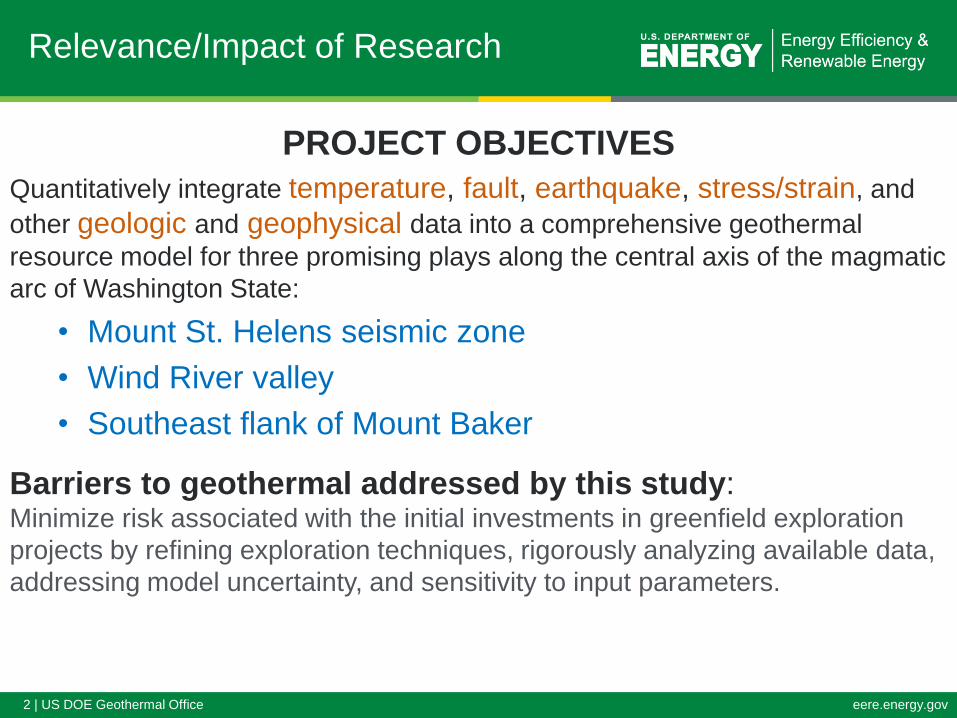
Relevance/Impact of Research
PROJECT OBJECTIVES
Quantitatively integrate temperature, fault, earthquake, stress/strain, and
other geologic and geophysical data into a comprehensive geothermal
resource model for three promising plays along the central axis of the magmatic
arc of Washington State:
• Mount St. Helens seismic zone
• Wind River valley
• Southeast flank of Mount Baker
Barriers to geothermal addressed by this study: Minimize risk associated with the initial investments in greenfield exploration
projects by refining exploration techniques, rigorously analyzing available data,
addressing model uncertainty, and sensitivity to input parameters.

3 | US DOE Geothermal Office eere.energy.gov
Relevance/Impact of Research
Regional barriers influencing geothermal discovery in
Washington:
Massive amounts of precipitation, dense vegetation coverage, and high
relief in the western part of the state can mask surface manifestations and
dampen the thermal signature of the magmatic heat source, which is
conventionally detected through remote sensing. These barriers prevent
geothermal resources from being identified and hinder target definition for
drilling discovery wells.

4 | US DOE Geothermal Office eere.energy.gov
Scientific/Technical Approach
Fairway: Innovative 3D permeability modeling techniques and classic
quantitative heat potential modeling provide insight to where there is a high
likelihood of heat and permeability at depth.
Heat potential is based on:
1) temperature gradients (measured or calculated)
2) proximity to volcanic vents, weighted by age, lithology, and type
3) proximity to Quaternary intrusive rocks, weighted by age and lithology
4) proximity to springs, weighted by temperature
5) proximity to springs, weighted by geothermometry
Permeability potential is based on:
1) slip and dilation tendency on mapped and seismic faults
2) maximum shear and dilational strain rates at the surface
3) fault displacement distribution and displacement gradient
4) shear and tensile fracture density
5) local geologic and geophysical data
Permeability Layer Where Implication Assumption
displacement/slip
tendency along fault fault hosted flow
active faulting
promotes fault
permeability
dilation potential along fault fault hosted flow
low normal stress
eneables dilation
during slip
displacement gradient along fault localized fault hosted
flow
dU/dx indicates high
local strain and
intense fracturing
Coulomb Stress/σ3 volume around
fault
fractured reservoir
extent
favorable stress
change = high
fracture density
shear and dilational
strain
larger scales of
earths crust
regional position of
reservoir
active crustal
deformation
promotes fractures
and permeability
Underlying assumption in heat and permeability modeling: high fracture density
promotes a percolating fracture network, porosity to store fluids, and heat exchange
area. Active deformation provides the potential to restore permeability and porosity lost
to mineral alteration and precipitation.

5 | US DOE Geothermal Office eere.energy.gov
Scientific/Technical Approach
Simplified geology of the Mount St. Helens study area Understand the local geology
• Mapped faults
• Volcanic vents
• Quaternary intrusives
• Hot springs / fumaroles
Utilize geophysical and geochemical techniques
• Earthquake focal mechanisms
• Fault geometry fit to seismicity
• Derive velocities and infer strain rates from GPS time series
• Geothermometry
Seismicity used to fit fault planes
Relocated EQ’s colored with depth (cooler colors are more shallow) Focal mechanisms showing strike and dip of 1st nodal plane.

6 | US DOE Geothermal Office eere.energy.gov
Scientific/Technical Approach
ArcGIS is used to:
• weight heat inputs
by value
(temperature,
distance, lithology,
type, etc.)
• interpolate
between points
• combine and
normalize the
input layers Favorability of each heat input layer
7 | US DOE Geothermal Office eere.energy.gov
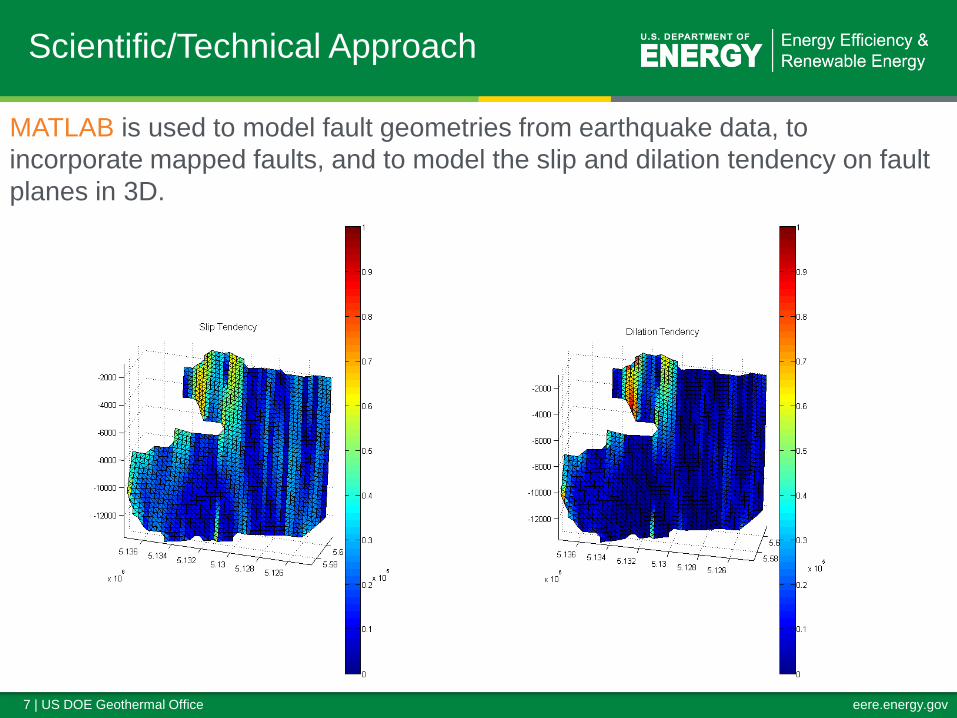
Scientific/Technical Approach
MATLAB is used to model fault geometries from earthquake data, to
incorporate mapped faults, and to model the slip and dilation tendency on fault
planes in 3D.
Map view of faults and seismicity
A’
A
N
MSH
Looking west at faults, magma chamber, and seismicity Magma chamber dimensions and location following Barker and Malone
(1991) from aseismic gap under Mount St. Helens crater.
South Fault
Magma Chamber
North Fault
MSH A A’
200m observation plane
3 km observation plane
8 | US DOE Geothermal Office eere.energy.gov
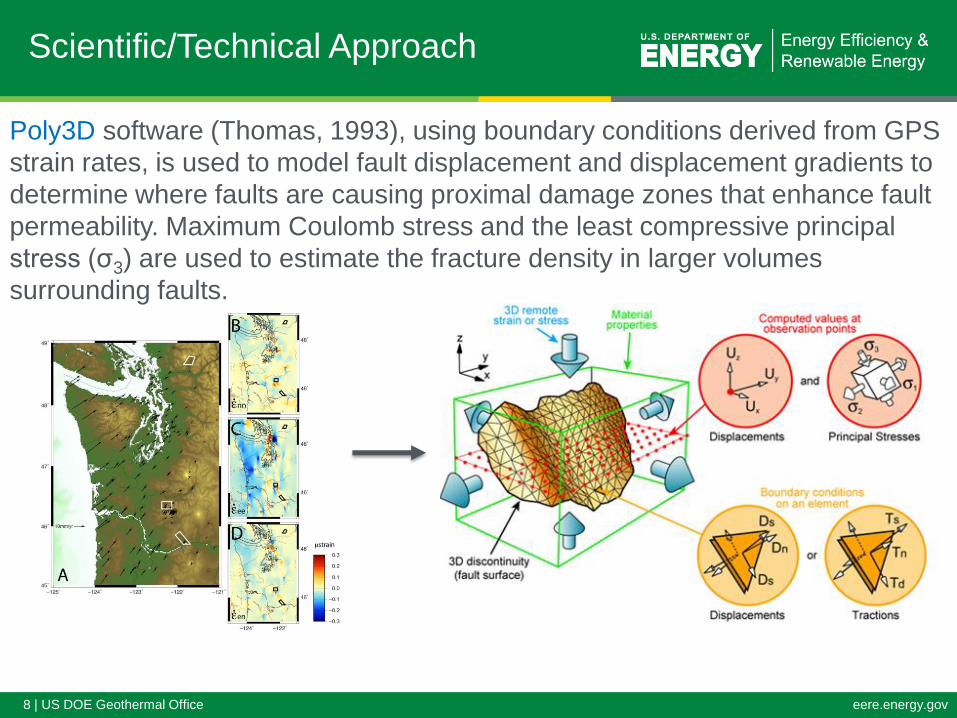
Scientific/Technical Approach
Poly3D software (Thomas, 1993), using boundary conditions derived from GPS
strain rates, is used to model fault displacement and displacement gradients to
determine where faults are causing proximal damage zones that enhance fault
permeability. Maximum Coulomb stress and the least compressive principal
stress (σ3) are used to estimate the fracture density in larger volumes
surrounding faults.

9 | US DOE Geothermal Office eere.energy.gov
Scientific/Technical Approach
ArcGIS is used to interpolate
between points that represent
different permeability values
calculated in MATLAB and Poly3D
10 | US DOE Geothermal Office eere.energy.gov
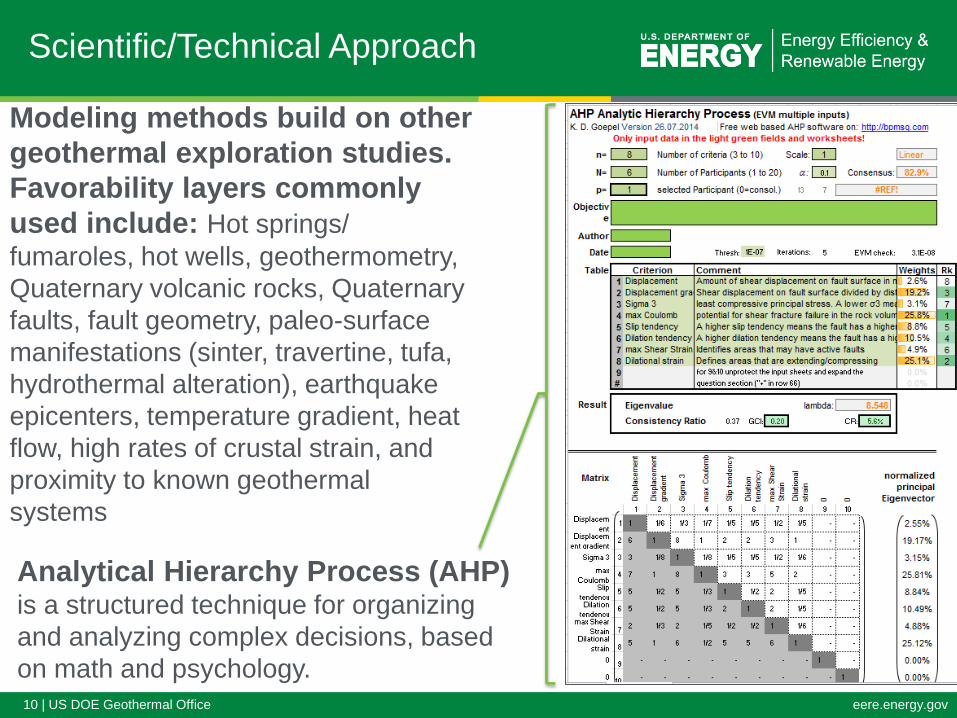
Scientific/Technical Approach
Modeling methods build on other
geothermal exploration studies.
Favorability layers commonly
used include: Hot springs/
fumaroles, hot wells, geothermometry,
Quaternary volcanic rocks, Quaternary
faults, fault geometry, paleo-surface
manifestations (sinter, travertine, tufa,
hydrothermal alteration), earthquake
epicenters, temperature gradient, heat
flow, high rates of crustal strain, and
proximity to known geothermal
systems
Analytical Hierarchy Process (AHP) is a structured technique for organizing
and analyzing complex decisions, based
on math and psychology.
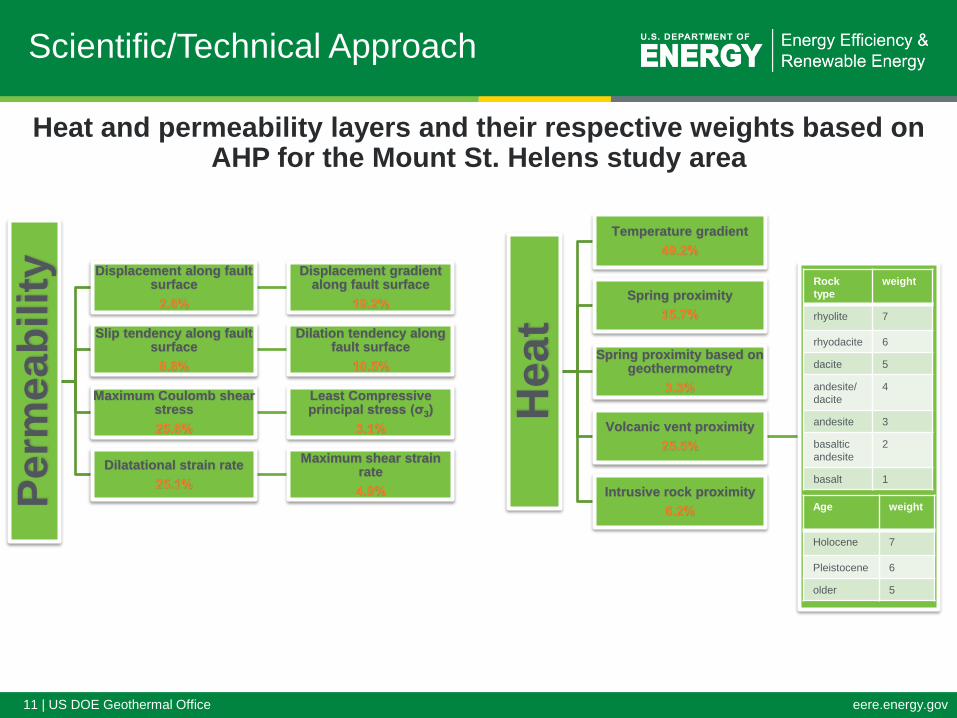
11 | US DOE Geothermal Office eere.energy.gov
Pe
rmea
bilit
y
Displacement along fault surface
2.6%
Displacement gradient along fault surface
19.2%
Slip tendency along fault surface
8.8%
Dilation tendency along fault surface
10.5%
Maximum Coulomb shear stress
25.8%
Least Compressive principal stress (σ3)
3.1%
Dilatational strain rate
25.1%
Maximum shear strain rate
4.9%
Scientific/Technical Approach
Heat
Temperature gradient
49.2%
Spring proximity
15.7%
Spring proximity based on geothermometry
3.3%
Volcanic vent proximity
25.5%
Intrusive rock proximity
6.2%
Rock
type
weight
rhyolite 7
rhyodacite 6
dacite 5
andesite/
dacite
4
andesite 3
basaltic
andesite
2
basalt 1
Age weight
Holocene 7
Pleistocene 6
older 5
Heat and permeability layers and their respective weights based on AHP for the Mount St. Helens study area

12 | US DOE Geothermal Office eere.energy.gov
Accomplishments, Results and Progress
to Date
Original
Planned
Milestone
Technical
Accomplishment
Actual Milestone/Technical
Accomplishment
Date
Completed
1 Completion of data
collection and assembly
into separate datasets for
each fairway
Gathered data and metadata, analyzed to
determine suitable for respective modeling,
distribution of data to participating partners
November
2014
2 Model inputs prepared for
three target areas
Refine and verify validity of data for use in each
model
February 2014
3.1 Mount St. Helens
resource models final
Models showing relative potential within target
area using known characteristics and
permeability conceptual model
April 2015
3.2 Wind River resource
models final
Models showing relative potential within target
area using known characteristics and
permeability conceptual model
In progress
• Heat and permeability modeling of Mount St. Helens study area guides future exploration based on high favorability targets
• Data processing, model workflow, and partner coordination established
Heat and permeability are weighted evenly in this preliminary analysis
Preliminary geothermal favorability of Mount St. Helens seismic zone

13 | US DOE Geothermal Office eere.energy.gov
Future Directions
Milestone Status & Expected Completion Date
3.2 & 3.3 Use workflow and data processing techniques developed for MSH in the Wind River and Mount
Baker play-fairway studies. Expected completion: May 2015 and July 2015
3.4 Uncertainty and risk modeling for all three plays. Expected completion: August 2015
3.5 Metadata in multiple formats for all data deliverables. Expected completion: August 2015
4 Technical reporting and data delivery. Expected completion: October 2015
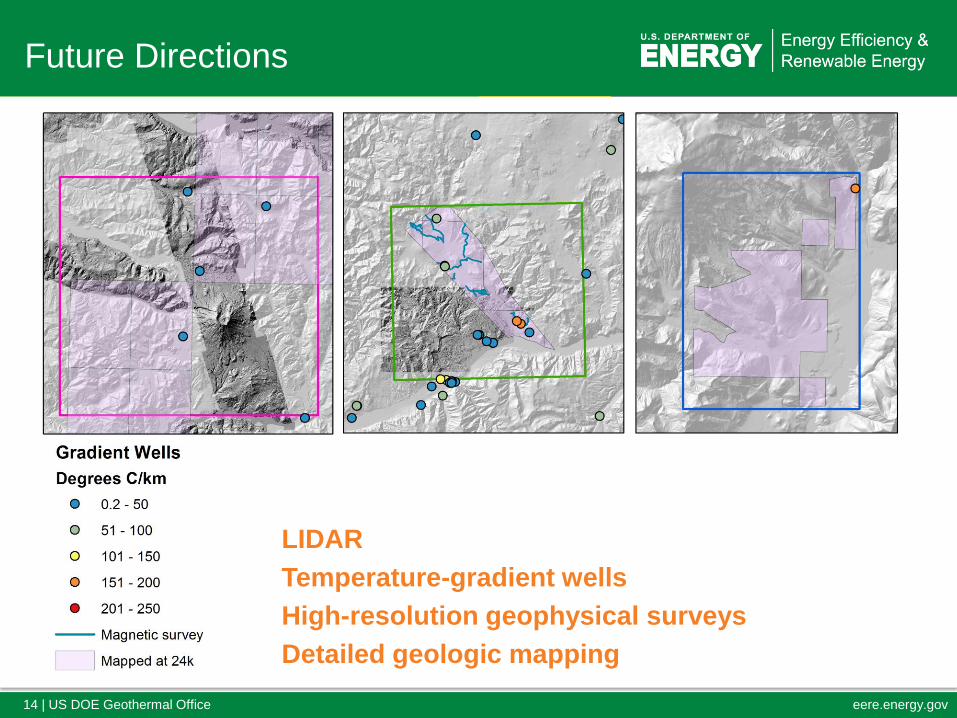
Mount St. Helens: completed Wind River valley Mount Baker
14 | US DOE Geothermal Office eere.energy.gov
Future Directions
.
Milestone or Go/No-Go Status & Expected Completion Date
Go/No-Go decision point for phase
2 of project
At Least one of the fairway models must: 1)
define a targetable zone within accessible
land, or 2) identify zones where more data is
needed. Expected completion: July 2015
Geothermal favorability maps for
the three areas will guide the
phase 2 go/no-go decision point
Future efforts will focus on siting
temperature-gradient wells and
(or) identifying where geologic and
geophysical data would improve
geothermal resource knowledge
LIDAR
Temperature-gradient wells
High-resolution geophysical surveys
Detailed geologic mapping
15 | US DOE Geothermal Office eere.energy.gov
• The Cascades magmatic arc and the three play-fairway targets
within the arc show promise for geothermal development in
Washington State.
• Innovative 3D permeability modeling techniques and
quantitative heat potential modeling highlight heat and
permeability at 200m and 3km depth.
• Rigorous uncertainty analyses of the favorability models are
underway.
• Uncertainty modeling determines which study area is the most
promising and will guide the Phase 2 go/no-go decision point.
• Future efforts will focus on siting temperature-gradient wells
and (or) identifying where collection of new geophysical data is
warranted.
Summary


