

EFFECT OF A PRESSURISED CO2 ENVIRONMENT ON
DEFORMATION AND FAILURE BEHAVIOUR OF TYPE
316H STAINLESS STEEL UNDER STEADY AND CYCLIC
CREEP CONDITIONS
A thesis submitted to The University of Manchester for the degree of
Doctor of Philosophy in the Faculty of Science and Engineering
2020
SÁNDOR PALKÓ
SCHOOL OF ENGINEERING
Department of Mechanical, Aerospace and Civil Engineering

List of contents
2
List of contents
List of contents .................................................................................................................. 2
List of abbreviations .......................................................................................................... 7
Abstract ............................................................................................................................. 8
Declaration ........................................................................................................................ 9
Copyright statement ........................................................................................................ 10
Dedication ....................................................................................................................... 11
Acknowledgements ......................................................................................................... 12
Background ..................................................................................................................... 13
1. Literature review ...................................................................................................... 14
1.1 Advanced Gas-cooled Reactors (AGRs) .......................................................... 14
1.1.1 AGR environment ..................................................................................... 16
1.1.2 Creep and creep-fatigue in AGR environment.......................................... 17
1.1.3 Corrosion of Type 316H stainless steel in AGR environment .................. 20
1.2 Austenitic stainless steel ................................................................................... 22
1.2.1 Type 316H stainless steel .......................................................................... 22
1.2.2 Role of alloying elements.......................................................................... 23
1.2.3 Precipitation in Type 316H stainless steel ................................................ 24
1.2.4 Effect of thermal ageing on material strength ........................................... 25
1.3 Deformation mechanisms in austenitic stainless steel ..................................... 26
1.3.1 Elastic-plastic deformation – basic stress-strain relations ........................ 26
1.3.2 Ramberg-Osgood material model ............................................................. 29
1.3.3 Deformation in a single crystal ................................................................. 30
1.3.4 Dislocations and stacking faults ................................................................ 32
1.3.5 Strain hardening ........................................................................................ 35
1.3.6 Polycrystalline deformation ...................................................................... 38
1.3.7 Creep deformation ..................................................................................... 41
1.3.7.1 Creep rate .............................................................................................. 43
1.3.7.2 Dislocation creep ................................................................................... 44
1.3.7.3 Diffusion creep ...................................................................................... 44
1.3.7.4 Creep stress and temperature dependence ............................................. 44
1.3.8 Cyclic stress-strain relations ..................................................................... 46
1.4 High-temperature oxidation and carburisation ................................................. 47
1.4.1 Basic relations in oxidation ....................................................................... 48
1.4.2 Oxidation of Type 316H stainless steel in AGR environment .................. 51
1.4.3 Oxide growth rate ...................................................................................... 53
1.4.4 Carburisation behaviour of Type 316H stainless steel in AGR
environment ............................................................................................................. 54
1.4.5 Impact of carburisation on material properties ......................................... 57
1.4.5.1 Profile of carburised material ................................................................ 58
1.4.5.2 Elastic modulus ..................................................................................... 60

List of contents
3
1.4.5.3 Yield stress ............................................................................................ 61
1.4.5.4 Tensile ductility ..................................................................................... 63
1.4.5.5 Creep deformation behaviour ................................................................ 64
1.4.5.6 Creep ductility ....................................................................................... 65
1.4.5.7 Compressive residual stresses ............................................................... 67
1.5 Factors affecting the kinetic behaviour of Type 316H stainless steel in
AGR environment ....................................................................................................... 68
1.5.1 Effect of surface preparation on oxidation and carburisation ................... 68
1.5.2 Influence of grain size ............................................................................... 71
1.5.3 Influence of temperature ........................................................................... 72
1.5.4 Effect of gas composition.......................................................................... 72
1.5.5 Impact of mechanical loading ................................................................... 73
2. Introduction and scope of work ............................................................................... 74
2.1 Background and motivation for research ......................................................... 74
2.2 Research aim and objectives ............................................................................ 75
2.3 Thesis structure ................................................................................................. 76
3. Materials and preconditioning ................................................................................. 78
3.1 As-received material (AR) ............................................................................... 78
3.2 Pre-carburised material (PC) ............................................................................ 79
3.2.1 Post-treatment microstructural evaluation of the PC material .................. 80
3.2.2 Limitations of the preconditioning procedure ........................................... 82
3.2.3 Advice on the use of pre-carburised (PC) test specimens ......................... 83
3.3 Thermally aged material (TA) .......................................................................... 84
3.4 Carburised tube material (CT) .......................................................................... 84
4. Techniques used for sample preparation, characterisation and investigation .......... 86
4.1 Mechanical grinding and polishing .................................................................. 86
4.2 Chemical-mechanical polishing (OPS) ............................................................ 86
4.3 Electrolytic etching with oxalic acid ................................................................ 87
4.4 FEG-SEM / EBSD / EDX ................................................................................ 87
4.5 Macro-hardness measurement .......................................................................... 88
4.6 Micro-hardness measurement ........................................................................... 88
4.7 Nano-hardness measurement ............................................................................ 88
5. Development of an improved experimental setup for creep testing under load
in a CO2 based environment ............................................................................................ 89
5.1 Rationale ........................................................................................................... 89
5.2 Design and development of the horizontal creep frame ................................... 90
5.3 Material selection ............................................................................................. 92
5.4 Load-carrying capacity analysis ....................................................................... 93
5.5 Mechanical limitations ..................................................................................... 94
5.6 Calibration of test equipment ........................................................................... 94
6. Uniaxial creep deformation of Type 316H stainless steel in air at 550°C ............... 97
6.1 Overview .......................................................................................................... 97

List of contents
4
6.2 Experimental details ......................................................................................... 98
6.2.1 Material and sample preparation ............................................................... 98
6.2.2 Standard uniaxial creep testing rig ............................................................ 99
6.2.3 Operating procedure, start-up and shut-down ......................................... 100
6.2.4 Creep testing on TA and PC material in air at 550°C ............................. 102
6.2.5 Interrupted creep testing on PC material in air at 550°C ........................ 102
6.2.6 List of creep tests carried out .................................................................. 103
6.3 Results and analyses ....................................................................................... 104
6.3.1 Creep behaviour of TA and PC material in air at 550°C ........................ 104
6.3.1.1 Visual examination and dimensional analysis ..................................... 104
6.3.1.2 Load up behaviour ............................................................................... 105
6.3.1.3 Strain hardening behaviour.................................................................. 110
6.3.1.4 Uniaxial creep properties ..................................................................... 114
6.3.1.5 Comparison of the normalised creep strain curves.............................. 116
6.3.1.6 Creep strain rates for all test specimens .............................................. 117
6.3.2 Short-term creep properties and cracking behaviour of PC material
(interrupted creep testing) ...................................................................................... 118
6.3.2.1 Load up behaviour ............................................................................... 118
6.3.2.2 Creep deformation ............................................................................... 119
6.3.2.3 Crack analyses ..................................................................................... 119
6.3.2.4 Surface and bulk hardness measurements ........................................... 123
6.4 Discussion ...................................................................................................... 124
6.4.1 Monotonic tensile properties ................................................................... 124
6.4.1.1 Basis of analysis .................................................................................. 124
6.4.1.2 The effect of carburisation on strain hardening behaviour .................. 125
6.4.2 Impact of material conditioning and applied stress on creep properties . 125
6.4.3 Surface crack initiation and growth in PC material ................................ 129
6.5 Conclusions .................................................................................................... 130
7. Material characterisation and microstructural analyses ......................................... 132
7.1 Header material background........................................................................... 132
7.2 Metallographic characterisation methods ....................................................... 133
7.2.1 Baseline characterisation of the AR header material .............................. 133
7.2.1.1 Macro-hardness measurements ........................................................... 134
7.2.1.2 Micro-hardness measurements ............................................................ 134
7.2.2 Grain size analysis of crept specimens of AR material........................... 134
7.2.2.1 Sample preparation .............................................................................. 135
7.2.2.2 Imaging and grain size measuring methods ........................................ 136
7.2.3 Chemical analysis of crept specimens of AR material............................ 136
7.2.4 Characterisation and microstructural examination of the CT material ... 137
7.2.4.1 Carburised sample preparation ............................................................ 137
7.2.4.2 Microscopy and grain size analysis techniques ................................... 138
7.2.4.3 Method for evaluating carburisation ................................................... 138
List of contents
5
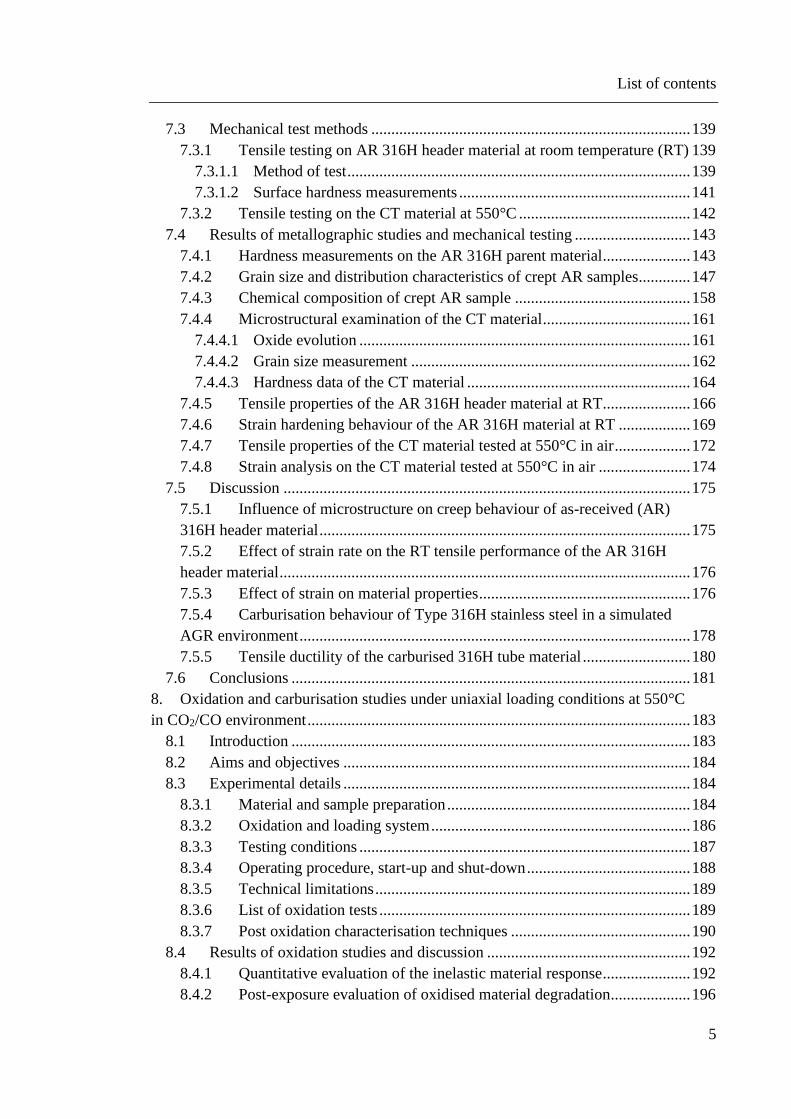
7.3 Mechanical test methods ................................................................................ 139
7.3.1 Tensile testing on AR 316H header material at room temperature (RT) 139
7.3.1.1 Method of test ...................................................................................... 139
7.3.1.2 Surface hardness measurements .......................................................... 141
7.3.2 Tensile testing on the CT material at 550°C ........................................... 142
7.4 Results of metallographic studies and mechanical testing ............................. 143
7.4.1 Hardness measurements on the AR 316H parent material...................... 143
7.4.2 Grain size and distribution characteristics of crept AR samples............. 147
7.4.3 Chemical composition of crept AR sample ............................................ 158
7.4.4 Microstructural examination of the CT material ..................................... 161
7.4.4.1 Oxide evolution ................................................................................... 161
7.4.4.2 Grain size measurement ...................................................................... 162
7.4.4.3 Hardness data of the CT material ........................................................ 164
7.4.5 Tensile properties of the AR 316H header material at RT...................... 166
7.4.6 Strain hardening behaviour of the AR 316H material at RT .................. 169
7.4.7 Tensile properties of the CT material tested at 550°C in air ................... 172
7.4.8 Strain analysis on the CT material tested at 550°C in air ....................... 174
7.5 Discussion ...................................................................................................... 175
7.5.1 Influence of microstructure on creep behaviour of as-received (AR)
316H header material ............................................................................................. 175
7.5.2 Effect of strain rate on the RT tensile performance of the AR 316H
header material ....................................................................................................... 176
7.5.3 Effect of strain on material properties ..................................................... 176
7.5.4 Carburisation behaviour of Type 316H stainless steel in a simulated
AGR environment .................................................................................................. 178
7.5.5 Tensile ductility of the carburised 316H tube material ........................... 180
7.6 Conclusions .................................................................................................... 181
8. Oxidation and carburisation studies under uniaxial loading conditions at 550°C
in CO2/CO environment ................................................................................................ 183
8.1 Introduction .................................................................................................... 183
8.2 Aims and objectives ....................................................................................... 184
8.3 Experimental details ....................................................................................... 184
8.3.1 Material and sample preparation ............................................................. 184
8.3.2 Oxidation and loading system ................................................................. 186
8.3.3 Testing conditions ................................................................................... 187
8.3.4 Operating procedure, start-up and shut-down ......................................... 188
8.3.5 Technical limitations ............................................................................... 189
8.3.6 List of oxidation tests .............................................................................. 189
8.3.7 Post oxidation characterisation techniques ............................................. 190
8.4 Results of oxidation studies and discussion ................................................... 192
8.4.1 Quantitative evaluation of the inelastic material response ...................... 192
8.4.2 Post-exposure evaluation of oxidised material degradation.................... 196

List of contents
6
8.4.2.1 Visual appearance of the oxidised samples ......................................... 196
8.4.2.2 SEM cross-sectional examinations: conventional specimens ............. 198
8.4.2.3 SEM cross-sectional examinations: tapered specimen ........................ 202
8.4.2.4 Hardness measurements: conventional specimens .............................. 204
8.4.2.5 Hardness measurements: tapered specimen ........................................ 212
8.5 Discussion ...................................................................................................... 215
8.5.1 Effect of surface preparation on oxide evolution .................................... 215
8.5.2 Effect of stress on oxide evolution .......................................................... 216
8.5.3 Effect of exposure time on oxide evolution ............................................ 218
8.5.4 Surface hardening.................................................................................... 218
8.5.5 Effect of time on carburisation ................................................................ 220
8.6 Conclusions .................................................................................................... 221
9. General summary and conclusions ........................................................................ 223
10. Future work ............................................................................................................ 226
11. References .............................................................................................................. 228
12. Appendix ................................................................................................................ 240
Final word count: 61,046

List of abbreviations
7
List of abbreviations
AFW Amec Foster Wheeler
AGR Advanced Gas-cooled Reactor
AR As-received
BCC Body centred cubic
CRSS Critical resolved shear stress
CT Carburised tube
EBSD Electron backscatter diffraction
EDM Electrical discharge machining
EDX Energy dispersive X-ray
ENVISINC Environmental Impact on the Structural Integrity of Nuclear Components
EPSRC Engineering and Physical Sciences Research Council
FCC Face centered cubic
FEG Field emission gun
GB Grain boundary
HAZ Heat affected zone
HCP Hexagonal close packed
HRA Hartlepool power station
HTBASS High Temperature Behaviour of Austenitic Stainless Steels
ID Inside diameter
LOM Light optical microscope
LVDT Linear variable displacement transducer
OD Outside diameter
OMS Oxidation monitoring scheme
OPS Oxide polishing suspension
P2P Pip-to-pip (Ridge-to-ridge)
PC Pre-carburised
PGL Parallel gauge length
PWR Pressurised water reactor
RT Room temperature
SCC Stress corrosion cracking
SEM Scanning electron microscope
SFE Stacking fault energy
SS Stainless steel
SSRT Slow strain rate tensile
TA Thermally aged
UK United Kingdom
UKAS United Kingdom Accreditation Service
UOM University of Manchester
UTS Ultimate tensile strength
Abstract
8
Abstract
A significant number of stainless steel components within the boilers of the UK AGR
plants are subjected to oxidation, carburisation and other changes in the underlying
microstructure of the material during operation. This results from exposure to the
pressurised CO2-based primary circuit coolant at temperatures from about 500 to 650°C.
It is believed that there is a synergistic relationship between the pressurised CO2 coolant
environment and creep-fatigue initiation and cracking. Devising and implementing an
evaluation methodology to account for oxidation and carburisation to enable conservative
lifetime assessments is essential to manage plant lifetime. Therefore, the development of
a new and fundamental understanding of environmentally assisted degradation and failure
mechanisms is required. It has been postulated that the mechanism underlying the
initiation of cracks is carburisation associated with the presence of a duplex oxide layer.
In this study, the material-environment interaction for Type 316H stainless steel under
simulated AGR conditions has been investigated to increase the understanding of the
combined effects of stress, strain and surface preparation, for example, on oxidation and
cracking behaviour. Experimental data are presented which show that the presence of an
ultrafine grained layer induced by surface grinding promotes the formation of a thin and
protective oxide scale. Conversely, the removal of the surface deformed layer by chemical
polishing using an oxide dispersion polishing solution (OPS), leads to the formation of a
much ticker duplex oxide that protrudes along the grain boundaries. Furthermore, an
increased surface hardness due to carburisation has been observed for the polished surface
only, suggesting that carburisation occurs at an early stage on a chemically polished
(OPS) surface. In fact, the elevated hardness was observed only at regions associated with
creep deformation. It is found that when the substrate is plastically deformed and under
the effect of active stress, the thin oxide on the work hardened (abraded) surface can be
disrupted, resulting in similar oxidation behaviour to a chemically polished surface but
with a better resistance to carbon ingress.

Declaration
9
Declaration
No portion of the work referred to in the thesis has been submitted in support of an
application for another degree or qualification of this or any other university or other
institute of learning.

Copyright statement
10
Copyright statement
(i) The author of this thesis (including any appendices and/or schedules to this
thesis) owns certain copyright or related rights in it (the “Copyright”) and he
has given The University of Manchester certain rights to use such Copyright,
including for administrative purposes.
(ii) Copies of this thesis, either in full or in extracts and whether in hard or
electronic copy, may be made only in accordance with the Copyright, Designs
and Patents Act 1988 (as amended) and regulations issued under it or, where
appropriate, in accordance with licensing agreements which the University has
from time to time. This page must form part of any such copies made.
(iii) The ownership of certain Copyright, patents, designs, trademarks and other
intellectual property (the “Intellectual Property”) and any reproductions of
copyright works in the thesis, for example graphs and tables
(“Reproductions”), which may be described in this thesis, may not be owned
by the author and may be owned by third parties. Such Intellectual Property
and Reproductions cannot and must not be made available for use without the
prior written permission of the owner(s) of the relevant Intellectual Property
and/or Reproductions.
(iv) Further information on the conditions under which disclosure, publication and
commercialisation of this thesis, the Copyright and any Intellectual Property
and/or Reproductions described in it may take place is available in the
University IP Policy
(see http://documents.manchester.ac.uk/DocuInfo.aspx?DocID=24420), in
any relevant Thesis restriction declarations deposited in the University
Library, The University Library’s regulations
(see http://www.library.manchester.ac.uk/about/regulations/) and in The
University’s policy on Presentation of Theses.

Dedication
11
Dedication
A thesis to the memory of my late father.
Mennyei eszterga
Ma megtőrt az élet; hát ide jutottam.
Nyughelyed szegletén szinte kárhozottan
Csak neked mondom el, ne tudja a világ…
Higgye csak mindenki, hogy büszkén megyek tovább.
Istenre bíztalak, mert én megértettem,
Hogy az élet rendje ilyenkor kegyetlen.
De mélyen lelkemet a tehetetlenség-érzés
Úgy megbabonázta mint az Istenverés.
Mert most is azt érzem: Te rám számítottál,
Minden panasz nelkül addig kitartottál
Amíg haza értem. S bár nem láttad arcom,
Remélted, világod én majd visszahozom.
Képzeletben meg is mentettelek százszor,
Esdeklő szavamra hallgatott a Pásztor.
Máskor tudománnyal gyógyítottalak meg;
"Majd én megfizetek " - mondtam az Istennek.
Aztán átvettem fájdalmad és bíztattalak Téged,
Hogy mikor Te már nem… én majd lélegzek helyetted.
S győzelmed örömét angyalok dalolták
Amint szörnyű gyötrelmeid szárnnyá kovácsolták.
Ám a valoság karja mindig visszarántott,
S a drága alkuból nem lett más csak átok.
Hiábavalová lett az itthon létem,
Valójában rajtad nem is segítettem.
Folyton azt hazudtam, hogy felépülsz újra,
Könnyedén, ahogy a gyermek a gyufát kihúzza.
Minden törekvésed húztam-halogattam,
"Majd megoldjuk nyáron " - csak ezt hajtogattam.
Óh, messze még a nyár és ágyad oly halálos,
Mint a viharvert hajó, melyet a tenger dühe elmos.
Kezedet sem fogtam kínjaid közepette;
Jut belőle részem így most egész életemre.
De tovább élsz bennem és az unokákban,
Így lesz földi léted örök e világban.
S bár életed során az Urat nem kérted,
Hogy lelked mennybe jusson - Apám, megteszek mindent érted!
Marosvásárhely, 2018. május 2.

Acknowledgements
12
Acknowledgements
I would like to express my sincere gratitude to my supervisors Prof. Robert
Ainsworth and Dr. Fabio Scenini for offering me this great research opportunity and their
continuous support, advice and encouragement over the past few years. I am thankful to
Prof. Mike C. Smith and Dr. Marc Chevalier who gave me many invaluable suggestions
and made productive comments on my work. Special thanks go to Dr. Bo Chen for the
useful data and information provided in the initial stage of my PhD project.
I wish to acknowledge support from the Engineering and Physical Sciences
Research Council (EPSRC), EDF Energy and the Centre for Doctoral Training in
Materials for Demanding Environments (CDT in M4DE). I would like to extend my
acknowledgements to Seán Flannagan, Dr. Peter Deem, Dr. Yang Liu and all other
members of Amec Foster Wheeler for their constructive discussions and helpful meetings,
and their technical assistance with my experiments.
I would also like to thank my research colleagues, friends and members of staff at
The University of Manchester for their support.
Above all, I’m sincerely grateful to my grandparents, parents and my lovely wife
without whom the accomplishments in life and research would not have been possible.
And last, but certainly not least, I would like to thank God for guiding me on the
right path and for giving me strength and wisdom in times of need.

Background
13
Background
The current AGR nuclear plants operated by EDF Energy are reaching the end of their
intended design life and there are significant commercial drivers to extend the operational
life. To enable an extension to the operational life and maintain the required safety
requirements re-examination of potential conservatisms within assessments of in-reactor
high temperature components is required.
A significant number of AGR plant components operate in a CO2 environment at
temperatures in the range 500-650°C. These components experience severe oxidation and
carburisation during plant operation. The oxidation and carburisation mechanisms occur
in the steel-materials quasi-simultaneously as a consequence of their exposure to the
primary CO2 coolant environments in the creep regime. It has also been postulated that
the initiation and growth of cracks in these components may be adversely affected by the
CO2 environment. However, virtually all of the laboratory tests carried out on relevant
materials (including Type 316H steel) have been performed in an air environment.
Therefore there is a strong economic incentive to understand the environmentally induced
microstructural and mechanical degradation mechanisms and to develop and quantify the
margin of improvement resulting from the use of Type 316H stainless steel.

Chapter 1: Literature review
14
1. Literature review
The literature survey is aimed at providing important details about the environmental
effects and their relevance to degradation mechanisms in Advanced Gas-cooled Reactor
(AGR) nuclear plants, focusing primarily on Type 316H stainless steel. Extension of the
lifetime of the AGRs is strongly challenged by the structural integrity of the in-reactor
components for safe and economical operation. Detailed studies have confirmed a creep
dominated creep-fatigue crack growth mechanism in stainless steel (SS) components,
exacerbated by the impact of oxidation and carburisation. The current understanding of
these mechanisms and their detrimental effects on the material properties are summarised
in this chapter.
1.1 Advanced Gas-cooled Reactors (AGRs)
Nuclear power is the most affordable large-scale, low-carbon energy source currently
available to the UK. The AGR is a type of nuclear reactor which has only been built in
Great Britain. A total of fourteen AGR reactors at six different sites were built between
1976 and 1988, Figure 1 [1]. All of these are configured with two reactors in a single
building. The various AGR stations owned and operated by EDF Energy UK produce
outputs in the range of 555 MWe to 670 MWe although some run at lower than design
output due to operational restrictions [2].
Figure 1 AGR stations in Great Britain [1].

Chapter 1: Literature review
15
Although some of the AGRs have operated for over 35 years, which is in excess of their
original design lives of 25 or 30 years, there are significant commercial drivers to extend
their operational life. Since 2008, EDF Energy has added an average of over eight years
to the expected closure date of their AGR fleet, Figure 2 [3]. Therefore, to enable safe
and reliable operations over extended life, re-examination of potential conservatisms
within assessments of in-reactor high temperature components is required.
Figure 2 Original and extended closure dates of UK’s AGR fleet [3].
The AGR is graphite moderated and cooled with carbon dioxide gas. The core consists of
high strength graphite bricks mounted on a steel grid. Fuel rods of enriched uranium
dioxide (UO2) clad in stainless steel (25Cr-20Ni) are placed in graphite sleeves and
inserted into vertical channels in the bricks. Gas circulators blow CO2 up through the core
and down into steam generators. Holes in the graphite allow access to the gas. The outlet
temperature of the CO2 is about 670°C at a pressure of about 4 MPa. The graphite in the
core is kept at temperatures below 450°C to avoid thermal damage. The reactor core, gas
circulators and steam generators are encased in a pressure vessel made of pre-stressed
concrete lined with a mild steel to make it gas tight. Mild steel is used in areas of the
pressure vessel that are exposed to temperatures less than 350°C. In regions at
temperatures between 350°C and 520°C annealed 9Cr-1Mo steel is used whilst austenitic
stainless steel (i.e. Type 316H) is used for regions hotter than this. Power is primarily
controlled through the insertion of control rods made of boron-steel, with back-up by
insertion of nitrogen into the cooling gas or by releasing fine boron-rich balls into the gas
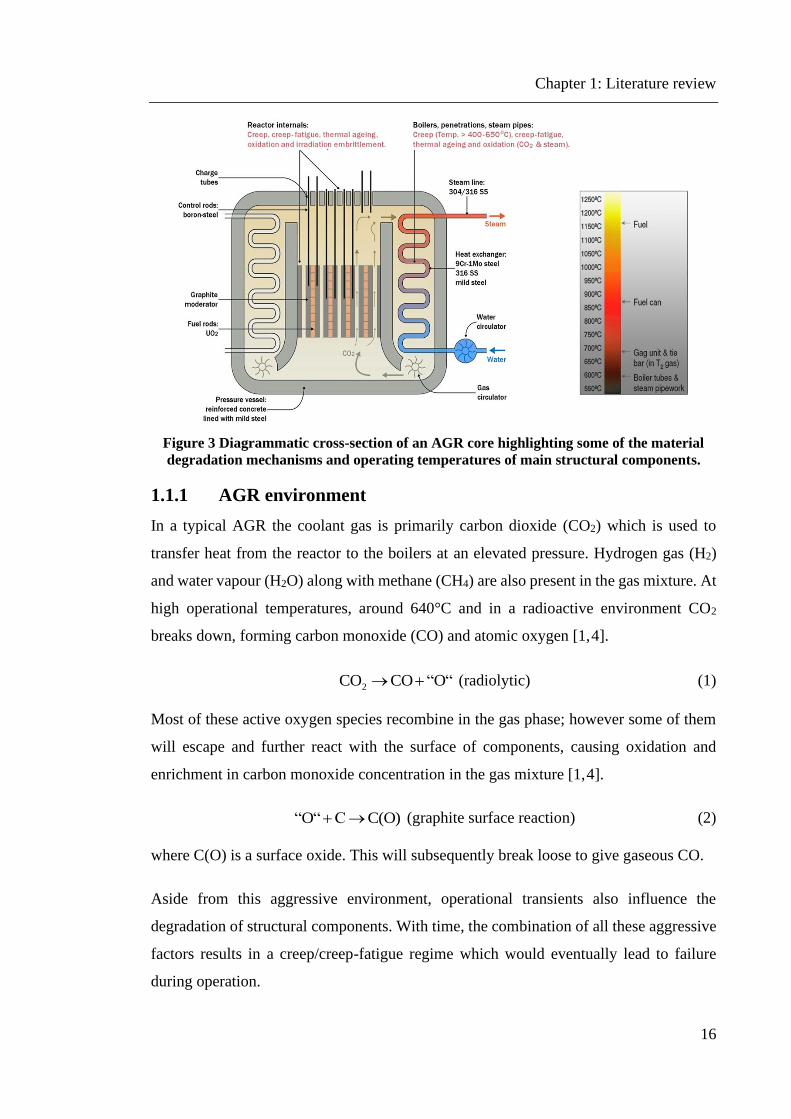
stream. The general layout of a typical AGR is shown in Figure 3.
Chapter 1: Literature review
16
Figure 3 Diagrammatic cross-section of an AGR core highlighting some of the material
degradation mechanisms and operating temperatures of main structural components.
1.1.1 AGR environment
In a typical AGR the coolant gas is primarily carbon dioxide (CO2) which is used to
transfer heat from the reactor to the boilers at an elevated pressure. Hydrogen gas (H2)
and water vapour (H2O) along with methane (CH4) are also present in the gas mixture. At
high operational temperatures, around 640°C and in a radioactive environment CO2
breaks down, forming carbon monoxide (CO) and atomic oxygen [1, 4].
2CO CO O“ “→ + (radiolytic) (1)
Most of these active oxygen species recombine in the gas phase; however some of them
will escape and further react with the surface of components, causing oxidation and
enrichment in carbon monoxide concentration in the gas mixture [1, 4].
O O“ )“ C C(→+ (graphite surface reaction) (2)
where C(O) is a surface oxide. This will subsequently break loose to give gaseous CO.
Aside from this aggressive environment, operational transients also influence the
degradation of structural components. With time, the combination of all these aggressive
factors results in a creep/creep-fatigue regime which would eventually lead to failure
during operation.

Chapter 1: Literature review
17
1.1.2 Creep and creep-fatigue in AGR environment
In AGRs creep and creep-fatigue are among the most dominant factors affecting the
integrity of steel components operating at elevated temperatures. Although cracks may
initiate and grow by these mechanisms during steady-state operating conditions at high
temperature, ultimate failure may occur at low temperatures under start-up/shutdown
transients [5]. In consequence, recent concerns also comprise units that originally were
not designed for cyclic conditions. Various studies have been conducted with respect to
crack initiation and propagation by the above-mentioned mechanisms in order to identify
an appropriate damage approach and develop reliable life prediction methods.
Creep is a function of stress, temperature, strain and time. Under long term exposure,
constant levels of stress that are below the yield strength of the material in conjunction
with elevated temperatures induce the motion of dislocations and discontinuities within
the material, which is the main reason for creep strain development. Degradation can be
manifested in several forms, leading eventually to permanent dimensional changes that
may result in distortion, loss of clearance, wall thinning, etc. Long term creep generally
ends in brittle failures involving cavitation and crack growth at interfaces and at highly
stressed regions. Severe localized deformation can also cause swelling and eventual leaks
in components constituting the core structure of AGRs, such as headers, steam pipes and
superheater reheater tubes [5].
Components which operate at high temperature may be subject to the combined
aggregation of cyclic damage and creep damage, frequently called creep-fatigue. This
form of damage is generally the result of thermal stresses generated during transient
conditions when thermal expansion is constrained along with large plastic strains arising
locally at stress concentrations. It may also involve primarily elastic strains combined
with stress relaxation [5]. The development of creep-fatigue damage depends on a number
of variables, such as temperature, strain range, hold time, creep strength and ductility of
the material. At high application temperatures, for short hold time and/or at relatively
high strain rates, crack initiation and propagation is fatigue dominated. Creep conditions
become more influential and then fully dominant on crack evolution with increasing hold
time and/or decreasing tensile strains. Interaction of fatigue cracking with creep damage
is representative of intermediate hold times and strain rates, resulting in enhanced crack

Chapter 1: Literature review
18
propagation, Figure 4 [6]. As creep ductility decreases, the extent of any interaction
increases.
Figure 4 Creep-fatigue failure mechanisms: (a) fatigue dominated; (b) creep dominated;
(c) creep-fatigue interaction (due to consequential creep damage accumulation); and (d)
creep-fatigue interaction (due to simultaneous creep damage accumulation) [6].
It was found that high tensile strains at low temperature favour the cracking of oxides and
hence accelerated environmentally induced damage amid further exposure to high
temperatures [7]. In such fatigue conditions oxidation at the crack tip is a dominant
mechanism in crack growth, whereas in creep dominated conditions the principal internal
damage is by grain boundary cavity growth [8]. In addition to environmental effects, the
relaxed mean stress also plays a significant role in how these cycles interact. It has been
demonstrated that in grade 316H stainless steels the concentration of the solute elements
within the matrix has a significant influence on stress relaxation rates under creep damage
condition [9]. Additional observations suggest that solution annealed specimens tend to
have a higher resistance to creep compared to thermally aged ones [9].
Any change in the material internal state can have a detrimental impact on both creep and
oxidation properties during the service life of a component. Oxidation affects the creep
behaviour of the near-surface material by altering the microstructure [9]. For instance,
strain incompatibility between grains and/or the development of cell/sub-grain structures
at the oxide-substrate interface may generate internal stresses. In parallel, change in the
material internal resistance to dislocation motion also occurs, affecting the overall creep
Chapter 1: Literature review
19
deformation [10]. It has been reported that cyclic loading can increase the creep life of
316H stainless steels by up to three times and reduce the creep ductility to half of its
magnitude compared with dwell conditions. This phenomenon may be again associated
with internal stresses induced by variations in the load and temperature, such as
intergranular stresses resulting from divergent grain orientations and/or heterogenic
distribution of dislocations [11].
Although the CO2 environment strengthens the material, testing above AGR operating
temperatures has shown that simultaneously it reduces the tensile and creep ductility of
austenitic steels. Studies also concluded that cracking is generally related to grain
boundary Cr depletion (sensitisation) and increased carbon concentration. Such an
environmental dependency of creep cracking was justified by experiments conducted in
vacuum in which the samples showed no cracking. Vacuum tests also established that
pre-oxidised specimens tend to have higher strain rates when compared to as-received
samples. The effect of pre-oxidation on the oxide layer is fairly straightforward, the extent
to which straining beyond yield leads to failure of the healing layer and enhanced
oxidation. Earlier studies reported that for 10%Cr steels the steady state creep rates
increased with raising oxygen partial pressure. As regards creep properties in CO2
environment, carburisation was found to enhance time to rupture of 9%Cr alloys. Thus,
it is quite evident that the performance of austenitic steels is highly dependent on all of
the above mentioned environmental impacts with respect to both creep and oxidation
mechanisms [12].
Methodologies to determine creep and creep-fatigue crack initiation and propagation in
components are precisely defined in the R5 high temperature assessment procedures. The
safe operating life of components may be assessed under two distinct stages. The first is
assessment of the time for cracking to occur in the initially defect free component as a
result of combined creep and fatigue damage. The second is assessment of the time for a
crack in the component to grow to a critical size as a result of creep and fatigue
mechanisms. It has to be emphasised here that crack initiation and growth do not always
denote an unsafe structure. Under specific circumstances a crack may propagate sub-
critically during the safe life of the component, or might arrest and become dormant [13].
The relative importance of crack initiation versus growth in assessing the remaining life

Chapter 1: Literature review
20
of a component has been illustrated by Viswanathan with the help of Figure 5, where the
two distinct scenarios are clearly identified [5]. Macroscopic cracks initiate in Region I
as a result of inceptive microscopic damage events, such as dislocation rearrangements,
coarsening of precipitate phases, and formation of creep cavities and microcracks. Region
II corresponds to propagation of the above-mentioned macrocracks and their growth up
to critical sizes, defined as ac, at which point rapid fracture occurs.
Figure 5 Illustration of a remaining-life-assessment procedure for a common failure
scenario involving crack initiation and propagation. A – embrittlement phenomena; and
B – unanticipated factors (excess cycling, temperature excursions, corrosion, metallurgical
degradation, improper material, excessive stresses) [5].
1.1.3 Corrosion of Type 316H stainless steel in AGR environment
Life limiting degradation mechanisms in AGR environments directly related to creep-
fatigue degradation are exacerbated by simultaneous oxidation and carburisation. Metal
loss reduces significantly the active load-bearing section of an alloy while carburisation
leads to material embrittlement, both representing a risk to the lifetimes of boiler and
reactor internal components in AGR power plants. However, resistance to corrosion of
Type 316H steels designated for such reactors relies on the formation of a compact and
adherent, slow-growing, chromium-rich oxide scale on the surface which is expected to
protect the underlying metal. Unfortunately, this is not always the case as under the
external oxide there is always a Cr depleted region and in some temperature ranges,
typically 500°C to 600°C, a healing layer may never form after the breakdown of the
initial chromia film (Cr2O3), resulting in continuous oxidation and carburisation [14].
Where chromium content is low, surface layers are formed by thicker and less protective

Chapter 1: Literature review
21
duplex oxides that further exacerbate internal oxidation and carburisation when a Cr-rich
healing layer has not developed. Moreover, cold work and grain size can also have a
significant effect on the oxidation rates by changing the diffusion paths available for Cr
[14]. The effects of these variables are described in more detail in Section 1.5. Figure 6
schematically illustrates the complex processes of oxidation and carburisation along with
the chemical reactions taking place at the metal surface [12].
Figure 6 Summary of chemical reactions occurring in an oxidising/carburising
environment [12].
The chemical environment at the core of AGRs consists of various gases, primarily CO2,
CO, H2, water vapour and trace amounts of methane. As shown in Figure 6, the coolant
gas has the ability to both oxidise the exposed material as well as carburise the metal
substrate. The concentration of carbon monoxide is further increased through the water
gas shift reaction induced by the high temperature inside the reactor. Formation of a
carburised layer in such an aggressive environment, however, is governed mainly by the
Boudouard reaction taking place at the metal surface. At high temperatures, internal
carburisation may also occur through the breakdown of the chromia scale into carbides
which allows carbon ingress into the metal. It should be noted that carbon diffusion is
commonly thought to be associated with the nature of the oxide scale developed on the
metal surface and the oxygen potential of the environment [12]. The aforesaid processes
are detailed in the upcoming sections of this chapter.

Chapter 1: Literature review
22
1.2 Austenitic stainless steel
Austenitic steels are non-magnetic stainless steels that contain high levels of chromium
and nickel and low levels of carbon. Known for their formability and resistance to
corrosion, austenitic steels are the most widely used grade of stainless steel. The austenitic
range of stainless steels are defined by their face centered cubic (FCC) crystalline
structure which, in 300 series steels, forms when a sufficient quantity of nickel is added
to the alloy in proportion to the chromium content. Heat treatment of austenitic stainless
steels, however, does not improve hardness but it can be performed for other reasons. In
turn, they can be cold worked to improve hardness, strength and stress resistance. They
possess good formability and weldability, as well as excellent toughness, particularly at
low or cryogenic temperatures. Austenitic grades also have a low yield stress and
relatively high tensile strength.
1.2.1 Type 316H stainless steel
In its simplest form stainless steels are iron (Fe) based alloys having enhanced corrosion-
resistance properties due to alloying additions such as chromium (Cr), at least 12 wt.%.
The Cr content allows the formation of a passive chromium oxide scale (or chromia of
the formula Cr2O3) on the steel surface which protects the underlying material from
corrosion by producing a barrier for diffusion. A local concentration greater than about
13 wt.% Cr is required to form an impervious and corrosion resistant oxide layer [15].
Formation of the chromia film at the surface however results in a reduction of the Cr
concentration within the matrix. Stainless steels commonly have greater than 13 wt.% Cr
enabling self-healing of the protective film if it is damaged mechanically or chemically.
Type 316H is a high-carbon-containing austenitic stainless steel developed for use in high
temperature applications within the boilers of the AGRs because of its high temperature
strength, good oxidation and creep resistance. Grade 316H is classified as austenitic
having a face centred cubic (FCC) crystal structure in contrast with ferritic steels having
a body centred cubic (BCC) structure. It contains Cr additions for enhanced corrosion
resistance however Cr stabilises ferrite due to having a BCC crystal structure. On the
other hand, 316H stainless steel contains sufficient Ni (with FCC crystal structure) to
enable the austenitic structure to be the stable equilibrium phase at room temperature and
below. The austenitic structure of the material gives this grade excellent toughness and
Chapter 1: Literature review
23
also ensures added creep-rupture strength at high temperature environments due to
specific heat treatments that ‘H’ grade materials undergo. In nuclear reactors they can
commonly be found in boilers and pressure vessels. A typical alloy composition for Type
316H stainless steels is shown in Table 1 [16].
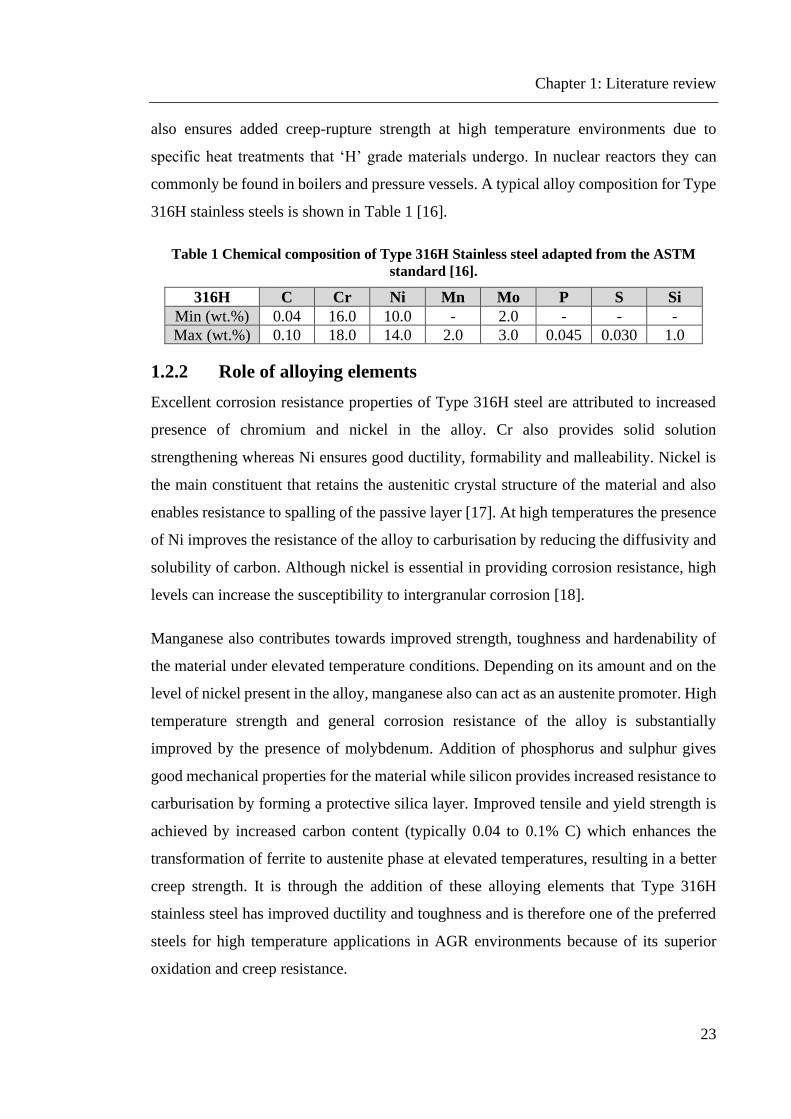
Table 1 Chemical composition of Type 316H Stainless steel adapted from the ASTM
standard [16].
316H C Cr Ni Mn Mo P S Si
Min (wt.%) 0.04 16.0 10.0 - 2.0 - - -
Max (wt.%) 0.10 18.0 14.0 2.0 3.0 0.045 0.030 1.0
1.2.2 Role of alloying elements
Excellent corrosion resistance properties of Type 316H steel are attributed to increased
presence of chromium and nickel in the alloy. Cr also provides solid solution
strengthening whereas Ni ensures good ductility, formability and malleability. Nickel is
the main constituent that retains the austenitic crystal structure of the material and also
enables resistance to spalling of the passive layer [17]. At high temperatures the presence
of Ni improves the resistance of the alloy to carburisation by reducing the diffusivity and
solubility of carbon. Although nickel is essential in providing corrosion resistance, high
levels can increase the susceptibility to intergranular corrosion [18].
Manganese also contributes towards improved strength, toughness and hardenability of
the material under elevated temperature conditions. Depending on its amount and on the
level of nickel present in the alloy, manganese also can act as an austenite promoter. High
temperature strength and general corrosion resistance of the alloy is substantially
improved by the presence of molybdenum. Addition of phosphorus and sulphur gives
good mechanical properties for the material while silicon provides increased resistance to
carburisation by forming a protective silica layer. Improved tensile and yield strength is
achieved by increased carbon content (typically 0.04 to 0.1% C) which enhances the
transformation of ferrite to austenite phase at elevated temperatures, resulting in a better
creep strength. It is through the addition of these alloying elements that Type 316H
stainless steel has improved ductility and toughness and is therefore one of the preferred
steels for high temperature applications in AGR environments because of its superior
oxidation and creep resistance.

Chapter 1: Literature review
24
1.2.3 Precipitation in Type 316H stainless steel
At elevated temperatures carbon combines with other alloying elements and forms a
number of different precipitates in the microstructure, such as carbides and intermetallics.
These microstructural changes can have a detrimental influence on both creep and
oxidation resistance of the material. Although 316H’s equilibrium phase is austenite,
large amounts (up to approximately 10 vol%) of δ-ferrite are often retained within the
material at room temperature [19], depending on the cooling rate when casting the
original ingot [20]. During the manufacturing process δ-ferrite transforms to austenite by
diffusion of Cr and Ni between the phases. However the presence of residual δ-ferrite is
due to the slow diffusion rates of Cr and Ni compared to the cooling rate, thus equilibrium
is not reached. The slow rate of diffusion also leads to a non-homogenous distribution of
the alloying elements within the microstructure [20].
During prolonged ageing (at 525°C for 65,000 h) of 300 series austenitic steels, α-ferrite
and M23C6 carbide are able to nucleate preferentially at regions where the Cr and Mo
concentration is increased [21]. The micro-segregation of alloying elements due to slow
diffusion rates within the ingot casting aids formation of α-ferrite, whereas M23C6
carbides are first formed along the grain boundaries after only a few tens of hours when
exposed to a temperature of 525°C, providing nucleation sites for α-ferrite [21]. Both
intra-granular and inter-granular second phase precipitates increase the ability of the
material to impede dislocation motion, thereby imparting high temperature strength.
Since chromium has more affinity to carbon than other elements found in the matrix, the
M23C6 precipitates are, in general, Cr23C6 carbides however M can also be substituted by
Fe, Ni and Mo [22]. Consequently, grain boundary precipitation leads to chromium
depleted zones in the material, as schematically shown in Figure 7. This Cr depleted zone
becomes weak and is subjected to preferential attack from corrosive media. Furthermore,
on ageing (e.g. 10,000 hours at 650°C) the δ-ferrite transforms to chromium and
molybdenum rich sigma (σ) and chi (χ) phases; both phases cause embrittlement of the
material at low temperature [23].

Chapter 1: Literature review
25
Figure 7 Schematic showing the formation of Chromium carbides at grain boundaries,
leaving behind a Cr depleted zone adjacent to grain boundaries.
1.2.4 Effect of thermal ageing on material strength
As previously stated, stainless steel, due to its alloying elements can form different types
of precipitates when exposed to relatively high temperatures (~650°C) for long periods.
The formation and nature of precipitates are highly influenced by the ageing temperature,
duration of ageing and also by the ratios of the alloying elements present. For example,
the extremely complex microstructure of long-term (60,000 h) thermally aged Type 316
steel revealed eighteen different precipitate phases [24]. An increased presence in both
the amount and type of second-phase precipitates leads to perceptible compositional
changes of the austenite matrix which, in turn, results in a deterioration of the mechanical
properties where, in particular, the material is embrittled.
Although embrittlement is often associated with precipitation of intermetallic phases,
particularly of sigma phase, the most likely cause seems to be the very dense precipitation
of M23C6 carbides. The formation of these carbides, predominantly at grain boundaries,
leads not only to a loss of ductility but also to a decrease in concentration of the solute
elements within the austenite matrix which results in a reduced oxidation resistance of
the material. Together with intermetallics such as sigma-phase and chi-phase, often found
in the form of large particles, these are essentially effective barriers that oppose
dislocation movement. At low temperatures, the dislocations either cut through or loop
(bow) around the particles, so the precipitates hinder the dislocation movement in a
crystal lattice, hence increasing material strength.
However, various experimental studies concluded that strain incompatibilities due to
heterogeneous deformation of differently orientated grain families (precipitates) cause

Chapter 1: Literature review
26
internal stresses in the matrix [25–27], providing suitable places for cracks to initiate and
propagate which results in a premature failure of the material. These progressive changes
in the underlying microstructure of Type 316H austenitic stainless steel are also thought
to be responsible for an increased creep deformation rate at a temperature of 550°C [9].
1.3 Deformation mechanisms in austenitic stainless steel
In materials science, deformation of a material refers to modifications of the shape or size
of a body in response to applied forces or a change in temperature, and is usually defined
as strain. Upon deformation, internal inter-molecular forces arise that oppose the applied
force. If the magnitude of the applied force is small, these internal forces which maintain
the atoms in regular patterns resist the applied force and allow the material to resume its
original state once the load is removed. Such deformation is said to be elastic which is
reversible. A larger applied force however may cause a permanent deformation of the
material, also referred to as inelastic or plastic deformation, where the atomic planes slide
past one another (shear) through the motion of dislocation lines. This requires breaking
of bonds and re-joining of new atomic bonds. Therefore, the material does not return to
its original size and shape even if the mechanical load is no longer being applied to it. In
the context of this thesis, it is essential to define the deformation principles in both macro-
and micro-scale to better describe the time dependent inelastic (creep) deformation
mechanisms under uniaxial stress conditions. Consequently, the deformation concepts in
both single crystals and polycrystalline materials are also introduced.
1.3.1 Elastic-plastic deformation – basic stress-strain relations
An external load applied to a solid material will induce internal forces within the member
called stresses which in turn cause deformation of the material, defined as strain. When
an external force F is applied perpendicular to the specimen cross section as shown in
Figure 8 [28], and 0A is the original cross sectional area before any load is applied, the
engineering stress or nominal stress ( ) assumed to be uniformly distributed in the cross
section is defined by the relationship:
0
F
A = (3)
Chapter 1: Literature review
27
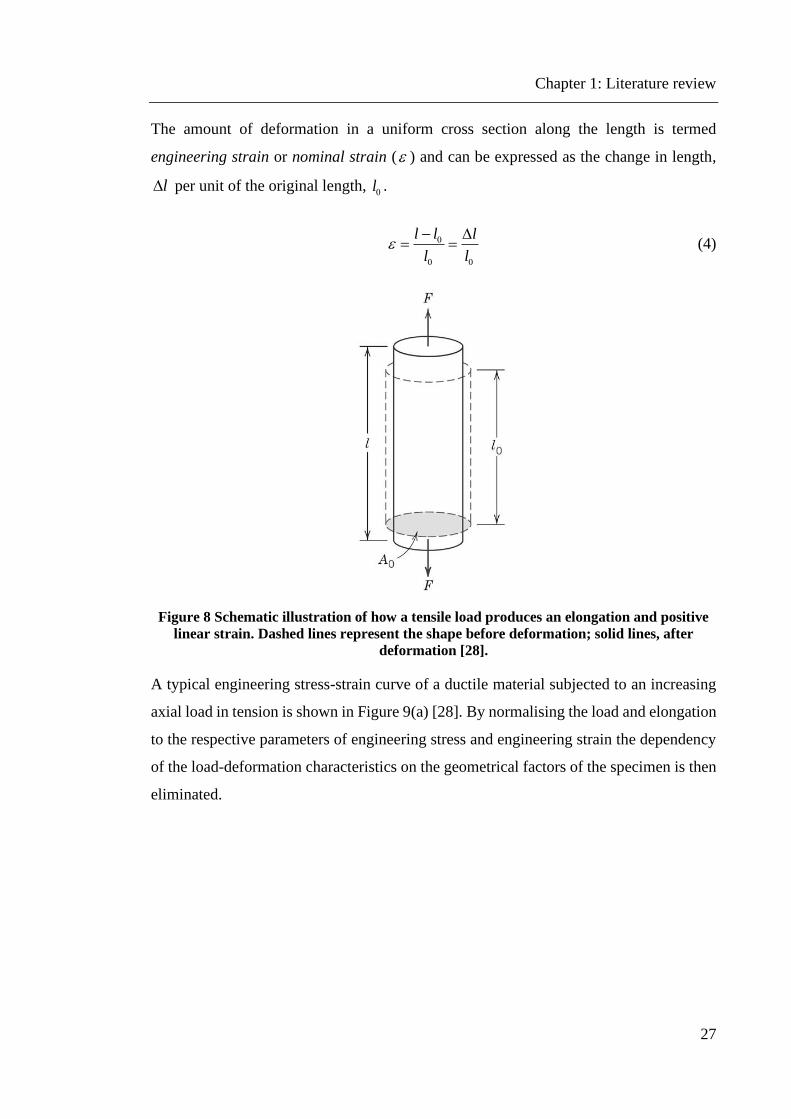
The amount of deformation in a uniform cross section along the length is termed
engineering strain or nominal strain ( ) and can be expressed as the change in length,
l per unit of the original length, l .
l l l
l l
− = = (4)
Figure 8 Schematic illustration of how a tensile load produces an elongation and positive
linear strain. Dashed lines represent the shape before deformation; solid lines, after
deformation [28].
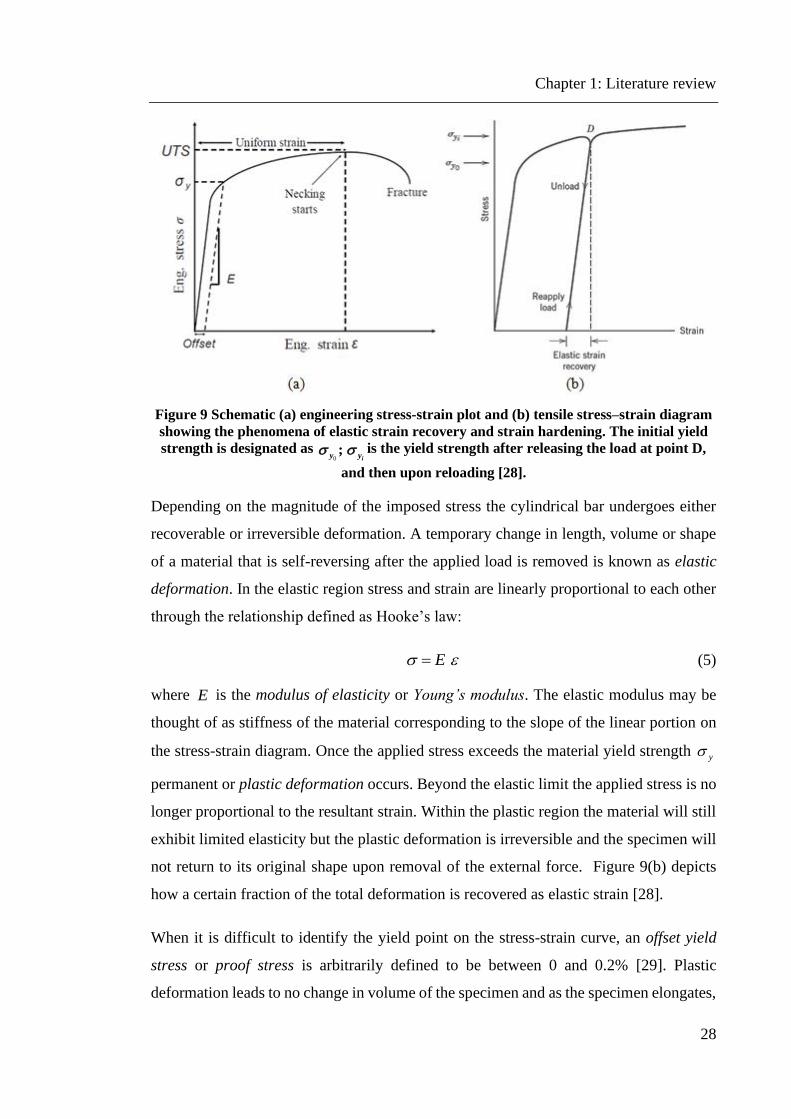
A typical engineering stress-strain curve of a ductile material subjected to an increasing
axial load in tension is shown in Figure 9(a) [28]. By normalising the load and elongation
to the respective parameters of engineering stress and engineering strain the dependency
of the load-deformation characteristics on the geometrical factors of the specimen is then
eliminated.
Chapter 1: Literature review
28
Figure 9 Schematic (a) engineering stress-strain plot and (b) tensile stress–strain diagram
showing the phenomena of elastic strain recovery and strain hardening. The initial yield
strength is designated as 0;
iy y is the yield strength after releasing the load at point D,
and then upon reloading [28].
Depending on the magnitude of the imposed stress the cylindrical bar undergoes either
recoverable or irreversible deformation. A temporary change in length, volume or shape
of a material that is self-reversing after the applied load is removed is known as elastic
deformation. In the elastic region stress and strain are linearly proportional to each other
through the relationship defined as Hooke’s law:
E = (5)
where E is the modulus of elasticity or Young’s modulus. The elastic modulus may be
thought of as stiffness of the material corresponding to the slope of the linear portion on
the stress-strain diagram. Once the applied stress exceeds the material yield strength y
permanent or plastic deformation occurs. Beyond the elastic limit the applied stress is no
longer proportional to the resultant strain. Within the plastic region the material will still
exhibit limited elasticity but the plastic deformation is irreversible and the specimen will
not return to its original shape upon removal of the external force. Figure 9(b) depicts
how a certain fraction of the total deformation is recovered as elastic strain [28].
When it is difficult to identify the yield point on the stress-strain curve, an offset yield
stress or proof stress is arbitrarily defined to be between 0 and 0.2% [29]. Plastic
deformation leads to no change in volume of the specimen and as the specimen elongates,

Chapter 1: Literature review
29
its cross-sectional area decreases uniformly along the gauge length. On continuous
deformation the load-carrying capacity of the specimen increases because of work
hardening up to a maximum load that the specimen can bear, at which the corresponding
stress is known as the ultimate tensile strength (UTS). At this point local deformation or
necking begins as the increase in stress resulting from the reduction of the cross-sectional
area of the specimen surpasses the increase in the load-carrying ability of the material due
to work hardening. Subsequent deformation is confined to the narrow region of the notch
where fracture eventually occurs. These tensile properties of ductile materials are a key
input into many engineering assessments, particularly in high temperature application of
austenitic stainless steels.
1.3.2 Ramberg-Osgood material model
A simple analytical expression, adequate for most strain hardening materials, for
describing the stress-strain curve shown in Figure 9(a) is given by the Ramberg-Osgood
power law equation [30, 31]. In its original form, the equation for strain ( ) is
n
HE E
= +
(6)
where is stress, E is Young’s modulus, and H and n are constants describing the
hardening behaviour of the material and must be determined experimentally. The first
term on the right side, / E , corresponds to the elastic part of the strain ( e ), while the
second term, ( / )nH E , accounts for the plastic part ( p ). However, the above model is
written for uniaxial stress conditions where there is only one stress component, .
Under multiaxial stress states a criterion is needed to determine when yielding will occur
in a material. According to the von Mises criterion, the most commonly employed
criterion in fracture mechanics, yielding of a ductile material begins when the shear strain
energy of the body attains a critical value. A more conservative approach is the Tresca
yield criterion, which assumes that yielding occurs when the maximum shear stress
reaches a critical value. Multiaxial properties however are not really the topic of the
present work, and so the above principles will not be detailed.
Chapter 1: Literature review
30
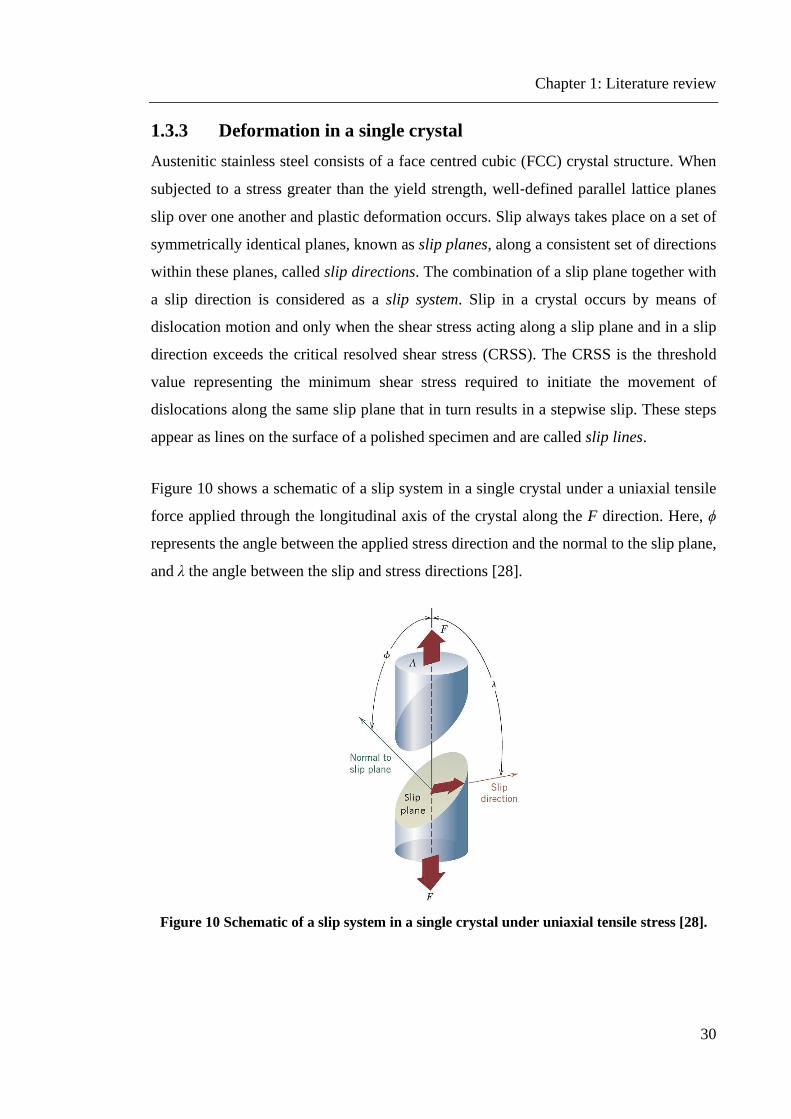
1.3.3 Deformation in a single crystal
Austenitic stainless steel consists of a face centred cubic (FCC) crystal structure. When
subjected to a stress greater than the yield strength, well‐defined parallel lattice planes
slip over one another and plastic deformation occurs. Slip always takes place on a set of
symmetrically identical planes, known as slip planes, along a consistent set of directions
within these planes, called slip directions. The combination of a slip plane together with
a slip direction is considered as a slip system. Slip in a crystal occurs by means of
dislocation motion and only when the shear stress acting along a slip plane and in a slip
direction exceeds the critical resolved shear stress (CRSS). The CRSS is the threshold
value representing the minimum shear stress required to initiate the movement of
dislocations along the same slip plane that in turn results in a stepwise slip. These steps
appear as lines on the surface of a polished specimen and are called slip lines.
Figure 10 shows a schematic of a slip system in a single crystal under a uniaxial tensile
force applied through the longitudinal axis of the crystal along the F direction. Here, ϕ
represents the angle between the applied stress direction and the normal to the slip plane,
and λ the angle between the slip and stress directions [28].
Figure 10 Schematic of a slip system in a single crystal under uniaxial tensile stress [28].
Chapter 1: Literature review
31
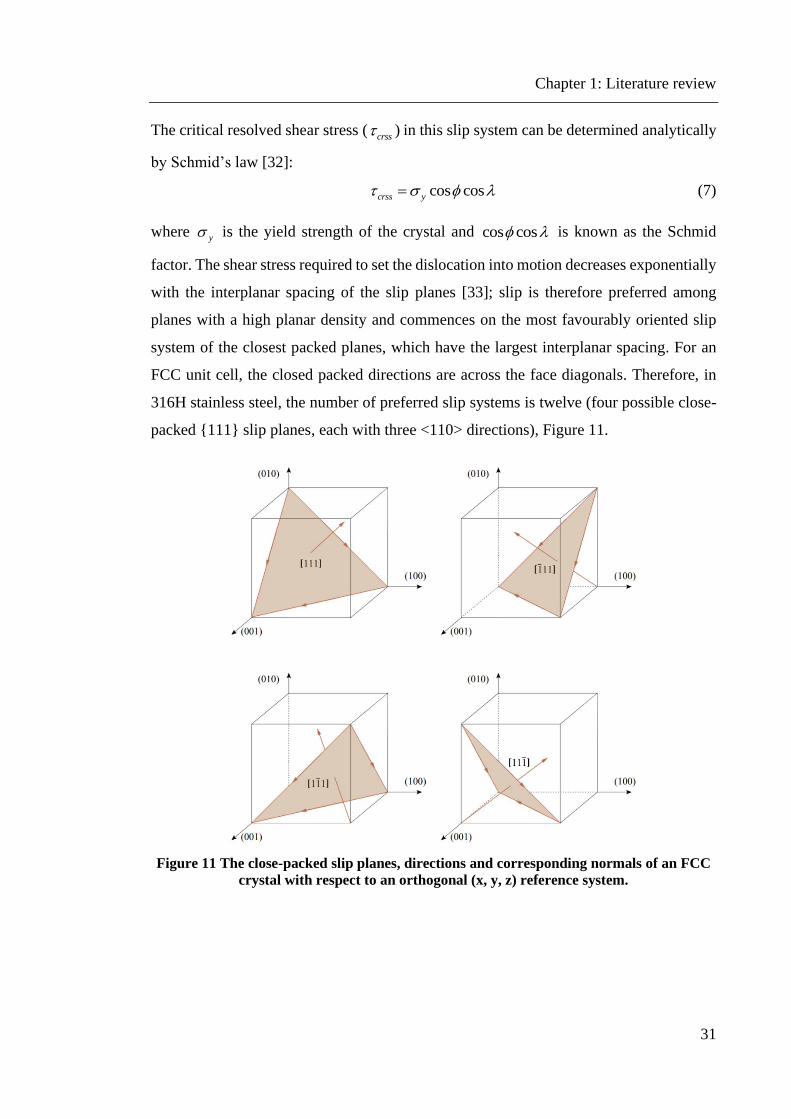
The critical resolved shear stress (crss ) in this slip system can be determined analytically
by Schmid’s law [32]:
cos coscrss y = (7)
where y is the yield strength of the crystal and cos cos is known as the Schmid
factor. The shear stress required to set the dislocation into motion decreases exponentially
with the interplanar spacing of the slip planes [33]; slip is therefore preferred among
planes with a high planar density and commences on the most favourably oriented slip
system of the closest packed planes, which have the largest interplanar spacing. For an
FCC unit cell, the closed packed directions are across the face diagonals. Therefore, in
316H stainless steel, the number of preferred slip systems is twelve (four possible close-
packed {111} slip planes, each with three <110> directions), Figure 11.
Figure 11 The close-packed slip planes, directions and corresponding normals of an FCC
crystal with respect to an orthogonal (x, y, z) reference system.
Chapter 1: Literature review
32
Upon loading, the resolved shear stress will increase in each of the available slip systems
until rss reaches its critical value in one of them, typically in the slip system with the
highest Schmid factor. The slip will commence in that system first and may eventually
begin along a second slip system that is next most favourably orientated with the loading
axis. The Schmid factor in Eq. (7) indicates that the magnitude of the CRSS depends on
the angles between the applied stress direction and the active slip system of the crystal.
For example, the stress required to initiate yielding is at its minimum when a single crystal
is orientated such that 45 = = . Under these conditions,
2y crss = (8)
Although slip is the most prominent mechanism of plastic deformation in Type 316H
steel, plastic deformation can sometimes be accomplished by twinning. This generally
occurs when slip is restricted, as the stress required for twinning is usually higher than
that for slip. Mechanical twinning in FCC metals has been reported as a result of a
simultaneous increase in the shear stress for slip and decrease of stacking fault energy
due to high solute concentration [34]. Twinning normally results in a very small bulk
plastic deformation relative to that resulting from slip and is not a dominant mechanism
in metals with multiple active slip systems. However, by causing changes in plane
orientation, twinning may introduce new slip systems with more favourable orientations
relative to the stress axis such that slip can now take place [28].
1.3.4 Dislocations and stacking faults
Dislocations are linear or one-dimensional defects in the regular atomic lattice of the
crystal which enable materials to deform without ruining the intrinsic crystal structure at
stresses below that at which the material would break or fracture if they were absent. Such
lines of structural discontinuities can be of edge type or screw type, schematically shown
in Figure 12. However, most dislocations found in crystalline materials display a mix of
both types. In response to an applied shear force, edge dislocations move parallel to the
direction of the shear stress whereas for screw dislocations the motion is perpendicular to
the stress direction [35].

Chapter 1: Literature review
33
Figure 12 Schematic representation of (a) edge dislocation and (b) screw dislocation [35].
A dislocation is characterised by the magnitude and direction of the lattice distortion
associated with it, a property referred to as the Burgers vector. Depending on their
character, dislocations can either glide or climb in the crystal. A dislocation is able to
glide in that slip plane which contains both the line of the dislocation and its Burgers
vector; therefore, glide of an edge dislocation is confined to its slip plane only. On the
other hand, a screw dislocation does not have a unique slip plane and can therefore change
its glide plane through a process called cross-slip. Usually, the cross-slip plane is also a
close-packed plane, e.g. {111} in FCC crystals. Dislocation glide (or slip) takes place
discontinuously in bands, as illustrated in Figure 13 [36].
Figure 13 Schematic of dislocation glides (slip bands); (A) macroscopic appearance and
(B) atomic movements [36].
At room temperature, the predominant mechanism of plastic deformation in crystalline
materials is slip mainly through dislocation gliding. At elevated temperatures however
dislocations can also move by climb processes in directions normal to their slip planes,
that is an edge dislocation can now move to another slip plane, Figure 14. This occurs
when dislocations absorb or emit vacancies and it is a diffusive process, requiring mass
transport by diffusion of vacancies or interstitial atoms towards or away from the
dislocation core [35]. For this reason, it is much more temperature sensitive than glide

Chapter 1: Literature review
34
and is a non-conservative motion. Because it is a relatively slow process, it doesn’t
produce large amounts of deformation; instead, it acts as a mechanism for dislocations to
move around obstacles.
Figure 14 Climb of an edge dislocation in a crystal [35].
Crystals with a layered structure, particularly those with FCC and hexagonal close packed
(HCP) structures, are also prone to stacking faults, which reportedly are produced in most
metals by plastic deformation [37]. A stacking fault, unlike dislocations, is a two-
dimensional interfacial defect that alters the periodic sequence of atom layers. These
planar defects may introduce additional layers of a different crystal structure within an
otherwise perfect sequence of layers. For example, stacking faults in an FCC crystal may
cause the formation of a thin HCP region, which ultimately affect the deformation
behaviour of the crystal [38].
The presence of stacking faults impairs the perfection of the host crystal, and the
associated energy per unit area of fault is known as the stacking-fault energy (SFE). The
SFE plays a critical role in the yield behaviour of FCC metals [39, 40], and has been
reported to vary widely among different materials with the same crystallographic
structure, depending on their type and the microstructural variables present [41]. For
example, despite having the same FCC crystal structure, austenitic stainless steel has a
rapid strain hardening nature in comparison with its conventional counterparts such as
Nickel due to a much lower SFE than that of the latter. As a consequence, Type 316H
austenitic steel has a relatively low yield stress but comparatively a higher tensile strength
[42]. Therefore, differences in the deformation behaviour of FCC metals can be related
to differences in stacking-fault behaviour.

Chapter 1: Literature review
35
1.3.5 Strain hardening
Strain hardening is the main strengthening mechanism for Type 316H steel whereby the
alloy becomes harder and stronger as it is plastically deformed. Important to the
understanding of this intrinsic phenomenon is the interaction of dislocations with other
dislocations or barriers that impede their motion through the crystal, such as solute atoms,
precipitates or grain boundaries. The dislocation density increases dramatically with
plastic strain due to the formation of new geometrically necessary dislocations and/or
multiplication of existing dislocations. Various possible processes of this have been
identified in terms of the generation and multiplication of dislocations, such as the high-
angle grain boundary dislocation emission mechanism, multiple cross-slip mechanisms
and Frank-Read mechanisms [43]. Furthermore, grain boundaries, internal defects and
surface irregularities are frequently assigned as formation sites for dislocations during
deformation.
Dislocations, under applied stress, glide in their corresponsive slip plane and may
eventually combine with other dislocations gliding on intersecting slip planes. In such a
case, the newly formed dislocation may often become sessile or immobile if the host plane
is not with the lowest CRSS required for the slip to continue and can further act as an
impediment to the motion of adjacent dislocations until the shear stress necessary to
activate that plane is reached. Consequently, an increase in dislocation density enhances
this resistance to dislocation motion by other dislocations and an ever greater shear stress
is now required to move the dislocations. Thus, the imposed stress necessary to deform a
metal increases with increasing deformation.
Among the various types of dislocation reactions leading to strain hardening in Type
316H steel and other FCC metals, of particular interest is the Lomer-Cottrell dislocation
structure, which emerges when encountering dislocations from different {111} planes
combine and form a separate dislocation in a way similar to the preceding description
along the crystal face, which is not a slip plane in FCC structures at room temperature. It
is sessile and immobile in the slip plane, acting as a barrier against neighbouring
dislocations [44]. Another type of dislocation interaction leading to both self and latent
strain hardening in the material is the so-called forest dislocation mechanism, whereby
one mobile dislocation cuts through other pre-existing dislocations in the intersecting slip

Chapter 1: Literature review
36
plane [45], often resulting in the formation of kinks and/or jogs in the dislocation line
[39]. A jog in an edge dislocation will not hinder the motion of the dislocation in its slip
plane but can obstruct that of the screw dislocations.
Grain boundaries can also act as barriers to dislocation motion and cause a dislocation
pile-up. Their presence makes microstrain propagation more difficult than in single
crystals because the ‘back stress’ resulting from cumulative stress fields of individual
dislocations in the pile-up opposes the externally applied stress on the slip plane, hence
strengthens the material in each process [38, 46]. Strain hardening can arise from the
interaction of dislocations with solute atoms or second-phase particles distributed in the
matrix. Impurity atoms, due to their differing size of those occupying the parent lattice,
cause lattice strain which can retard dislocations. This is because the stress fields
generated around the solute atoms as a result of lattice distortion bring upon a sort of drag
force onto a moving dislocation, giving rise to a resistance to dislocation motion (Peierls
force) and thereby increasing the stress required for plastic deformation. Virtually, solute
atoms are more likely to affect the frictional resistance to dislocation motion rather than
the stagnant locking of dislocations [47]. To overcome the pinning stress and continue
motion, dislocations in a material can interact with the precipitate atoms in one of two
ways: they can either cut through them if the precipitate atoms are relatively small (i.e.
segregated solute atoms) or bypass larger particles, which are not necessarily single atoms,
in a bowing process, leaving behind dislocation loops around the particles, as shown in
Figure 15. This leads to an increase of the dislocation density and increased plastic strain
[48].
Figure 15 Schematic showing dislocation bowing and looping process: (a) a dislocation is
gliding towards two point obstacles; (b) dislocation response to stress by bowing out to
form (c) dislocation loops around the particles and reform the pinned dislocation.

Chapter 1: Literature review
37
Strengthening therefore depends on whether a dislocation cuts through or loops around a
precipitate. Strain hardening due to the cutting of dislocations occurs over a small atomic
distance at lower and short-range stresses and can be readily influenced by the strain
amplitude and/or temperature fluctuations. Contrarily, strain hardening due to dislocation
pile-ups is of long-range, as larger particles are distributed at wider distances, and is
relatively insensitive to both temperature and strain rate. With increasing dislocation
loops, the separation between two particles in a slip plane decreases and it becomes
difficult to further loop, hence more stress is required. This difference enables the
competing mechanisms to be distinguished and separated, allowing different strain
hardening models to be derived.
In its simplest form, the evolution of dislocation structures in FCC crystals with
increasing plastic strain has been systematically described in the 1950s using few general
assumptions [49]. Under tension, single crystals of closed packed metals will initially
deform on a single (primary) slip system with little strain hardening. At this stage,
dislocations glide over a long distance almost without confronting obstacles, resulting in
large amounts of strain without much work hardening. With increasing load however,
dislocation activities begin to occur in multiple slip systems, giving rise to a relatively
high work hardening rate with the formation and accumulation of Lomer-Cottrell barriers.
This large hardening rate essentially remains constant throughout the athermal stage and
occurs in both single crystals and polycrystals, independently of the first stage. That is,
the high hardening rate can occur in stage II even while a single crystal is still deforming
macroscopically in single slip [50]. Research also indicates a decrease in the extent of this
hardening behaviour with increasing temperature and stacking fault energy and is
therefore considered as a limiting behaviour at small strains [51]. Under conditions of
multiple slip, dislocations distribute heterogeneously and commonly develop into three-
dimensional cell structures due to the tangling-up of primary with secondary dislocations.
The preponderant majority of dislocations are actually accommodated in the walls of each
cellular substructure while the interior is almost free of dislocations. Such dislocation cell
walls are also referred to as sub-cell boundaries and are reported to act as sources of back
stresses contributing to the Bauschinger effect in a single crystal [52]. With further
increase in load, cross-slip takes place, whereby dislocations escape the pile-ups and
hence a steady decrease in work hardening rate sensitive to both temperature and strain

Chapter 1: Literature review
38
rate is reached. The various stages of strain hardening for a single crystal are distinguished
in Figure 16 [51].
Figure 16 The stages of work hardening for a single crystal represented on a plot of
hardening rate versus flow stress. In stage III, the extrapolation to zero hardening is
labelled asVτ to indicate the Voce stress, and the arrows indicate how the slope varies with
increasing strain rate or temperature [51].
1.3.6 Polycrystalline deformation
Deformation in polycrystalline materials, such as Type 316H austenitic stainless steel, is
somewhat more complex than for single crystals because of different grain orientations
in space and the consequent geometrical constraints in the aggregate. Due to variation in
crystallographic orientation of the constituent grains, the direction of slip differs in a
polycrystalline specimen from one grain to another. That is, dislocation motion within
each individual grain occurs along the slip system which has the most favourable
orientation with regard of the applied stress. This is depicted in Figure 17 where
randomness in crystallographic orientation is marked by the difference in alignment of
the slip lines for the various grains of a plastically deformed polycrystalline copper
specimen. In addition, the presence of two operating slip systems is also apparent for most
of the grains, as indicated by two series of parallel yet intersecting sets of lines that stop
at grain boundaries [28].

Chapter 1: Literature review
39
Figure 17 Photomicrograph (173 X) showing the slip lines on the surface of a
polycrystalline specimen of copper that was polished and subsequently deformed [28].
Since coherency during deformation is maintained along the grain boundaries, where the
crystals are in misalignment, the distortion of an individual crystal and hence gross plastic
deformation depend not only on the relative orientation of the grain itself (with respect to
its stress axis) but also on its neighbouring crystals. Although certain grains may be
oriented favourably for slip to begin, yielding cannot commence until the unfavourably
orientated adjacent grains are also capable for slip in a cooperative manner. Thus, to
initiate yielding, polycrystalline materials require higher stresses than their single-crystal
equivalents, wherein much of this increase is attributed to mutual geometrical restraints
which the grains may impose on each other during deformation, as defined above. An
important fact in plasticity theory is that ductile deformation in a polycrystalline material
is attainable only if a minimum of five independent slip systems are simultaneously active
in each crystal so as to accommodate continuous grain-shape changes while preserving
grain boundary integrity [39]. In this manner, crystals which do not possess at least five
independent slip systems are never ductile in polycrystalline form, but may still undergo
small plastic elongation because of twinning or favourable preferred grain orientation.
This leads to FCC (with 12 slip systems) being more ductile than HCP or other low
symmetry metals, which have less than 5 operative slip systems and hence show limited
ductility at room temperature in polycrystalline form [38].

Chapter 1: Literature review
40
Besides sustaining crystallographic integrity, grain boundaries (GBs) exert a significant
influence on the plastic-deformation behaviour of polycrystalline metals. The high
interfacial energy and relatively weak bonding in most grain boundaries often make them
preferred sites for solid-state reactions such as diffusion, phase transformations and
precipitation reactions. This generally results in a higher concentration of solute atoms at
the boundary than in the interior of the grain. Depending on the deformation temperature
and strain rate, GBs may readily serve to either strengthen or weaken a metal. At room
temperature, polycrystalline materials exhibit higher rates of strain hardening and show
no stage I or easy-glide region on the stress-strain curve than that of the monocrystalline
solid. Only stage II and stage III deformation are obtained with polycrystalline specimens.
At temperatures lower than approximately one-half of the melting point, and for relatively
fast strain rates (so that recovery effects are not great), GBs increase both strain hardening
rate and tensile strength. At elevated temperatures and slow strain rates (conditions of
creep deformation) however strain is localized mainly at the grain boundaries, often
leading to grain-boundary sliding and/or stress-induced migration, and eventually to
intergranular fracture [38].
Other factors that also have a considerable influence on the deformation characteristics
of polycrystalline materials include grain size and the presence of sub-grain boundaries
within the grains. Sub-boundaries or low-angle boundaries may be produced during
crystal growth, during high-temperature creep deformation or as the result of a phase
transformation. Once formed, the sub-grain boundaries act as additional obstacles to
dislocation motion thus forcing the gliding dislocations to take a bowed configuration
which in turn leads to an increase in the dislocation density. As a consequence, long-range
internal back stresses arise in sub-grain interiors and cause kinematic hardening which
prevails in the first stage of the creep process and is responsible for the decrease of creep
rate in the extended transient stage of creep deformation [53]. In this regard, the formation
of sub-grains substantially smaller and harder than the original host grains therefore
results in a significant increase in strength. In principle, however, grain size has a
measurable effect on most mechanical properties. At room temperature, hardness, yield
strength, tensile strength, fatigue strength and shock resistance all increase with
decreasing grain size. The effect of grain size is largest on properties which are related to
the initial stages of deformation, for it is at this stage that grain-boundary barriers are

Chapter 1: Literature review
41
most effective. Thus, yield stress is more dependent on grain size than tensile strength.
For the later stages of deformation the strength is controlled predominantly by complex
dislocation interactions occurring within the grains, and grain size is not a controlling
variable. These factors will each be further considered in the reminder of the chapter,
primarily in terms of how they influence the kinetic behaviour of Type 316H stainless
steel in an AGR environment.
1.3.7 Creep deformation
In many industrial applications components often operate at elevated temperatures and
under the influence of static or cyclic stresses throughout their service life. The need for
safe design procedures therefore is of paramount importance to avoid extensive creep
deformation and prevent premature failure [54]. In general, as the temperature increases,
the strength of metals decreases at the expense of increasing plasticity with respect to
some time scale. Thus, at elevated temperatures the strength becomes highly dependent
on both strain rate and time of exposure. Under these conditions, most engineering metals
behave in many respects like viscoelastic materials. In materials science, the time-
dependent irreversible deformation of a solid material under constant load at high
temperatures is defined as creep. It is commonly noticeable at temperatures greater than
approximately 30% of the melting temperature of metals as a result of long-term exposure
to stresses which are lower than the yield strength of the material. Above this temperature
threshold, the mobility of atoms increases to the extent that diffusion-controlled processes
acquire more dominance on the deformation behaviour, allowing for a time-dependent
rearrangement of the structure [55]. High temperature also enables greater mobility of
dislocations by the mechanism of climb so that deformation at grain boundaries becomes
more pronounced. In some polycrystalline materials the slip system changes, or additional
slip systems are introduced with increasing temperature. The equilibrium concentration
of vacancies and the internal energy of crystals likewise increase with temperature. Each
of these thermally activated mechanisms and intrinsic factors play a crucial role in creep
and are described in detail in the following sections.

Chapter 1: Literature review
42
The creep deformation and failure of a material can be conventionally characterised by a
uniaxial creep test, where the strain produced is measured and plotted as a function of
time for a constant stress and temperature. An idealised creep curve of a standard creep
test is shown schematically in Figure 18.
Figure 18 A typical creep curve of strain against time showing the three creep regimes.
Most ductile materials often exhibit comparable creep curves displaying typical three-
stage creep characteristics despite possessing dissimilar microstructural properties [55].
Insomuch as creep is sensitive to both stress and temperature, no satisfactory theoretical
model exists for predicting the creep rate of the numerous metals. In fact, the inherent
creep deformation process may vary even in a material itself for different temperature and
stress conditions. Frost and Ashby have drawn numerous deformation-mechanism
diagrams for a large number of materials which indicate the different creep mechanisms
present at different temperatures and stress levels in a compact and accessible form [56].
The map for secondary creep of Type 316 stainless steel is shown in Figure 19. As seen
in this figure, at relatively high temperatures and stresses dislocation creep (also known
as power-law creep) is the dominant deformation mechanism while diffusion creep occurs
at lower stresses in this material. These two creep processes are discussed below in brief.

Chapter 1: Literature review
43
Figure 19 Deformation-mechanism map for Type 316 stainless steel of grain size 50 µm in
the stationary stage [56]. The purple shaded region represents the main area of interest for
this project, based on AGR nuclear plant operating temperature range.
1.3.7.1 Creep rate
The initial strain (0 ) in Figure 18 represents the elastic or elastic-plastic response to the
applied load (stress). During primary creep the material strain hardens and the creep strain
rate decreases due to the increasing creep resistance of the material as a result of
deformation. In this first stage dislocations climb away from obstacles, slip and contribute
to deformation; eventually the rate at which dislocations climb away from the obstacles
equals the rate at which dislocations are blocked by other imperfections, leading to
steady-state (secondary) creep. The secondary region accounts for the longest part of the
creep life of a component and is characterised by constant strain rate in which competing
mechanisms of strain hardening and thermally activated recovery (softening) may occur.
The slope of the steady-state portion of the creep curve is the minimum creep rate. At the
onset of tertiary creep the strain rate increases, necking occurs and the material deforms
at an accelerated rate until failure occurs. This stage precedes fracture commonly through

Chapter 1: Literature review
44
damage mechanisms involving grain boundary cavitation and inter-crystalline cracking
due to vacancy accumulation at areas of high stress concentration (dislocation pile-ups)
and subsequent voiding associated with grain boundary sliding [57, 58], which are the
underlying cause of failure by creep rupture. Increasing stress or temperature reduces the
rupture time and increases the creep rate.
1.3.7.2 Dislocation creep
The inelastic deformation of the material due to an applied stress in the temperature range
0.5 < T/Tm < 0.7 (where Tm is the melting temperature) can be associated with the motion
and interaction of dislocations and diffusion of vacancies [54, 59]. Dislocation movement
produced by the applied stress is opposed by obstacles; dislocations however can climb
over an obstacle due to diffusion of vacancies and the creep strain rate is then determined
by the temperature dependent dislocation climb. The Hall-Petch relationship shows a
reduction in grain size increases the yield strength of the material [60, 61] reducing
dislocation motion hence dislocation creep [59].
1.3.7.3 Diffusion creep
At higher temperatures (T/Tm > 0.7) the creep rate is controlled chiefly by diffusion
mechanisms through grains and around the surfaces of grains via the grain boundaries
and deformation occurs at lower stresses due to diffusion of vacancies. For temperatures
close to the melting point, diffusion occurs through grains (Nabarro-Herring creep) and
the creep rate decreases with increasing grain size because of the reduction in grain
boundary area [62]. Grain boundary diffusion (Coble creep) however requires less
activation energy than Nabarro-Herring creep so is more dominant at lower temperature
and stress [63]. Both models describe the diffusion controlled creep rate to be a linear
function of the applied stress.
1.3.7.4 Creep stress and temperature dependence
Creep is usually an undesirable phenomenon and is often the limiting factor in the lifetime
of in-reactor stainless steel components within an AGR environment and therefore
prediction of the rate of creep strain accumulation throughout projected service life is
essential. In long-life application of nuclear power plant components the minimum or
steady-state creep rate is of most interest to design engineers, that is, the slope of the

Chapter 1: Literature review
45
secondary portion of the creep curve. During creep the material deforms under different
mechanisms as described earlier. When secondary creep dominates, the stress and
temperature dependence of the steady state creep strain rate, c
s can be expressed in the
form
expnc
s
Q
RT
−
(9)
where Q is the activation energy, R is Boltzmann’s constant, T is the absolute temperature,
is the applied stress and n is the power law creep stress exponent. The values of n and
Q are sensitive to the processes controlling creep and also depend on the inner state of the
material [54]. When diffusion creep dominates, the value of n = 1 and the analogous value
of activation energy varies with the diffusion process, depending on whether grain
boundary or lattice diffusion controls. When dislocation creep is the dominant
mechanism, n is found to be in the range of 3 to 5 [54] (however values just above 10
have also been reported [64]) with dislocation motion being limited by either core or
lattice diffusion at lower and higher temperatures, respectively [54]. In fact, the
parameters n and Q themselves are found to be functions of stress and temperature [65].
The influence of stress and temperature on the creep curve of polycrystalline materials is
illustrated if Figure 20. An increase in stress and/or temperature leads to an accelerated
strain rate in all regions of the creep curve. As indicated in this figure the creep ductilities
of different materials may be sensitive to the external conditions where the failure strain
often decreases with decreasing stress [54].
Figure 20 Influence of stress σ or temperature T on creep curve. The shapes of creep
curves are most relevant to a temperature T greater than about 0.5 Tm [54].

Chapter 1: Literature review
46
1.3.8 Cyclic stress-strain relations
The stress-strain behaviour obtained from a monotonic (unidirectional) test can be quite
different from that obtained under cyclic loading. This was first observed by Bauschinger
[66] in 1886. His experiments indicated that the yield strength of a material in tension or
compression was reduced after applying a load of the opposite sign that caused inelastic
deformation. In other words, the resistance of a material to deformation (elastic limit,
yield point) is greater for further deformation in the same direction than for subsequent
deformation in the reverse direction [32]. This phenomenon is known as the Bauschinger
effect and is schematically illustrated by a uniaxial tension-compression diagram in
Figure 21.
Figure 21 Schematic illustration of the Bauschinger effect:
y - initial yield stress in tension, 'y - reduced yield stress in compression.
The Bauschinger effect is important for providing probabilistic estimates of life time of
in-reactor components for use in assessment methodologies, since it can significantly
affect the deformation behaviour of materials in practical applications, particularly those
undergoing tension-compression cyclic loading. Changes in cyclic deformation behaviour
are more pronounced at the beginning of cyclic loading (transient behaviour), but the
material usually gradually stabilises (steady-state) with continued cycling. A number of
constitutive models for the determination of stress-strain properties where a reversal of
stress is involved can be found in [67]. All models distinguish between monotonic and
cyclic behaviour and all take the Bauschinger effect into account. However, the origin of
the Bauschinger effect in polycrystalline materials is highly controversial and the existing

Chapter 1: Literature review
47
phenomenological explanations are not holistic. The models therefore are not truly
representative of material behaviour but can lead to a high degree of accuracy.
The theories can be broadly classified into two overarching groups: continuum- and
microstructure-based. Continuum theories capture the Bauschinger effect in terms of back
stresses caused by inhomogeneous deformation in the material [68], and are insignificant
for alloys with relatively small volume fractions of second phase particle, with effects
from grain boundaries and other obstacles generally being even smaller. Microstructure-
based theories are in some way related to dislocations being impeded and stored in some
polarised way during forward loading that build up high local stresses and strains which,
when released upon stress reversal, repel the dislocations from the obstacles, and hence
assisting strain in the reverse direction [69]. Recently, the residual lattice stress has also
been shown to contribute to the kinematic hardening of Type 316H stainless steel [70,71].
Although there are no procedural standards for the determination of stress-strain
properties where a reversal of stress is involved, understanding the fundamental causes
of the effect is essential in developing more refined strain hardening theories and
constitutive models for cyclic deformation.
1.4 High-temperature oxidation and carburisation
High temperature alloys rely on the formation of protective oxide scales in order to
withstand the chemically aggressive environments typical in AGR nuclear plants.
Exposure of the components to multi-phase gas mixtures generates a series of
interdependent reactions that can lead to complex oxidation patterns. To effectively
predict the long term oxidation behaviour it is important to understand the evolution of
the oxide and the parameters that influence its protectiveness.
First the basic relations in oxidation are presented with the parameters that control its rate.
Then, the current understandings of simultaneous oxidation and carburisation are
reviewed with some examples of the oxidation of Type 316H stainless steel in a CO2
atmosphere at relevant temperatures. The interpretation of how materials properties are
affected by carburisation is also reported.

Chapter 1: Literature review
48
1.4.1 Basic relations in oxidation
In service condition, for oxide formation on a deforming substructure the following
concepts may apply [72]:
(i) Oxide growth results in parabolic kinetics according to the relation:
px k t= (10)
where x is the oxide thickness at any time t , and pk is the parabolic rate constant,
determined empirically.
(ii) Oxide formation is associated with a volume change (the Pilling-Bedworth
ratio).
If the oxide/metal volume ratio is less than one, the oxide fails to cover the metal surface
and will be non-protective. If the ratio is more than one, the oxide on the surface protects
the metal underneath, assuming that oxide growth at the metal-oxide interface occurs by
inward oxygen diffusion through the scale.
(iii) Oxidation occurs, for example, by the reaction:
2 2 3
4 2Cr O Cr O
3 3+ (11)
The reaction goes along with release of standard free energy, oG , when the reactants
are in their standard states (oxygen at atmospheric pressure). When 0oG = the oxide is
in equilibrium with 2O at atmospheric pressure and is at its standard dissociation
temperature, T which varies with oxygen partial pressure,2OP [35], according to the
relation:
2
expo
O
GP
RT
=
(12)
where R is the gas constant. If the pressure is lowered below this value the oxide will
dissociate; if raised above, the oxide is stable.

Chapter 1: Literature review
49
The oxidation rate is governed by two parameters: oxygen availability and solid state
diffusion rates. The effect of the first is given by:
( )2
1/
constantn
Or P= (13)
where r is the oxidation rate and the value of n may lie between 2 and 8 depending on
the reaction. In the second reaction, transfer of 2O through the oxide (anion diffusion)
generates a stress at the oxide-metal interface. In turn, the outward flux of metal atoms
through the oxide (cation diffusion) causes a reaction at the oxide-gas interface, resulting
in deposition of vacancies at the oxide-metal boundary.
(iv) For assessment of oxygen partial pressures, it is possible to use both the
CO2/CO and H2O/H2 redox reactions [73].
Unless the gas system is in thermodynamic equilibrium, these would be expected to give
different values.
2 2
1CO = CO + O
2 (Reaction 1) (14)
2 2 2
1H O = H + O
2 (Reaction 2) (15)
Using the standard relationships between Gibb’s free energy ( G ), the equilibrium
constants, product partial pressures and reactant partial pressures for reactions 1 and 2
above, one may obtain:
2
2
2
12exp
CO
O
CO
P GP
P RT
=
(16)
2
2
2
2
22exp
H O
O
H
P GP
P RT
=
(17)
where R is the gas constant and T is the temperature (in Kelvins).
The resulting relationship between 2
/CO COP P and 2OP and the equivalent relationship
between 2 2
/H O HP P and 2OP are summarised in Figure 22 [74].

Chapter 1: Literature review
50
Figure 22 Oxidising / reducing conditions in (a) CO2/CO and (b) H2O/H2 atmospheres [74].
The free-energy changes, ∆G, for various oxidation reactions expressed as oxygen
potential for a range of temperature are shown in Figure 23 [75], where the ability of
different H2/H2O gases to achieve such potentials is shown by the broken lines. Pre-
oxidation experiments on 20Cr–25Ni austenitic steels in Ar/10%H2/100-300 vppm H2O
gas mixture at 550°C revealed that H2/H2O ratios of around 103 permit the oxidation of
chromium together with other minor constituents, but prevent oxidation of iron and
nickel. Upon further exposure to the depositing gas of CO2 /1% CO/1000 vppm C2H4 and,
typically, 200 vppm H2O at 550°C the oxygen potential is dominated by the CO2/CO
equilibrium
2 22CO + O 2CO→ (18)
and varies with temperature, as shown in Figure 23, enabling oxidation of iron but not of
the nickel constituent of the alloy [75]. The oxygen partial pressure, 2OP , of tests in a 1%
CO/CO2 environment at 550°C and 1 atmospheric pressure (atm) was calculated to be
1.62 x 10⁻²³ atm [76] allowing magnetite (Fe3O4) to form but not haematite (Fe2O3) [73].

Chapter 1: Literature review
51
Figure 23 Diagram showing the free-energy changes, ΔG, expressed as oxygen potential
for various oxidation reaction temperatures [75].
Although these concepts are simplified, they may be taken as a starting point. Most of the
general principles described above in the case of reaction with oxygen also apply to
oxidation by carbon, also known as carburisation.
1.4.2 Oxidation of Type 316H stainless steel in AGR environment
A major threat on material integrity in AGRs is primarily due to oxidation of steel alloys
in a pressurised CO2 rich environment at elevated temperatures in which, as discussed
earlier, hydrogen gas and water vapour along with methane is also present. For 300 series
stainless steels efficient resistance to oxidation at high temperature is obtained by the
formation of an external Cr2O3 scale through increased chromium content in the alloy-
metal matrix [77]. This highly stable oxide known as chromia is a p-type semiconductor
with a HCP structure which grows by counter-current diffusions of oxygen and
chromium, mainly through oxide grain boundaries [78]. The protective Cr2O3 scale
growth however necessitates a high enough outward chromium flux to compensate for
the oxygen incursion and prevent internal oxidation. Hence the external oxidation kinetics
in the reacting system is not only dependent on gas flow rate and partial pressure of
oxygen in the atmosphere but also requires a minimum amount of chromium to be
available at the metal-oxide interface. Oxidation temperature, surface finish and substrate
grain size are also influencing factors that are discussed in more details in the subsequent

Chapter 1: Literature review
52
sections. Due to the austenitic structure of the alloy, the reaction rate is low in which
chromium is oxidised preferentially over any other component. This selective oxidation
generates a chromium depleted region beneath the scale-alloy interface which eventually
leads to chromia failure and its conversion to spinel oxide when the supply of chromium
is not sufficient.
The first-formed, external Cr2O3 scale is uniform and adherent, the growth of which
causes a decrease of the chromium concentration in the subsurface, as diffusion in the
alloy is not instantaneous. Eventually, due to either mechanical degradation such as
cracking/spalling or chemical failure, the protective Cr2O3 scale breaks down exposing
the Cr depleted alloy to the external environment. The reformation of the protective
chromia film further depletes the sub-layer of Cr and the metal becomes more susceptible
to oxygen and carbon attack due to insufficient outward diffusion of Cr from the substrate.
When the passive film is locally damaged, a less protective duplex base metal oxide starts
to grow allowing carburisation to occur. The duplex structure consists of an outer layer
of Fe3O4 (magnetite) and an inner layer of MCr2O4 spinel oxide (M can be Fe or Ni) [14],
Figure 24(a). The carburisation in this instance appears more severe as both the magnetite
and spinel have higher diffusion rates than the chromia film. Chromia failure and spinel
formation are associated with accelerated oxidation kinetics, leading to an increase in the
local oxygen activity. As iron oxidises, the scaling rate increases rapidly by outward Fe
diffusion through the inner layer, producing iron oxide. On the other hand, inward oxide
growth is attributed to rapid oxygen transfer along oxide grain boundaries which
contributes significantly to the overall oxidation mechanism at temperatures between
500°C and 600°C [79].
Carburisation continues in the presence of the duplex oxide but a healing layer comprising
a silicon-chromium rich layer can form between the inner spinel of the duplex oxide and
the metal substrate [14], Figure 24(b). This healing layer acts as a barrier to diffusion,
preventing further oxidation and carburisation. However formation of the healing layer is
temperature dependent; for example, at temperatures ranging from about 480 - 600°C a
healing layer may not form resulting in continual oxidation and carburisation of the
material. As a result oxide thickness and carburisation depth should correlate [14].

Chapter 1: Literature review
53
Figure 24 Schematic representation of various oxide formations: (a) Protective Cr2O3
layer and growing duplex oxide and (b) duplex oxide with a Cr-enriched healing layer at
the metal-oxide interface [14].
1.4.3 Oxide growth rate
Oxide formation shows a parabolic increase in thickness with time [72]:
2x Dt= (19)
where x is the oxide thickness, D is the appropriate diffusion coefficient (vacancy flow,
anion, cation) for the mechanism and temperature in question and t is time. Thus, as
shown schematically in Figure 25(a), oxide growth occurs at an ever-decreasing rate.
However, an increase in the underlying metal strain can cause the spallation of the oxide
scale leading to approximately linear oxide growth [72]. When the oxide layer becomes
detached, oxidation proceeds almost at the original rate since new metal surface is
exposed, resulting in an effective increase in growth rate (para-linear), as indicated in
Figure 25(b). Under oxidising conditions the effect of strain at a crack tip can also readily
yield a mechanism for enhanced crack propagation rates [72].
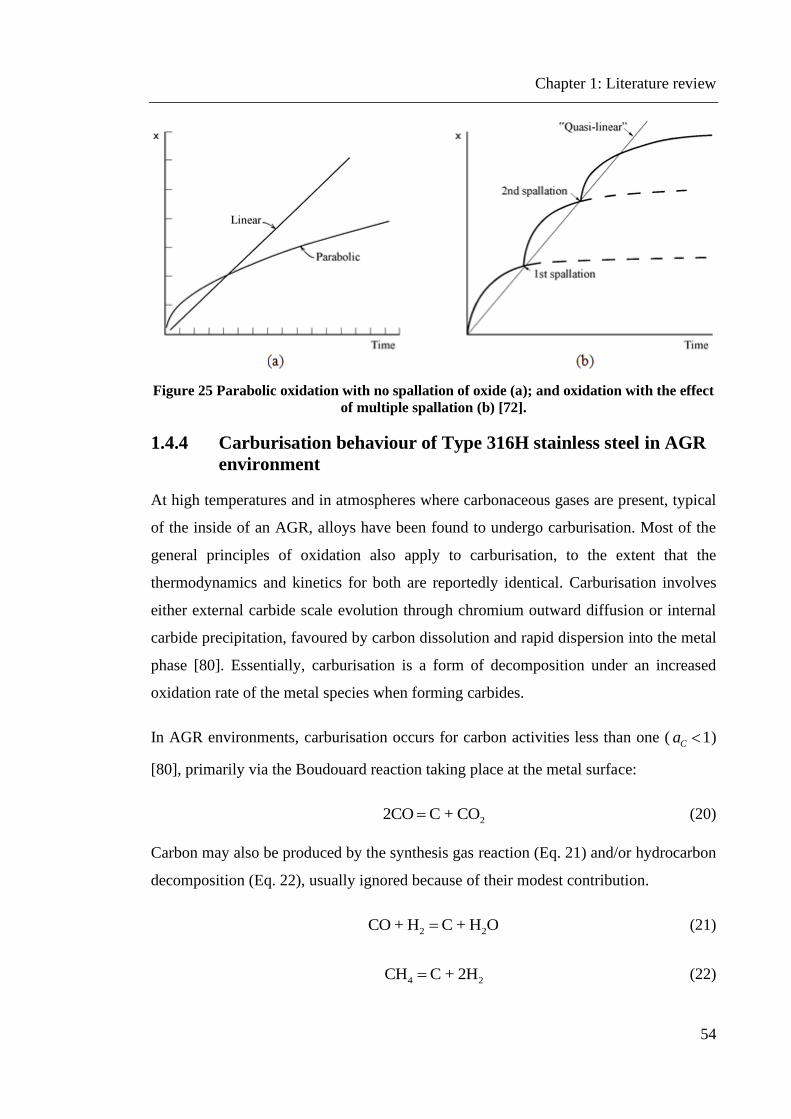
Chapter 1: Literature review
54
Figure 25 Parabolic oxidation with no spallation of oxide (a); and oxidation with the effect
of multiple spallation (b) [72].
1.4.4 Carburisation behaviour of Type 316H stainless steel in AGR
environment
At high temperatures and in atmospheres where carbonaceous gases are present, typical
of the inside of an AGR, alloys have been found to undergo carburisation. Most of the
general principles of oxidation also apply to carburisation, to the extent that the
thermodynamics and kinetics for both are reportedly identical. Carburisation involves
either external carbide scale evolution through chromium outward diffusion or internal
carbide precipitation, favoured by carbon dissolution and rapid dispersion into the metal
phase [80]. Essentially, carburisation is a form of decomposition under an increased
oxidation rate of the metal species when forming carbides.
In AGR environments, carburisation occurs for carbon activities less than one ( 1Ca )
[80], primarily via the Boudouard reaction taking place at the metal surface:
22CO C + CO= (20)
Carbon may also be produced by the synthesis gas reaction (Eq. 21) and/or hydrocarbon
decomposition (Eq. 22), usually ignored because of their modest contribution.
2 2CO + H C + H O= (21)
4 2CH C + 2H= (22)
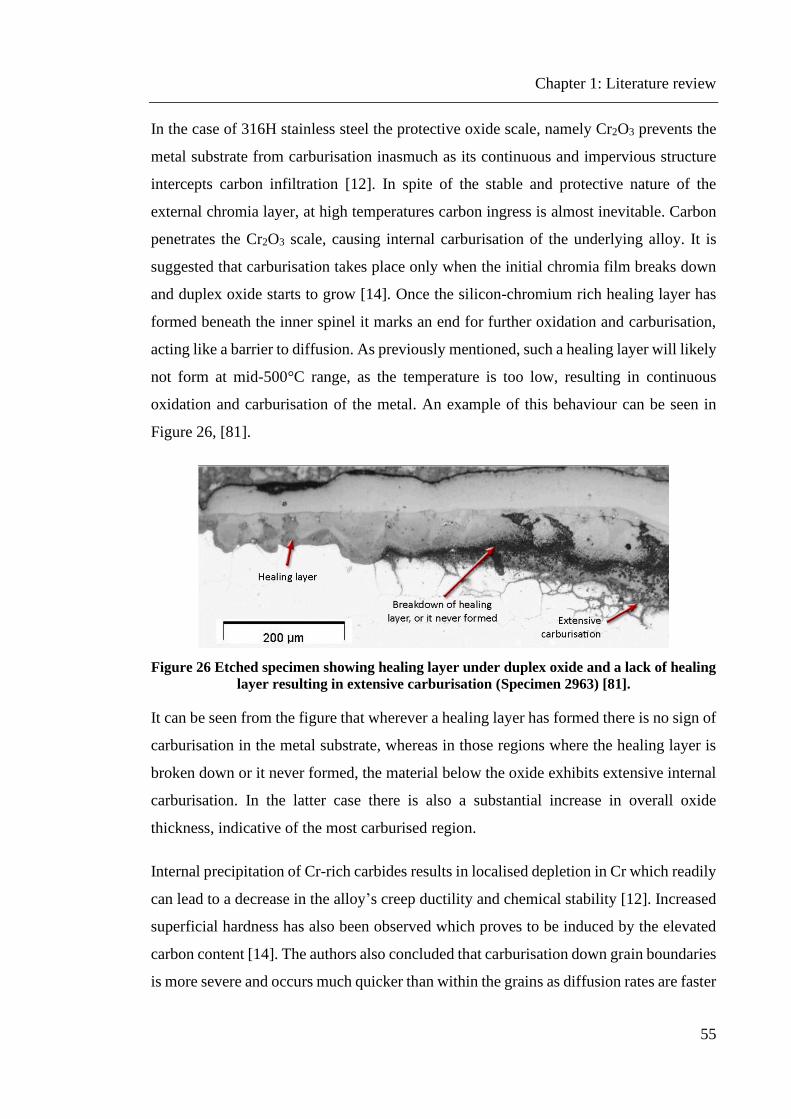
Chapter 1: Literature review
55
In the case of 316H stainless steel the protective oxide scale, namely Cr2O3 prevents the
metal substrate from carburisation inasmuch as its continuous and impervious structure
intercepts carbon infiltration [12]. In spite of the stable and protective nature of the
external chromia layer, at high temperatures carbon ingress is almost inevitable. Carbon
penetrates the Cr2O3 scale, causing internal carburisation of the underlying alloy. It is
suggested that carburisation takes place only when the initial chromia film breaks down
and duplex oxide starts to grow [14]. Once the silicon-chromium rich healing layer has
formed beneath the inner spinel it marks an end for further oxidation and carburisation,
acting like a barrier to diffusion. As previously mentioned, such a healing layer will likely
not form at mid-500°C range, as the temperature is too low, resulting in continuous
oxidation and carburisation of the metal. An example of this behaviour can be seen in
Figure 26, [81].
Figure 26 Etched specimen showing healing layer under duplex oxide and a lack of healing
layer resulting in extensive carburisation (Specimen 2963) [81].
It can be seen from the figure that wherever a healing layer has formed there is no sign of
carburisation in the metal substrate, whereas in those regions where the healing layer is
broken down or it never formed, the material below the oxide exhibits extensive internal
carburisation. In the latter case there is also a substantial increase in overall oxide
thickness, indicative of the most carburised region.
Internal precipitation of Cr-rich carbides results in localised depletion in Cr which readily
can lead to a decrease in the alloy’s creep ductility and chemical stability [12]. Increased
superficial hardness has also been observed which proves to be induced by the elevated
carbon content [14]. The authors also concluded that carburisation down grain boundaries
is more severe and occurs much quicker than within the grains as diffusion rates are faster

Chapter 1: Literature review
56
along grain boundaries, favouring rapid chromium supply to the precipitates, hence
ensuring their continued growth. It should be noted here that the surface oxide scale
permeability to carbon highly depends on its layout and the oxygen potential of the
environment [82]. The presence of poorly protective oxides, such as Fe-rich duplex spinel
is directly associated with carburisation. Carbon ingress in the alloy and subsequent
precipitation of Cr-rich carbides has been shown to hinder the outward diffusion of
chromium, thereby impeding selective oxidation. Conversely, it is also suggested that
non-selective oxidation in the presence of carbonaceous gases is somewhat due to the
extensive internal carbide precipitation. In this context, faster oxidation results in higher
carbon activity, which enhances carburisation and in turn restricts selective oxidation of
chromium [80]. Carbon deposition in these non-protective oxide scales can also cause
mechanical breakdown by generating compressive stresses. Moreover, the carburised
layer is thought to aggravate the initiation of creep dominated creep-fatigue cracks, thus
reducing the material’s resistance to crack initiation at high temperatures [76].
Accordingly, exposure of austenitic stainless steels to carburising atmospheres leads to
carbon dissolution and internal precipitation of carbides in the metal, such as CrC3
beneath the alloy surface and a chromium rich M23C6 deeper within the alloy [83]. Fine
precipitates formed along grain boundaries lead to an increased hardness over ~250 μm
below the material surface [84]. Within this region long-term exposure (37,000 h) has
shown extensive carbide formation along grain boundaries, Figure 27.
Figure 27 316 SS exposed to 1% CO/CO2 environment for 37,000h at 600°C showing fine
carbide precipitates forming along grain boundaries and a thick duplex oxide scale [84].

Chapter 1: Literature review
57
Oxidation and carburisation occur simultaneously within a CO2 environment under AGR
conditions. The carbides formed at the metal surface are incorporated and converted into
oxides by the advancement of the oxidation front with the carbon released diffusing
inwards to further increase the carburisation of the metal [85]. However an investigation
of 300 series SS completed by Amec Foster Wheeler (AFW) revealed that the formation
of duplex oxide is not always a prerequisite for carburisation [84].
Further perspectives upon carburisation have also been brought to light in a recent study
conducted by the University of Bristol [12]. It has been observed that the depth of the
carburised zone beneath the oxide is typically 50 microns, which implies that only the
grains forming the very first layer underneath the oxide scale are carbon rich, a
phenomenon nominated as a feasible factor in crack initiation within the alloy. At
temperatures in excess of 750°C the carburisation depth may extend up to 150 microns
[86], revealing a time-temperature relationship in the augmentation of carburisation.
Potential carbon access into regions further below the carburised layer is also suggested,
recurrently along the grain boundaries of the metal substrate. The aforesaid findings
indicate that not only temperature but also chemical composition, surface finish and grain
size all contribute towards a material’s susceptibility to carburisation. Besides,
carburisation also proves to have a significant impact on the creep properties of the
material. Some of the main influencing factors of both oxidation and carburisation are
briefly summarised in the next sections.
1.4.5 Impact of carburisation on material properties
This section provides an overview of the available information on the impact of
carburisation on material properties and behaviour obtained mostly from testing on Type
316 preconditioned carburised material (as part of the ENVISINC project) and plant
based oxidation monitoring scheme (OMS) specimens, owned by the EDF Energy
chemistry group and housed by Amec Foster Wheeler. Preconditioning was carried out
by exposure of the ex-service material to a simulated AGR gas mix at 600°C for 3 kh,
assumed to be representative of the plant state. Some material was also thermally aged at
600°C for 3 kh to simulate the thermal ageing experienced by the preconditioned material
so the effects of thermal ageing could be determined. All testing has been carried out at
550°C and in an air environment unless otherwise stated [64].
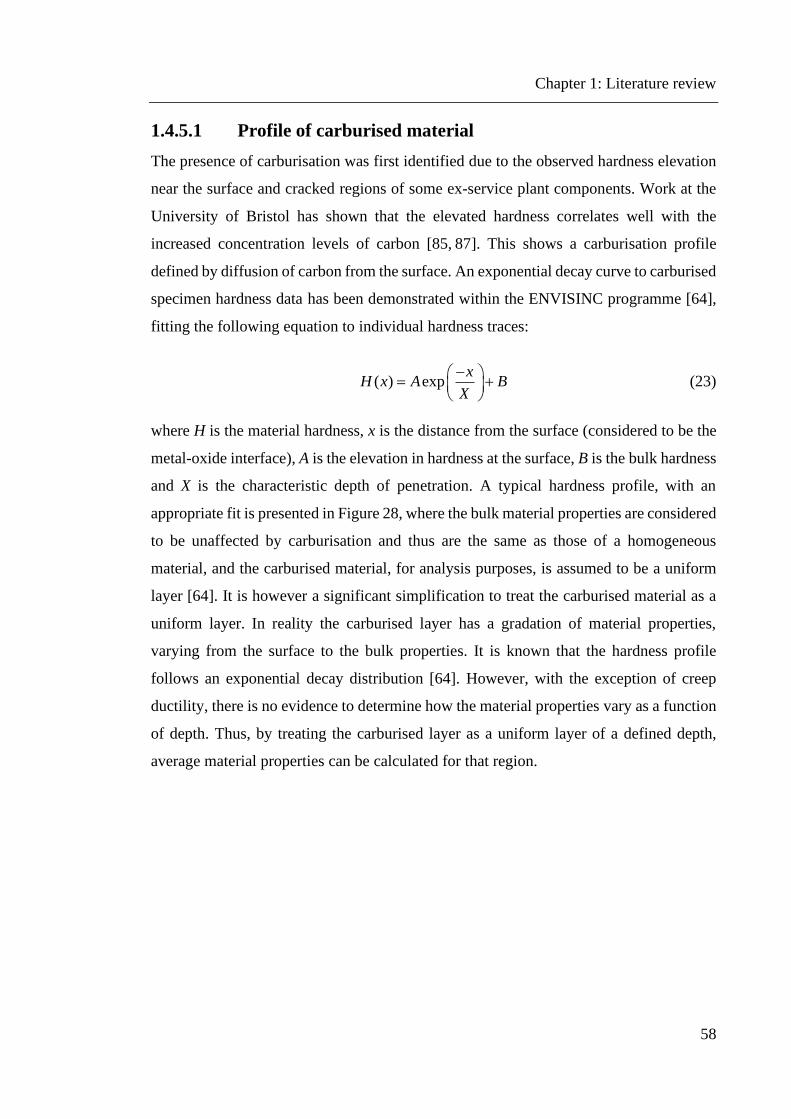
Chapter 1: Literature review
58
1.4.5.1 Profile of carburised material
The presence of carburisation was first identified due to the observed hardness elevation
near the surface and cracked regions of some ex-service plant components. Work at the
University of Bristol has shown that the elevated hardness correlates well with the
increased concentration levels of carbon [85, 87]. This shows a carburisation profile
defined by diffusion of carbon from the surface. An exponential decay curve to carburised
specimen hardness data has been demonstrated within the ENVISINC programme [64],
fitting the following equation to individual hardness traces:
( ) expx
H x A BX
− = +
(23)
where H is the material hardness, x is the distance from the surface (considered to be the
metal-oxide interface), A is the elevation in hardness at the surface, B is the bulk hardness
and X is the characteristic depth of penetration. A typical hardness profile, with an
appropriate fit is presented in Figure 28, where the bulk material properties are considered
to be unaffected by carburisation and thus are the same as those of a homogeneous
material, and the carburised material, for analysis purposes, is assumed to be a uniform
layer [64]. It is however a significant simplification to treat the carburised material as a
uniform layer. In reality the carburised layer has a gradation of material properties,
varying from the surface to the bulk properties. It is known that the hardness profile
follows an exponential decay distribution [64]. However, with the exception of creep
ductility, there is no evidence to determine how the material properties vary as a function
of depth. Thus, by treating the carburised layer as a uniform layer of a defined depth,
average material properties can be calculated for that region.
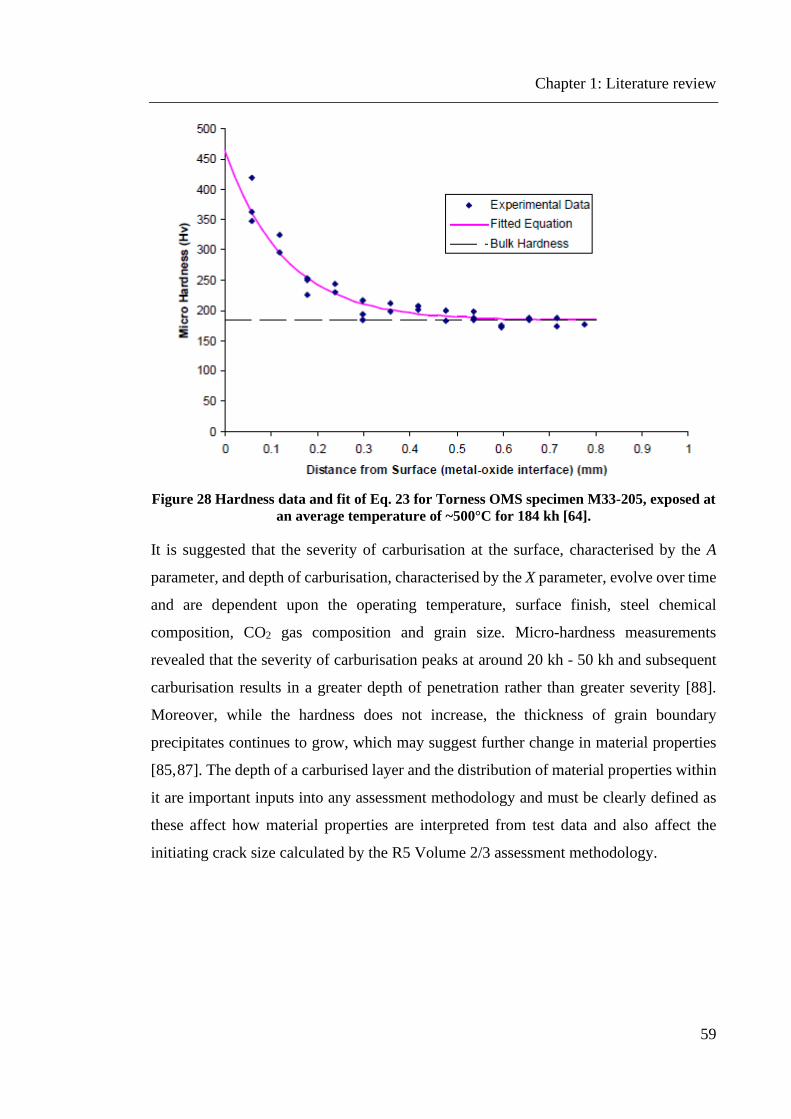
Chapter 1: Literature review
59
Figure 28 Hardness data and fit of Eq. 23 for Torness OMS specimen M33-205, exposed at
an average temperature of ~500°C for 184 kh [64].
It is suggested that the severity of carburisation at the surface, characterised by the A
parameter, and depth of carburisation, characterised by the X parameter, evolve over time
and are dependent upon the operating temperature, surface finish, steel chemical
composition, CO2 gas composition and grain size. Micro-hardness measurements
revealed that the severity of carburisation peaks at around 20 kh - 50 kh and subsequent
carburisation results in a greater depth of penetration rather than greater severity [88].
Moreover, while the hardness does not increase, the thickness of grain boundary
precipitates continues to grow, which may suggest further change in material properties
[85, 87]. The depth of a carburised layer and the distribution of material properties within
it are important inputs into any assessment methodology and must be clearly defined as
these affect how material properties are interpreted from test data and also affect the
initiating crack size calculated by the R5 Volume 2/3 assessment methodology.
Chapter 1: Literature review
60
1.4.5.2 Elastic modulus
Load controlled nano-hardness measurements performed on an OMS sample (EF 2959)
of 316H material which had been aged for 49 kh at 560°C disclosed an elevation in elastic
modulus towards the surface of the carburised material [85]. The data showed at room
temperature an increase in elastic modulus of 23% (215.25 ± 7.15 GPa), compared to bulk
properties (174.69 ± 7.29 GPa), at a depth of 50 μm and a 7% increase (188.83 ± 3.53 GPa)
at a depth of 100 μm from the surface. It also demonstrated considerable carburisation,
with a hardness measurement at a depth of 50 μm of 2.5 times greater than the bulk value
and a total carburisation depth of approximately 400 μm. As results have only been
obtained from one specimen and using nano-indentation, their reliability is still
questionable. Other experimental work on carburised hollow fatigue specimens, for
instance, has shown no measurable changes in elastic modulus for the carburised region
[64].
A more recent study considering the impact of carburisation on the elastic modulus of the
material suggests that Young’s modulus can be expressed as a function of carburised
fraction area [89], estimating a value of 205 GPa for the carburised layer, an increase of
30%, based on the extrapolation of the linear fit shown in Figure 29 and a calculated
Young’s modulus of 157 GPa of the bulk material. It has to be noted that this study
assumes a uniform carburised layer of 250 μm and no potential impact of the oxide on
the stress behaviour of the material (the oxide is treated as metal loss and thus with no
load-carrying capability) to avoid over estimates of the carburised Young’s modulus.
Also, the estimates are based on the two data points with a carburised fractional area of
~55%, hence there is still considerable uncertainty regarding the average elevation in
elastic modulus accross the carburised region and the effects are anticipated to be
marginal. In addition, it is currently expected that the above results will not significantly
change the assumption that the variation in the elastic modulus is not large enough to
require consideration in light of the more significant changes to other material properties
which have been observed [64].
Chapter 1: Literature review
61
Figure 29 Measure of Young’s modulus as a function of carburised fraction area (labelled
as “volume” in the figure) [89].
1.4.5.3 Yield stress
The change in yield stress due to carburisation has been reasonably quantified by fitting
a Ramberg-Osgood model to the uniaxial creep loading data of both conventional and
hollow specimens [90], presented in Figure 30. For the carburised material, assumed to
be a homogeneous layer, this model predicts a 0.2% proof stress of ~400 MPa. The
analysis of the data uses the Young’s modulus described above ( E = 157 GPa for bulk
material and cE = 205 GPa for carburised material) and the following equations to
determine the carburised tensile properties based on the Ramberg-Osgood fit:
11
''
' '
cb b c c
obs
c cE A E A
= + = +
(24)
( )1obs b cf f = − + (25)
where obs and
obs are the observed strain and nominal stress in the test; b and
c are
the stresses in the bulk and carburised layer respectively; f is the fractional cross sectional
area which is considered to be carburised; the calculated bulk material constants are:
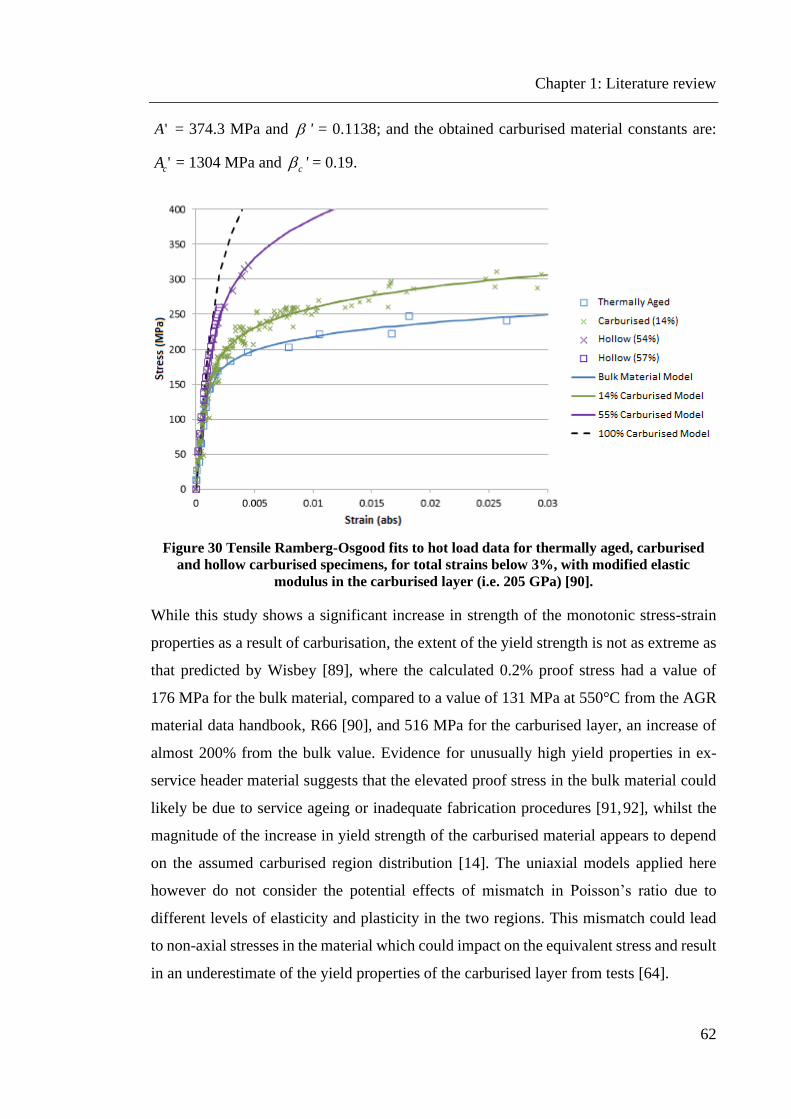
Chapter 1: Literature review
62
'A = 374.3 MPa and ' = 0.1138; and the obtained carburised material constants are:
'cA = 1304 MPa and c ' = 0.19.
Figure 30 Tensile Ramberg-Osgood fits to hot load data for thermally aged, carburised
and hollow carburised specimens, for total strains below 3%, with modified elastic
modulus in the carburised layer (i.e. 205 GPa) [90].
While this study shows a significant increase in strength of the monotonic stress-strain
properties as a result of carburisation, the extent of the yield strength is not as extreme as
that predicted by Wisbey [89], where the calculated 0.2% proof stress had a value of
176 MPa for the bulk material, compared to a value of 131 MPa at 550°C from the AGR
material data handbook, R66 [90], and 516 MPa for the carburised layer, an increase of
almost 200% from the bulk value. Evidence for unusually high yield properties in ex-
service header material suggests that the elevated proof stress in the bulk material could
likely be due to service ageing or inadequate fabrication procedures [91, 92], whilst the
magnitude of the increase in yield strength of the carburised material appears to depend
on the assumed carburised region distribution [14]. The uniaxial models applied here
however do not consider the potential effects of mismatch in Poisson’s ratio due to
different levels of elasticity and plasticity in the two regions. This mismatch could lead
to non-axial stresses in the material which could impact on the equivalent stress and result
in an underestimate of the yield properties of the carburised layer from tests [64].

Chapter 1: Literature review
63
Figure 31 depicts the existing mismatch in tensile stresses upon loading of uniaxial
specimens, where the predicted tensile stress-strain response of the carburised layer
assumes a yield stress about three times larger than that of the bulk material. Thus,
interpretation of available data on carburised material and the use of predictive models is
an area which still needs further consideration.
Figure 31 Uniaxial tensile behaviour of the carburised layer, bulk material and carburised
specimens with carburised fractional areas f of 0.14 and 0.57 [64].
1.4.5.4 Tensile ductility
Carburisation has been found to promote a significant reduction in tensile ductility and
hence resistance to crack initiation of material, due to the brittle carbide phases which
form on grain boundaries. Some evidence however suggests that the impact on tensile
ductility is highly dependent on temperature, with lower temperatures showing a large
change in tensile ductility, while at high temperatures the change is less significant [93].
This is rather important in understanding the way cracking in the carburised layer is
occurring to ensure correct interpretation of experimental results is made.

Chapter 1: Literature review
64
1.4.5.5 Creep deformation behaviour
The apparent creep deformation behaviour of carburised test specimens has been found
to be directly influenced by the effects of stress redistribution between the carburised
layer and bulk material. This is because after loading, the stress in the carburised layer is
much higher than in the bulk (as shown in Figure 30). With the accumulated creep strain
within the carburised material the stress relaxes, shedding load onto the bulk material,
which in turn results in additional plasticity in the bulk. This can lead to an increase in
primary creep rates at high stresses and a reduction in creep rates at low stresses where
the initial stress mismatch between the carburised layer and bulk material is less
significant than the change in creep deformation behaviour. Once the structure attains a
constant minimum creep rate, it is expected that the redistribution of the stresses reaches
equilibrium, and hence deformation continues with equal creep strain rates in both the
carburised and bulk materials [90].
Evidence suggests that extensive cracking in the carburised layer occurs at creep strains
greater than ~1%, and is likely to affect the deformation response of the material [90].
However, creep tests on carburised specimens presented by Wisbey [89] reached creep
strains much greater than 1% before reaching a constant minimum creep rate, leading to
uncertainties in the interpretation of secondary creep rates of the carburised material. To
derive the minimum creep properties of carburised material, a linear relationship has been
fitted to the as-received material test data by using Norton’s law. Considering only
engineering stress at 260 MPa, the fitted Norton creep law gives
36 10
mi
.18 1
n
14.079 10 1.567 10 /scn
c c
c
cC − −= = = (26)
where cC and
cn are the carburised creep constants, and c is the stress in the carburised
layer. This predicts a change in creep deformation by a factor of 0.0460 (i.e.
0.0460cC C= , where C as 358.876 10− is the creep constant for the as-received and
thermally aged material calculated from Figure 32), which is a reduction in creep rate by
a factor of ~22 compared to a best estimate minimum creep rate for as-received and
thermally aged material of 103.480 10 /s− at 260 MPa [90]. It has been noted by the
author that the above analysis is highly uncertain being based on a single carburised data
point and the simplified assumption of cn n= (where n is the creep constant calculated

Chapter 1: Literature review
65
for the as-received model, which is also significantly uncertain). In addition, historical
evidence of testing on carburised 9Cr1Mo material has suggested that the stress exponent
is affected by carburisation [94], so the above simplified assumption of 10.18cn n= =
may be invalid. This is an area of continued examination, and in its present form the result
is recommended to be used only as a basis for sensitivity studies within multi-material
finite element models where a carburised layer is being modelled.
Figure 32 Logarithmic plot of minimum creep rates and stresses for as-received and
thermally aged solid creep specimens and the carburised hollow creep specimen ACS21.
Equation provides the linear trend line to the as-received and thermally aged data [90].
1.4.5.6 Creep ductility
Carburisation of steel components in an AGR CO2 gas environment has been shown to
result in an embrittled carburised surface layer which appears to have a reduced creep
ductility and fatigue endurance compared to the underlying bulk material. This is due to
the elevated carbon content observed at the very surface, where changes in material
properties are anticipated to be more severe. Whilst the increased carbon and carbon
precipitates result in harder material, the coarsening of grain boundaries with carbide
precipitates results in an embrittled material. These modified material properties are
expected to have an impact on the time required to initiate a creep-fatigue crack [64].

Chapter 1: Literature review
66
Examination of material samples from the AGR CO2 oxidation surveillance scheme
showed grain boundary carburisation with subsequent oxidation to a depth of ~300 µm.
Similar effects were observed on ex-service boiler components, where the material
exhibited brittle fracture at the CO2 exposed outer surface and a more ductile fracture
towards the bulk material [95]. The study concluded that the resistance of the material to
crack initiation by creep and creep-fatigue mechanisms can be significantly reduced as a
result of the decreasing local material creep ductility due to the carburised surface layer.
The above findings are comparable to examination of 9Cr1Mo steel by Bolton and
McLauchlin [96] where the ductility of carburised samples compared to uncarburised
material was investigated. Specimens tested at 200 MPa and 560°C in vacuum with a
carbon content of 0.1 wt.% (uncarburised) failed at a creep strain of 40.6 % compared to
a rupture strain of 29.4 % for a heavily carburised material containing 1.2 wt.% carbon.
Increasing degrees of near surface carburisation due to preconditioning caused a 25-fold
decrease in minimum creep strain rate and an increase in rupture time by a factor of ~13.
A hypothetical relationship between failure strain and carbon content predicted an even
greater reduction in local failure ductility from ~38% down to ~3.5% for carbon contents
of 0.09 wt.% and 1.5 wt.%, respectively. The study also compared results from the
vacuum tests to creep data obtained from tests in atmospheric CO2 environment at 560°C
of untreated specimens. Similarly, strain rate and ductility were found to be reduced while
rupture time again increased by continuous carburisation. The authors concluded that the
reduction in creep deformation observed in carburised specimens outweighs the reduction
in creep ductility and therefore creep rupture properties were improved. This however
ignores the impact of cycling which could change their conclusions [14]. A more
conservative estimate of the creep ductility reduction derived from a number of
interrupted creep tests on pre-carburised specimens suggests that carburisation can
increase creep damage by a factor of 3.5 [90]. The level of confidence in this advice
however remains low and requires further materials testing.
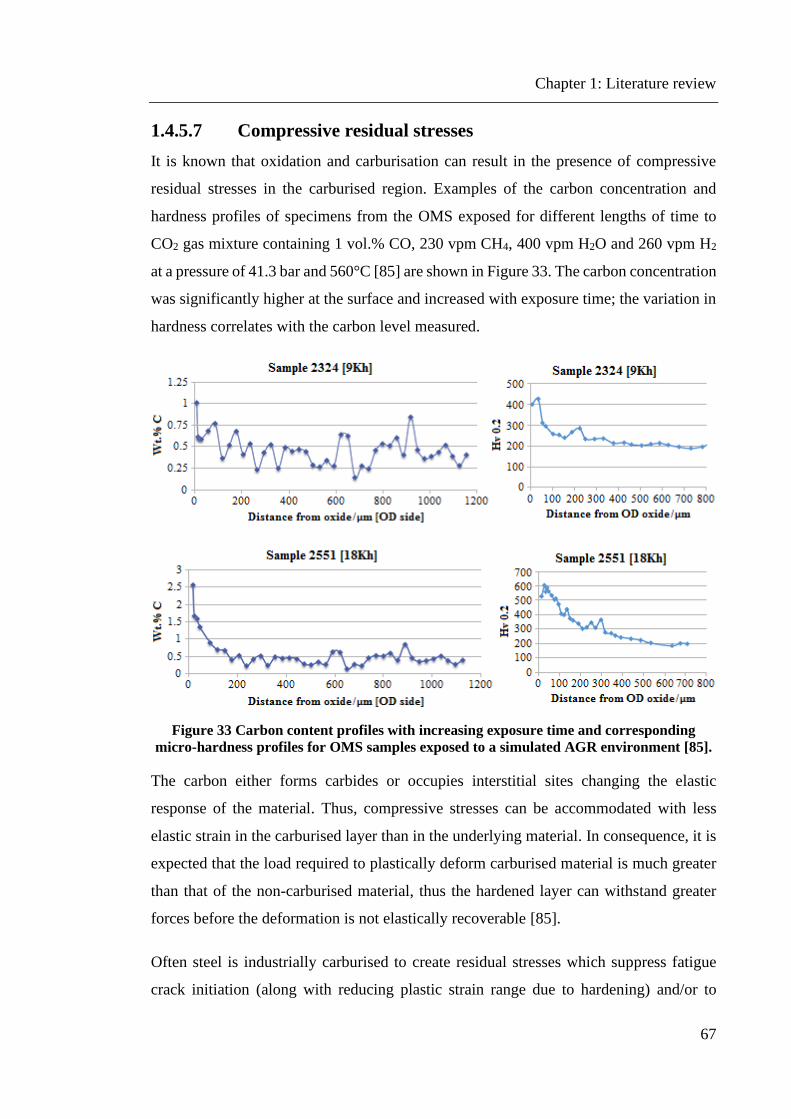
Chapter 1: Literature review
67
1.4.5.7 Compressive residual stresses
It is known that oxidation and carburisation can result in the presence of compressive
residual stresses in the carburised region. Examples of the carbon concentration and
hardness profiles of specimens from the OMS exposed for different lengths of time to
CO2 gas mixture containing 1 vol.% CO, 230 vpm CH4, 400 vpm H2O and 260 vpm H2
at a pressure of 41.3 bar and 560°C [85] are shown in Figure 33. The carbon concentration
was significantly higher at the surface and increased with exposure time; the variation in
hardness correlates with the carbon level measured.
Figure 33 Carbon content profiles with increasing exposure time and corresponding
micro-hardness profiles for OMS samples exposed to a simulated AGR environment [85].
The carbon either forms carbides or occupies interstitial sites changing the elastic
response of the material. Thus, compressive stresses can be accommodated with less
elastic strain in the carburised layer than in the underlying material. In consequence, it is
expected that the load required to plastically deform carburised material is much greater
than that of the non-carburised material, thus the hardened layer can withstand greater
forces before the deformation is not elastically recoverable [85].
Often steel is industrially carburised to create residual stresses which suppress fatigue
crack initiation (along with reducing plastic strain range due to hardening) and/or to

Chapter 1: Literature review
68
improve resistance to wear and erosion. X-ray diffraction measurements on austenitic
stainless steels have approximated that low-temperature carburisation can result in excess
of 2 GPa compressive residual stresses at the surface [97]. Although this is a deliberate
process to harden the surface through the diffusion of interstitial carbon, without the
formation of carbides, the example can be indicative of the possible magnitude of these
stress contributions due to the increased proportion of carbon. The magnitude of residual
stresses present in AGR components has not been measured, however if cyclic plasticity
occurs it is assumed these stresses will be removed. As initial residual stresses are
expected to be compressive in the carburised layer it can also be assumed that it is
conservative to neglect them [64].
1.5 Factors affecting the kinetic behaviour of Type 316H stainless
steel in AGR environment
There are many parameters that can influence the corrosion behaviour of Type 316
stainless steels. However due to their complexity and wide range only the most significant
factors are discussed in detail, relevant to the present study.
1.5.1 Effect of surface preparation on oxidation and carburisation
The surface finish of a material can have a variety of impacts on the corrosion behaviour,
primarily on the passive layer formed in the early stages of oxidation [12]. Previous
studies concluded that the removal of a mechanically worked surface layer will initiate a
premature chromia scale breakdown, allowing duplex oxide growth and carburisation to
occur much sooner [14]. Conversely, a heavily worked surface layer reveals an increased
dislocation density, providing fast diffusion paths for chromium to reinforce the external
chromia film or favour the formation of a healing layer. The effect of surface finish on
oxides can also depend on the oxygen partial pressure of the environment [98].
Surface finish and the level of local deformation significantly affect the oxidation rate.
Alloys with ground surfaces have less weight gain due to oxidation when exposed to CO2
environment than chemically treated samples [77], as shown in Figure 34.

Chapter 1: Literature review
69
Figure 34 Weight change kinetics of 304 SS at 700°C in CO/CO2 gas mixture during
thermal cycling reaction [77].
In the early stages of oxidation (i.e. exposure < 3000 h) the formation of the protective
chromia film is enhanced by surface work leading to lower oxidation of the exposed
material [84]. The effect of surface work can be seen in Figure 35 [76], where a 600-grit
SiC ground surface developed a thin oxide layer compared to a thick duplex oxide on a
surface polished with an oxide dispersion solution (OPS). Significant alteration of
residual stress has also been observed at the surface of specimens with an OPS finish,
whilst the 600-grit ground surface showed little change in the magnitude of residual
stress. Additionally, for the OPS polished specimen the oxides formed preferentially
inside the grain rather along grain boundaries, indicating that the diffusion coefficients
for Cr and Fe differ for grain interiors and grain boundaries. It is clear that different
preparation methods result in dissimilar surface characteristics during oxidation.
Therefore, resistance of an alloy to both oxidation and carburisation can be greatly
improved by optimising the surface finish.

Chapter 1: Literature review
70
Figure 35 SEM images of 316H stainless steel samples exposed to atmospheric 1%CO/CO2
environment for 500 h at 550°C. Samples had (a) 600-grit and (b) OPS surface finish [76].
More generally, components in plant will often not have a specified surface finish, but
this will be a function of how they have been manufactured. A recent study investigating
the effect of machining on stress corrosion crack (SCC) initiation in Type 316L stainless
steel in simulated pressurised water reactor (PWR) primary water environment under
slow strain rate tensile (SSRT) test conditions showed that machining results in a surface
deformation layer comprising an ultrafine-grained layer on the top and deformation bands
underneath which significantly increases the SCC initiation resistance of the alloy
compared to an OPS polished surface [99]. The study also revealed that the SCC initiation
and oxidation behaviours of the machined and polished surfaces were different for
differing raw material conditioning (i.e. annealed and cold-worked materials) and
sensitive to roughness, orientation of machining marks and residual stresses present at the
surface. This is important when considering the impact of surface finish on carburisation
to ensure that the preconditioning procedures of test specimens are optimal and their
effects are well understood. Product form will also impact on other material
characteristics which may influence carburisation such as grain size, as discussed in
Section 1.5.2.

Chapter 1: Literature review
71
1.5.2 Influence of grain size
Grain size is another important factor affecting oxidation growth rates. It is evident that
diffusion of reactants along grain boundaries is faster than through the bulk material.
Grain boundaries act as a diffusion path for chromium to reach the surface, which impedes
oxide growth and promotes the possible formation of a healing layer. Therefore, larger
grains mean fewer grain boundaries hence less outward diffusion of chromium, resulting
in poor oxidation properties. Based on this theory, it is expected that materials with larger
grains (including HAZ) are more prone to carburisation [14]. It has also been observed
that for the formation of an external chromia layer, finer grained materials require less
chromium content when compared to coarse grains [100].
Defining typical grain sizes for specimens can sometimes be rather difficult, an example
of which is depicted in Figure 36. This shows a grain structure at the outside diameter
(OD) with grains up to 500 μm diameter and the bulk having grain sizes of ~50 μm.
Currently it is unclear whether these enlarged grains are a result of the manufacturing
process, growth during heat treatment or potentially growth during service. Issues may
also arise when using micro-hardness measurements as an indicator of carburisation when
considering specimens with different grain sizes. If hardness is dependent on grain
boundary impingement it will become less reliable as grain sizes get larger [14].
Figure 36 SEM image of the ex-service tailpipe (HNB R3 A1C9) showing different grain
sizes at the surface compared to the bulk [14].

Chapter 1: Literature review
72
1.5.3 Influence of temperature
Temperature is another variable which is accounted for in oxidation growth rates within
the AGR oxidation data manual, R67 [101]. It has been observed that there are critical
operating temperatures that define which process is more dominant during oxide growth.
At temperatures less than 480°C a duplex oxide is unlikely to form and even if it does,
the diffusion rates are so slow that no significant carburisation will occur. Between 500°C
and 600°C a duplex oxide is readily formed and as previously stated, in some regions a
healing layer may not develop. Therefore, this range is considered the worst temperature
regime as it is high enough to carburise the material but low enough not to form a
protective healing layer at the oxide-metal interface. At 600°C specimens are expected to
develop a healing layer but before they do, the elevated temperatures can result in severe
carburisation. At even higher temperatures, such as 650°C, the diffusion rates are faster,
thus a duplex oxide develops quickly accompanied by a healing layer, allowing minimal
carburisation to occur [14].
1.5.4 Effect of gas composition
Unlike oxide growth, which is diffusion based, gas transport is driven by the pressure
difference between the corrosive environment and the oxide-metal interface. It has been
concluded that the carbon activity at the metal-gas or the metal-oxide interface intensifies
with increasing pressure. Up to around 600°C little or no significance is observed for the
interaction of temperature and pressure in the oxide scale growth [12]. The quantitative
composition of the gas mixture in an AGR can be approximated as CO2, 1% CO, 700
ppm CH4, 200 ppm H2 and 250-300 ppm H2O [12]. Whilst there are some potentially
important differences between the real AGR and simulated AGR gas, studies so far have
shown the carburisation behaviour is largely the same [14], with the key rate controlling
constituents of the gas being CO and H2O. Changes in the gas chemistry can amend the
morphology of an oxide scale, impeding or accelerating oxidation accordingly to the
altered diffusion rates. Raising the CO/CO2 ratio from 1% to 5% increased the 9Cr
oxidation rate significantly causing alterations in the structure of the oxide layer [12].
Understanding the impact of the gases on carburisation could bring an insight on how
changes in gas constituents can accelerate carburisation without altering the resulting
microstructure.
Chapter 1: Literature review
73
1.5.5 Impact of mechanical loading
In service, structural components are subjected to both steady and cyclic loading. Steady
loading results in a strained material often with accelerated diffusion rate characteristics.
Although diffusion has a determining role in the formation of a healing layer as well as
carburising the material, it is not evident how the load alone would affect carburisation.
Influence of strain gradients is still unclear in carburisation but it is suggested that
carburisation at a crack tip may be different to carburisation on an uncracked surface. On
the other hand, cyclic loading tends to cause the chromia film to spall due to the reduced
ductility of the scale compared to the substrate. This means that for materials in areas
where cyclic loading is intensified duplex oxide is more likely to develop. Consequently,
the material will be more susceptible to carburisation, especially at stress concentration
locations such as heat affected zones (HAZ) and geometric features [14]. The impact of
strain on carburisation is to be studied as part of the present work by also considering gas
constituents.

Chapter 2: Introduction and scope of work
74
2. Introduction and scope of work
2.1 Background and motivation for research
Research studies on the oxidation behaviour of austenitic stainless steels upon exposure
to AGR and other CO2 containing environments show that the extent of metal loss due to
oxidation and the accompanying carbon ingress into the metal are closely dependent on
a combination of several metallurgical and environmental factors including: steel
composition in particular chromium content, steel microstructure and surface finish,
residual stresses, gas pressure, gas moisture content and temperature [12, 102]. In all the
corrosive environments studied the results reported indicate that an efficient protection
can be obtained when a dense chromium-rich oxide scale containing phases like Cr2O3
and FeCr2O4 forms on the steel surface. In AGR environments, which comprise primarily
CO2 + 1vol. % CO and typically few hundreds vppm of H2O + H2 with small amounts of
CH4, long term oxidation of the austenitic stainless steels (the materials of superheater
bifurcations and tailpipes) at temperature up to 600°C has been found to lead to the
formation of a duplex oxide consisting of an outer magnetite layer and an inner spinel
layer in addition to carburisation of the base metal [81]. In austenitic steels the formation
of chromium-rich oxides is not usually prevented by the internal formation of chromium-
rich carbides due to the availability of a higher chromium concentration in these materials,
but this depends on the initial chromium content, exposure temperature and degree of
carburisation.
In order to evaluate the environmental effects of carburisation on the mechanical
properties and the remaining lives of the austenitic steel components currently used in
AGRs, and to develop an understanding of this degradation mechanism, a large
programme of work was initiated in April 2013 to address these issues. This specific
programme constitutes the framework of the Environmental Impact on the Structural
Integrity of Nuclear Components (ENVISINC) project which comprises several work-
packages involving materials characterisation, mechanical testing, modelling, assessment
methodology development and validation. The programme of work was split amongst
five project partners: Imperial College London, University of Bristol, The University of
Manchester, Amec Foster Wheeler and EDF Energy. The University of Manchester's
practical contribution largely fell on the work of this doctoral thesis and was primarily

Chapter 2: Introduction and scope of work
75
concerned with destructive experimental testing and evaluation methods. The novelty of
this work lies in the capability of a newly developed experimental technique to directly
investigate the effects of interaction between creep and corrosion within a CO2 based
environment under AGR conditions, representative of conditions that a typical reactor
boiler component would experience. It is anticipated that the findings of this research will
yield additional insight into the mechanism of CO2 oxidation/carburisation of stainless
steel components in plant, leading to modification of current high temperature structural
integrity assessment procedures.
2.2 Research aim and objectives
The general aim of this research is to investigate and better understand the material -
environment interaction in order to learn more about the deformation and failure
behaviour for Type 316H stainless steel subjected to both steady and cyclic creep
conditions in a CO2 environment. Understanding in full the environmental effects on
oxidation and mechanical material properties within an AGR environment would allow
for a more conservative approach to predict the life limiting degradation mechanisms for
in-reactor stainless steel components. It is important not only to identify but also to
quantify the key parameters leading to the deterioration of oxidation resistance and
thereby the initiation of cracking and premature failure observed in nuclear power plant
components.
The specific objectives of the work are to:
• Study the effect of the environment on the creep properties of 316H material
(including the initiation and growth of surface cracks).
• Characterise the evolution, morphology and thickness of the oxide scale on
differing surfaces by also considering the effect of material strain.
• Study the implication of creep on the formation and disruption of the oxide film.
• Determine the effect of stress, strain and surface finish on carburisation properties.
• Establish the severity and depth of carburisation as a function of the environmental
conditions.
Chapter 2: Introduction and scope of work
76
2.3 Thesis structure
This section outlines the layout of the thesis, wherein the work presented, as part of and
subsequent to the ENVISINC programme, consists of three parts (Chapters 6, 7 and 8).
Chapter 1 introduces key theoretical concepts relevant to this research. Fundamental
material behaviour and high temperature corrosion is described alongside the mechanisms
of creep and fatigue degradation. It also draws together information from internal (reports
within EDF Energy and Amec Foster Wheeler) and external sources (journal papers,
reports from other research organisations) to summarise the current understanding of the
oxidation/carburisation effects on mechanical properties such as creep/fatigue crack
initiation in Type 316 steels.
A brief introduction to the research project, specific aim and objectives and the overall
structure of the thesis are all provided in Chapter 2.
Chapter 3 describes material characteristics and the preconditioning process undertaken
to replicate the effects of AGR gas carburisation on test samples. A comparison to ex-
service carburised material is made through metallographic examination, hardness testing
and carbon profile measurement.
Chapter 4 details the different metallographic preparation and characterisation processes
and the various microscopic based techniques used throughout this project.
Chapter 5 describes in detail a horizontal stress rig equipped with added features specially
designed and fabricated for performing oxidation and carburisation experiments in a
sealed high-temperature CO2 gas environment under uniaxial creep loading conditions.
Operational specifications including the necessary instrumentation/components of the
test module are also presented.
Chapter 6 considers a number of creep testing activities to contribute to the development
of a statistical database for creep analysis purposes. A comparison is made between the
effects of stress and different preconditioning treatments on the creep response and crack
initiation behaviour of Type 316H stainless steel material to evaluate the interaction
between carburisation and damage initiation.
Chapter 2: Introduction and scope of work
77
Chapter 7 is focused on conducting complementary metallographic examinations and
mechanical testing on the ex-service 316H header material used in the present study with
the objective of obtaining detailed microstructural and mechanistic understanding of this
specific test material.
The aim of Chapter 8 is to develop a novel mechanical testing method for use in
oxidation/carburisation analyses under applied load conditions in a simulated AGR
environment in order to evaluate the changes in material properties which are induced by
the exposure environment. The data obtained from this test method will be compared with
those obtained from more conventional methods by the participating partners in
ENVISINC and are then likely to be used for assessment purposes.
A complete discussion is contained within each results chapter alongside the primary
conclusions drawn. The entire thesis is summarised in Chapter 9 where the potential
impact of this work on component lifetime assessment is discussed, followed by
recommendations for future work in Chapter 10.
Appendix-A1 contains a detailed technical drawing of the cylindrical specimen used for
creep testing by all participating laboratories, while the rest of the appendices (A2 to C2)
present detailed experimental data in form of summary tables for data comparison/
verification purposes.

Chapter 3: Materials and preconditioning
78
3. Materials and preconditioning
Test specimens were extracted from a service exposed boiler header made of an austenitic
steel of the Type 316H, removed from Hartlepool power station (HRA), and a
decommissioned 316H stainless steel tube material, both provided by EDF Energy.
Material characteristics and preconditioning treatments are presented in detail below.
3.1 As-received material (AR)
As part of the experimental programme of the ENVISINC project, an ex-service (non-
active) header material of 316H stainless steel was selected for testing, as this is directly
relevant to many plant applications. The header, identified as HRA 1C2/3 and
manufactured from cast 55915, had been subjected to plant service for 98,704 hours at
temperatures between 490 - 530ºC (thermal ageing only, no exposure to AGR coolant
gas). Creep specimens tested in this project were extracted by Amec Foster Wheeler from
this header, which is referred to as as-received (AR) material hereafter. A section of the
same header was chosen as the donor material of the dog-bone samples used for creep
testing in a simulated AGR environment. The nominal chemical composition of the
material is given in Table 2 and the full header is shown in Figure 37.
Table 2 The chemical composition of the 316H header (HRA 1C2/3) material used for
testing. Note that this is a generic cast 55915 analysis (i.e. not header specific) [103].
Element C Si Mn S P Ni Cr Mo Co B
Wt.%
(wt.%)
0.05 0.49 1.56 0.009 0.021 11.35 16.90 2.26 0.09 0.003
Figure 37 Overview of header HRA 1C2/3, 316H SS (Cast 55915), prior to cut up [103].

Chapter 3: Materials and preconditioning
79
As noted above, the header identified as HRA 1C2/3 had seen considerable service
exposure, but had not been exposed to CO2 oxidation and hence was neither active nor
carburised. This material was given the Amec Foster Wheeler identification number
MT0920 and off-cuts were then identified by a subsequent suffix. All creep specimens
tested in this research were machined from the central region of the header-wall (off-cut
MT0920/12). Full details of the sectioning drawings and specimen extraction plans are
contained in [103].
3.2 Pre-carburised material (PC)
In support of the mechanical testing requirements to better understand the structural
performance of Type 316H steel with a hardened (carburised) surface layer (as observed
in plant), a preconditioning technique was developed to produce uniaxial creep test
specimens with a carburised/oxidised surface layer. The technique built upon the
understanding of the carburisation mechanism presented in the literature survey (see
Chapter 1 – Section 1.4) and hinged on the removal of surface mechanical work through
a sequential grinding and polishing technique, as used for conventional metallographic
preparation (detailed later in Chapter 6 – Section 6.2.1). It has been previously identified
that formation and eventual breakdown of a highly protective M2O3 passive film governed
the early behaviour of 316H material exposed under AGR conditions [88]. Therefore any
preconditioning process should aim to reduce or eliminate this early incubation period.
Experimental studies carried out at The University of Manchester [9] also found that the
surface finish of the specimens was an important factor in determining the time taken to
establish elevated hardness. Thus, preconditioning work was undertaken using specimens
that were polished to an OPS level of finish in order to chemically remove any plastically
deformed surface region which may result in enhanced Cr diffusivity and hence support
the growth of a Cr2O3 oxide in the early stages of oxidation.
To simulate the elevated surface hardness observed in some 316H material from AGR
plant, the OPS polished specimens in an initial as-received (AR) material condition were
exposed to simulated AGR coolant gas for 3000 hours in laboratory autoclaves at Amec
Foster Wheeler’s high temperature oxidation facility. The simulant coolant composition
was: 1 vol.% CO, 270 vppm CH4, 100 vppm H2 and 500 vppm H2O with the balance CO2.
The gas was maintained at a pressure of ~4.1 MPa and a temperature of 600°C, similar to

Chapter 3: Materials and preconditioning
80
the conditions expected in parts of the AGR primary circuit [103]. After a period of
exposure (1000 hours) a check sample was removed, sectioned and given a basic
metallurgical examination and also micro-hardness tested to evaluate the extent of
carburisation into the metal. This check was repeated at both the 2000 hour and 3000 hour
intervals. The resulting test specimens showed a significant oxide layer and a significant
hardened layer (close to 600 Hv) following the 3000 hour exposure. The preconditioning
process was thus considered successful, supressing the growth of a passive film and
causing rapid onset of duplex oxide. Therefore, at the 3000 hour interval it was agreed
with EDF Energy and other ENVISINC partners that this time was sufficient to induce a
level of carburisation with an effect on the mechanical properties of the test-samples that
would be comparable to the ex-service materials, for the purposes of this programme, and
the samples were thus suitable for use as pre-carburised (PC) specimens.
3.2.1 Post-treatment microstructural evaluation of the PC material
An image of the carburised surface layer following the 3000 hour exposure can be seen
in Figure 38 [103], and the normalised, regressed hardness profiles for the pre-carburised
material samples following both 1000 hour and 3000 hour of exposure are presented in
Figure 39 [88]. The details of these studies can be found in [104].
Figure 38 Carburised 316H trial sample showing duplex (magnetite and spinel) oxide
layers after 3 kh exposure to simulated AGR coolant gas, adapted from [103].

Chapter 3: Materials and preconditioning
81
Figure 39 Plot of regressed hardness profiles for the pre-carburised test pieces following
1 kh and 3 kh of exposure [88].
Similar trends in the depth of carburisation and degree of hardening were also observed
by the University of Bristol from examination of the microstructure of the 316H header
material after the 3 kh treatment [85]. The hardness and carbon concentration profiles
obtained for the exposed samples, which are reproduced in Figures 40(a) and (b),
respectively, show a peak hardness about 500 Hv and maximum concentration of carbon
of about 1.6 wt.% in regions of the metal adjacent to the oxide-metal interface. Both
profiles indicate that the hardened layer created by carburisation of the metal is about
150 ± 30 μm wide, which again is comparable to the hardened layers of the ex-service
materials. The characteristic depth of the carburised layer, however, was judged to be
250 μm [90], based on the overall hardness measurements acquired from all participating
laboratories.

Chapter 3: Materials and preconditioning
82
(a)
(b)
Figure 40 Plots of (a) hardness and (b) carbon concentration profiles of the pre-carburised
316H header material following exposure to simulated AGR gas at 600°C for 3 kh [85].
3.2.2 Limitations of the preconditioning procedure
Detailed analysis of the preconditioned 316H carburised layer by Bristol University [85]
suggested that the morphology of the carbides near to the sample surface and adjacent to
grain boundaries differed from that seen in ex-service plant components suffering from
surface hardening. This difference was thought to be associated with the relatively rapid
insertion of the carbon into the surface during preconditioning, compared with the much
longer times experienced in-service. Thus it must be recognised that some differences
exist between the preconditioned material examined here and the carburised surfaces seen
in plant. However, it is believed that this preconditioning treatment provides an effective
route to generate Type 316H material with a reasonably representative hardened surface
layer present, and with a hardness profile similar to that observed in service [103].

Chapter 3: Materials and preconditioning
83
Post-treatment microstructural analyses conducted by Amec Foster Wheeler [88] also
revealed that the oxidation appeared to be significantly more uniform in nature, compared
with the ex-service and OMS test samples that have been examined. When compared to
materials with a similar exposure history, there is a clear enhancement in the rate of
oxidation and hardening. This is thought to be due to the removal of surface cold work
and the retardation of Cr diffusion to the surface, as suggested above. Hence, these studies
provide some substantiation for this understanding of the elevated temperature oxidation
behaviour in 316H stainless steel.
Also, the preconditioning of test materials was conducted under a pressurised AGR
simulant gas (at ~4.1 MPa), but not under an applied stress. A number of the materials
degradation challenges of stainless steel plant components are due to their operation
within the creep regime (for example, the boilers which transfer heat within the CO2 gas
internally in the reactor to the secondary circuit), where materials are subjected to
significantly greater stresses, and hence undergo deformation. Therefore, a fundamental
understanding of the combined effects of stress and strain and surface finish on both
oxidation and carburisation behaviour is essential for predicting the safe operating life of
in-reactor high temperature components. The present study attempts to address these
combined effects from the oxidation/carburisation studies under stress, presented later in
Chapter 8.
3.2.3 Advice on the use of pre-carburised (PC) test specimens
It has been identified that the exposure also led to approximately 50 μm of metal loss
through oxidation. Duplex oxide grows outwards and inwards from the original metal
surface position at an identical rate, and so 50 μm metal loss results in 100 μm of total
oxide thickness. Therefore, the gauge diameter measured after exposure was
approximately 200 μm greater than the underlying gauge diameter. In assuming the oxide
is non-load bearing, a reduction of 0.2 mm of the gauge diameter should be performed
for each pre-carburised (PC) test specimen when calculating the applied load for a given
stress, in order to isolate the oxide layer (formed in the course of the preconditioning
procedure) upon straining.

Chapter 3: Materials and preconditioning
84
3.3 Thermally aged material (TA)
In order to eliminate the effect of microstructural changes due to the extra 3000 hours of
thermal ageing of the specimens whilst undergoing pre-carburisation, a section of the as-
received (AR) header material was subjected to thermal ageing only for an additional 3
kh at 600°C; from hereon referred to as thermally aged (TA) material. This simulates the
thermal ageing aspects of the preconditioning treatment but not the oxidation or
carburisation. Creep specimens were then extracted from this thermally aged (TA)
material, allowing for a direct comparison with the carburised material, isolating the
effects of exposure to the simulated coolant gas [103].
3.4 Carburised tube material (CT)
To evaluate the long term effects of environmental carbon on the mechanical properties
(with respect to the resultant microstructure) of stainless steel plant components, the work
on materials characterisation (Chapter 7) has been extended on a heavily oxidised tube
material, provided by EDF Energy. The decommissioned stainless steel tube (identified
as A-213-TP 316H standard, section ID: SD1/034, Cast: HT509885), had been exposed
to AGR type coolant for approximately 49 kh at 560ºC. It is believed that this material
has also been sensitised (i.e. some short term thermal ageing, possibly at 700°C for a
couple of hours). A section of this tube, from hereon termed as carburised tube (CT)
material, is shown in Figure 41, and its nominal chemical composition [92] is given in
Table 3.
Table 3 The chemical composition of the (Sandvik) tube material identified as A-213-TP
316H standard, section ID: SD1/034, Cast: HT509885, LOT 42081 [92].
Element C Si Mn S P Ni Cr Mo Co
Wt.%
(wt.%)
0.05 0.53 1.55 0.0053 0.029 11.23 16.85 2.04 0.089
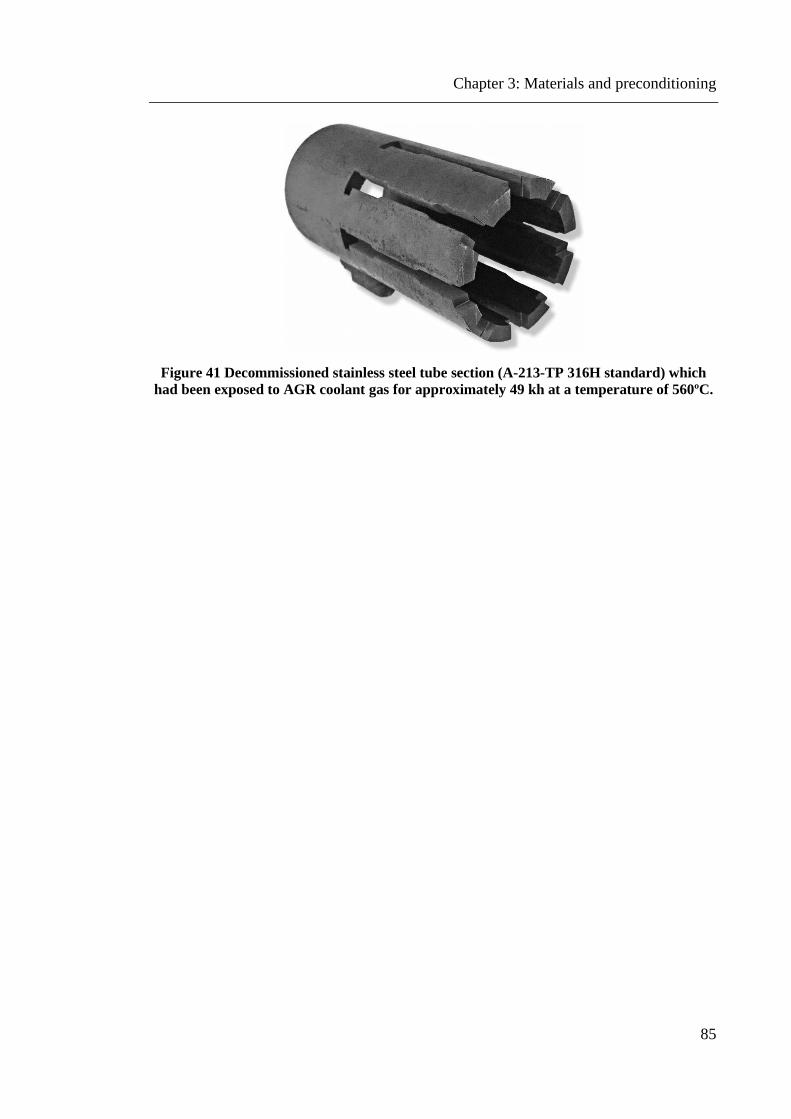
Chapter 3: Materials and preconditioning
85
Figure 41 Decommissioned stainless steel tube section (A-213-TP 316H standard) which
had been exposed to AGR coolant gas for approximately 49 kh at a temperature of 560ºC.

Chapter 4: Techniques used for sample preparation, characterisation and investigation
86
4. Techniques used for sample preparation, characterisation
and investigation
This chapter provides a detailed overview of the metallographic preparation and
characterisation processes and the various microscopic based techniques used throughout
this project. Note that equipment specification and methods for mechanical testing
activities such as tensile testing and creep testing are not presented here, but are included
in the corresponding chapters.
4.1 Mechanical grinding and polishing
Samples in general were progressively ground with silicon carbide paper of different grit
sizes (600, 800, 1200, 2400 and 4000 grit) and mechanically polished with diamond
suspension solution (6 μm, 3 μm, 1 μm and 0.25 μm). In each step, the samples were
washed with soap, rinsed with deionised water and cleaned with ethanol before being
dried in a stream of warm air.
4.2 Chemical-mechanical polishing (OPS)
Chemical-mechanical polishing with colloidal silica oxide polishing suspension (OPS)
was employed for the final polishing stage to remove the work hardened surface layer
induced by mechanical preparation, and hence obtain a strain free surface representative
of the bulk metal. OPS polishing is a combination of mechanical and chemical material
removal; the active oxide suspensions react chemically with the surface of the material,
building a reaction layer which then is removed by the small abrasive particles present in
the suspension. This technique is not believed to alter the surface composition, and
thereby is similar to an electropolished surface finish [105, 106].
All samples were hand polished on an OPS cloth in colloidal silica diluted with deionised
water to a ratio of 1:4 (to prevent etching) for 25 - 30 minutes. Once polished, the samples
were rinsed with ethanol and, where appropriate, ultrasonically cleaned in acetone for 10
minutes and dried. OPS polishing hereafter refers specifically to the above described
surface conditioning method unless otherwise stated.

Chapter 4: Techniques used for sample preparation, characterisation and investigation
87
4.3 Electrolytic etching with oxalic acid
A single-step etching technique, utilising a 10% oxalic acid in water (10 g oxalic acid in
100 ml of solution) was employed to reveal the grain boundary structure [107, 108]. A
period of 10-15 second submerging etching at 6 V was the optimal condition and gave
very good results for AISI 316 austenitic stainless steel. However, for revealing smaller
particles such as carbides and the different phases, lower voltages (1-3 V) and different
length of times may be required.
4.4 FEG-SEM / EBSD / EDX
A number of field emission gun (FEG) scanning electron microscopes (SEM) were used
in this project for the different application-specific choices.
A Quanta 650 FEG-SEM and a Zeiss Ultra-55 FEG-SEM was used to capture subtle
surface information, both capable of high resolution surface examination down to a few
nanometers. Typically the images have been taken with a working distance of 4 to 6 mm
and 5 kV accelerating voltage.
Mapping of crystallographic orientation and identification of the grain size and grain
boundary character was performed on a CamScan FEG-SEM coupled to a high-
performance electron backscatter diffraction (EBSD) detector. The EBSD data were
analysed with Oxford Instruments HKL Channel 5 post-processing suite of programs.
Even though some agile techniques may not apply to this project, EBSD has also been
reported to characterise the plastic and creep strain in the material by measuring the
changes in the lattice misorientations [109].
Chemical analysis, where discussed in this manuscript, refers simply to semi-quantitative
energy dispersive X-ray (EDX) spectroscopy conducted on a Zeiss Sigma Integrated
Analytical SEM equipped with Oxford Instruments EDX detector. The EDX spectra were
then analysed with the INCA software.
Chapter 4: Techniques used for sample preparation, characterisation and investigation
88
4.5 Macro-hardness measurement
A calibrated Vickers hardness tester of the Armstrong Pedestal type with load range of 1
to 150 kg was used for the macro-indentation tests. In each test, a minor load of 10 kg
was used to produce indents, which then were measured using an optical microscope with
a micrometre controlled shutter.
4.6 Micro-hardness measurement
Micro-hardness tests were carried out with a Struers DuraScan 80 fully automatic
hardness tester with test load range from 10 g to 10 kg. Consistently the series
measurements were performed under two different, relatively small applied loads: 25 gf
and 0.2 kgf. The indents were recorded by means of an optical microscope linked to a
digital camera; dimensions were accurately evaluated with the ecos Workflow software.
4.7 Nano-hardness measurement
The system used for the nano-hardness measurement was an MTS Nano Indenter XP with
a load resolution of ~10 nN, displacement resolution of ~0.01 nm and maximum
indentation load of 500 mN. The equivalent new system (virtually identical) is a Keysight
G200 model.

Chapter 5: An improved experimental setup for creep testing in a CO2 environment
89
5. Development of an improved experimental setup for creep
testing under load in a CO2 based environment
5.1 Rationale
Conventional methods for creep testing generally require a large testing machine and
relatively large samples. These are often not suitable for use in highly controlled
environments. In such cases, custom built equipment provides the best method for solving
the bespoke requirements which include small structure, easy handling and controlled
environmental conditions.
One of the aims of the present work was to investigate the effects of initial plastic strain
and creep on oxidation and carburisation behaviour of Type 316H stainless steel in a
simulated AGR environment. This required an experimental setup different to any that
were available at the start of the study. Therefore, a purpose-built horizontal high-
temperature testing stress rig has been specially designed and fabricated for performing
oxidation and carburisation experiments in a sealed CO2 based environment under
uniaxial creep loading conditions at 550°C. The rig contains a basic loading mechanism,
similar to others that were available, but with a significantly improved construction, and
hence a better and reliable performance. Unlike the old equipment, the new load frame is
capable of applying constant tensile loads and measuring material strain at micron level
precision, each with minimum external control. The rig can also easily be fitted in
standard fume cupboards, such as those found within an active laboratory on university
premises, and inserted into relatively confined tube furnaces with minimal assembly
expenses. The design concepts of both the old and the new testing equipment are
described in detail in the following sections.

Chapter 5: An improved experimental setup for creep testing in a CO2 environment
90
5.2 Design and development of the horizontal creep frame
The new design is a major restructuring of a pre-existing device. A schematic
representation of the old rig is shown in Figure 42. This consists of a sample-grip
mechanism and a pull rod connected to the loading unit with unsupported (free) ends.
Figure 42 Schematic representation of the pre-existing stress rig used to expose samples in
atmospheric CO2 environment at 550°C under load.
Stressing the sample during the experiment was achieved by a loading spring system in
series with a calibrated proving ring with an attached strain gauge to record the applied
load. By tightening the locking nut at the threaded end of the pull rod the sample can be
gradually loaded in tension to the desired level of stress, at which stage the springs along
with the proving ring and the guidance tube are under compression. However, once the
target load has been achieved and the sample starts to elongate, the springs start to relax
with the continuous displacement of the pull rod, resulting in a gradual decrease of the
applied stress during testing. Moreover, the strain gauge system does allow for either
axiality checks or accurate deformation measurements. Thus, the rig was not capable of
applying the creep testing conditions required in the present study.
To better satisfy the required experimental parameters, a horizontal creep rig that
facilitates real-time measurement of material creep behaviour has been designed and
developed. Subsequent to the work reported in this thesis, the rig is being used in
improved studies on the material-environment interaction of Type 316H steel under
simulated AGR conditions. The full equipment is illustrated in Figure 43.

Chapter 5: An improved experimental setup for creep testing in a CO2 environment
91
Figure 43 Final assembly of the complete creep frame before installation in the oxidation
rig. The layout and operational features including the necessary instrumentation of the
test module are also indicated.

Chapter 5: An improved experimental setup for creep testing in a CO2 environment
92
The assembly consists of a wheel and shaft mounted on a bearing support designed to
enable movement and change the direction of a taut wire rope connected to a horizontal
pulling rod at one end and to a vertical weight hanger at the other end. The load frame
has a cantilever construction with the pulling rod and the guidance tube anchored at only
one end to the support structure and the grip device, where the specimen is mounted,
secured on the suspended end. Stressing the sample during the experiment is achieved by
applying slotted certified scale weights on the hanger. The pulley system also acts like a
compound lever by amplifying the force transfer with the effective load on the test
specimen being 10 times the magnitude of the actual applied weights due to the size
difference in the radius of the axle and wheel (ratio of approximately 1:10). The
corresponding axial deformation is recorded throughout the experiment by measuring the
displacement of the pulling rod in the loading direction via a pair of linear variable
displacement transducer (LVDT) sensors attached on the rod away from the heat affected
region of the rig.
The new experimental set-up allows for greater control of the applied force with the
specimen being held under a constant tensile load throughout the whole test. It also
enables strain related data to be extracted and for the plastic deformation upon hot loading
and the pure creep strain during an experiment to be distinguished. The two LVDTs also
enable for both axiality and precise strain measurements. Therefore, the creep response
of a specimen can be accurately identified during the test. In addition, the loading frame
can readily be used for different environment-specific choices (i.e. air, inert and
carburising environments).
5.3 Material selection
Considering the fairly aggressive (AGR type) testing environment, a careful selection of
sustainable materials to use for the high temperature components was first identified.
Most parts directly exposed to the corrosive environment were manufactured from
Inconel® Alloy 718, a nickel-base superalloy with superior corrosion resistance and high
strength. An exception was the guidance tube which was made of Type 316L stainless
steel. The rest of the assembly was made from either Type 316H stainless steel or high
grade aluminium. Before the commencement of the experiment, for enhanced protection,
those parts exposed to the carburising environment were subjected to a short-term (36
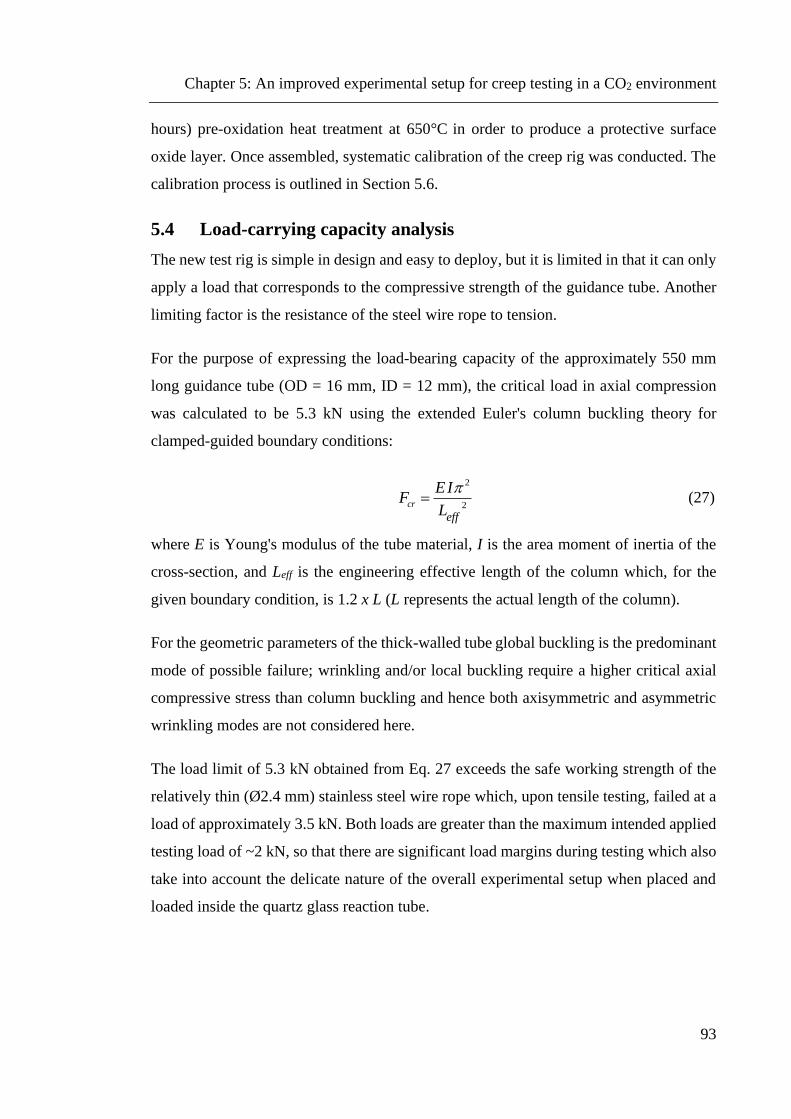
Chapter 5: An improved experimental setup for creep testing in a CO2 environment
93
hours) pre-oxidation heat treatment at 650°C in order to produce a protective surface
oxide layer. Once assembled, systematic calibration of the creep rig was conducted. The
calibration process is outlined in Section 5.6.
5.4 Load-carrying capacity analysis
The new test rig is simple in design and easy to deploy, but it is limited in that it can only
apply a load that corresponds to the compressive strength of the guidance tube. Another
limiting factor is the resistance of the steel wire rope to tension.
For the purpose of expressing the load-bearing capacity of the approximately 550 mm
long guidance tube (OD = 16 mm, ID = 12 mm), the critical load in axial compression
was calculated to be 5.3 kN using the extended Euler's column buckling theory for
clamped-guided boundary conditions:
2
2cr
eff
EIF
L
= (27)
where E is Young's modulus of the tube material, I is the area moment of inertia of the
cross-section, and Leff is the engineering effective length of the column which, for the
given boundary condition, is 1.2 x L (L represents the actual length of the column).
For the geometric parameters of the thick-walled tube global buckling is the predominant
mode of possible failure; wrinkling and/or local buckling require a higher critical axial
compressive stress than column buckling and hence both axisymmetric and asymmetric
wrinkling modes are not considered here.
The load limit of 5.3 kN obtained from Eq. 27 exceeds the safe working strength of the
relatively thin (Ø2.4 mm) stainless steel wire rope which, upon tensile testing, failed at a
load of approximately 3.5 kN. Both loads are greater than the maximum intended applied
testing load of ~2 kN, so that there are significant load margins during testing which also
take into account the delicate nature of the overall experimental setup when placed and
loaded inside the quartz glass reaction tube.
Chapter 5: An improved experimental setup for creep testing in a CO2 environment
94
5.5 Mechanical limitations
The creep test rig has been designed and developed specifically for miniature dog-bone
tensile specimens with a maximum overall length of 80 mm and ~15 mm2 cross sectional
area tested at typical stress levels up to 350 MPa. The length of a specimen is limited by
the maximum distance allowed between the pinned grips of the testing system so that a
sample can elongate at least 10 mm. This margin is well beyond the ~2 mm displacement
expected for the proposed oxidation study under the initial load conditions and under the
increasing stress as the sample size decreases. Other sample geometries such as
rectangular plates or cylindrical specimens can also be considered for testing subject to
respecting the given geometric constraints.
Another restraint in the degree of travel of the pull rod in the loading direction comes
from the wire rope section connected to the shaft (see the layout in Figure 43) which,
upon loading, can only bend two-thirds of a full turn around the axle before colliding with
the unwrapped strand. This limits the pull rod to a maximum displacement of ~40 mm
considering a specimen with a total length of ~49 mm (as in the present study). This extent
again is still considerably greater than that due to the anticipated total inelastic strain of a
test specimen and can decrease with increasing sample geometry.
5.6 Calibration of test equipment
Calibration of the creep frame was conducted at room temperature (22 ± 1°C) by means
of a cold-worked 316L stainless steel dog-bone sample with one strain gauge attached on
each face of the gauge section. The sample material had a known yield strength of
705 MPa at RT [99]. As a first step, the calibration specimen was mounted in an
Instron® 3344 universal testing machine equipped with a 2 kN load cell, strained in
tension within the elastic limit only up to the highest applicable load of 2 kN (stress
equivalent of ~445 MPa), and subsequently unloaded at the same strain rate of 0.014%/s
to obtain stress equivalents in 1 N load increments. In addition to the strain gauges, for
accurate strain measurements, the gauge length extension was also recorded by a digital
extensometer mounted on the side of the specimen. The strain measurements from the
strain gauges were then synchronised with the recordings of the extensometer and the
corresponding stress levels identified, and registered into a spreadsheet for further
calibration procedures. An image of the calibration set-up is shown in Figure 44.

Chapter 5: An improved experimental setup for creep testing in a CO2 environment
95
Figure 44 Equipment and instrumentation used for the calibration procedure.
In the second stage of the calibration process, the sample was mounted in the creep frame
using the exact same pin and clevis configuration as for the tensile machine, and as per
the requirements of the test method. Once installed, the specimen was prestrained by
attaching the weight hanger to the free end of the wire rope and then gradually loaded by
adding the calibrated (Newton) weights in sequence. In each step, the applied effective
stress on the sample was individually derived for each test weight (including the hanger)
by correlating the exact mass of the weights with the in-situ strain recordings displayed
on the strain gauge data logger and their corresponding stress data from the pre-existing
spreadsheet. In addition, the elongation of the sample was simultaneously monitored by
the two LVDTs mounted on the pull rod so that the initial slack and the compliance of
the system could be calculated and later accounted for in the data processing. The above
procedure was repeated 10 times and the final stress equivalents of the various dead
weights were then determined from the mean average of the load data obtained on each

Chapter 5: An improved experimental setup for creep testing in a CO2 environment
96
occasion. The difference between the mean and any one of the 10 measurements was less
than 1%.
As reported in this section, the new creep test rig was enhanced with the capability of
precisely measuring strain and strain rate throughout the entire test under constant applied
loads. The calibration method adopted provides the means to relate any applied weight to
a corresponsive stress level and any measured LVDT output voltage to a corresponding
displacement of the pull rod, hence elongation of a test specimen. Although the creep
frame is robust in its design, re-calibration must be carried out at appropriate intervals
(say after every third run) so that confidence in the traceability chain can be maintained.

Chapter 6: Uniaxial creep deformation of Type 316H stainless steel in air at 550°C
97
6. Uniaxial creep deformation of Type 316H stainless steel in
air at 550°C
In this chapter the uniaxial creep studies carried out in air at 550°C at atmospheric
pressure are reported. The effects of stress and different preconditioning treatments
(thermal ageing and carburisation) on the creep response and crack initiation behaviour
of Type 316H stainless steel material have also been investigated.
6.1 Overview
A significant number of stainless steel components within the boilers of the UK AGR
plants are subjected to oxidation, carburisation and other changes in the underlying
microstructure of the material during operation. This results from exposure to the
pressurised CO2-based primary circuit coolant at temperatures from about 500 to 650°C.
To further develop the accuracy of structural integrity lifetime predictions and support
safe plant operation, EDF Energy initiated an environmental project known externally as
the Environmental Impact on the Structural Integrity of Nuclear Components
(ENVISINC) project, part of the High Temperature Behaviour of Austenitic Stainless
Steels (HTBASS) programme of work. It is believed that there is a synergistic relationship
between the pressurised CO2 coolant environment and creep-fatigue initiation and
cracking [14]. Devising and implementing an evaluation methodology to account for
oxidation and carburisation to enable conservative lifetime assessments is essential to
manage plant lifetime. Therefore, the development of a new and fundamental
understanding of environmentally assisted degradation and failure mechanisms is
required.
This part considers a number of substantial creep testing activities conducted at The
University of Manchester within the ENVISINC project in support of the current
understandings of the environmentally induced microstructural and mechanical
degradation of 316H material in order to evaluate the assessment methodology
established by EDF Energy and its partners. The outcomes are also expected to provide
useful inputs for simplified methods for including the effects of the CO2 environment on
creep damage assessments as well as benchmark experimental tests to support and
provide validation for numerical modelling and simulation in this research area.

Chapter 6: Uniaxial creep deformation of Type 316H stainless steel in air at 550°C
98
6.2 Experimental details
6.2.1 Material and sample preparation
Test specimens were extracted by Amec Foster Wheeler from sections of an ex-service
(non-active) header material of 316H stainless steel with an as-received (AR) micro-
structural condition. Some specimens were further subjected to either of two types of
preconditioning treatment: (i) thermal ageing at 600°C for 3000 hours; (ii) carburisation
at 600°C for 3000 hours in a simulated AGR coolant gas at a pressure of ~40 bar (see
Chapter 3 for specifications of preconditioning treatments). The aim of the thermal ageing
treatment is to provide baseline creep properties for direct comparison with the pre-
carburised microstructural condition. The hypothesis here is that the carburisation
treatment may further introduce some microstructural changes above those due to the
thermal ageing effect.
The specimen geometry agreed for creep testing (based on standard Amec Foster Wheeler
specimen design and extensometer design identical to that at The University of
Manchester) is presented in Appendix-A1 and its essential features are: ~7 mm gauge
diameter, ~40 mm parallel gauge length and M12 threads. The specimens to be used for
pre-carburisation (PC) required further grinding/polishing steps in order to remove the
plastic working at the surface due to machining and prevent the rapid formation of the
protective chromia scale, which significantly reduces, or halts, the diffusion of carbon
into the 316H surface. This polishing thus greatly increases the rate at which carburisation
of the material happens. The polishing steps carried out in order to prepare a specimen
for carburisation are summarised in Table 4. All specimens were ground to 2400/2500
grit finish prior to polishing. Once available these specimens were then placed in an
autoclave at Amec Foster Wheeler and exposed to a simulated AGR coolant gas as
described in Section 3.2.
Table 4 Polishing steps required to prepare a creep specimen for carburisation [89].
STAGE Polishing suspension Polishing time per specimen
1 9 μm diamond suspension 5 minutes
2 6 μm diamond suspension 5 minutes
3 1 μm diamond suspension 5 minutes
4 OPS suspension 10 minutes

Chapter 6: Uniaxial creep deformation of Type 316H stainless steel in air at 550°C
99
All creep specimens for The University of Manchester have been provided by Amec
Foster Wheeler and have been allocated a unique number designation, of the type
‘XXX001’, to comply with Amec Foster Wheeler procedures. The specimen number is
intended to be used on all test records produced by the partners undertaking testing in
ENVISINC, to provide traceability for the material condition.
6.2.2 Standard uniaxial creep testing rig
A schematic representation of the rig used at The University of Manchester for uniaxial
creep testing in air is shown in Figure 45. The standard level-arm creep machine consists
of a loading hanger, dead-weights, fixture devices (i.e. grips and pull rods) and an electric
furnace for tests up to 700°C.
Figure 45 Standard uniaxial creep rig (left) and extensometer design (right).

Chapter 6: Uniaxial creep deformation of Type 316H stainless steel in air at 550°C
100
A work instruction has been issued by Amec Foster Wheeler [110] to each of the
ENVISINC partners to try and ensure a consistent approach to creep testing and data
recording. Creep testing was carried out in accordance with BS EN ISO 204:2009 [111].
Extensometry was calibrated in accordance with BS EN ISO 9513:2012 [112]. The
machine load calibration was carried out by a UKAS accredited body to the appropriate
standard. In accordance with BS EN ISO 7500-2:2006 [113], creep machine load
calibration verification was undertaken. The test load was made up of a number of
uniquely identified creep weights calibrated in accordance with BS EN ISO 7500-2:2006
[113]. During the tests strain was measured using extensometry of the type shown in
Figure 45 and LVDTs. Three calibrated Type N thermocouples were used to monitor the
temperature of each test specimen. Loading information, thermocouple calibration
details, allowable calibration periods and permissible alarm limits for the thermocouples
and data logging system were recorded in a test file envelope for each specimen along
with check lists containing all relevant details associated with each test sample. All tests
were performed in laboratory air at a test temperature of 550°C at atmospheric pressure
by using a variety of loads to give a range of stresses.
6.2.3 Operating procedure, start-up and shut-down
The method used for setting up and carrying out creep tests was as follows:
1. The specimen dimensions were determined with a calibrated shadowgraph, using
the lowest of three measured values along the parallel gauge length as the specimen
diameter for the test.
2. Prior to setting up a test on a machine, the rig was visually examined to ensure
that it was in good working order, and that there was no damage to any integral parts.
3. Once the pre-test preparations had been completed, the specimen was cleaned
with acetone to remove any surface contamination. Clean gloves were then worn
whenever handling the specimen to avoid re-contamination.
4. The sample was carefully inserted into the straining bars, minimising any torsional
or axial stresses, ensuring the specimen was not twisted or damaged in the process.
5. Three thermocouples were tied at the top, middle and bottom of the gauge length
of the test sample using suitable steel wire. The temperature of the sample was recorded
during the heat up process as well as during the test and cooling down of the system. The

Chapter 6: Uniaxial creep deformation of Type 316H stainless steel in air at 550°C
101
temperature variation along the gage length of the sample was within ±3°C during each
test.
6. The extensometer was carefully placed on the specimen through the use of the
pips outside the parallel gauge, ensuring that the operation of the extensometer was not
affected by the prepositioned thermocouples. The two LVDTs were positioned in the
holders on the extensometer frame and set to a reading within the calibration range of the
extensometer.
7. The system was checked for axiality by performing a cold load within the elastic
limit of the test material. This was achieved by adding weights to the pan and taking
readings from the transducers. Prior knowledge of the modulus provides a check of
material and equipment behaviour during the cold load sequence; as such, a minimum of
6 points along the modulus line were recorded with the Young’s modulus value for the
material confirmed to be satisfactory.
8. The top and bottom of the furnace was carefully lagged with suitable lagging
material and the furnace was switched on. A small pre-load of 10% of the test force was
applied during heat up to help maintain the loading train alignment.
9. The sample was heated up to stable 550°C and the calculated test load was then
applied manually by the addition of weights to the loading pan. Utmost care was taken
during the hot loading procedure to minimise all shock loads and prevent undesirable
oscillations. This procedure usually took a total of 8 hours.
10. Upon finishing the hot loading sequence the test was considered to have started.
Strain/time readings were logged at regular intervals during the entire test period.
11. When a specimen had fractured the furnace was switched off and the weights were
removed from the loading pan. Where testing interruption was required, between 10-20%
of the test load was removed prior to switching off the furnace. The remainder of the load
was removed after the cooling down of the test specimen to ambient temperature. The
sample was then carefully removed from the rig for examination and the data collected
and processed for analysis and interpretation.
Chapter 6: Uniaxial creep deformation of Type 316H stainless steel in air at 550°C
102
6.2.4 Creep testing on TA and PC material in air at 550°C
Two conventional creep specimens extracted from an ex-service superheater header
(HRA 1C2/3, 316H, Cast 55915) were experimentally investigated. Samples ACS46 and
ACS36, the former of thermally aged (TA) and the latter of pre-carburised (PC) material,
were tested under constant engineering stresses of 320 MPa and 280 MPa, respectively.
Both specimens were tested until the fracture strain and thus the creep ductility could be
derived from the tests.
6.2.5 Interrupted creep testing on PC material in air at 550°C
To determine the creep strain at which surface cracking initiates in a carburised material,
three interrupted creep tests were carried out on pre-carburised (PC) creep specimens,
namely ACS11, ACS17 and ACS29 at 550°C in laboratory air under an applied stress of
240 MPa. It was expected that the results of these tests would provide valuable data to
show crack depth and distribution (in both size and density) as functions of creep strain.
The plan was to stop one test at 0.5% creep strain with the assumption that subsequent
tests would be stopped at 1% and 2% creep strain. To identify the crack size, non-
destructive X-ray computed tomography analysis was proposed so that a specimen could
be put back on test if needed. However, this proved to be an unreliable and labour-
intensive method for identifying true crack depths at the micron scale, thus all three
specimens were removed at once and sectioned for microstructural analysis. During the
load calculation, a reduction of 0.2 mm of the outer diameter (to isolate the oxide layer
formed in the course of the preconditioning procedure) for all three samples was omitted,
so the applied load level was higher than intended, and thus equivalent to a stress of ~254
MPa. However, the critical information of crack size versus creep strain was still obtained
and therefore the tests were still of value.

Chapter 6: Uniaxial creep deformation of Type 316H stainless steel in air at 550°C
103
6.2.6 List of creep tests carried out
Table 5 provides a summary of the different testing conditions and material states for the
load-controlled uniaxial creep tests. The intended duration of testing is also reported.
The creep stress levels were determined based on the results obtained from a series of
laboratory validation tests initially undertaken by each of the ENVISINC partners
involved in the programme at a load equivalent to a stress of 320 MPa, using as-received
(AR) material. Thus further test stresses were specified at a variety of lower stresses, with
the intention of accumulating data within the programme timeframe to complement
existing data available to EDF Energy. The selected stresses were also designated to be
comparable to those used for previous EDF Energy creep tests on similar materials. For
pre-carburised (PC) specimens it has been assumed that the oxide bears no load, and
therefore the stresses have been calculated as such.
It was agreed that all tests would be carried out at 550°C in order to remove temperature
as a test variable and to allow for cross-checking between laboratories. This temperature
is also known to be representative of plant conditions associated with the observed
hardened surfaces in plant materials [89]. The creep test results are summarised in the
following sections and discussed in relation to the overall ENVISINC programme and
goals where possible.
Table 5 Summary of creep tests carried out in air at 550°C at atmospheric pressure.
Test
#
Specimen
ID
Material
condition
Eng.
stress,
MPa
Duration
of test
Testing
environment
Temp.
°C
1 ACS36 PC 280 To rupture
Laboratory
air 550
2 ACS46 TA 320
3 ACS11
PC ~254 Interrupted 4 ACS17
5 ACS29
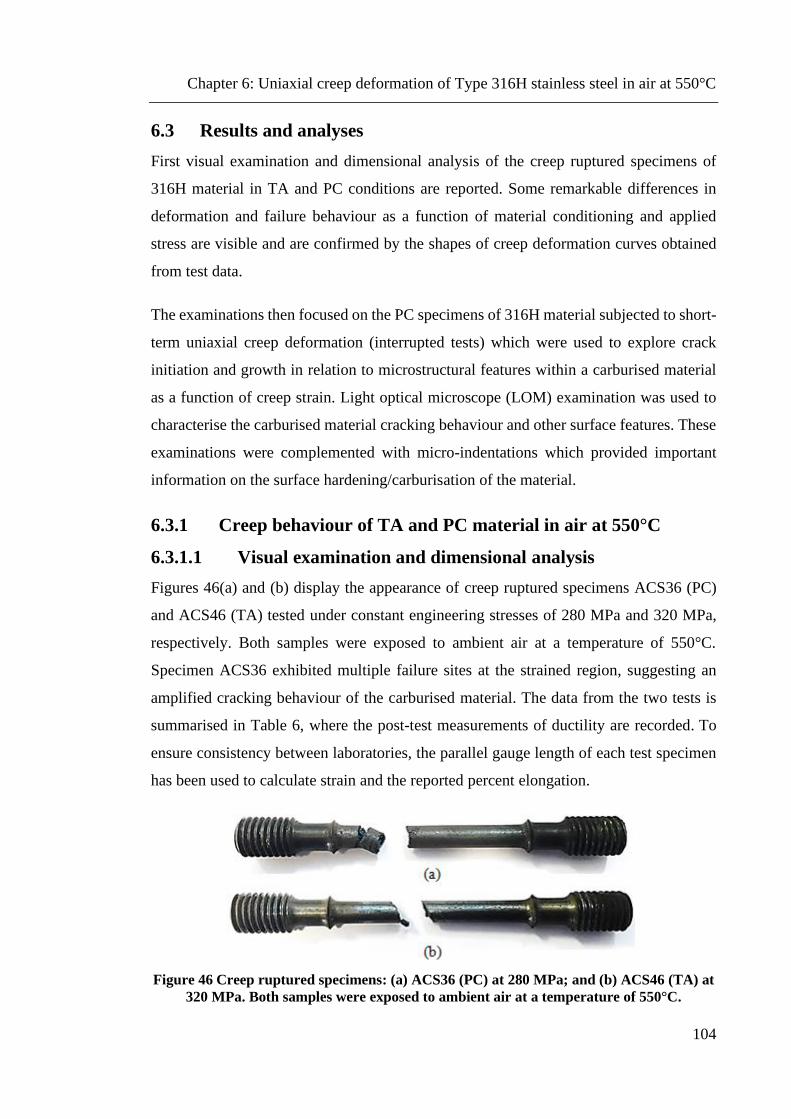
Chapter 6: Uniaxial creep deformation of Type 316H stainless steel in air at 550°C
104
6.3 Results and analyses
First visual examination and dimensional analysis of the creep ruptured specimens of
316H material in TA and PC conditions are reported. Some remarkable differences in
deformation and failure behaviour as a function of material conditioning and applied
stress are visible and are confirmed by the shapes of creep deformation curves obtained
from test data.
The examinations then focused on the PC specimens of 316H material subjected to short-
term uniaxial creep deformation (interrupted tests) which were used to explore crack
initiation and growth in relation to microstructural features within a carburised material
as a function of creep strain. Light optical microscope (LOM) examination was used to
characterise the carburised material cracking behaviour and other surface features. These
examinations were complemented with micro-indentations which provided important
information on the surface hardening/carburisation of the material.
6.3.1 Creep behaviour of TA and PC material in air at 550°C
6.3.1.1 Visual examination and dimensional analysis
Figures 46(a) and (b) display the appearance of creep ruptured specimens ACS36 (PC)
and ACS46 (TA) tested under constant engineering stresses of 280 MPa and 320 MPa,
respectively. Both samples were exposed to ambient air at a temperature of 550°C.
Specimen ACS36 exhibited multiple failure sites at the strained region, suggesting an
amplified cracking behaviour of the carburised material. The data from the two tests is
summarised in Table 6, where the post-test measurements of ductility are recorded. To
ensure consistency between laboratories, the parallel gauge length of each test specimen
has been used to calculate strain and the reported percent elongation.
Figure 46 Creep ruptured specimens: (a) ACS36 (PC) at 280 MPa; and (b) ACS46 (TA) at
320 MPa. Both samples were exposed to ambient air at a temperature of 550°C.

Chapter 6: Uniaxial creep deformation of Type 316H stainless steel in air at 550°C
105
Table 6 Summary of the creep data obtained for specimens ACS36 (PC) and ACS46 (TA).
Both tests performed at 550°C in air at atmospheric pressure.
Specimen
ID
Material
condition,
HAR 1C2/3
Eng.
stress,
MPa
Min. strain
rate,
%/h
Rupture
life,
hours
Reduction
in area,
%
Elongation
to failure,
%
ACS36 PC 280 2.93x10⁻⁴ 6854.5 12.33 7.42
ACS46 TA 320 8.28x10⁻⁴ 3493.3 14.03 9.29
6.3.1.2 Load up behaviour
The hot loading stress-strain curves for the 280 MPa and 320 MPa tests of pre-carburised
ACS36 (PC) and thermally aged ACS46 (TA) creep specimens, respectively, are shown
in Figure 47. Although the pre-carburised ACS36 specimen was tested at a lower nominal
stress than the thermally aged ACS46 specimen, up to 280 MPa the stress-strain
behaviour of specimen ACS36 is different from that of specimen ACS46. The pre-
carburised specimen had a smaller plastic strain during hot loading to 280 MPa,
approximately three times less than the thermally aged specimen. Consequently, for a
given engineering stress, the pre-carburised specimen was creep tested at a lower true
stress than the thermally aged specimen.
Figure 47 Hot-load curves obtained for ACS36 (PC) and ACS46 (TA) at 550°C in air.

Chapter 6: Uniaxial creep deformation of Type 316H stainless steel in air at 550°C
106
In Figure 48 the true stress versus true strain curves obtained during the loading stage of
specimens ACS36 (PC) and ACS46 (TA) are compared to hot loading data from other
tests conducted at The University of Manchester (UOM) and Amec Foster Wheeler
(AFW) at relevant stresses (ranging from 280 MPa to 320 MPa) on creep specimens
extracted from the same ex-service header material (HRA 1C2/3) in as-received (AR),
thermally aged (TA) and pre-carburised (PC) microstructural conditions. In addition, a
low stress (240 MPa) Amec Foster Wheeler creep test data for as-received specimen
ACS02 was also considered for comparative analysis.
Table 7 summarises the test conditions for each specimen (all at 550 ºC) and the
preconditioning treatment given, whilst Table 8 gives a summary of derived parameters
for the Ramberg-Osgood relationship, which could be used to describe the hot loading
behaviour of all three microstructural conditioned materials. The data from all of the creep
tests are summarised in Table 9, and the post-test measurements of ductility are recorded
(where available) in Table 10, along with the minimum creep strain rates. Unfortunately,
not all of the post-test elongation data are available as some specimens were hot mounted
for SEM examination following test completion and the elongation was not recorded. A
detailed overview of the results obtained from the creep tests conducted at The University
of Manchester, within the ENVISINC programme, is presented in Appendix-A2 and A3.
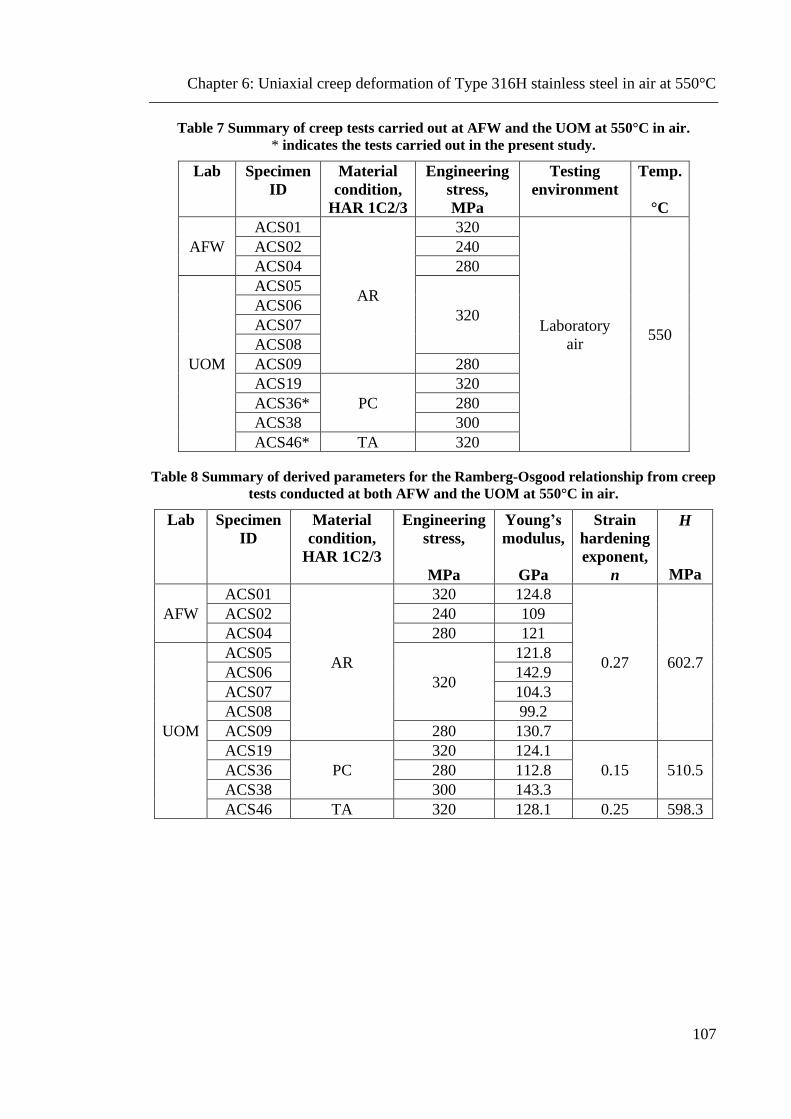
Chapter 6: Uniaxial creep deformation of Type 316H stainless steel in air at 550°C
107
Table 7 Summary of creep tests carried out at AFW and the UOM at 550°C in air.
* indicates the tests carried out in the present study.
Lab Specimen
ID
Material
condition,
HAR 1C2/3
Engineering
stress,
MPa
Testing
environment
Temp.
°C
AFW
ACS01
AR
320
Laboratory
air 550
ACS02 240
ACS04 280
UOM
ACS05
320 ACS06
ACS07
ACS08
ACS09 280
ACS19
PC
320
ACS36* 280
ACS38 300
ACS46* TA 320
Table 8 Summary of derived parameters for the Ramberg-Osgood relationship from creep
tests conducted at both AFW and the UOM at 550°C in air.
Lab Specimen
ID
Material
condition,
HAR 1C2/3
Engineering
stress,
MPa
Young’s
modulus,
GPa
Strain
hardening
exponent,
n
H
MPa
AFW
ACS01
AR
320 124.8
0.27 602.7
ACS02 240 109
ACS04 280 121
UOM
ACS05
320
121.8
ACS06 142.9
ACS07 104.3
ACS08 99.2
ACS09 280 130.7
ACS19
PC
320 124.1
0.15 510.5 ACS36 280 112.8
ACS38 300 143.3
ACS46 TA 320 128.1 0.25 598.3

Chapter 6: Uniaxial creep deformation of Type 316H stainless steel in air at 550°C
108
Table 9 Summary of creep test data for specimens from HAR 1C2/3 header material.
Interrupted creep tests are indicated with *; limited creep data availability is indicated
with the symbol ☼. All creep tests were undertaken at a temperature of 550ºC in air.
Specimen
ID
Material
condition,
HAR 1C2/3
Engineering
stress,
MPa
True
stress,
MPa
Total inelastic
true strain,
%
Failure /
creep
time,
hours Plastic Creep
ACS01
AR
320 355.2 10.5 2.8 1409.3
ACS02* 240 248.6 3.5 1.0 6330.4*
ACS04☼ 280 298.3 6.2 1.8☼ 3600.2☼
ACS05
320
353.8 10.0 1.5 1094.3
ACS06 347.4 8.2 1.2 2310.6
ACS07 347.1 8.2 1.3 2704.5
ACS08 346.2 7.9 3.4 2046.6
ACS09* 280 301.7 7.4 1.1 3501.9*
ACS19
PC
320 338.2 5.5 4.1 637.2
ACS36 280 284.4 1.6 3.9 6854.5
ACS38 300 309.7 3.2 4.2 2176.1
ACS46 TA 320 346.2 8.0 4.4 3493.3
Table 10 Summary of the creep data obtained for the ENVISINC project. Interrupted (not
ruptured) creep tests are indicated with *; unavailable post-test data are indicated with
the dash sign -. All tests performed at 550ºC in air. Both reduction in area and elongation
to failure are based on pre- and post-test measurements of the parallel gauge of each test
specimen. The ductility of the AFW tests (ACS01 to ACS04) has been adopted from [89].
Specimen
ID
Material
condition,
HAR 1C2/3
Eng.
stress,
MPa
Min.
strain
rate,
%/h
Rupture
life,
hours
Reduction
in area,
%
Elongation
to failure,
%
ACS01
AR
320 1.32x10⁻³ 1409.3 13.55 18.14
ACS02* 240 7.88x10⁻⁵ 6330.4* Test interrupted*
ACS04 280 3.27x10⁻⁴ 6077 10.16 6.33
ACS05
320
8.40x10⁻⁴ 1094.3 14.08 -
ACS06 2.76x10⁻⁴ 2310.6 17.56 -
ACS07 2.52x10⁻⁴ 2704.5 8.96 -
ACS08 9.47x10⁻⁴ 2046.6 10.07 -
ACS09* 280 2.48x10⁻⁴ 3501.9* Test interrupted*
ACS19
PC
320 3.19x10⁻³ 637.2 10.73 -
ACS36 280 2.93x10⁻⁴ 6854.5 12.33 7.42
ACS38 300 1.16x10⁻³ 2176.1 11.99 -
ACS46 TA 320 8.28x10⁻⁴ 3493.3 14.03 9.29

Chapter 6: Uniaxial creep deformation of Type 316H stainless steel in air at 550°C
109
Figure 48 Comparison of Manchester test data with Amec FW test data in terms of the
loading stress-strain curves from creep tests conducted at 550°C in air. The graph also
shows an anomaly in the strain measurements for specimen ACS08 during the final stages
of hot loading; the arrow indicates the predicted strain for the maximum applied stress.
Figure 48 shows that for the as-received (AR) header material the loading stress-strain
curves from the Amec Foster Wheeler tests are in good agreement with those obtained
from the Manchester tests, apart from an aberration in the strain measurements for sample
ACS08 identified and highlighted on the graph. Specifically, the measured strain did not
change and remained at ~8% despite the progressive loading to an engineering stress of
320 MPa (true stress of 346.2 MPa), thus suggesting some anomalies with the strain
measurements capability. In fact, a total true strain of about 10% can be predicted from
extrapolation (see arrow in Figure 48). Also, specimens ACS06 and ACS07 showed
somewhat lower strains than specimen ACS05 and the test at Amec Foster Wheeler
(sample ACS01). The reason for these differences is not clear; Amec Foster Wheeler staff
were involved in the commencement of some of the Manchester tests and no
discrepancies were observed compared with the equivalent procedures followed at Amec
Foster Wheeler. It is also interesting to note that under the same applied stress of 320 MPa
the plastic strain for the thermally aged (TA) specimen ACS46 is similar to that for AR

Chapter 6: Uniaxial creep deformation of Type 316H stainless steel in air at 550°C
110
specimens ACS06 and ACS07. The pre-carburised (PC) samples ACS19, ACS36 and
ACS38 however exhibit decreased strain and more rapid increases in stresses during the
hot loading procedure when compared to the as-received (AR) samples. This is thought
to be associated with the increased proof strength of the hardened carburised layer.
6.3.1.3 Strain hardening behaviour
The analyses of both the elastic strain,e , and plastic strain,
p , are described by the
Ramberg-Osgood relationship:
1
n
e p e pE H
+
= + = +
(28)
where e and p are the elastic and plastic strain respectively, E is the Young’s modulus,
n is the strain hardening exponent and H is a constant. Using the hot loading results shown
in Figure 48, parameters for the Ramberg-Osgood relationship, Eq. 28, were derived to
describe the strain hardening behaviour of all three microstructural conditions. First, the
Young’s modulus (at 550ºC) for each microstructural condition was derived for each
specimen. There is no systematic difference of the derived Young’s modulus across all
three microstructural conditions, see Table 8. The derived Young’s modulus of each
specimen was used to calculate the elastic strain and this calculated value was then
deducted from the measured total true strain so that a plastic true strain can be obtained.
The calculated plastic true strain was then used to fit the second part of the Ramberg-
Osgood equation, using a linear least squares regression method. The true stress versus
true strain curves in their logarithmic scales are shown in Figure 49 for all three
microstructural conditions: as-received (AR), thermally aged (TA) and pre-carburised
(PC). Linear relationships can be obtained when the stress levels are greater than about
220 MPa, in particular for the thermally aged and as-received HAR 1C2/3 materials. The
corresponding linear regression analyses and their 95% confidence bands for each
microstructural condition are shown in Figures 50(a) to (c). The values of strain hardening
exponent n and normalising stress H, Eq. 28, for each microstructural condition are
summarised in Table 8. It is clear that the pre-carburised material had a smaller strain
hardening n, compared with the other two microstructural conditions. In addition, there
is no difference between the strain hardening exponent n in both the thermally aged and

Chapter 6: Uniaxial creep deformation of Type 316H stainless steel in air at 550°C
111
as-received microstructural conditions. Figure 51 shows the plastic true strain versus true
stress results in a log-log scale together with their linear regression analyses for both the
as-received (AR) and pre-carburised (PC) header (HAR 1C2/3) material.
Figure 49 Log-log plot of the applied true stress versus plastic true strain obtained by
loading specimens at 550ºC in air. All specimens have been summarised in Table 8.

Chapter 6: Uniaxial creep deformation of Type 316H stainless steel in air at 550°C
112
(a)
(b)
(c)
Figure 50 Linear regression analyses of the hot loading data and their 95% confidence
bands: (a) as-received (AR); (b) pre-carburised (PC); and (c) thermally aged (TA)
microstructural conditions.

Chapter 6: Uniaxial creep deformation of Type 316H stainless steel in air at 550°C
113
Figure 51 Log-log plot of the plastic true strain versus true stress for as-received (AR) and
pre-carburised (PC) microstructural conditions, together with their linear regression
analyses.

Chapter 6: Uniaxial creep deformation of Type 316H stainless steel in air at 550°C
114
6.3.1.4 Uniaxial creep properties
The creep deformation curves for the above tests are shown in Figure 52. Due to the
prolonged time to failure of the lower stress initial tests it was decided to halt two of the
tests on as-received (AR) material, samples ACS02 (240 MPa) and ACS09 (280 MPa),
prior to failure. Both of these tests appeared to be within a constant deformation rate (or
secondary creep region) at the time of the interruption. Also, the Amec Foster Wheeler
creep test data of as-received (AR) specimen ACS04 (280 MPa) is incomplete; however,
from the data available at the time of writing (even if limited), this test has also appeared
to be well within the secondary creep stage (see Figure 52), thus the minimum creep strain
rate could be derived.
Figure 52 Comparison of creep curves obtained for specimens ACS36 (PC) and ACS46
(TA) with results from selected Amec FW tests and other Manchester tests conducted on
AR and PC 316H material at 550°C in air at stresses ranging from 240 MPa to 320 MPa.
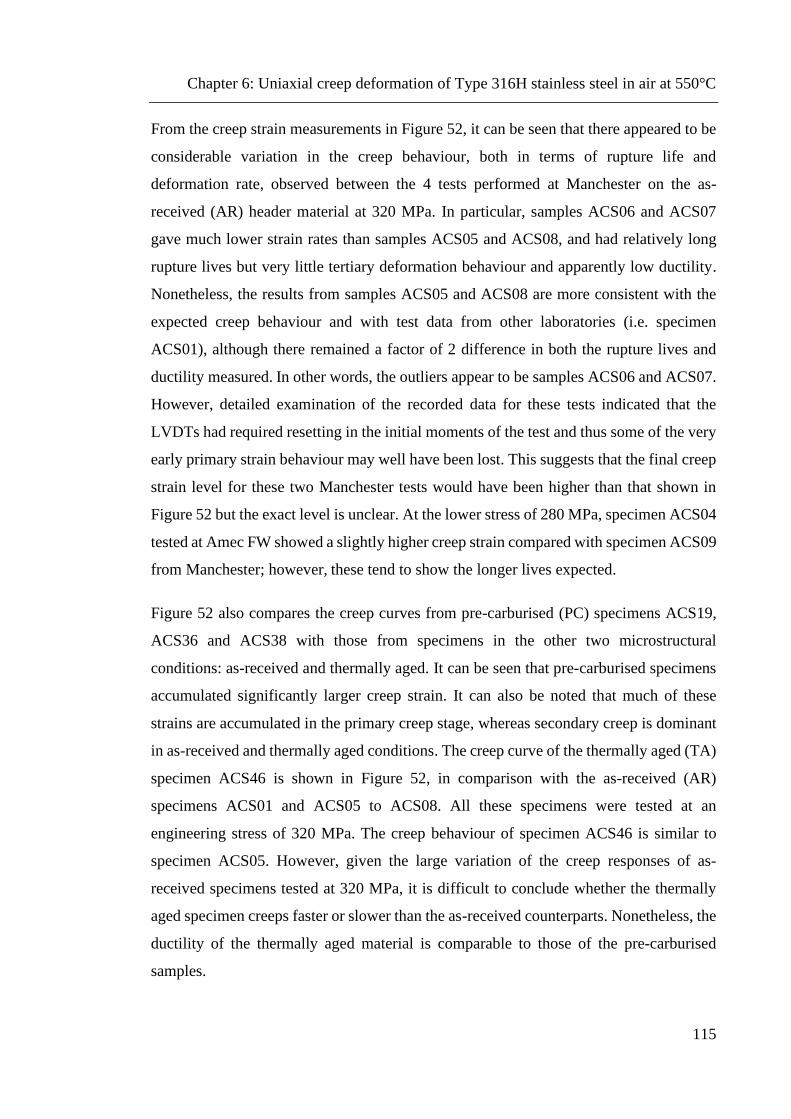
Chapter 6: Uniaxial creep deformation of Type 316H stainless steel in air at 550°C
115
From the creep strain measurements in Figure 52, it can be seen that there appeared to be
considerable variation in the creep behaviour, both in terms of rupture life and
deformation rate, observed between the 4 tests performed at Manchester on the as-
received (AR) header material at 320 MPa. In particular, samples ACS06 and ACS07
gave much lower strain rates than samples ACS05 and ACS08, and had relatively long
rupture lives but very little tertiary deformation behaviour and apparently low ductility.
Nonetheless, the results from samples ACS05 and ACS08 are more consistent with the
expected creep behaviour and with test data from other laboratories (i.e. specimen
ACS01), although there remained a factor of 2 difference in both the rupture lives and
ductility measured. In other words, the outliers appear to be samples ACS06 and ACS07.
However, detailed examination of the recorded data for these tests indicated that the
LVDTs had required resetting in the initial moments of the test and thus some of the very
early primary strain behaviour may well have been lost. This suggests that the final creep
strain level for these two Manchester tests would have been higher than that shown in
Figure 52 but the exact level is unclear. At the lower stress of 280 MPa, specimen ACS04
tested at Amec FW showed a slightly higher creep strain compared with specimen ACS09
from Manchester; however, these tend to show the longer lives expected.
Figure 52 also compares the creep curves from pre-carburised (PC) specimens ACS19,
ACS36 and ACS38 with those from specimens in the other two microstructural
conditions: as-received and thermally aged. It can be seen that pre-carburised specimens
accumulated significantly larger creep strain. It can also be noted that much of these
strains are accumulated in the primary creep stage, whereas secondary creep is dominant
in as-received and thermally aged conditions. The creep curve of the thermally aged (TA)
specimen ACS46 is shown in Figure 52, in comparison with the as-received (AR)
specimens ACS01 and ACS05 to ACS08. All these specimens were tested at an
engineering stress of 320 MPa. The creep behaviour of specimen ACS46 is similar to
specimen ACS05. However, given the large variation of the creep responses of as-
received specimens tested at 320 MPa, it is difficult to conclude whether the thermally
aged specimen creeps faster or slower than the as-received counterparts. Nonetheless, the
ductility of the thermally aged material is comparable to those of the pre-carburised
samples.
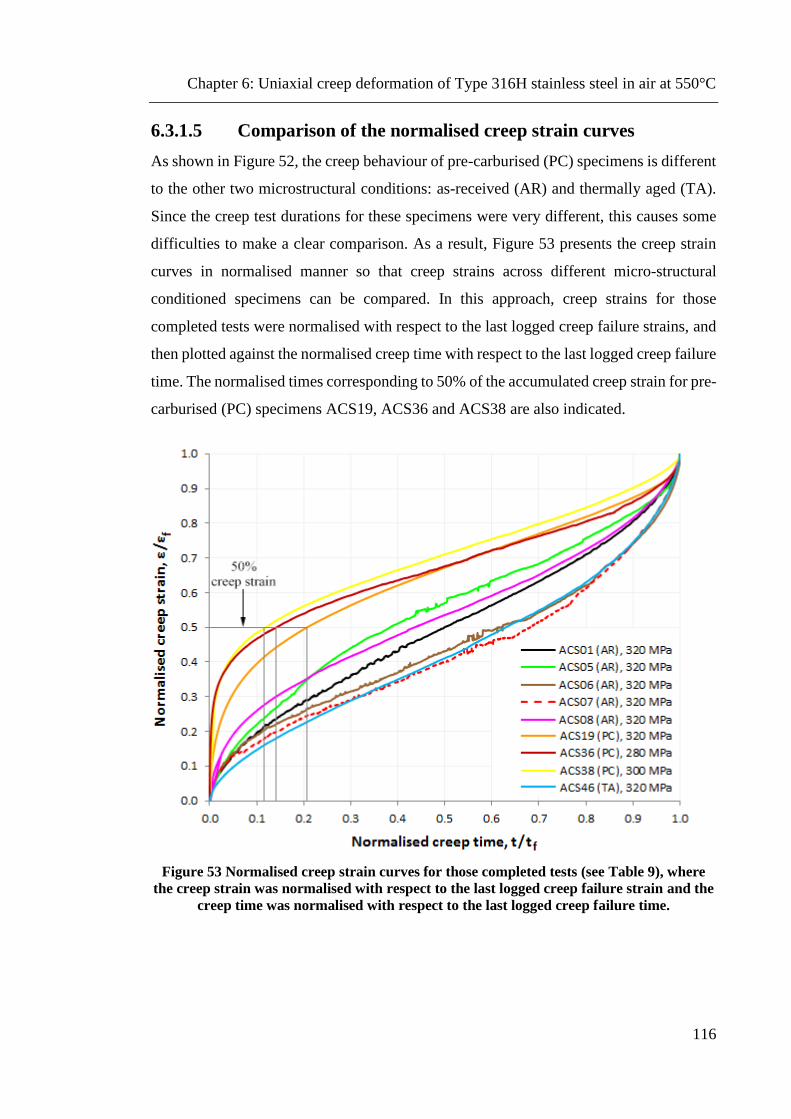
Chapter 6: Uniaxial creep deformation of Type 316H stainless steel in air at 550°C
116
6.3.1.5 Comparison of the normalised creep strain curves
As shown in Figure 52, the creep behaviour of pre-carburised (PC) specimens is different
to the other two microstructural conditions: as-received (AR) and thermally aged (TA).
Since the creep test durations for these specimens were very different, this causes some
difficulties to make a clear comparison. As a result, Figure 53 presents the creep strain
curves in normalised manner so that creep strains across different micro-structural
conditioned specimens can be compared. In this approach, creep strains for those
completed tests were normalised with respect to the last logged creep failure strains, and
then plotted against the normalised creep time with respect to the last logged creep failure
time. The normalised times corresponding to 50% of the accumulated creep strain for pre-
carburised (PC) specimens ACS19, ACS36 and ACS38 are also indicated.
Figure 53 Normalised creep strain curves for those completed tests (see Table 9), where
the creep strain was normalised with respect to the last logged creep failure strain and the
creep time was normalised with respect to the last logged creep failure time.
Chapter 6: Uniaxial creep deformation of Type 316H stainless steel in air at 550°C
117
6.3.1.6 Creep strain rates for all test specimens
It is instructive to compare the stress dependence of creep rates for the three different
microstructural conditions. To do this, the steady state creep strain rates were derived for
each of the specimens listed in Table 9. Figure 54 shows the creep strain rates for each
specimen tested at 550°C in air as a function of applied stress and material condition. Two
direct observations can be made from the data shown in Figure 54. First, there is no
obvious difference between the secondary creep strain rates in the thermally aged (TA)
and as-received (AR) microstructural conditions. Secondly, pre-carburised (PC)
specimens have a higher creep rate than specimens in both the thermally aged and as-
received conditions.
Figure 54 Creep strain rate versus applied true stress for specimens tested at 550°C in air
within the ENVISINC project (see Table 10).

Chapter 6: Uniaxial creep deformation of Type 316H stainless steel in air at 550°C
118
6.3.2 Short-term creep properties and cracking behaviour of PC
material (interrupted creep testing)
6.3.2.1 Load up behaviour
The hot loading stress-strain curves for the ~254 MPa tests of pre-carburised (PC) creep
specimens ACS11, ACS17 and ACS29 are shown in Figure 55. Although specimen
ACS29 appeared to show a slightly lower strain than specimens ACS11 and ACS17, the
difference is not that significant at these levels of strain, and can thus be neglected. Also,
the odd jump highlighted on the stress-strain curves for both ACS11 and ACS29 during
hot loading is possibly due to an extensometer slippage that can be associated with the
friability of the outer oxide layer on carburised samples, a phenomenon also repeatedly
observed by Amec Foster Wheeler during mechanical testing on carburised material at
elevated temperatures [103]. It is unlikely that there is no increase in strain level on
increasing the load.
Figure 55 Hot-load curves obtained for pre-carburised (PC) specimens ACS11, ACS17
and ACS29 at 550°C in air. The graph also shows the anomaly in the strain measurements
for specimens ACS11 and ACS29 during the final stages of hot loading.

Chapter 6: Uniaxial creep deformation of Type 316H stainless steel in air at 550°C
119
6.3.2.2 Creep deformation
The creep test results of pre-carburised (PC) specimens ACS11, ACS17 and ACS29
interrupted at creep strains of 0.76%, 0.71% and 0.62%, respectively, at ~254 MPa stress
are shown in Figure 56. Under the same applied stress, the samples showed similar creep
behaviour.
Figure 56 Creep deformation curves obtained for pre-carburised (PC) specimens ACS11,
ACS17 and ACS29 tested at 550°C in air.
6.3.2.3 Crack analyses
A simple and inexpensive technique such as the light optical microscope (LOM) could
already reveal the extensive surface cracking along the gauge length on the three test
specimens, ACS11, ACS17 and ACS29, as can be seen in Figures 57(a) to (c). However,
the possible presence of artefacts due to machining of the specimens was not examined.
As one would expect, the magnetite layer (the outer oxide) for all three carburised
specimens had spalled off entirely after testing, leaving behind the spinel (the inner oxide)
of the initial duplex oxide structure.
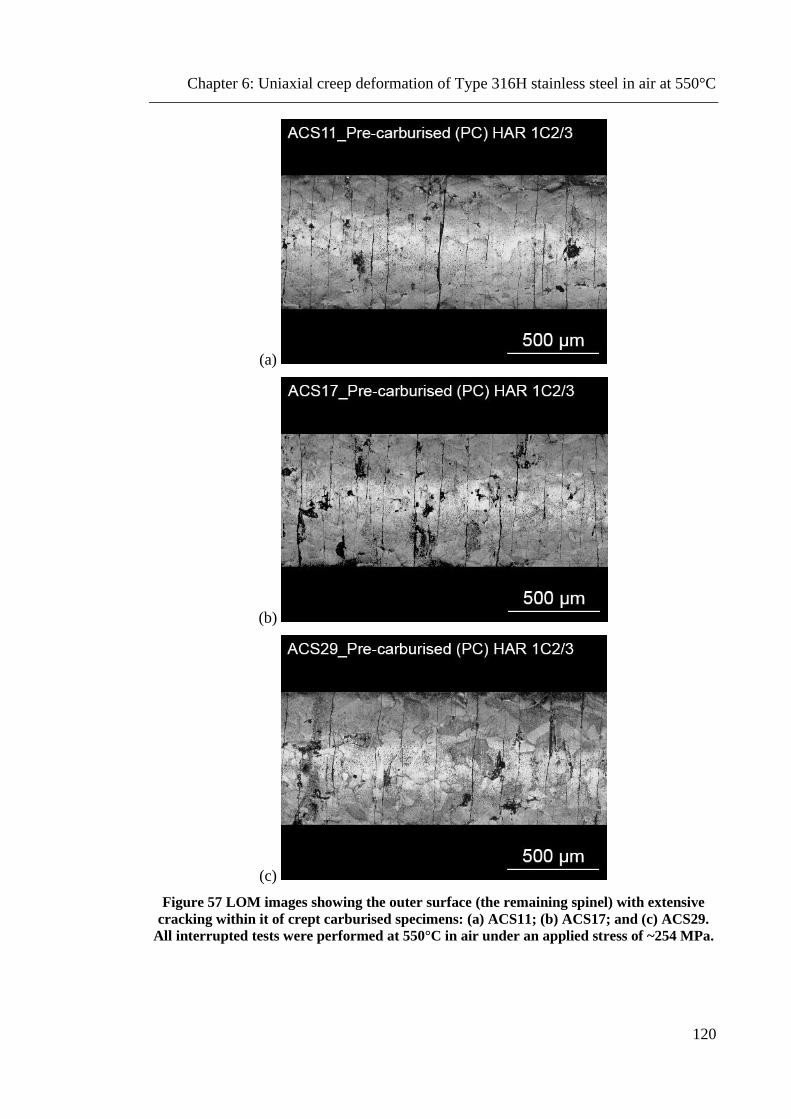
Chapter 6: Uniaxial creep deformation of Type 316H stainless steel in air at 550°C
120
(a)
(b)
(c)
Figure 57 LOM images showing the outer surface (the remaining spinel) with extensive
cracking within it of crept carburised specimens: (a) ACS11; (b) ACS17; and (c) ACS29.
All interrupted tests were performed at 550°C in air under an applied stress of ~254 MPa.

Chapter 6: Uniaxial creep deformation of Type 316H stainless steel in air at 550°C
121
These three specimens were then sectioned longitudinally with electrical discharge
machining (EDM) in four symmetrical quadrants, Figure 58(a), and the cross sectional
surfaces obtained were hot mounted in Bakelite, Figure 58(b), and prepared to an OPS
level of surface finish for further microstructural examination.
Figure 58 Schematic of the EDM sectioning of a carburised creep specimen showing an
example of: (a) the gauge section extracted from a quadrant and (b) the Bakelite mount of
its cross sectional surface prepared for microstructural examination.
Figures 59(a) to (c) show a segment of the post-test cross sectional surface examined for
each of the three carburised test specimens, ACS11, ACS17 and ACS29, respectively.
Images were taken with a Keyence VHX-5000 series digital microscope. The
micrographs revealed comparable crack patterns in each specimen and similar crack
distributions to what had previously been identified upon LOM examination on the outer
surfaces. All cracks identified were intergranular with an average periodicity of around
150 µm. The maximum crack depths identified in PC specimens ACS11, ACS17 and
ACS29 were ~254, ~202 and ~196 μm, respectively, as shown in Figures 60(a) to (c).
Chapter 6: Uniaxial creep deformation of Type 316H stainless steel in air at 550°C
122
(a)
(b)
(c)
Figure 59 Optical micrographs showing extensive cracking in the cross sectional surfaces
of pre-carburised (PC) creep specimens tested at 550°C in air under an applied stress of
~254 MPa for <350 h: (a) ACS11; (b) ACS17; and (c) ACS29.
(a) (b) (c)
Figure 60 Optical micrographs showing the deepest cracks identified on the cross sectional
surface of each pre-carburised (PC) specimen after <350 h creep testing at 550°C in air
under an applied stress of ~254 MPa: (a) ACS11; (b) ACS17; and (c) ACS29.
Chapter 6: Uniaxial creep deformation of Type 316H stainless steel in air at 550°C
123
6.3.2.4 Surface and bulk hardness measurements
To detect any possible change in surface hardness due to carburisation, 10 series of 3
columns of micro-indents with diagonal patterns were made along the OPS polished cross
sectional surface of specimen ACS17. The distance between the series was set to 650 μm
with a resolution of 60 µm and 20 µm indent spacing in the x and y directions,
respectively, starting at 20 µm distance from the outer surface of the spinel layer to a
depth of 380 µm into the bulk material, Figure 61. The bulk hardness was determined by
the mean Vickers-hardness values of 50 micro-indents measured along the gauge section
in the x direction with 250 μm spacing between the indents. The micro-indentation
experiments were performed using a Struers DuraScan 80 auto hardness tester at a load
of 0.245 N (25 gf).
Figure 61 Optical micrograph showing two (out of 10) series of the staggered micro-indent
pattern applied on the cross sectional surface of specimen ACS17 (PC).
Figure 62 illustrates the measurements obtained compared to the mean hardness of the
bulk material. It can be seen that the hardness profile follows an exponential decay
distribution to approximately 200 - 250 μm below the surface, similar to measurements
from other laboratories. Note that the hardness mapping reflects the change in surface
hardness rather than the actual hardness value.

Chapter 6: Uniaxial creep deformation of Type 316H stainless steel in air at 550°C
124
Figure 62 Micro-hardness data for crept PC specimen ACS17, which has been exposed to
a simulated AGR coolant gas at a pressure of ~4.1 MPa and a temperature of 600°C for
3000 h prior creep testing in air at 550°C under a stress of ~254 MPa.
6.4 Discussion
6.4.1 Monotonic tensile properties
6.4.1.1 Basis of analysis
The monotonic properties of the 316H header (HAR 1C2/3) material for all three
microstructural conditions were calculated from the uniaxial creep test loading data. The
creep test hot load data have been presented in Figure 48. Measurements were typically
taken after each weight was added to the specimen so that the data are not well controlled,
data points are not uniformly distributed for each test and each specimen has different
numbers of data points recorded. As the tensile properties are not a requirement for the
proposed assessment methodology [64], a linear regression fit was considered to be an
appropriate way to determine the parameters for the Ramberg-Osgood relationship. These
have been summarised in Table 8.
Chapter 6: Uniaxial creep deformation of Type 316H stainless steel in air at 550°C
125
6.4.1.2 The effect of carburisation on strain hardening behaviour
The plastic true strain versus true stress results in a log-log scale together with their linear
regression analyses for both the as-received (AR) and pre-carburised (PC) test material
were presented in Figure 51. Five typical stress levels have been indicated by arrows in
Figure 51. This plot suggests that the PC material loaded up to ~320 MPa would generate
a similar plastic true strain to the AR material loaded up to ~280 MPa. Similarly, the
plastic true strain for PC specimens tested at lower stresses of 300 MPa and 280 MPa
appears equivalent to that of AR specimens at stresses of about ~250 MPa and ~220 MPa,
respectively. When both a pre-carburised (PC) specimen and an as-received (AR)
specimen are tested at the same level of engineering stress, for example 320 MPa, it would
be expected that the as-received specimen would creep faster than the pre-carburised
specimen from the classic Norton’s law ( nA = ). However, such creep behaviour has
not been observed in Figure 54. A likely explanation for this observed high secondary
creep strain rate is that the true stress on the test specimen with a pre-carburised
microstructural condition was higher than that calculated in Figure 51, as a result of
surface cracking. In other words, stress re-distribution accounts for the increase in the
“testing stress” on the core of the pre-carburised specimen.
6.4.2 Impact of material conditioning and applied stress on creep
properties
In general, all of the creep data for the 320 MPa tests showed deformation behaviours
near to, or below, what might have been expected. Despite the apparent low ductility of
as-received specimens ACS06 and ACS07 from the extensometer data (Figure 52), it is
clear from the post-test ductility measurements that sample ACS06 had the highest
reduction in area value for any test. This suggests that the overall inelastic strain
experienced by this sample was at least as high as that found for samples ACS01 and
ACS05. In contrast, the measured reduction of area for sample ACS07 was the lowest
determined (at ~9%) and this is consistent with the low extensometer strain measured for
the sample (Figure 52). The reason for this difference in behaviour is not clear and leaves
a residual concern that significant variability is a real feature of the creep deformation
behaviour of this material.

Chapter 6: Uniaxial creep deformation of Type 316H stainless steel in air at 550°C
126
The life of the pre-carburised sample ACS19 (at 320 MPa) was <50% of the as-received
counterparts and the apparent deformation rate is greatly increased, compared with the
as-received header material (Figure 52). Surprisingly, the creep strain at rupture
increased, compared with as-received material. It may be that both the reduced life and
the increased apparent ductility were associated with early fracture of the outer carburised
layer and thus an increase in nominal stress for an effectively reduced cross-section. The
apparently improved ductility of the carburised material may reflect the reduced life and
therefore greater degree of over-load failure occurring, rather than accelerated creep crack
initiation and growth, which is a potential ductility reducing failure mechanism. However,
consideration of the post-test ductility measurements in Table 10 suggests that the overall
inelastic strain of the carburised sample at 320 MPa was not significantly different to that
of the as-received material.
Figure 52 also confirms that by decreasing the stress levels applied on the PC material
(i.e. at 300 MPa and 280 MPa) the time spent in tertiary creep drops but the time spent in
primary creep increases significantly. This can be explained by the fact that at lower
stresses, it takes a longer time for the strain hardening to dominate the thermal recovery
processes, resulting in a larger primary region observed in the creep behaviour of the PC
material. However, as the applied stress increases, the strain hardening effects become
less significant and thus reduced primary regions are observed which result in larger
fractions of tertiary creep. It should be noted here that the stress ranges applied on tests
specimens are close to, or just above, the yield stress of the carburised (PC) material at
550°C (see Chapter 1 – Section 1.4.5.3) but much higher than the yield stress of the as-
received (AR) material at this temperature. Therefore, the larger fractions of the tertiary
creep observed in the AR material (compared to the PC material) may well embody the
significant plasticity effects under the high stress levels applied (relative to yield
strength).
With increasing stress and/or temperature, the time to rupture and the extent of secondary
creep stage usually decrease, whereas the total elongation increases. Consideration of the
steady-state creep recorded for tests on PC material (Figure 52), however, shows that
decreasing the stress level does lead to a considerable increase in both the extent of
secondary stage and creep life, but the creep strain at failure seems to be notably
Chapter 6: Uniaxial creep deformation of Type 316H stainless steel in air at 550°C
127
unaffected, with specimens showing similar elongation patterns during creep, irrespective
of the level of stress applied. Moreover, the PC specimens for any test exhibit an improved
and even greater creep ductility than the AR specimens, comparable to that of the
thermally aged (TA) material. Given that both PC and TA materials had an additional
thermal ageing for 3 kh upon preconditioning, one would expect to find a reduced creep
performance compared to AR material because of the extra ageing, which is known to
have a detrimental influence on creep resistance as a consequence of the resultant
microstructural changes [9, 24]. That is, 316H materials tend to embrittle when thermally
aged due to the very dense precipitation of M23C6 carbides on the grain boundaries and
formation of various secondary phases. This particular mode of embrittlement also makes
the material very sensitive to work hardening effects. Therefore, the above findings on
PC and TA material point out at least two distinct contradictions. First, there is no obvious
difference in creep strain for the different stresses in the PC material. Secondly, both PC
and TA specimens show a remarkable increase in creep rupture ductility, significantly
higher than that of AR specimens.
However, parametric studies [114] investigating the effects of thermal ageing on the
mechanical properties and creep characteristics of Type 316 stainless steel found the same
peculiar behaviour in the creep response of aged material. In particular, specimens that
were aged for 10 kh at 593°C and creep-tested at the ageing temperature had a
significantly improved creep ductility compared to unaged specimens. In the same study,
microstructural observations of the creep tested specimens revealed more damage (severe
cracking) on the surface of the aged specimens. The specimen interiors however showed
relatively few intergranular cracks and contained far less cavitation than observed in
unaged ruptured creep specimens. Furthermore, cracks in the aged creep specimens
appeared to be associated with the annealing twin boundaries. The carbides were also
found to coarsen at the annealing twin and grain boundaries and in the matrix with
increasing ageing time. The loading strain in the aged specimens is expected to decrease
because of precipitation hardening (Orowan hardening). Similar hardening does not occur
in unaged specimens because of the absence of precipitates. The matrix, depleted of
interstitials (such as carbon and nitrogen) and substitutional elements (molybdenum),
may have the potential to deform at a higher rate than does the unaged matrix, where
dislocations generated after loading are pinned by the precipitates formed on them at the

Chapter 6: Uniaxial creep deformation of Type 316H stainless steel in air at 550°C
128
test temperature. Although precipitates produce hardening during loading, they offer less
resistance to dislocation climb at the creep test temperature and stress.
Creep testing produced more extensive intragranular or matrix deformation in the aged
specimens than in the unaged specimens. In other words, deformation in the aged material
is concentrated in the matrix, which has a much larger volume fraction than the grain
boundaries (where deformation occurs in the unaged material), and hence creep rates are
higher. Because of the morphology and distribution of precipitates at the grain boundaries
and in the matrix, cracks tend to nucleate at the annealing twin boundaries rather than at
the grain boundaries. At creep test stresses greater than the yield strength, this type of
deformation process results in higher values of elongation at the end of the primary and
secondary creep stages. This is consistent with the increased creep strain observed for
both the PC and TA material. Although the present research is lacking supportive
microstructural evidence, the aforesaid observations may well reflect in the unusual creep
behaviour of PC and TA material, wherein a potentially beneficial effect on creep
deformation of the extra (3 kh) thermal ageing upon preconditioning is not excluded.
In Figure 53 the creep behaviour of pre-carburised (PC) specimens ACS19 (320 MPa),
ACS38 (300 MPa) and ACS36 (280 MPa) has been compared with the other two
microstructural conditioned specimens. It is clear that ~50% of the creep strains in PC
specimens were accumulated during the primary creep stage, within the first 10-20% of
creep lifetime for all stresses. This phenomenon suggests that the creep strain in the PC
material is dominated by rapid initial primary creep. The early onset of such a large creep
strain could only be due to the re-distribution of the inhomogeneous stresses within the
carburised layer after the hot loading stage. This may also explain the unusually large
creep elongations observed in the PC material, where the bulk material may experience a
greater share of the load than the carburised layer, and hence larger creep deformation
than expected.

Chapter 6: Uniaxial creep deformation of Type 316H stainless steel in air at 550°C
129
6.4.3 Surface crack initiation and growth in PC material
The level of creep strain at which the surface cracks initiate in carburised material could
not be determined from the interrupted creep tests as at the time of interruption all three
specimens revealed extensive cracking. However, it is quite clear that the carburised layer
cracked in the early stages of creep testing (perhaps during hot loading), indicating a large
reduction in creep ductility, at least within the initial creep stage. Under the same applied
stress of ~254 MPa the specimens had similar creep responses (Figure 56). The specimens
also showed a rapid increase in strain all the way to the interruption point. This behaviour
is assumed to be due to the combined effect of creep and cracking on the redistribution
of stresses from the carburised layer to the bulk material, resulting in a greater load and
therefore plasticity within the matrix. This is again consistent with the initial creep
behaviour of the creep ruptured PC specimens presented earlier.
Crack growth appeared to be approximately proportional to creep strain with the sample
strained to the highest level showing the deepest crack observed. Further tests are needed
to confirm if this is the case. Crack density however had not changed at a larger strain,
indicating that cracking within the oxide layer occurred below ~0.6% creep strain and
appeared to be entirely inter-granular. The maximum crack depths identified in all three
PC specimens (ACS11, ACS17 and ACS29) were about 200 - 250 μm, suggesting cracks
have grown to this depth then arrested. Results from the hardness map disclosed a
logarithmic decrease in surface hardness to a similar extent of 200 - 250 μm beneath the
outer surface, showing that crack depth and hardness data correlate. Thus the depth of the
carburised layer was assumed to be around 200 - 250 μm, with a severity of approximately
180% increase in peak hardness observed relative to bulk.

Chapter 6: Uniaxial creep deformation of Type 316H stainless steel in air at 550°C
130
6.5 Conclusions
1. Some differences in the creep response of as-received 316H material are observed,
suggesting that significant variability is a real feature of the creep deformation
behaviour of this material at 550°C.
2. The preconditioning process in a simulated AGR environment hardens the 316H
material, leading to a significant reduction in the tensile ductility of the carburised
material compared to the as-received material when loaded at 550°C.
3. The strain hardening exponent, n, of the carburised material is about half that
derived for both the as-received and thermally aged counterparts.
4. The creep deformation of the carburised material is clearly dominated by rapid
initial primary creep, with ~50% of the creep strain accumulated during this stage.
5. For a given stress, the carburised material has a notably higher creep strain rate
than measured in materials with the as-received and thermally aged microstructural
conditions.
6. The test data support an unexpected increase in the uniaxial creep ductility of the
carburised material for any stress applied, and surprisingly larger creep strains than
those of as-received materials, comparable to that of the thermally aged material.
7. The creep elongation of the carburised material seems somewhat unaffected by
the magnitude of the stress applied. The creep life however appears to decrease with
increasing stress and the overall inelastic strain of the carburised material is not
significantly different to that of the as-received material.
8. Cracking of the carburised material under creep loading occurs at relatively low
creep strain (< 1%) with extensive surface distribution.
9. Crack growth appeared to be approximately proportional to creep strain with the
sample strained to the highest level showing the deepest crack observed (~250 µm).
Crack separation (~150 µm) however was found to be relatively insensitive to creep
strain level.

Chapter 6: Uniaxial creep deformation of Type 316H stainless steel in air at 550°C
131
10. The extent of carburisation was measured to be ~250 μm into the metal and the
established degree of hardening in the carburised layer was about 180% greater than
the bulk value, reinforcing what has been established for this material.
11. The observed depths at which cracks tend to arrest correlate with the micro-
hardness data, suggesting that cracks do not propagate beyond the carburised layer
at relatively low creep strain levels.
Chapter 7: Material characterisation and microstructural analyses
132
7. Material characterisation and microstructural analyses
This chapter draws together a qualitative understanding of the mechanical and
microstructural properties of Type 316H stainless steel test material used for this project.
First, the chapter presents additional metallographic observations against which the
previously observed peculiar creep response of some AR test specimens can be evaluated
further. The tensile properties and strain hardening behaviour of the parent material are
also investigated. Second, the chapter considers mechanical testing activities and
microstructural analyses carried out on a heavily carburised 316H tube (CT) material for
comparison purposes with the short-term effects of simulated AGR exposure of pre-
carburised (PC) 316H header material.
7.1 Header material background
A detailed characterisation of the header (HRA 1C2/3) material was carried out in
response to two anomalous creep tests performed at The University of Manchester. In
total four creep tests are considered for this study, conducted on test specimens with the
as-received (AR) microstructural condition, namely ACS05 to ACS08. All four tests were
performed at a temperature of 550 ºC in laboratory air under an applied stress of 320 MPa.
Test conditions and the creep strain curves for each specimen were presented in Table 7
and Figure 52, respectively.
From the creep strain measurements (Figure 52), samples ACS06 and ACS07 had a
considerably lower creep strain rate than sample ACS08, for example, although the failure
times were comparable for the three samples. In order to investigate the divergence in
performance among the above-mentioned creep specimens, sections of the parent
material from different regions along with the crept samples were subjected to hardness
testing and microstructural examinations. Baseline mechanical properties and the effect
of material strain on hardness have also been assessed through a number of standard and
interrupted tensile tests. The associated mechanical activities and metallographic
characterisation methods are detailed in the following sections.

Chapter 7: Material characterisation and microstructural analyses
133
7.2 Metallographic characterisation methods
This experimental work has taken the form of a series of systematic, destructive
metallographic examinations, which focussed on correlating the microstructure to
mechanical properties of the 316H header material used in the production of both the
cylindrical creep specimens and the dog-bone samples detailed in this research.
7.2.1 Baseline characterisation of the AR header material
Uniaxial creep tests were carried out on Type 316H stainless steel specimens extracted
from an ex-service header material identified as HRA 1C2/3 (Cast 55915) which was in
service for ~98 kh at temperatures between 490 - 530ºC (thermal ageing only, no exposure
to AGR coolant gas). The nominal chemical composition of the material and the full
header were presented in Table 2 and Figure 37, respectively. A schematic representation
of the header section (off-cut MT0920/12) from which the creep specimens were
extracted is shown in Figure 63.
Figure 63 Schematic representation of the header (HRA 1C2/3) section (MT0920/12) from
which the creep specimens were extracted, showing: (a) numbered creep specimen
positions and micro-hardness sample locations; and (b) macro-hardness indent locations.

Chapter 7: Material characterisation and microstructural analyses
134
7.2.1.1 Macro-hardness measurements
The as-received (AR) 316H header material from which the creep specimens were
extracted was tested with a macro-hardness indenter. The overall purpose of this analysis
is to reveal whether there is any microstructural discrepancy among the inner and outer
regions of the header, especially throughout the axial-tangential orientation of the
surfaces near ACS06 and ACS08 sample sections. Three regions between creep sample
cuts, denoted with A, B and C, were investigated by a series of 10 macro-indents with
10 mm indent spacing produced on each of the three regions of interest, as depicted in
Figure 63(b). A 10 kg load was applied for indentation; indent dimensions were recorded
with an optical microscope with a micrometer controlled shutter.
7.2.1.2 Micro-hardness measurements
Samples used in this analysis were obtained by partitioning a radial slice, cut with EDM
from one side of the header material, into 6 rectangular sections (32 x 16 x 3 mm)
representative of the top, middle and bottom regions in the axial direction, and also the
outer-to-inner diameter in the radial direction of the block, as shown in Figure 63(a). The
samples were then hot mounted in Bakelite and prepared to an OPS level of surface finish
for micro-hardness testing. Indents were done with a Struers DuraScan 80 automated
hardness tester using a load of 1.96 N (0.2 kgf). Each sample had three rows of 30 indents
with 1 mm indent spacing in the radial direction; an optical microscope linked to a digital
camera recorded the indents and the images were analysed with software measuring the
indent dimensions. Each measurement was then manually checked for accuracy.
7.2.2 Grain size analysis of crept specimens of AR material
Due to a significant discrepancy observed between the creep strain rates of the AR
specimens tested at 320 MPa (Figure 52), two of the most dissimilar samples, namely
ACS06 and ACS08, were selected for further post-test microstructural and grain size
characterisation. The positions from where these two creep samples were extracted are
denoted with 6 and 8 on the header section, corresponding to ACS06 and ACS08,
respectively, and are highlighted in red in Figure 63(a).

Chapter 7: Material characterisation and microstructural analyses
135
7.2.2.1 Sample preparation
For determining the grain size distribution, four (two transverse and two longitudinal)
sections were extracted with EDM from one half of the fractured creep specimens of both
ACS06 and ACS08. Figure 64 highlights the surfaces selected for analysis, working from
the most deformed region of the gauge (cross sectional area close to the fracture surface)
towards the bottom end of the sample (threaded region), assumed to be less deformed
after the creep test. The four surfaces of interest are denoted with 1, 2, 3 and 4 and have
different colours assigned for the different orientations: yellow and green for the
transverse (1 and 4) and longitudinal (2 and 3) directions, respectively (Figure 64). The
same colour-code is used for presenting relevant micrographic data. Sections are referred
to with the following convention for the rest of the manuscript: sample ID number -
section number, for example ACS06-1.
Figure 64 Schematic representation of one half of a fractured creep sample showing the
four sections extracted for metallographic characterisation.
The sections were then hot mounted in Bakelite and prepared to an OPS level of surface
finish for metallographic characterisation. In order to obtain the grain distribution all
surfaces were revealed by electrolytic etching method in 10% oxalic acid.

Chapter 7: Material characterisation and microstructural analyses
136
7.2.2.2 Imaging and grain size measuring methods
Sample surfaces were imaged with a Zeiss Axio optical microscope operating in bright
field mode. To reinforce the microscopic findings, the bottom end cross sectional surface
of ACS08 (section ACS08-4) was imaged using a CamScan scanning electron
microscope (SEM) equipped with an electron backscatter diffraction (EBSD) detector.
The FCC austenite phase and BCC ferrite phase were used to index crystal orientations
and their boundaries via software analysis.
Grain size measurements were acquired for each section by the linear intercept method.
Five horizontal and vertical line segments were superimposed over the micrographs and
the number of grain boundary intercepts recorded. The average grain size was then
determined from the ratio of intercepts to line length. Software using the linear intercept
method to analyse EBSD data provided additional grain size measurements of section
ACS08-4.
7.2.3 Chemical analysis of crept specimens of AR material
Chemical distribution microanalysis was acquired with an EDX detector from Oxford
Instruments coupled to a Zeiss Sigma SEM, as described in Chapter 4 – Section 4.4. The
purpose of this examination is to investigate whether the observed divergence in creep
performance of some AR specimens (tested at 320 MPa) could be attributed to a possible
aberration in the chemical composition of a sample. In other words, the aim is to draw a
comparison between the relative abundance of the chemical elements identified in the
parent material (nominal chemical composition given in Table 2) and the true
composition of the creep-tested material. As such, the analysis focused chiefly on
identifying the main alloying elements along with the quantities of each species present
in the test material, and was also looking to determine whether their distribution within
the matrix is uniform. This technique is considerably more quantifiable, but time
consuming, and more sensitive, compared with optical microscopy, and thus,
compositional examination was conducted on selected regions of section ACS06-3 only.

Chapter 7: Material characterisation and microstructural analyses
137
7.2.4 Characterisation and microstructural examination of the CT
material
In order to determine the severity and depth of prolonged carburisation and subsequent
microstructural changes in a heavily oxidised 316H tube material (exposed to a simulated
AGR environment for ~49 kh at 560ºC, detailed in Chapter 3 – Section 3.4), the cross
section along the length of the carburised tube (CT) was carefully examined.
7.2.4.1 Carburised sample preparation
Figure 65 provides a schematic representation of the 4 mm thick carburised tube (CT)
section and an example of the miniature tensile specimens (to be used later for tensile
testing at 550°C) extracted with EDM. One sample was then sectioned with an automated
cutting machine and had its gauge section mounted in Bakelite before being ground and
polished to an OPS level of surface finish. The surface selected for the metallographic
examination, corresponding to the longitudinal cross-section of the tube, is highlighted in
Figure 65. To further reveal the microstructural features on the surface, electrolytic
etching with 10% oxalic acid was conducted.
Figure 65 Schematic representation of the carburised tube (CT) material section (A-213-
TP 316H standard, section ID: SD1/034) showing regions from which the miniature tensile
specimens were extracted (left); and the examined gauge section with the surface of
interest highlighted in yellow (right).

Chapter 7: Material characterisation and microstructural analyses
138
7.2.4.2 Microscopy and grain size analysis techniques
Oxide characterisation and grain analysis were performed on both the inner and outer
surfaces of the carburised section using a Keyence VHX-5000 series digital microscope.
Grain size distribution was measured at the cylinder bore surface only using the linear
intercept method.
7.2.4.3 Method for evaluating carburisation
Identification of the carburised layer has been carried out using a combination of etching
and micro-hardness measurements. The real interest was to quantify the severity and
depth to which the material properties are modified as a result of long-term carburisation.
Micro-hardness experiments were performed using a Struers DuraScan 80 automated
hardness tester with an indentation load set to 0.245 N (25 gf) to allow for a greater
resolution of small indents to be produced on the area of interest. Both the severity and
depth of the carburised layer were assessed by correlating the hardness variations
observed in the sub-surface with the bulk hardness measured within the matrix. The
micro-hardness examination was conducted on the cross sectional surface of the
carburised tube outside diameter (OD) only where oxidation appeared to be more
pronounced.
There are some fundamental issues however about how the severity and depth of
carburisation is quantified. Currently elevated hardness is the only widely implemented
measure of severity and depth, where the “severity” is the elevation (peak) in hardness
and “depth” is the distance from the surface into the material with any hardness increase.
Although micro-hardness measurements provide a quantified measure, their nature means
only a small area is tested to infer each measurement, and hence the extent to which the
indenter impinges on the grain boundaries is largely random. It has been shown by the
University of Bristol that the grain boundaries are very hard, due to the presence of second
phases [85, 87]; therefore micro-hardness becomes a somewhat unreliable method to
determine the extent of carburisation and explains why scatter is often observed in the
measurements. However, by averaging results and identifying trends, micro-hardness can
still be a useful and quick method to gauge the extent of carburisation.
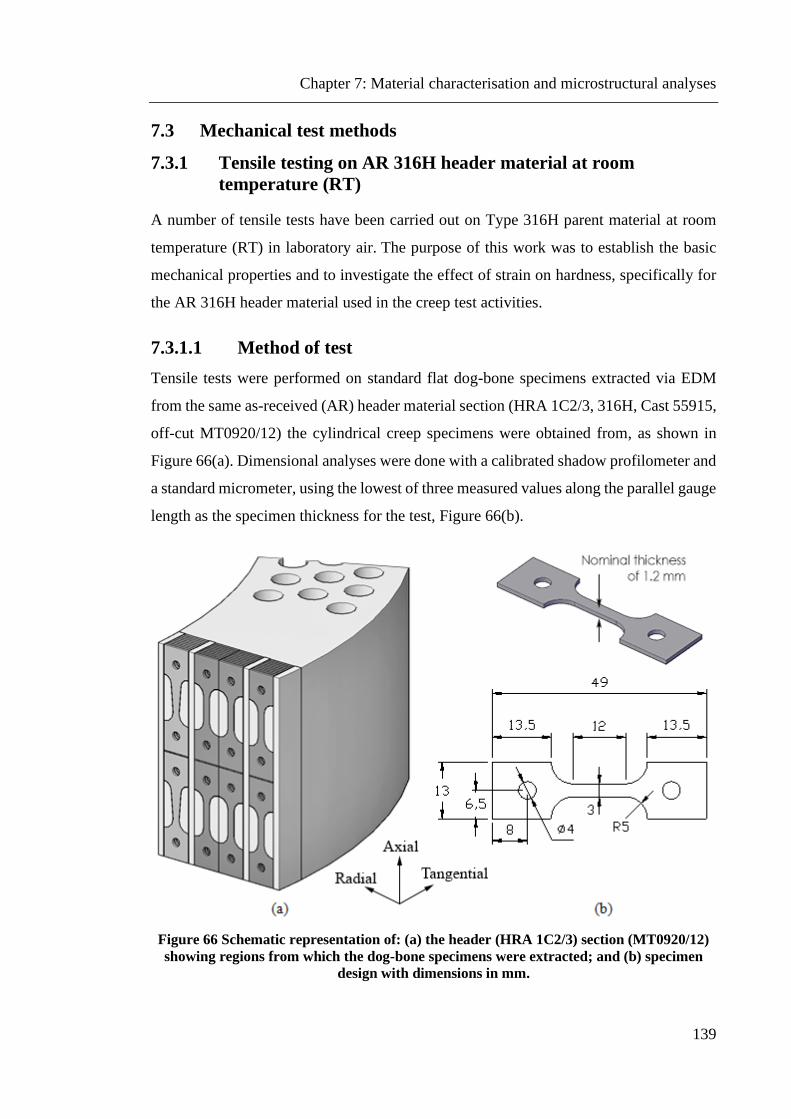
Chapter 7: Material characterisation and microstructural analyses
139
7.3 Mechanical test methods
7.3.1 Tensile testing on AR 316H header material at room
temperature (RT)
A number of tensile tests have been carried out on Type 316H parent material at room
temperature (RT) in laboratory air. The purpose of this work was to establish the basic
mechanical properties and to investigate the effect of strain on hardness, specifically for
the AR 316H header material used in the creep test activities.
7.3.1.1 Method of test
Tensile tests were performed on standard flat dog-bone specimens extracted via EDM
from the same as-received (AR) header material section (HRA 1C2/3, 316H, Cast 55915,
off-cut MT0920/12) the cylindrical creep specimens were obtained from, as shown in
Figure 66(a). Dimensional analyses were done with a calibrated shadow profilometer and
a standard micrometer, using the lowest of three measured values along the parallel gauge
length as the specimen thickness for the test, Figure 66(b).
Figure 66 Schematic representation of: (a) the header (HRA 1C2/3) section (MT0920/12)
showing regions from which the dog-bone specimens were extracted; and (b) specimen
design with dimensions in mm.
Chapter 7: Material characterisation and microstructural analyses
140
A total of five tests have been performed at room temperature (RT) in laboratory air on
baseline as-received (AR) 316H header material only, Table 11. Two tests were
performed up to failure at differing strain rates, namely 0.00035s-1 and 0.0014s-1, to obtain
full stress-strain curves representing the behaviour of the AR 316H header material. A
further test has been carried out to investigate the strain hardening behaviour of the test
material. The stress-strain data obtained on the fractured sample tested at the higher strain
rate allowed the input (total) strain values for the interrupted tensile test method to be
evaluated in order to gradually strain a third specimen up to failure by increments of 10%
plastic deformation at a rate of 0.0014s-1, with dimensional analysis and hardness
measurements performed in-between interruptions. In each step, the calculated percent
was set as the limit on the extensometer, so that the loading halted at the predefined strains
and the plastic deformation incurred on the parallel gauge was recorded. The straining of
the sample resulted in a surface deformation that prohibited hardness testing; thus the
sample required regrinding with 4000 grit SiC abrasive paper after each stage to
reproduce a smooth surface. This process of straining, dimensional analysis, regrinding
and hardness testing was repeated until the sample failed.
Two other tests were performed to further investigate the influence of material strain on
hardness, whereby the dog-bone samples were strained to similar loads to be applied later
in the oxidation tests in a CO2 environment (Chapter 8), corresponding to 320 MPa and
350 MPa stress. For both tests the faster strain rate of 0.0014s-1 was used. Potential
changes in surface hardness due to straining were then to be examined.
The first three tests were carried out using an Instron® 5569 universal testing machine
with a 10 kN load cell attached to the machine crosshead. Gauge length extension was
recorded by a clip-on type digital extensometer mounted directly onto the specimen for
accurate strain measurement. The other two tests were conducted with an Instron® 3344
series testing machine equipped with a 2 kN load cell. Strain was measured via a strain
gauge attached to the specimen’s gauge and a data logger recorded results during the tests.
The tensile testing was performed in general accordance with BS EN ISO 6892-1:2009
[115]. The test machine load cell was calibrated in accordance with BS EN ISO
7500:2004 [116] whilst the extensometer was calibrated to BS EN ISO 9513 [112].

Chapter 7: Material characterisation and microstructural analyses
141
Table 11 Summary of tensile tests conducted on AR 316H header material at RT.
Test
#
Material
condition
Test
specimen
Specimen
loading
Strain rate,
%/s
Testing
environment
Temp.
°C
1 As-received
header
(HRA 1C2/3)
material
Standard
dog-bone
specimen
of axial
orientation
Up to rupture 0.035
Laboratory
air RT
2
0.14 3 Incremental
4 Up to 320 MPa
5 Up to 350 MPa
7.3.1.2 Surface hardness measurements
Vickers micro-hardness measurements were performed using a Struers DuraScan 80 auto
hardness tester at a load of 1.96 N (0.2 kgf), for consistency of data with those obtained
from examination of the parent 316H header material, to allow direct comparison with
the baseline hardness results of the same axial-radial material orientation. For the
incrementally loaded tensile specimen the initial surface hardness was determined with a
series of 145 micro-indents with 0.2 mm spacing performed along the sample length
(from pinhole-to-pinhole). Hardness tests in-between the stages were then carried out on
the strained sample such that the deformed surface has been repeatedly indented with a
single column of 10 indents with 0.2 mm spacing produced across the gauge width at each
end and in the middle of the parallel gauge. Following failure, the same procedure has
been applied, but this time with five columns of 10 indents with 0.2 mm spacing between
the columns done at both ends of the gauge and near the fracture site.
The two test samples loaded to 320 and 350 MPa had a slightly different indentation
method for evaluating the surface hardness upon straining. On one sample a row of 50
micro-indents with 0.2 mm spacing was made along the gauge length prior to loading to
determine the baseline hardness. The hardness value of the deformed surface for both
samples has been measured with an array of 15 x 10 indents with 0.25 mm spacing in the
longitudinal and transverse direction, respectively, produced at the middle of the gauge
length where plastic deformation appeared to be the largest. This approach then allowed
for the hardness maps of the deformed surfaces of different strain magnitudes to be
generated.
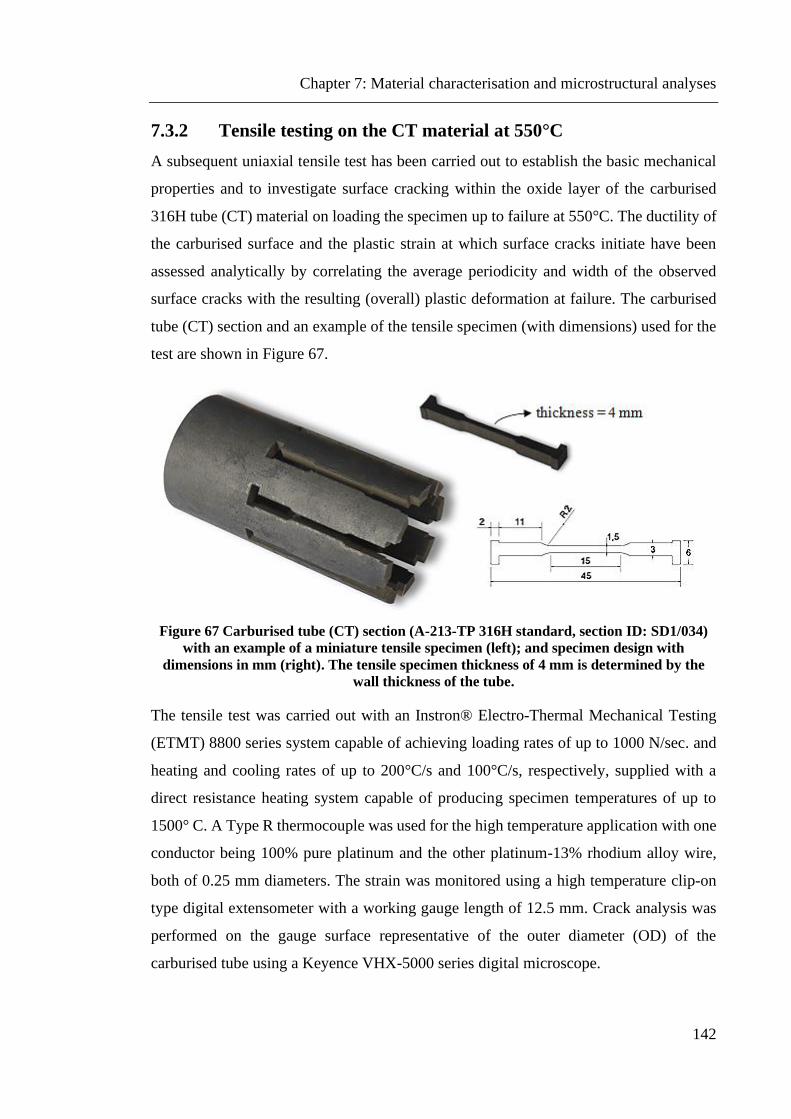
Chapter 7: Material characterisation and microstructural analyses
142
7.3.2 Tensile testing on the CT material at 550°C
A subsequent uniaxial tensile test has been carried out to establish the basic mechanical
properties and to investigate surface cracking within the oxide layer of the carburised
316H tube (CT) material on loading the specimen up to failure at 550°C. The ductility of
the carburised surface and the plastic strain at which surface cracks initiate have been
assessed analytically by correlating the average periodicity and width of the observed
surface cracks with the resulting (overall) plastic deformation at failure. The carburised
tube (CT) section and an example of the tensile specimen (with dimensions) used for the
test are shown in Figure 67.
Figure 67 Carburised tube (CT) section (A-213-TP 316H standard, section ID: SD1/034)
with an example of a miniature tensile specimen (left); and specimen design with
dimensions in mm (right). The tensile specimen thickness of 4 mm is determined by the
wall thickness of the tube.
The tensile test was carried out with an Instron® Electro-Thermal Mechanical Testing
(ETMT) 8800 series system capable of achieving loading rates of up to 1000 N/sec. and
heating and cooling rates of up to 200°C/s and 100°C/s, respectively, supplied with a
direct resistance heating system capable of producing specimen temperatures of up to
1500° C. A Type R thermocouple was used for the high temperature application with one
conductor being 100% pure platinum and the other platinum-13% rhodium alloy wire,
both of 0.25 mm diameters. The strain was monitored using a high temperature clip-on
type digital extensometer with a working gauge length of 12.5 mm. Crack analysis was
performed on the gauge surface representative of the outer diameter (OD) of the
carburised tube using a Keyence VHX-5000 series digital microscope.
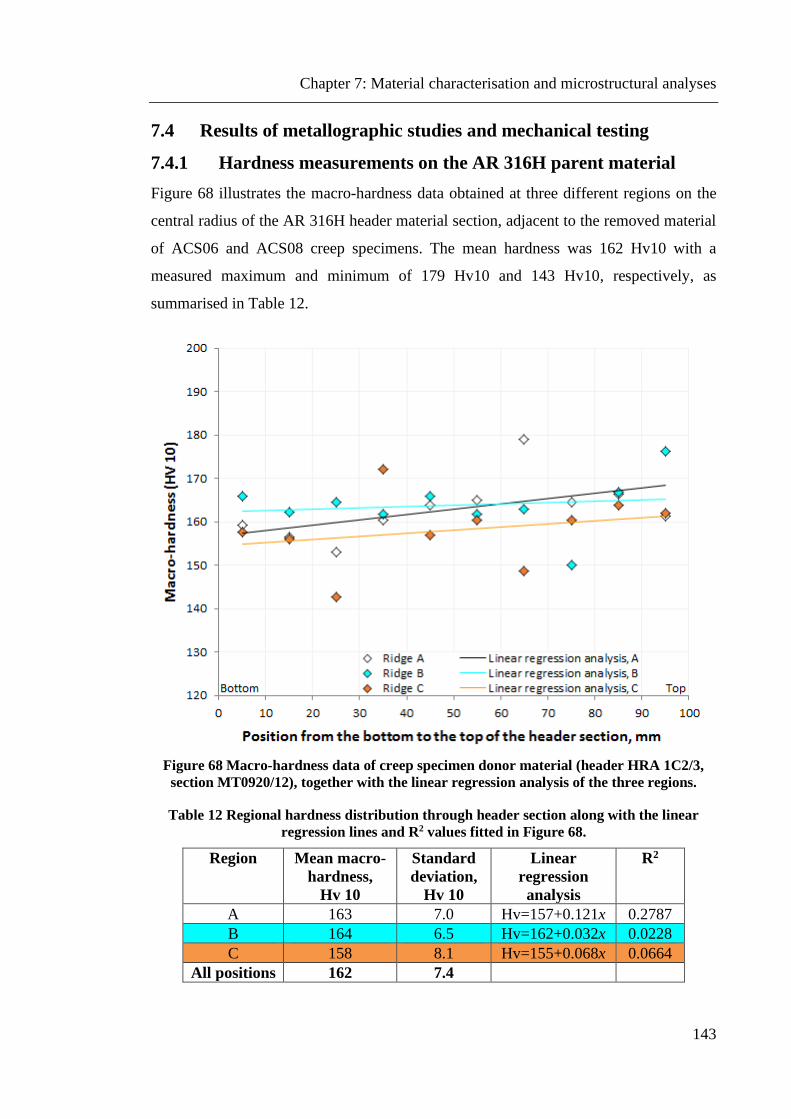
Chapter 7: Material characterisation and microstructural analyses
143
7.4 Results of metallographic studies and mechanical testing
7.4.1 Hardness measurements on the AR 316H parent material
Figure 68 illustrates the macro-hardness data obtained at three different regions on the
central radius of the AR 316H header material section, adjacent to the removed material
of ACS06 and ACS08 creep specimens. The mean hardness was 162 Hv10 with a
measured maximum and minimum of 179 Hv10 and 143 Hv10, respectively, as
summarised in Table 12.
Figure 68 Macro-hardness data of creep specimen donor material (header HRA 1C2/3,
section MT0920/12), together with the linear regression analysis of the three regions.
Table 12 Regional hardness distribution through header section along with the linear
regression lines and R2 values fitted in Figure 68.
Region Mean macro-
hardness,
Hv 10
Standard
deviation,
Hv 10
Linear
regression
analysis
R2
A 163 7.0 Hv=157+0.121x 0.2787
B 164 6.5 Hv=162+0.032x 0.0228
C 158 8.1 Hv=155+0.068x 0.0664
All positions 162 7.4

Chapter 7: Material characterisation and microstructural analyses
144
The micro-hardness measurements are plotted in Figure 69 with linear regression lines
shown for each region. The mean hardness of the material was 180 Hv0.2 with
distributions from each region shown in Table 13. The bottom part of the header section
had a slightly lower hardness and linear regression also showed that the inner surface was
22 Hv0.2 less than the outer surface.
Figure 69 Micro-hardness data of creep specimen donor material (header HRA 1C2/3,
section MT0920/12), together with the linear regression analysis of the three regions. Each
indent is represented by a coloured point referring to the sample position: green, red and
blue from the top, middle and bottom, respectively. The position of the creep specimens
through the section is marked in grey.
Table 13 Regional hardness distribution through header section along with the linear
regression lines and R2 values fitted in Figure 69.
Region Mean micro-
hardness,
Hv 0.2
Standard
deviation,
Hv 0.2
Linear
regression
analysis
R2
Top 182 11.5 Hv=192-0.320x 0.9971
Middle 182 12.7 Hv=193-0.344x 0.9963
Bottom 175 12.1 Hv=187-0.359x 0.9967
All positions 180 12.6

Chapter 7: Material characterisation and microstructural analyses
145
The regression models for the three region (top, middle and bottom) were further tested
using different statistical methods. Within each region, the null hypothesis that the means
are equal was not rejected at the 1% level (99% confidence interval) based on the
k-Sample T-test. The null hypothesis for Levene's test that the regions have similar
population variances was also accepted at the 1% level. The results of the analysis are
shown in Figures 70(a) to (c).
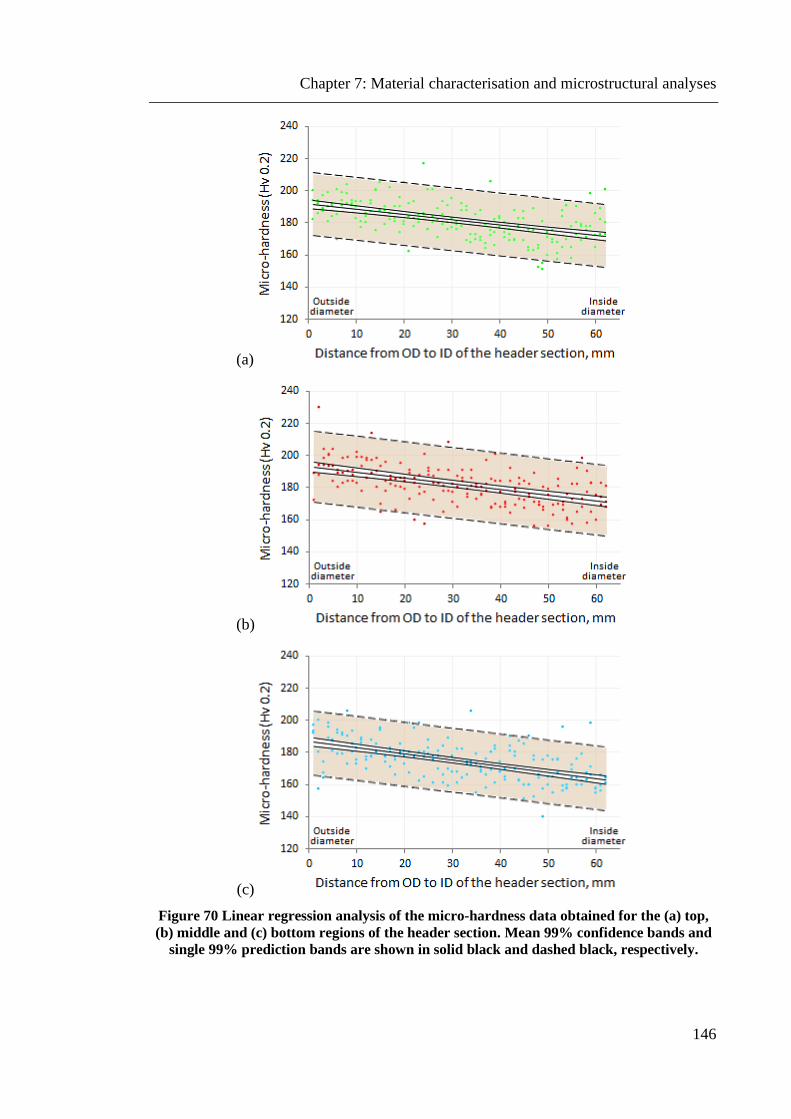
Chapter 7: Material characterisation and microstructural analyses
146
(a)
(b)
(c)
Figure 70 Linear regression analysis of the micro-hardness data obtained for the (a) top,
(b) middle and (c) bottom regions of the header section. Mean 99% confidence bands and
single 99% prediction bands are shown in solid black and dashed black, respectively.

Chapter 7: Material characterisation and microstructural analyses
147
7.4.2 Grain size and distribution characteristics of crept AR samples
The post-test micrographs of ACS06 and ACS08 creep specimen sections (Figure 64)
were recorded in bright field mode, and are compared in Figures 71 to 77. The cross
sectional surface close to the fracture site showed uniform grain distribution for both
samples with possible large grains appearing in ACS08-1 only. Further away from the
fracture surface large grains appeared with intergranular cracking present in both
microstructures. The undeformed (threaded) sections of both transverse and longitudinal
directions revealed a randomised and large grain variation of mm scale occurring in
clusters.
Figure 71 LOM montage of 24 images taken on the cross sectional surface of ACS06-1
(radial-tangential orientation), showing equiaxed grains with a relatively uniform size
distribution.

Chapter 7: Material characterisation and microstructural analyses
148
Figure 72 LOM montage of 24 images taken on the cross sectional surface of ACS08-1
(radial-tangential orientation). The grains appear uniformly distributed and equiaxed
apart from two clusters of larger grains (up to ~500 µm) encircled in blue.

Chapter 7: Material characterisation and microstructural analyses
149
Figure 73 LOM montage of 12 images taken on the cross sectional surface of ACS06-2
(radial-axial orientation), showing the appearance of large grains and the presence of
intergranular cracking.
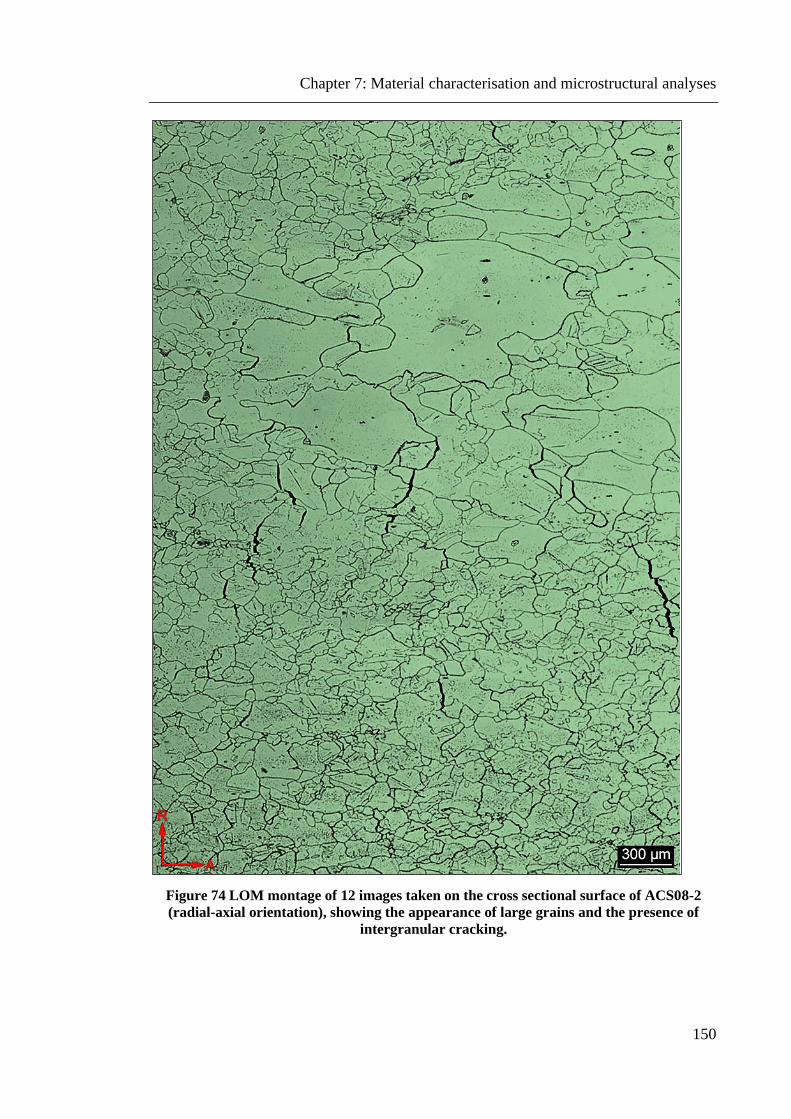
Chapter 7: Material characterisation and microstructural analyses
150
Figure 74 LOM montage of 12 images taken on the cross sectional surface of ACS08-2
(radial-axial orientation), showing the appearance of large grains and the presence of
intergranular cracking.

Chapter 7: Material characterisation and microstructural analyses
151
(a)
(b)
Figure 75 LOM montage of 14 images taken on the cross sectional surface of (a) ACS06-3
and (b) ACS08-3 (axial-radial orientation), showing randomised and large grain variations
occurring in clusters.

Chapter 7: Material characterisation and microstructural analyses
152
Figure 76 LOM montage of 36 images taken on the cross sectional surface of ACS06-4
(radial-tangential orientation), with measured dimension of the largest grain found within
the section indicated in blue.

Chapter 7: Material characterisation and microstructural analyses
153
Figure 77 LOM montage of 24 images taken on the cross sectional surface of ACS08-4
(radial-tangential orientation), showing variations in the grain size distribution with two
clusters of mm scale grains encircled in blue. As indicated, part of the micrograph could
not be retrieved.
Regions with large variation in grain size of both ACS06 and ACS08 creep specimen
sections are depicted at a higher magnification in Figures 78 and 79, respectively.
Figure 78 also shows an example of the linear intercept method used to determine the
average grain size of regions without large grains within each section analysed, with a
mean number of 17 grain boundary intersections per line recorded for all samples. The
recorded values for each sample with calculated grain sizes are detailed in Table 14. The
measured grain size in the axial and radial direction for the deformed (section 2) and
undeformed (section 3) sample regions of both ACS06 and ACS08 are provided in
Table 15. The ratio of the axial to radial direction is calculated to investigate grain
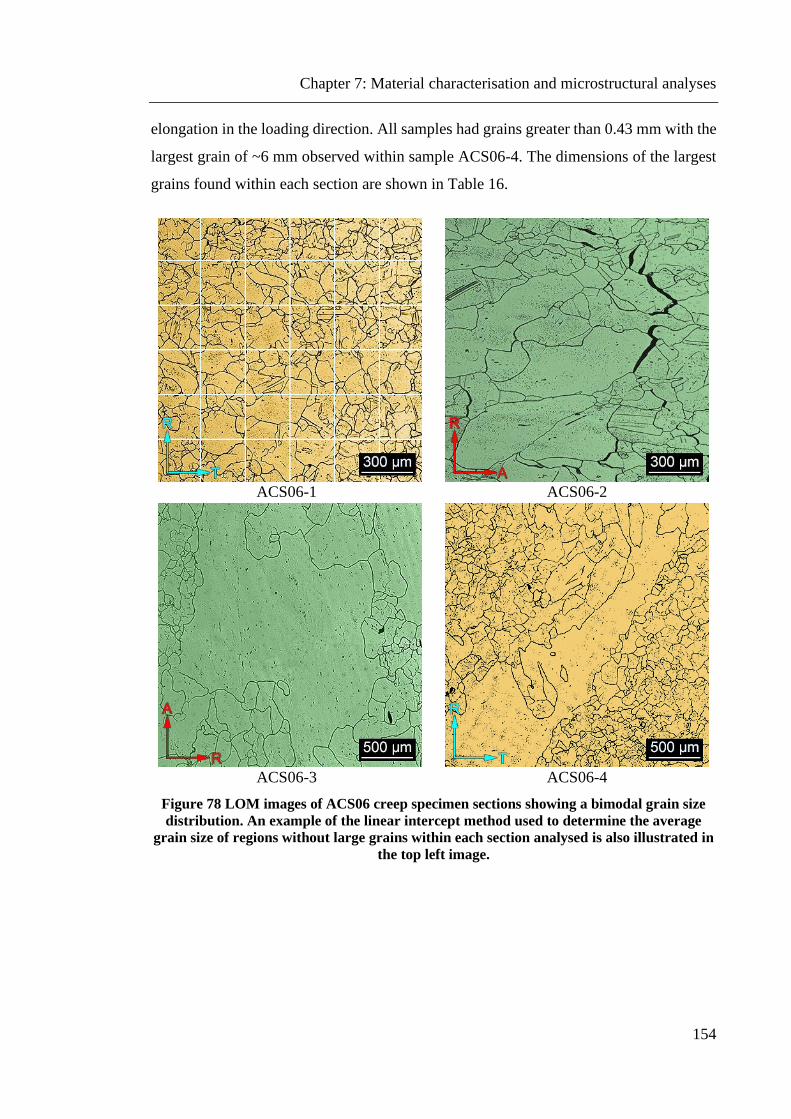
Chapter 7: Material characterisation and microstructural analyses
154
elongation in the loading direction. All samples had grains greater than 0.43 mm with the
largest grain of ~6 mm observed within sample ACS06-4. The dimensions of the largest
grains found within each section are shown in Table 16.
ACS06-1 ACS06-2
ACS06-3 ACS06-4
Figure 78 LOM images of ACS06 creep specimen sections showing a bimodal grain size
distribution. An example of the linear intercept method used to determine the average
grain size of regions without large grains within each section analysed is also illustrated in
the top left image.

Chapter 7: Material characterisation and microstructural analyses
155
ACS08-1 ACS08-2
ACS08-3 ACS08-4
Figure 79 LOM images of ACS08 creep specimen sections showing a bimodal grain size
distribution; axial, radial and tangential directions are also indicated.
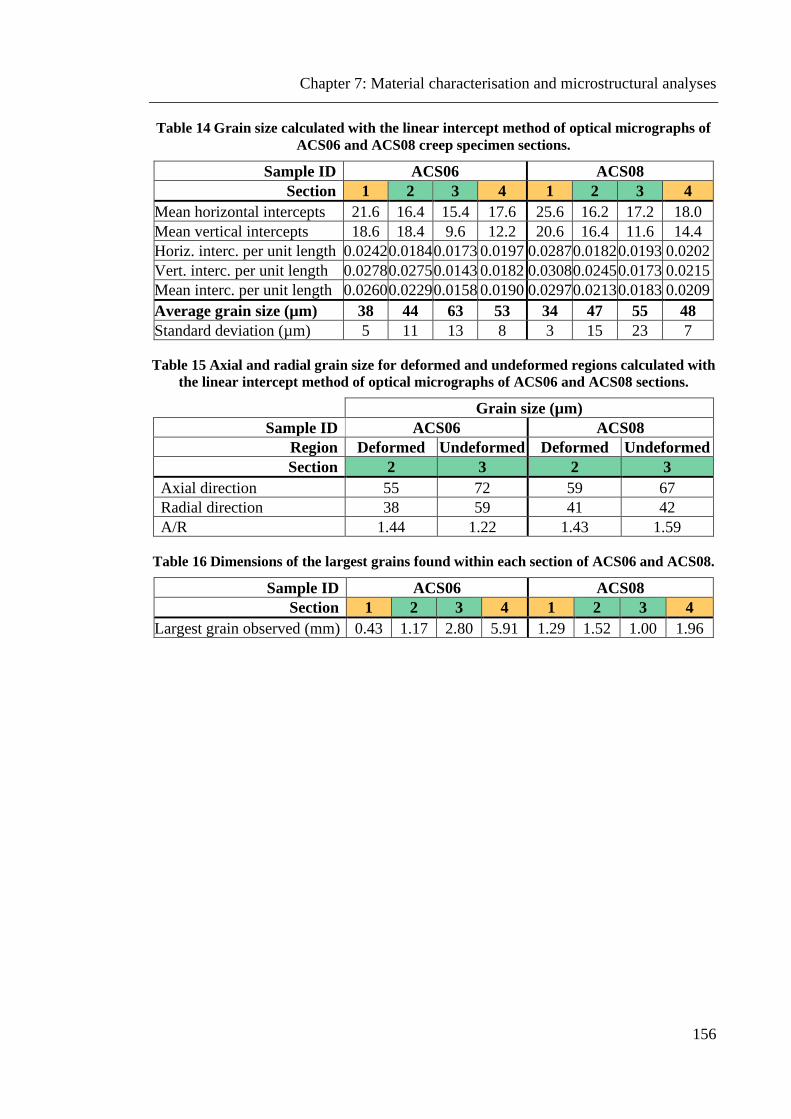
Chapter 7: Material characterisation and microstructural analyses
156
Table 14 Grain size calculated with the linear intercept method of optical micrographs of
ACS06 and ACS08 creep specimen sections.
Sample ID ACS06 ACS08
Section 1 2 3 4 1 2 3 4
Mean horizontal intercepts 21.6 16.4 15.4 17.6 25.6 16.2 17.2 18.0
Mean vertical intercepts 18.6 18.4 9.6 12.2 20.6 16.4 11.6 14.4
Horiz. interc. per unit length 0.0242 0.0184 0.0173 0.0197 0.0287 0.0182 0.0193 0.0202
Vert. interc. per unit length 0.0278 0.0275 0.0143 0.0182 0.0308 0.0245 0.0173 0.0215
Mean interc. per unit length 0.0260 0.0229 0.0158 0.0190 0.0297 0.0213 0.0183 0.0209
Average grain size (µm) 38 44 63 53 34 47 55 48
Standard deviation (µm) 5 11 13 8 3 15 23 7
Table 15 Axial and radial grain size for deformed and undeformed regions calculated with
the linear intercept method of optical micrographs of ACS06 and ACS08 sections.
Grain size (µm)
Sample ID ACS06 ACS08
Region Deformed Undeformed Deformed Undeformed
Section 2 3 2 3
Axial direction 55 72 59 67
Radial direction 38 59 41 42
A/R 1.44 1.22 1.43 1.59
Table 16 Dimensions of the largest grains found within each section of ACS06 and ACS08.
Sample ID ACS06 ACS08
Section 1 2 3 4 1 2 3 4
Largest grain observed (mm) 0.43 1.17 2.80 5.91 1.29 1.52 1.00 1.96

Chapter 7: Material characterisation and microstructural analyses
157
An EBSD scan was used to validate the microstructure revealed by etching. Section
ACS08-4 was analysed in regions with large and small grain distributions, Figure 80. The
EBSD maps were then analysed by the linear intercept method with software scanning
horizontal and vertical lines, Table 17. The large grain in Figure 80(b) (indexed in blue)
measured more than 1.2 mm in the longest dimension. This confirmed the microstructure
contained mm scale grains and these were not an artefact of the etching process.
(a) (b)
Figure 80 EBSD maps with Euler’s colours of creep specimen section ACS08-4 examining
(a) representative small grained region, and (b) region with large grains.
Table 17 Grain size measurement by horizontal and vertical linear intercept method. The
maximum grain size measured within the large-grained region is highlighted in blue in
accordance with Euler’s colour indexing from Figure 80(b).
Fine-grained region Grain size characteristics
Coarse-grained region
Horizontal Vertical Horizontal Vertical
42.763 44.681 Average, expectation - EX (µm) 84.911 99.263
1159 1159.5 Variance, dispersion - D²X (µm) 9800.9 23555
34.044 34.051 Standard deviation - s (µm) 98.999 153.48
0.79611 0.76208 Coefficient of variation - s/EX 1.1659 1.5461
7 7 Minimum value - Xmin (µm) 12 12
245 280 Maximum value - Xmax (µm) 720 1296
1160 1043 Size of the data set - N (µm) 2321 2086

Chapter 7: Material characterisation and microstructural analyses
158
7.4.3 Chemical composition of crept AR sample
Chemical analysis of section ACS06-3 was performed by EDX spectroscopy connected
to a SEM. The sample selected for the analysis, extracted from specimen ACS06 with the
anomalous creep response, was considered to be the most representative of the nominal
chemical composition of the parent material being an undeformed and shielded region,
and hence less affected by the environmental conditions during testing. The analysis was
also biased towards the bulk of the material since this is where chemical enrichment
and/or depletion of the main alloying elements due to external surface oxidation were
anticipated to least likely occur. The microstructure was analysed inside both small and
large grains, Figure 81. The EDX spectra acquired at three different points of the bulk
and the data of the chemical composition are presented normalised to 100% in Figure 82,
Figure 83 and Table 18.
Figure 81 SEM image of section ACS06-3 with selected points for EDX spectral analysis.

Chapter 7: Material characterisation and microstructural analyses
159
(a)
(b)
(c)
Figure 82 EDX patterns acquired by spectral point analysis for the three regions of
ACS06-3 creep specimen section identified in Figure 81: (a) test 1; (b) test 2; and (c) test 3.
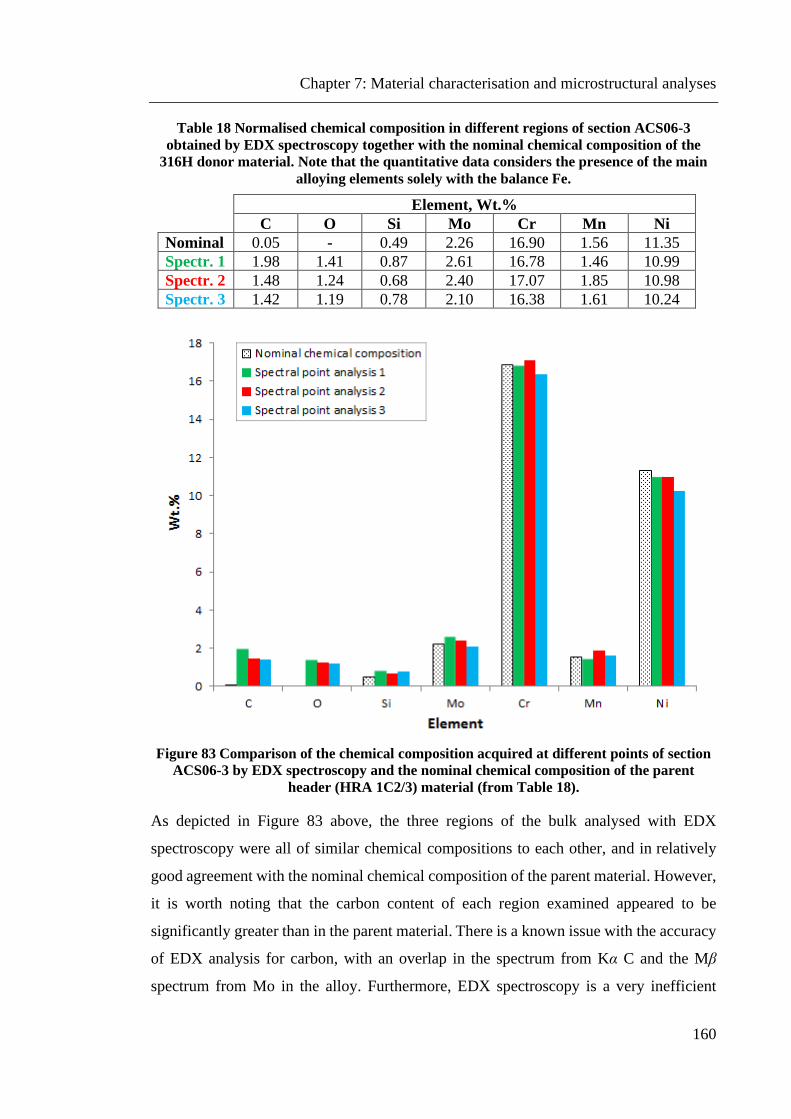
Chapter 7: Material characterisation and microstructural analyses
160
Table 18 Normalised chemical composition in different regions of section ACS06-3
obtained by EDX spectroscopy together with the nominal chemical composition of the
316H donor material. Note that the quantitative data considers the presence of the main
alloying elements solely with the balance Fe.
Element, Wt.%
C O Si Mo Cr Mn Ni
Nominal 0.05 - 0.49 2.26 16.90 1.56 11.35
Spectr. 1 1.98 1.41 0.87 2.61 16.78 1.46 10.99
Spectr. 2 1.48 1.24 0.68 2.40 17.07 1.85 10.98
Spectr. 3 1.42 1.19 0.78 2.10 16.38 1.61 10.24
Figure 83 Comparison of the chemical composition acquired at different points of section
ACS06-3 by EDX spectroscopy and the nominal chemical composition of the parent
header (HRA 1C2/3) material (from Table 18).
As depicted in Figure 83 above, the three regions of the bulk analysed with EDX
spectroscopy were all of similar chemical compositions to each other, and in relatively
good agreement with the nominal chemical composition of the parent material. However,
it is worth noting that the carbon content of each region examined appeared to be
significantly greater than in the parent material. There is a known issue with the accuracy
of EDX analysis for carbon, with an overlap in the spectrum from Kα C and the Mβ
spectrum from Mo in the alloy. Furthermore, EDX spectroscopy is a very inefficient

Chapter 7: Material characterisation and microstructural analyses
161
method to detect inelastic electron scattering; when considering low energy X-ray peaks
of light elements, such as carbon and oxygen, neglecting X-ray absorption effects has the
potential to introduce large errors [117]. In addition, sample (organic) contamination or
environmental carbon intensities can strongly affect the light element analysis. Hence
some caution must be noted in quoting C levels from EDX analysis.
7.4.4 Microstructural examination of the CT material
7.4.4.1 Oxide evolution
The impact of the environment on the microstructure of a carburised tube (CT) material
has been investigated. A section extracted from a tube of 316H material, which has been
subjected to long term (~49 kh) exposure in AGR simulated gas at 560°C, was ground
and polished to an OPS surface level before being etched to reveal its microstructure. The
use of the Keyence digital microscope allowed for the characteristics of the
microstructure to be observed and analysed. Figures 84(a) and (b) show the cross
sectional microstructure of the outer diameter (OD) and the bore of the carburised tube,
respectively.
Initial inspection of the micrographs revealed the presence of the duplex oxide on both
the outer and inner sides of the tube. The images show a thicker oxide layer on the OD
with the magnetite and spinel occurring uniformly along the surface of the sample
compared to the slightly thinner duplex oxide formed at the bore where the spinel exhibits
a patchy morphology instead of a continuous distribution. A closer examination of the
microstructure shows darker and thicker grain boundaries near the surface suggesting that
sensitisation has occurred in the carburised region with the formation of second phases
made up of both carbides and oxides. Note that some darker regions (including grains and
grain boundaries) are due to a slight over etching; however, the apparent grain boundary
thickness and the seemingly dark planar carburisation front of the OD surface are well
distinguishable.

Chapter 7: Material characterisation and microstructural analyses
162
(a)
(b)
Figure 84 Optical micrographs showing the oxide morphology and carburisation at
(a) the OD, and (b) the bore of the carburised 316H tube material, electrolytically
etched using a 10% oxalic acid solution.
7.4.4.2 Grain size measurement
Figure 84(a) shows a grain structure at the outside diameter (OD) of the carburised tube
with grains up to 300 μm diameter and the bore in Figure 84(b) having a range of grain
sizes from small and medium to large scale. Thus, the average grain size was measured
only in regions adjacent to the inner diameter (ID).
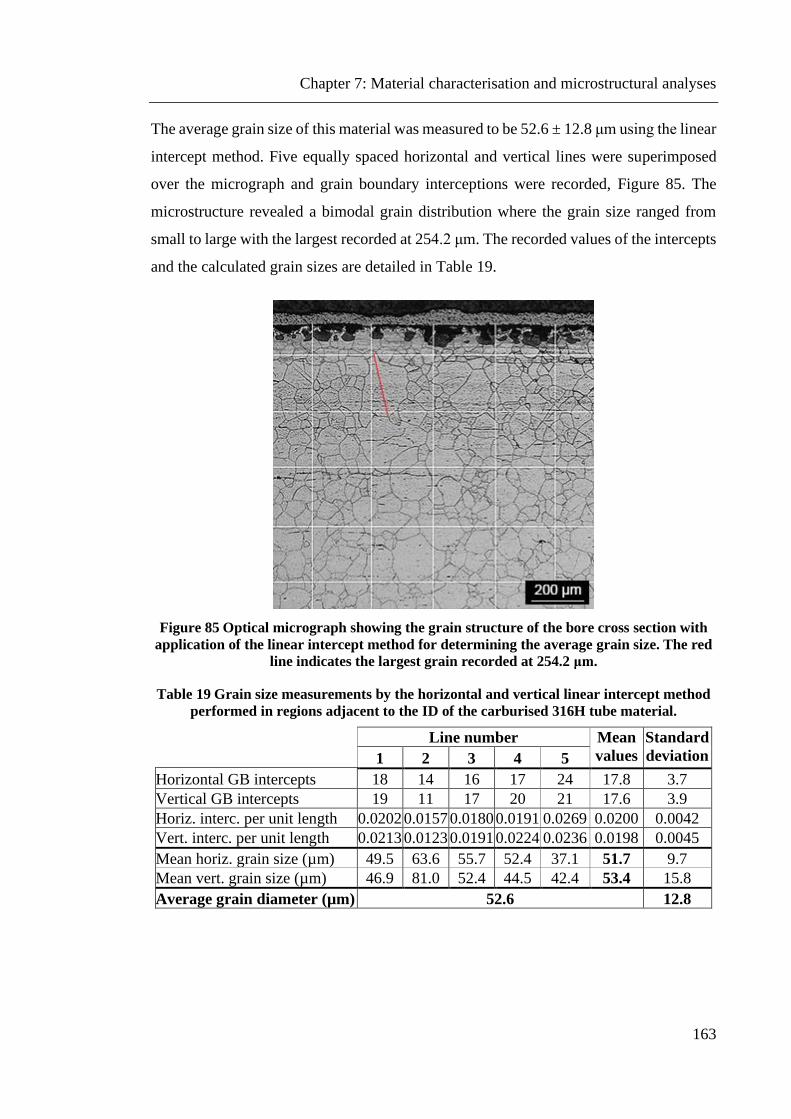
Chapter 7: Material characterisation and microstructural analyses
163
The average grain size of this material was measured to be 52.6 ± 12.8 μm using the linear
intercept method. Five equally spaced horizontal and vertical lines were superimposed
over the micrograph and grain boundary interceptions were recorded, Figure 85. The
microstructure revealed a bimodal grain distribution where the grain size ranged from
small to large with the largest recorded at 254.2 μm. The recorded values of the intercepts
and the calculated grain sizes are detailed in Table 19.
Figure 85 Optical micrograph showing the grain structure of the bore cross section with
application of the linear intercept method for determining the average grain size. The red
line indicates the largest grain recorded at 254.2 μm.
Table 19 Grain size measurements by the horizontal and vertical linear intercept method
performed in regions adjacent to the ID of the carburised 316H tube material.
Line number Mean
values
Standard
deviation 1 2 3 4 5
Horizontal GB intercepts 18 14 16 17 24 17.8 3.7
Vertical GB intercepts 19 11 17 20 21 17.6 3.9
Horiz. interc. per unit length 0.0202 0.0157 0.0180 0.0191 0.0269 0.0200 0.0042
Vert. interc. per unit length 0.0213 0.0123 0.0191 0.0224 0.0236 0.0198 0.0045
Mean horiz. grain size (µm) 49.5 63.6 55.7 52.4 37.1 51.7 9.7
Mean vert. grain size (µm) 46.9 81.0 52.4 44.5 42.4 53.4 15.8
Average grain diameter (µm) 52.6 12.8

Chapter 7: Material characterisation and microstructural analyses
164
7.4.4.3 Hardness data of the CT material
To determine the elevation in hardness and the depth of material with any hardness
increase due to carburisation, five series of 3 columns of micro-indents with diagonal
patterns were produced on the OD cross sectional surface of the tube section. The distance
between the series was set to 3 mm with a vertical resolution of 20 µm indent spacing
from the metal-oxide interface to a depth of 900 µm into the bulk, Figure 86(a). The bulk
hardness was determined by the mean Vickers-hardness values of 100 micro-indents with
150 μm spacing in-between the indents measured along the centre of the section. All tests
had the indentation load set to 0.245 N (25 gf). Variation of hardness and the mean
hardness maximum of ~500 Hv0.025 are illustrated in Figure 86(b). An exponential decay
distribution of the hardness profile is perceptible to approximately 500 μm below the
surface.
(a) (b)
Figure 86 Micro-hardness data: (a) micrograph showing one series of the staggered indent
pattern applied; and (b) plot of hardness variation and profile at the OD of the CT section,
which has been exposed to an AGR type gas for ~49 kh at a temperature of 560°C.
It is interesting to note that the severity of carburisation observed in the CT material,
following ~49 kh exposure to a simulated AGR environment at 560°C, is similar to that
for the pre-carburised (PC) header (HAR 1C2/3) material of creep specimen ACS17

Chapter 7: Material characterisation and microstructural analyses
165
subjected to only 3 kh exposure to an AGR type gas at 600°C (see Figure 62), with a
measured maximum hardness of ~500 Hv for both. Although the specimens had a
difference in exposure temperature, the normalised, regressed hardness profiles, plotted
in Figure 87, show comparable surface hardening levels for the different exposure times,
with a calculated subsurface hardness value of 240% - 270% of the bulk value. The extent
of carburisation in the substrate however appears to increase significantly with exposure
time, from ~200 μm for the 3 kh exposure to a characteristic carburised depth of
approximately 500 μm for the prolonged exposure (~49 kh) over which the Vickers
hardness is 10% greater than the bulk value. The value of 10% was partly selected as a
result of Amec Foster Wheeler’s material examination suggesting at this depth the
material looked largely unaffected by carburisation and partly because this depth related
well to the change in fractography behaviour observed in test specimens [89].
Figure 87 Comparison of regressed hardness profiles for the pre-carburised (PC) ACS17
creep specimen of 316H header (HAR 1C2/3) material and the carburised tube (CT)
material (A-213-TP 316H standard, SD1/034) following 3 kh (black) and ~49 kh (red)
exposure to a simulated AGR environment at 600°C and 560°C, respectively.

Chapter 7: Material characterisation and microstructural analyses
166
7.4.5 Tensile properties of the AR 316H header material at RT
Tensile testing of standard dog-bone specimens of as-received (AR) 316H material was
performed at room temperature. In order to determine the deformation behaviour specific
to this material two samples were strained axially until failure at different rates. The
engineering stress against engineering strain plots of the ruptured samples are shown in
Figure 88, whilst Figure 89 illustrates the tensile test results obtained by Amec Foster
Wheeler [103] for comparison. It can be seen from Figure 88 that there is a slight
difference in the tensile response of the two samples, presumably due to the difference in
strain rates. More importantly, the results are in good agreement with data generated by
AFW on the same 316H header material except for the elongation up to failure which, for
both samples, appeared to be considerably lower than for the AFW specimens with the
axial orientation (with a strain reduction of approximately 15%). This can also be
attributed to differences in the loading rate within the tensile tests.
The sample used for the incremental load test (interrupted straining) had a slightly
different tensile behaviour compared to the previous test results, so the predefined plastic
strain level of 40% for example was not precisely achieved and additionally the 20%
plastic deformation step was omitted due to an input error in the strain limitation. This
however had no significant impact on assessing hardness evolution with increasing strain.
The test results are shown in Figure 90.
The nominal stress-strain plots of the two dog-bone samples loaded to the experimental
stress levels intended to be used for the oxidation studies under an applied stress are
presented in Figure 91. One specimen was loaded up to 320 MPa and the other up to a
stress of 350 MPa. The stresses were calculated using the pre-test specimen dimensions
to determine the loads applied on the samples.
The tensile data are shown in Table 20. The table also details the corresponding Amec
Foster Wheeler tensile test data (from Figure 89) for comparison purposes. The ductility
information, determined from post-test dimensional analyses, is shown in terms of the
degree of permanent extension measured on the test specimen gauge length and also
percentage reduction of area, as measured from the necked region of the fracture. A
detailed overview of the results is presented in Appendix-B.

Chapter 7: Material characterisation and microstructural analyses
167
Figure 88 Tensile test engineering stress-strain curves of axial dog-bone samples of AR
316H header material (HRA 1C2/3, Cast 55915) loaded to failure at 0.035%/s (red) and
0.14%/s (black) strain rates at RT.
Figure 89 Amec Foster Wheeler tensile test stress-strain curves of axial (AT) and
circumferential (CT) as-received specimens (extracted from Header HRA 1C2/3, 316H,
Cast 55915) tested at both room temperature (RT) and 550°C at 0.004%/s strain rate [103].

Chapter 7: Material characterisation and microstructural analyses
168
Figure 90 Stress-strain curve of the interrupted tensile test on axial dog-bone sample of
AR 316H header material (HRA 1C2/3, Cast 55915) at 0.14%/s strain rate at RT.
Figure 91 Tensile test nominal stress-strain curves of axial dog-bone samples of AR 316H
header material (HRA 1C2/3, Cast 55915) stressed to 320 MPa (black) and 350 MPa (red)
at 0.14%/s strain rate at RT.

Chapter 7: Material characterisation and microstructural analyses
169
Table 20 Tensile data for AR header material (HRA 1C2/3, 316H, Cast 55915) obtained
from tests carried out at the UOM and AFW [103] at RT.
Lab Sample
ID
Strain
rate,
%/s
Young's
modulus,
GPa
0.2%
proof
stress,
MPa
UTS,
MPa
Elongation
to failure,
%
Reduction
in area,
%
UOM
1 0.035 187 376 625 56.3 63.2
2
0.14
190 357 623 52.1 62.8
3 178 332 631 47.2 57.2
4 168 309 - - -
5 172 316 - - -
AFW
CT1
0.004 Unavailable
315 623 59.5 48.8
AT1 313 627 68.5 66.6
AT5 309 624 78.3 66.1
7.4.6 Strain hardening behaviour of the AR 316H material at RT
Incremental loading allowed hardness testing to monitor and record the changes in surface
hardness resulting from plastic deformation by the method described earlier in Section
7.3.1.2. The baseline hardness and the surface hardness variation of the material once
strained to failure are shown in Figure 92. Upon straining the sample failed at about 47%
plastic deformation. The evolution of hardness versus plastic deformation along with a
second order polynomial regression model fitted to the data is shown in Figure 93.
The oxidation test hardness samples were strained to 0.5 and 1.2% plastic deformation as
a result of an applied stress of 320 MPa and 350 MPa, respectively. Data from the arrays
of micro-indents produced on both samples are presented in Figure 94 in the form of a
hardness map with a darker shade showing increased hardness. Values derived from the
hardness map distribution data for the unloaded and loaded state are given in Table 21.
Significant increase in material hardness has not been detected at plastic strain levels of
0.5 and 1.2%.

Chapter 7: Material characterisation and microstructural analyses
170
Figure 92 Micro-hardness measurements on as-received 316H header material with
schematic of sample geometry superimposed on the diagram showing the variation in
hardness during incremental straining at different regions along the gauge.
Figure 93 Evolution of hardness as a function of plastic deformation along with the fitted
second order polynomial regression model.

Chapter 7: Material characterisation and microstructural analyses
171
(a)
(b)
Figure 94 Micro-hardness maps of dog-bone samples loaded to a stress of (a) 320 MPa,
and (b) 350 MPa. Indent spacing was 250 μm in both directions for each test.
Table 21 Hardness map distribution data for the unloaded and loaded state; values are
consistent with Figure 93.
Micro-hardness,
Hv 0.2
Loading stress, MPa
0 320 350
Mean 179 177 175
Minimum 152 154 141
Maximum 211 241 216
Standard deviation 15.8 14.4 13.7
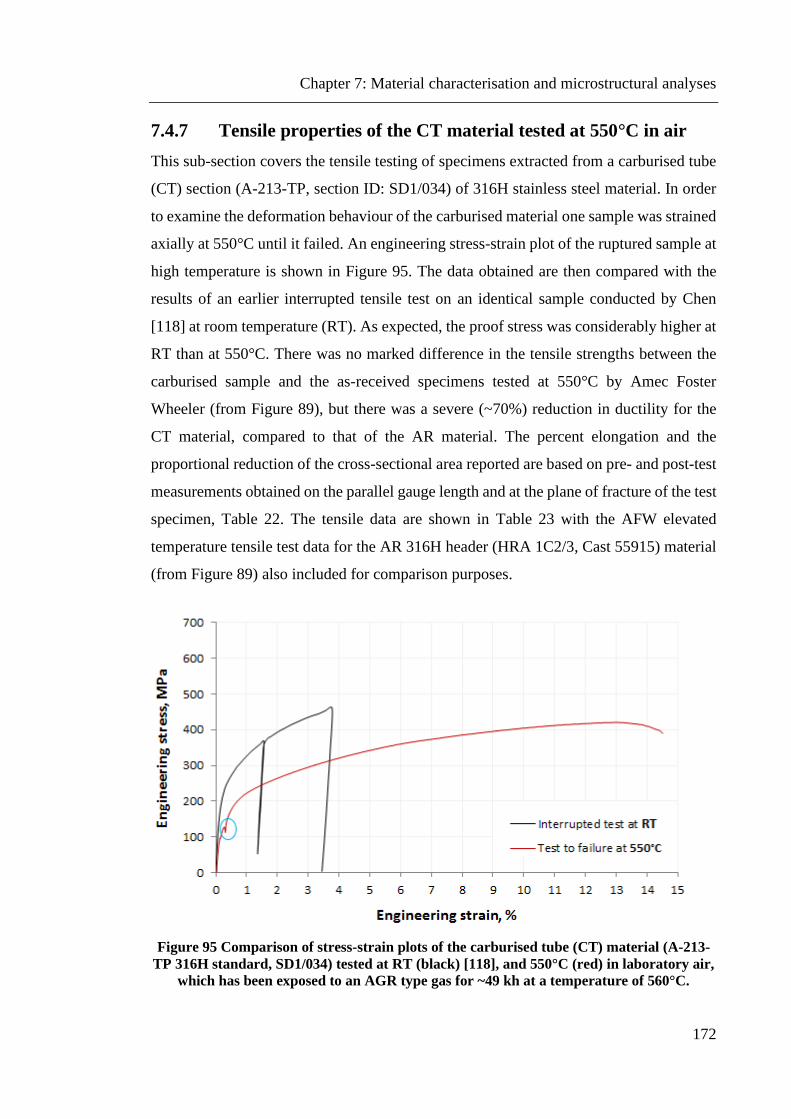
Chapter 7: Material characterisation and microstructural analyses
172
7.4.7 Tensile properties of the CT material tested at 550°C in air
This sub-section covers the tensile testing of specimens extracted from a carburised tube
(CT) section (A-213-TP, section ID: SD1/034) of 316H stainless steel material. In order
to examine the deformation behaviour of the carburised material one sample was strained
axially at 550°C until it failed. An engineering stress-strain plot of the ruptured sample at
high temperature is shown in Figure 95. The data obtained are then compared with the
results of an earlier interrupted tensile test on an identical sample conducted by Chen
[118] at room temperature (RT). As expected, the proof stress was considerably higher at
RT than at 550°C. There was no marked difference in the tensile strengths between the
carburised sample and the as-received specimens tested at 550°C by Amec Foster
Wheeler (from Figure 89), but there was a severe (~70%) reduction in ductility for the
CT material, compared to that of the AR material. The percent elongation and the
proportional reduction of the cross-sectional area reported are based on pre- and post-test
measurements obtained on the parallel gauge length and at the plane of fracture of the test
specimen, Table 22. The tensile data are shown in Table 23 with the AFW elevated
temperature tensile test data for the AR 316H header (HRA 1C2/3, Cast 55915) material
(from Figure 89) also included for comparison purposes.
Figure 95 Comparison of stress-strain plots of the carburised tube (CT) material (A-213-
TP 316H standard, SD1/034) tested at RT (black) [118], and 550°C (red) in laboratory air,
which has been exposed to an AGR type gas for ~49 kh at a temperature of 560°C.

Chapter 7: Material characterisation and microstructural analyses
173
The curious feature highlighted on the high temperature stress-strain curve at ~0.25%
strain is most likely due to dynamic strain ageing, a phenomenon often observed in Type
316 stainless steels [119]. This behaviour is characterised by an initially high yield stress
followed immediately by a sudden drop in stress (lower yield strength) with continued
straining and then the deformation proceeds uniformly with positive strain hardening. An
explanation involves the mechanism of how dislocations break free of the interstitial
atoms (in steels, typically carbon and nitrogen), a localised process which produces the
so called Lüders bands (also known as "slip bands"), which in turn propagate until they
cover the whole specimen, manifested in a serrated yielding of the test material.
Table 22 Pre- and post-test dimensional analyses for the tensile specimen of carburised
tube (CT) material (A-213-TP 316H standard, SD1/034) strained to failure at 550°C.
Measurements Gauge
width,
mm
Gauge
thickness,
mm
Parallel gauge
length,
mm
P2P
length,
mm
Overall
length,
mm
Pre-test 1.513 4.311 15.009 18.988 44.948
Post-test 1.120 3.745 17.147 21.392 47.359
Table 23 Tensile data for the carburised tube (CT) material (A-213-TP 316H standard,
SD1/034) and the AR header material (HRA 1C2/3, 316H, Cast 55915) obtained from tests
carried out at the UOM and AFW [103] at both RT and 550°C.
Lab Sample
ID
Test
temp.
°C
Young's
modulus,
GPa
0.2%
proof
stress,
MPa
UTS,
MPa
Elongation
to failure,
%
Reduction
in area,
%
UOM
Carburised tube (CT) material (A-213-TP 316H standard, SD1/034)
Interrupted RT 149 251 - - -
To failure 550 118 126 421 14.2 35.6
AFW
As-received (AR) header material (HRA 1C2/3, 316H, Cast 55915)
CT2
550 Unavailable
178 458 43.8 36.7
AT2 190 459 51.0 45.0
AT7 180 470 50.5 47.0

Chapter 7: Material characterisation and microstructural analyses
174
7.4.8 Strain analysis on the CT material tested at 550°C in air
Further valuable data were extracted from the tensile experiment on the specimen of CT
material strained to failure at 550°C by determining the ductility of the surface based on
the crack separation and crack width observed on the outer surface of the carburised
sample, shown in Figure 96. Considering the initial parallel gauge length (PGL) of
approximately 15 mm and the mean periodicity of the cracks (Pc) being calculated as
~180 µm, the number of cracks (Nc) was determined as follows:
15.009
830.18
c
c
PGLN
P= = (29)
The level of the global plastic strain to failure measured on the parallel gauge was around
14.2%, resulting in an overall extension of the gauge (Δl) of 2.138 mm. The average crack
width (Wc) calculated was ~20 µm. Then the elongation of the surface oxide (Δlox) was
determined by the following equation:
( ) 2.138 (83 0.02) 0.47 mmox c cl l N W = − = − = (30)
The surface ductility obtained corresponds to approximately 3.1% plastic deformation,
which is the equivalent of the strain required for the cracks to be visible.
Figure 96 Optical montage showing the outer surface on one half of the fractured tensile
specimen of CT material (A-213-TP 316H standard, SD1/034) after 14.2 % plastic
deformation at 550°C, with examples of crack width and crack spacing measurements.
Chapter 7: Material characterisation and microstructural analyses
175
7.5 Discussion
7.5.1 Influence of microstructure on creep behaviour of as-received
(AR) 316H header material
Test results for samples ACS06 and ACS08 of as-received (AR) 316H header material
showed significantly different creep behaviour with comparable microstructure between
the specimens but in different regions. Both microstructures revealed randomised and
large grain size variations occurring in clusters, mainly with a mixture of recrystallised
and fine grain structure. The bimodal grain distribution, comprising of small (~50 μm)
and some mm scale grains, could be as a result of partial recrystallisation during hot
forging which in association with the distribution of banded regions within the
microstructure might well be a possible explanation for the observed discrepancy in creep
performance. There is a suggested grain size dependence of dislocation creep [120],
whereby large grains (less boundaries and hence fewer major obstacles for dislocation
motion) allow for faster creep rates. Considering intergranular cracking combined with
the abnormal grain distribution and its variation among different regions may also explain
why one sample creeps faster than the other. While data exist on the manufacture of the
test material, these have not been interrogated as part of this work, with the exception of
a few key instances. Therefore, it is recommended that this data, along with any
manufacturing process information be collated for further analysis of the data presented
in this thesis.
There was a relatively low hardness variation observed throughout the thickness of the
baseline material examined, with a reduction in Vickers hardness from the outside
towards the inside of the header section in the radial direction of approximately 10%.
Slight variations in hardness were also found along the height of the header section in the
axial direction where the mean hardness of the bottom area appeared to be ~3% lower
than for the middle and top regions. The inhomogeneous microstructure and mechanical
properties however did not correlate with the crept sample behaviour, but provide a
landscape for further examination of creep samples. It is also worth noting that the
chemical composition of ACS06 was very similar to the baseline element composition of
the test material, and hence it is believed that bulk chemical composition played little (or
no) role in the differing creep behaviour observed here.

Chapter 7: Material characterisation and microstructural analyses
176
7.5.2 Effect of strain rate on the RT tensile performance of the AR
316H header material
Tensile testing on as-received (AR) 316H specimens resulted in a variation in the material
properties with loading rate where the sample strained at a lower rate had a slightly greater
yield strength than those strained at a higher rate. In general, alloys experience an increase
in yield strength with increasing strain rate. Experimental studies conducted on grade
304L and 316L austenitic steels by Desu et al. [121] at temperatures ranging from 50°C
to 650°C and different strain rates however showed that the mechanical properties
obtained do not follow any particular trend. At low temperatures both yield strength (σy)
and ultimate tensile strength (UTS) of 316L material were found to decrease significantly
with increasing strain rates, whereas grade 304L steel had an increased value of σy and a
constant UTS for higher rates. In the present study, other than the strain-rate effect, this
behaviour may also be attributed to the observed alteration in the microstructure of the
test material as a result of long term thermal ageing while in service. For example, a
heterogeneous distribution of second phase particles and intermetallics formed during
prolonged ageing can lead to preferential embrittlement in the microstructure which could
readily be responsible for the reduced tensile ductility observed on both samples strained
to failure when compared with the AFW specimens of the same orientation. Although the
specimens were all extracted from the same donor material, a variation in microstructure
within the bulk of the section itself is thus conceivable.
7.5.3 Effect of strain on material properties
The effect of strain on hardness was tested at RT on a number of identical dog-bone
specimens of low and high level of plastic deformation. The shape of the engineering
stress-strain curves in Figure 88, for example, indicates that strain hardening occurs
throughout the entire loading period at a decreasing rate with increasing stress. This has
been confirmed by the hardness data obtained from the interrupted tensile testing where
the most significant increase in hardness occurred at the start of straining with up to ~80%
increase at failure. Considerable material hardening at plastic strain levels less than ~2%
however has not been observed.
During cold-work, the number of crystalline defects such as dislocations and porosity
increases with the degree of deformation due to the multiplication of the existing
Chapter 7: Material characterisation and microstructural analyses
177
dislocations and/or the formation of new dislocations. This is thought to be more
predominant at grain boundaries and other surface irregularities which act as stress raisers
and readily serve as dislocation formation sites. Consequently, the overall distance
between dislocations decreases and the stress fields surrounding the dislocations interact
with other dislocations to become tangled and pinned. As the dislocation density
increases, the magnitude of resistance to dislocation motion becomes more pronounced
and more force is subsequently required to further move these dislocations resulting in an
increase in hardness with increasing cold work.
Another mechanism by which cold working increases the material hardness is through
the transformation of γ-austenite, an FCC crystal structure, into α’-martensite (BCC) and
ε-martensite (HCP), as reported by Reed [122]. During work hardening the austenite
structure becomes less stable and breaks down to the much stronger but less ductile
martensite phase. It has been found by numerous researchers that the extent of the
martensite formation is strongly affected by various factors, such as steel chemical
composition, amount of plastic deformation, strain rate, deformation temperature and
grain size of the austenitic phase [123–125].
These complex microstructural changes and internal state manifestations are further
influenced by the temperature and stress gradients, especially during creep deformation.
When a material is deformed at higher temperatures and stresses, dislocations can move
around obstacles by either ‘glide’ or ‘climb’. It is through these mechanisms that the
dislocations rearrange and little strengthening is achieved as the effects of the initial work
hardening are eliminated during the recovery stage. The higher density of dislocations
due to increase in plastic strain however may not fully recover prior to creep deformation
creating more opposition to dislocation movement, upon which the creep rate is reported
to decrease [126]. At this stage, however, it remains difficult to link the aforementioned
mechanisms to the anomalous creep response observed at 550°C. For improved
understanding, the strain hardening behaviour of the as-received 316H header material at
elevated temperatures should be further investigated.

Chapter 7: Material characterisation and microstructural analyses
178
7.5.4 Carburisation behaviour of Type 316H stainless steel in a
simulated AGR environment
This work focused on quantifying the severity and depth of carburisation, as a function
of the environmental conditions, on a tube component (A-213-TP 316H standard,
SD1/034) exposed to AGR type coolant for ~49 kh at a temperature of 560ºC. It is widely
believed that carburisation only occurs when the chromia film present at the start of life
is broken down and a duplex oxide starts to grow. In austenitic stainless steels the
persistence of the thin protective chromia layer is strongly dependent on the extent of
chromium diffusing outwards via the grain boundaries. However, the continued
consumption of chromium eventually leads to chromium depletion in the subregion
resulting in the breakdown of the protective chromia layer. The spinel formation therefore
takes place whereby iron diffuses outwards to form the magnetite. The existence of this
permeable oxide layer has been observed on both the OD and the bore cross sectional
surfaces with no healing layer being present underneath. Experimental work has
demonstrated that at temperatures ranging from 480°C to 600°C a healing layer (a silicon-
chromium rich layer) may never form [81]; therefore carburisation was expected to be
severe.
Micro-indentation revealed an exponential decay distribution of the hardness profile to
an extent of ~500 μm beneath the outer surface with a mean peak hardness of ~500 Hv
(bulk value of ~150 Hv) recorded at the metal-oxide interface. The severe elevation in
hardness is believed to result from the sudden increase of carbon concentration near the
surface due to the initial rapid oxidation rates [127]. However, as oxidation rates drop, so
does the degree of carbon ingress, thus the concentration may decrease with time as the
carbon diffuses into the material. This is approximately consistent with observations on
experimental oxidation specimens where exposures of 20 to 50 kh indicated greater
values of peak hardness than for specimens with over 100 kh exposure [14]. Note that the
observed depth of 500 μm only reflects the elevated hardness and it is likely that the
carburised region extends beyond this region. This can be further supported by the
extensive carburisation observed down grain boundaries at even greater depths. The
darker and thicker grain boundaries noted on the micrographs suggest sensitisation and
carburisation have occurred with the formation of chromium carbides. The carbon

Chapter 7: Material characterisation and microstructural analyses
179
compounds from the AGR type gas are able to penetrate through the porous duplex oxide
layer; the high temperatures during exposure enable thermodynamics to drive
carburisation which leads to the formation of these carbides. The carbon that diffuses into
the underlying microstructure is insoluble and remains at the grain boundaries; the
chromium that exists adjacent to the grain boundaries precipitates to form the chromium
carbides, explaining the thickening of grain boundaries.
Etching of the carburised material revealed a bimodal grain structure for both the OD and
the bore with grains up to 250 μm diameter and an average grain size of ~50 μm. Grain
size is another important factor affecting oxidation growth rates. It is evident that
diffusion of reactants along grain boundaries is faster than through the bulk material.
Chromium is able to diffuse out of smaller grains quicker because of the shorter distances
to travel; grain boundaries act as a diffusion path for chromium to reach the surface which
hinders oxide growth and also promotes the possible formation of a healing layer.
Therefore, larger grains mean fewer grain boundaries hence less outward diffusion of
chromium, resulting in poor oxidation properties. It is expected that materials with large
grains are more prone to carburisation experiencing more extensive duplex oxide growth
[14]. It has also been observed that for the formation of an external chromia layer, finer
grained materials require less chromium content than those with larger grains [100].
The existence of small grains however is not preferred for creep resistance. When the
grain size is relatively small (<50 μm), creep by grain boundary sliding or cavity
nucleation and growth can occur more readily [127], resulting in voids being generated
at grain boundaries, which is related to the initiation of creep rupture. Also, in diffusion
creep (not dominant at these temperatures) the creep rate is inversely proportional to the
grain size [62]. The atoms diffuse through grains and along grain boundaries to elongate
the grains along the stress axis; diffusion distances are shorter in fine-grained materials,
which thus tend to be more susceptible to creep. As a result, it is expected that a material
more prone to carburisation (large grains) creeps slower. Therefore, carburisation
properties and creep properties are not independent but correlated. For that reason, in
assessments it would be over-conservative to assume the worst material properties in both
cases. Nevertheless, a moderate grain size distribution would presumably favour both
carburisation and creep resistance of the material.

Chapter 7: Material characterisation and microstructural analyses
180
Although there are no cracks visible in the microstructure, an increased hardness due to
the duplex oxide formation and carburisation can however lead to premature crack
initiation. It has been confirmed by Chen et al. [9] that grain boundary embrittlement in
carburisation not only reduces the tensile ductility of the material but also reduces its
creep resistance; a reduced creep resistance can therefore reduce the resistance to crack
initiation. As failure of this material occurs mostly on grain boundaries, it is expected that
the density and morphology of these second phases on grain boundaries is likely to control
the resultant material properties and is therefore an important feature to consider.
7.5.5 Tensile ductility of the carburised 316H tube material
From the tensile testing conducted on carburised material at 550°C the failure strain of
14.2% for the material corresponded with ~3.1% plastic deformation of the surface layer.
This does indicate that the tensile ductility of the outer surface tended to be much lower
than the ductility of the bulk material during straining at high temperature. The reduced
tensile ductility was likely due to the brittle carbide phases which form on grain
boundaries (grain boundary embrittlement) in carburisation. Such a significant decrease
in the tensile ductility of the surface layer led to extensive surface crack formation. It is
assumed that carburisation had a strong effect on the tensile ductility of the material by
significantly reducing its resistance to crack initiation, which in turn led to a severe
(~70%) reduction in the global strain of the carburised material when compared to as-
received 316H material. This further suggests that crack initiation within the oxide layer
may well have occurred in the early stages of the plastic deformation, perhaps at levels
below or around 1% plastic strain. Since only a single tensile test has been conducted, it
is difficult to make any definitive statement about the ductile behaviour of carburised
316H material, thus more evidence is needed. Although the tensile ductility is not required
in the proposed assessment methodology [14], these data provide a useful input for further
testing using this material.

Chapter 7: Material characterisation and microstructural analyses
181
7.6 Conclusions
1. The baseline microstructural examination of the parent 316H header material and
the crept samples showed variations in both the grain size and hardness. Hardness
difference however was not consistent enough to explain the observed discrepancy
in creep response, whereas the massive grain distribution with banded regions within
the microstructure may well account for the divergence in performance on the creep
samples examined.
2. EDX spectroscopy measurements of the crept AR sample showed no significant
alteration in the alloy element distribution indicating that chemical composition had
no role in the anomalous creep behaviour reported.
3. Large plastic strains resulted in an approximately 80% increase in surface
hardness on the as-received 316H material deformed at room temperature. Such
elevation in hardness is explained in terms of the increase of dislocation density
during cold working and also in terms of the impact of the microstructural changes
that the material underwent during service ageing.
4. Interrupted tensile testing also revealed that hardness increases the most during
the initial stage of straining but with insignificant material hardening at lower plastic
strains (< 2% plastic deformation). No correlation has been made for the strain
hardening behaviour and the anomalous creep response of the test material.
5. Additional characterisation and microstructural examination of the carburised
316H tube material reinforced the already existing concepts of carburisation and its
effect on material behaviour. Changes in hardness values in the near surface region
up to about three times greater than for the bulk material suggest a higher strength,
brittle surface layer that is more susceptible to cracking.
6. Data obtained from the characterisation studies on the carburised tube material
evaluated the extent of carburisation to a depth of approximately 500 microns, similar
to typical depth values of 300 to 500 µm observed on related ex-service and
experimental specimens.

Chapter 7: Material characterisation and microstructural analyses
182
7. Carburisation has been observed to be more pronounced at grain boundaries,
hence occurs more rapidly down grain boundaries than within grains, and presumably
to depths greater than those identified.
8. Grain size may also influence carburisation with larger grains experiencing more
extensive duplex oxide growth but lower creep rates than materials with relatively
small grain sizes; hence carburisation properties and creep properties are strongly
correlated.
9. Results of the tensile test to failure at 550°C on the carburised 316H tube material
led to an estimate that initiation of surface cracks within the oxide layer occurs at
around 1% plastic strain. As a consequence of premature cracking, the carburised
material had a significantly lower tensile ductility than the uncarburised material.

Chapter 8: Oxidation/carburisation of Type 316H SS in a simulated AGR environment
183
8. Oxidation and carburisation studies under uniaxial
loading conditions at 550°C in CO2/CO environment
In this chapter oxidation and carburisation studies of Type 316H austenitic stainless steel
subjected to uniaxial loading conditions in a CO2 based environment at 550°C at
atmospheric pressure are reported. The impact of surface finish on environmental
interactions along with the effects of stress and strain on the oxide development and
carburisation characteristics of 316H material under simulated AGR conditions have been
investigated.
8.1 Introduction
The oxidation behaviour of Type 316H SS can depend on many factors, including stress
[82], strain and surface preparation [98, 128, 129]. For instance, the effect of surface finish
on the oxidation behaviour of Type 316H stainless steel has been investigated in a recent
study by Chen et al. [76] after exposure at 550°C for 500 h in CO2 based environments
containing 1% CO and different contents of H2O (0%, 300 vppm and 3%). It was found
that OPS polished samples form thick duplex oxide layers in contrast with the thin oxide
scale formed on 600-grit SiC ground stainless steel specimens and that the addition of
H2O into the gas mixture enhanced the oxidation rate for both OPS polished and 600-grit
SiC ground surfaces. Whilst the role of plastic deformation on oxidation has been widely
studied for stainless steels in other environments [106, 128, 130], its implications on
oxidation and carburisation behaviour in an AGR type environment remains unclear. It
was nonetheless believed that tensile loading and plasticity can accelerate the diffusion
process that lead to carburisation [72]. However, the involvement of active stress, plastic
deformation during loading and creep deformation during service on oxidation and
carburisation are still not fully understood. Therefore, it is important to further examine
and understand the stress-assisted oxidation/carburisation behaviour of Type 316H SS in
a CO2 based high temperature environment.

Chapter 8: Oxidation/carburisation of Type 316H SS in a simulated AGR environment
184
8.2 Aims and objectives
This study aims at investigating the oxidation and carburisation susceptibility as a
function of stress, strain and surface preparation of Type 316H stainless steel in a
simulated AGR environment, in order to be able to develop accurate predictive models
aimed at assessing the ageing of AGR reactors. In fact, oxidation and carburisation are
two interconnected processes whereby the formation of a protective oxide can also
prevent carburisation. However, the plastic deformation and dynamic strain associated
with creep, can affect the integrity of the oxide.
Therefore, the above aims raise the following core project objectives:
• To characterise the morphology and evolution of the oxide scale on differing (OPS
polished and 600-grit ground) surfaces.
• To determine the effect of creep on the formation and disruption of the oxide scale,
as well as on carburisation and associated hardening.
8.3 Experimental details
8.3.1 Material and sample preparation
The samples used to carry out this study were from the same batch of 316H header
material (HRA 1C2/3, Cast 55915, off-cut MT0920/12) as those used for tensile testing
with identical standard dog-bone geometry and an as-received (AR) microstructural
condition (see Figure 66 in Chapter 7 – Section 7.3.1.1 for specifications). In addition,
one specimen had a tapered instead of a straight gauge section with a gradual increase in
width from 3 mm at the narrowest part to 5 mm at the wider end of the 12 mm gauge.
Both the conventional and tapered creep samples, shown in Figure 97, had the same
nominal thickness of 1.2 mm. The main advantage of using a width-tapered sample is that
it is a multivariate approach in which, under a constant load, not only the stress but also
the strain and the strain rate vary over the gauge length. Specifically, the stress, strain and
the strain rate are highest in the smallest cross-section region and they decrease gradually
as the cross sectional area increases [128].

Chapter 8: Oxidation/carburisation of Type 316H SS in a simulated AGR environment
185
Figure 97 Schematic drawing of specimens of AR 316H header material with conventional
gauge (left) and taper geometry (right) used for oxidation and carburisation tests under
stress. The dimensions are in (mm).
In each experiment, samples had a 600-grit SiC ground on one side and a colloidal silica
OPS polished surface finish on the opposite side so that it was possible to have a direct
comparison on the effect of surface preparation. OPS polishing was selected to obtain a
surface representative of the bulk and therefore free of a work hardened and ultrafine
grained surface layer [99, 129]. This procedure is conventionally used as an alternative to
electropolishing to create strain-free (mirror) surfaces [99, 105], and it is suitable for
surface sensitive techniques such as electron back scattered diffraction (EBSD) analysis
[106]. These two surface finishes were not aimed at representing an engineering condition
but were chosen for mechanistic understanding purposes based on previous studies [76,
84], where surface finish has proven to be significant in the early stages of oxidation and
probably carburisation.

Chapter 8: Oxidation/carburisation of Type 316H SS in a simulated AGR environment
186
8.3.2 Oxidation and loading system
A schematic representation of the rig used for the exposure is shown in Figure 98. This
consists of a manual sample loading mechanism and a double walled reaction tube placed
in a tube furnace.
Figure 98 Schematic representation of the stress rig and double walled reaction tube
system used to expose samples in atmospheric CO2 environment at 550°C under load.
The samples for the oxidation tests under stress were mounted into a calibrated horizontal
loading mechanism (see Chapter 5 for design and operational specifications), then sealed
inside a double-walled quartz reaction tube and placed into a tube furnace. The heat output
of the furnace was regulated by a three-zone control system and the temperature was
controlled via feedback from thermocouples within ± 1ºC. The gases were mixed using
calibrated flow meters linked to a digital controller before being injected into the outer
wall of the reaction tube where later it was pre-heated. The mixed gases then streamed
from the back into the inner space of the reaction tube where the oxidation sample was
placed. The gasses were then sent into a jar bubbler filled with water that had the role of
preventing possible backflow of oxygen, before being discharged into the fume cupboard.
The total gas flow rates in the oxidation system were set to either ~2.2 L/h or 4.5 L/h,
giving a refresh rate of 0.625 and 1.285 times per hour, respectively. To purge the system
of air the gas mixture was left to flow to an amount equal to about 10 times the volume
of the oxidation system prior to heating the samples.
The gas environment selected was 1% CO/CO2 + 300 vppm H2O, which is representative
of a typical AGR coolant gas [131], although the experiments were conducted at
Chapter 8: Oxidation/carburisation of Type 316H SS in a simulated AGR environment
187
atmospheric conditions rather than at elevated pressures. The water content in the gas was
obtained by bubbling the CO gas only through a jar bubbler which contained distilled
water that was kept at room temperature. Given the vapour pressure at 20°C and the ratio
of mixing the CO and CO2 gases (volumetric fraction of 1% CO / 99% CO2), it was
possible to achieve a nominal value of 300 vppm H2O introduced into the system. Water
vapour has been shown to accelerate the growth of both Cr2O3 and duplex oxides [132–
137]. Calculating the oxygen partial pressure 2
( )OP however was unattainable since the
equilibrium 2 2
/H H OP P ratio was unknown and the gases are in dynamic equilibrium [73].
Nonetheless, it is reasonable to assume that the addition of water into the 1% CO/CO2
oxidation environment leads to a higher oxygen partial pressure due to the larger value of
Gibbs free energy for the H2O reaction compared with that for the CO2 reaction [138].
Once the reaction chamber was purged, the furnace was brought to a stable temperature
of 550°C and the samples were loaded to a stress of 350 MPa and left exposed to the
simulated AGR environment. In one test, in order to understand the effect of pre-straining
on oxidation in the absence of stress, the sample was loaded at high temperature,
subsequently unloaded and oxidised. During the tests strain was recorded using two
LVDT sensors attached to the pulling rod, whilst the temperature of each test specimen
was monitored by a calibrated Type N thermocouple positioned as close as practically
possible (~1 mm) to the specimen gauge. The data were then recorded in a test file
envelope so the stress-strain and creep effects on the oxidation and carburisation
behaviour of the test material could be separated and combined after the experiments.
8.3.3 Testing conditions
All the oxidation and creep tests were conducted at 550°C at atmospheric pressure under
a load equivalent to a nominal stress of 350 MPa applied on each sample. The stress of
350 MPa used in the present study is considerably greater than those of the plant operating
load conditions and has been selected to accelerate the effects of stress and strain on the
material-environment interaction. Also, the micro-hardness data obtained on the tensile
specimens strained to 0.5% and 1.2% as a result of an applied stress of 320 MPa and 350
MPa, respectively, showed no significant difference in the RT strain hardening behaviour
of the AR 316H test material (see Section 7.4.6 in Chapter 7), and so the higher stress
Chapter 8: Oxidation/carburisation of Type 316H SS in a simulated AGR environment
188
was preferable. Nonetheless, this high stress-temperature region selected corresponds to
a deformation mechanism via dislocation creep (power law creep) [54], which is the
primary focus of this study.
8.3.4 Operating procedure, start-up and shut-down
The procedure to conduct the experiment was as follows:
1. The quartz double walled reaction tube was degreased with acetone, rinsed with
de-ionised water and dried.
2. The sample was carefully mounted into the stress rig with a thermocouple inserted
~1 mm close to its gauge, pre-loaded with the weight hanger so that the loading system
was taut and placed inside the double walled reaction tube, then a glass plug was securely
stowed in the end of the tube and sealed with silicone grease.
3. Once inside the tube furnace, the system was purged with the experimental gas;
depending on the selected flow rate, purging usually lasted a maximum of 18 hours.
4. After the purging, the sample was heated up to stable 550°C, data acquisition was
started and the calculated test load was then applied manually by the addition of slotted
weights to the hanger. At this time the experiment was considered to have started.
5. The elongation of the sample was recorded during the entire experiment by the
two LVDTs positioned on the pulling rod. The LVDTs were ordinarily set to readings
within the displacement range measured during calibration.
6. When the exposure time had elapsed, between 10-20% of the test load was
removed prior to switching off the furnace; the mixed gas however was left flowing in
order to avoid condensation during cooling of the system. The remainder of the load was
then removed after cooling the test specimen to ambient temperature. The sample was
then carefully removed from the rig for examination.

Chapter 8: Oxidation/carburisation of Type 316H SS in a simulated AGR environment
189
8.3.5 Technical limitations
Some technical limitations related to the methodology of this study are reported here.
Although the technical opportunities were sufficient to make significant gains possible,
crucial limitations of the research included carrying out testing at atmospheric pressure
and at high stresses/strains. To determine whether the findings are relevant to plant
applications, consideration needs to be given to the effects of a pressurised gas
environment, loading at lower stress/strain levels and over longer periods. This poses
significant experimental challenges; future work therefore will be aimed at addressing
some of the shortcomings of the current experiments and extending the ideas explored
here.
Strain during testing is recorded externally based on displacement measurements of the
pulling rod, which only provides a measure of overall deformation instead of the
elongation of the gauge alone of a test specimen. The strain calculations here assume the
same initial cross sectional area of the gauge for the non-uniformly deformed fillet radius
regions as well. Therefore both monotonic and creep deformation plots show higher
strains (up to 4%) than the degree of deformation determined by post-test geometric
measurements on the parallel gauge of a sample. However, the data presented are not
meant to be a precise measure but rather an indicative figure for the evolution of the creep
strain during testing.
8.3.6 List of oxidation tests
A total of six tests have been performed at 550°C in a CO2-based environment on as-
received 316H material under different experimental conditions, reported in Table 24.
Test #1 was conducted to isolate the effect of creep deformation; therefore the sample
was only briefly loaded to 350 MPa at 550°C to introduce plastic deformation, but then
unloaded and oxidised with no stress, and hence no creep, for 500 h. Test #2 was
conducted for only 100 h after the sample was stressed to a nominal initial stress of 350
MPa in order to investigate the initial stage of oxidation and carburisation. Tests #3 to 6
were performed in a similar manner as Test #2 but with 500 h exposure to the selected
gaseous environment and with one specimen having tapered gauge geometry (Test #6).
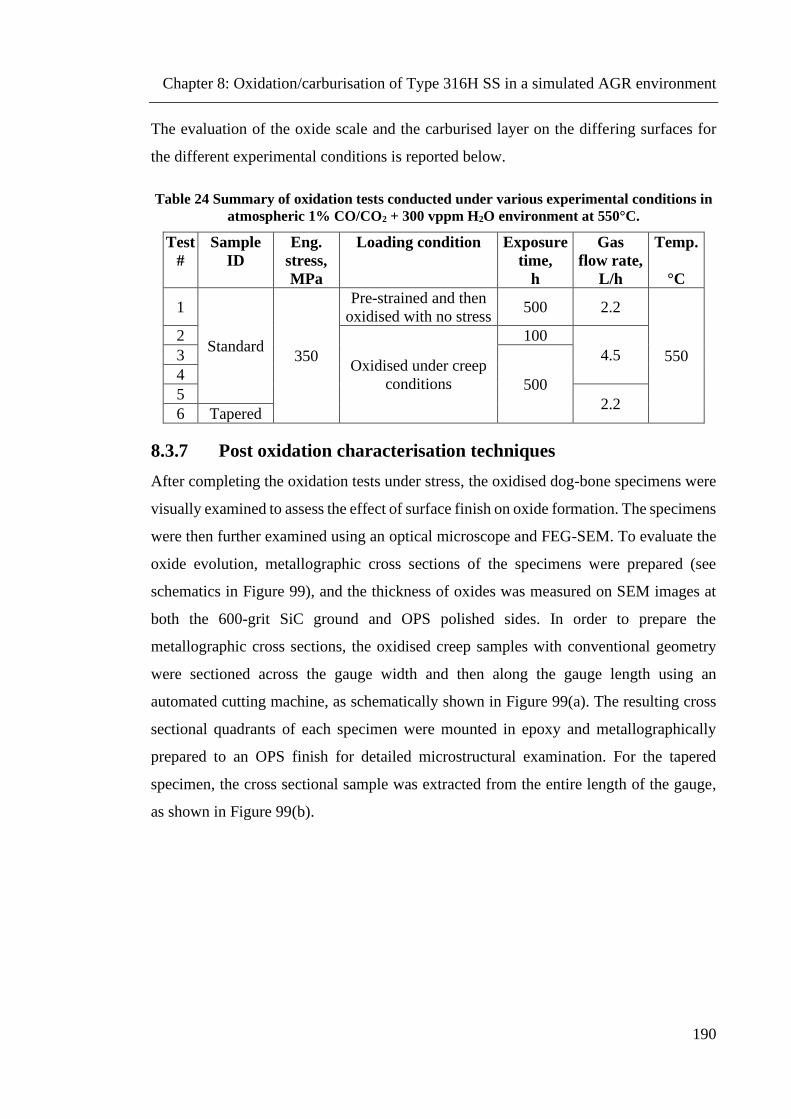
Chapter 8: Oxidation/carburisation of Type 316H SS in a simulated AGR environment
190
The evaluation of the oxide scale and the carburised layer on the differing surfaces for
the different experimental conditions is reported below.
Table 24 Summary of oxidation tests conducted under various experimental conditions in
atmospheric 1% CO/CO2 + 300 vppm H2O environment at 550°C.
Test
#
Sample
ID
Eng.
stress,
MPa
Loading condition Exposure
time,
h
Gas
flow rate,
L/h
Temp.
°C
1
Standard 350
Pre-strained and then
oxidised with no stress 500 2.2
550
2
Oxidised under creep
conditions
100
4.5 3
500 4
5 2.2
6 Tapered
8.3.7 Post oxidation characterisation techniques
After completing the oxidation tests under stress, the oxidised dog-bone specimens were
visually examined to assess the effect of surface finish on oxide formation. The specimens
were then further examined using an optical microscope and FEG-SEM. To evaluate the
oxide evolution, metallographic cross sections of the specimens were prepared (see
schematics in Figure 99), and the thickness of oxides was measured on SEM images at
both the 600-grit SiC ground and OPS polished sides. In order to prepare the
metallographic cross sections, the oxidised creep samples with conventional geometry
were sectioned across the gauge width and then along the gauge length using an
automated cutting machine, as schematically shown in Figure 99(a). The resulting cross
sectional quadrants of each specimen were mounted in epoxy and metallographically
prepared to an OPS finish for detailed microstructural examination. For the tapered
specimen, the cross sectional sample was extracted from the entire length of the gauge,
as shown in Figure 99(b).

Chapter 8: Oxidation/carburisation of Type 316H SS in a simulated AGR environment
191
(a) (b)
Figure 99 Schematic representation of the cross section samples of tensile specimens with
(a) conventional and (b) taper gauge indicating the regions of interest where the
microstructural and hardness examinations were conducted. For consistency and clarity
purposes the same colour-code is used for presenting relevant hardness data.
The surface of interest on each section of the standard creep specimens was investigated
in two distinctive regions: in the gauge section where the nominal engineering stress was
350 MPa (Region 1, Figure 99(a)) and away from the gauge towards the shoulder of the
sample (Region 2, Figure 99(a)) where low stresses (~80 MPa) were expected to be
present. Note that the samples were loaded using a pin and clevis configuration, however
Region 2 was away from the zone influenced by the loading grips. As for the tapered
specimen, the regions examined were at the smallest section (highest strain and strain
rate), middle and largest section of the gauge with nominal stresses of 350 MPa,
~280 MPa and ~210 MPa, respectively, as indicated in Figure 99(b).
Any change in surface hardness due to the exposure of materials to simulated AGR gases
was assessed from metallographic cross sections using a combination of nano- and micro-
hardness measurements. In this way it was possible to quantify the depth to which the
material properties are modified as a result of carburisation. The nano-indentation
technique provided higher resolution and was used on the second test specimen (Test #2)
only since any possible change in hardness in the outer-most subsurface was expected to
occur to a small extent in depth due to the short (100 h) exposure time. Three series of
nano-indents were made across the section width of both Regions 1 and 2, starting at
5 μm distance from the metal-oxide interface, with 5 μm indent spacing in the y direction
to a depth of 100 µm at both the 600-grit ground and OPS polished sides, and 40 μm steps

Chapter 8: Oxidation/carburisation of Type 316H SS in a simulated AGR environment
192
for the intermediate bulk material. Plots were then generated from the mean nano-
hardness values of the three series measured in the two regions.
All the other samples were subjected to micro-indentation by a Struers DuraScan 80 auto
hardness tester at a load of 0.098 N (10 grams). To identify the depth of material with any
hardness increase, five series of 3 columns of micro-indents with diagonal patterns were
made on the cross sectional surface of the sample on either side, at each region of interest.
The distance between the series was set to 500 μm with a resolution of 40 µm and 10 µm
indent spacing in the x and y direction, respectively, starting at 10 µm distance from the
metal-oxide interface to a depth of 120 µm into the bulk material for both surfaces. The
use of diagonal patterns allowed the Vickers test to have indentations very close to each
other, enabling measurements to show a better trend of the hardness. The bulk hardness
was determined by the mean Vickers-hardness values of the staggered indent patterns
measured in between each surface column with 50 μm and 20 μm indent spacing in the x
and y direction, respectively, at every region examined.
8.4 Results of oxidation studies and discussion
8.4.1 Quantitative evaluation of the inelastic material response
From the strain measurements recorded during testing by the LVDT sensors and the post-
test dimensional analyses conducted on a calibrated shadowgraph, the total inelastic strain
of the oxidation samples subjected to a constant stress of 350 MPa was between ~11%
and ~13%, with creep strains ranging from 0.6% to ~1.8%, depending on experimental
conditions and material behaviour, as reported in Table 25. These are relatively low creep
strain levels and thus all subsequent results presented are relevant to the aforementioned
deformation range.
The hot loading stress-strain curves for the standard creep specimens are shown in
Figure 100, whilst the creep deformation curves and the total strain for samples 2 to 5
plotted as a function of time are shown in Figures 101 and 102, respectively. An overview
of the results, including detailed post-test dimensional analyses, is presented in Appendix-
C1 and C2 for tensile specimens with conventional and taper geometry, respectively.
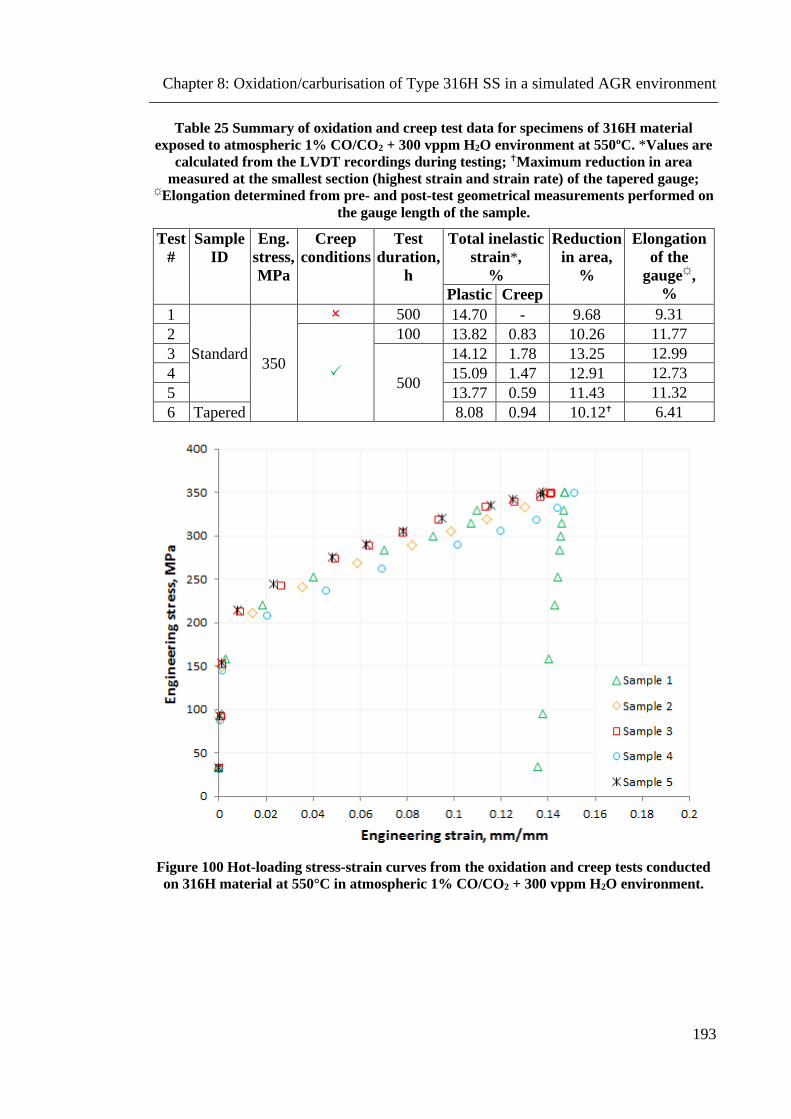
Chapter 8: Oxidation/carburisation of Type 316H SS in a simulated AGR environment
193
Table 25 Summary of oxidation and creep test data for specimens of 316H material
exposed to atmospheric 1% CO/CO2 + 300 vppm H2O environment at 550ºC. *Values are
calculated from the LVDT recordings during testing; Maximum reduction in area
measured at the smallest section (highest strain and strain rate) of the tapered gauge; ☼Elongation determined from pre- and post-test geometrical measurements performed on
the gauge length of the sample.
Test
#
Sample
ID
Eng.
stress,
MPa
Creep
conditions
Test
duration,
h
Total inelastic
strain*,
%
Reduction
in area,
%
Elongation
of the
gauge☼,
% Plastic Creep
1
Standard 350
500 14.70 - 9.68 9.31
2
100 13.82 0.83 10.26 11.77
3
500
14.12 1.78 13.25 12.99
4 15.09 1.47 12.91 12.73
5 13.77 0.59 11.43 11.32
6 Tapered 8.08 0.94 10.12 6.41
Figure 100 Hot-loading stress-strain curves from the oxidation and creep tests conducted
on 316H material at 550°C in atmospheric 1% CO/CO2 + 300 vppm H2O environment.

Chapter 8: Oxidation/carburisation of Type 316H SS in a simulated AGR environment
194
Figure 101 Creep curves obtained for specimens of AR 316H header material tested under
a nominal stress of 350 MPa at 550°C in atmospheric 1% CO/CO2 + 300 vppm H2O
environment.

Chapter 8: Oxidation/carburisation of Type 316H SS in a simulated AGR environment
195
Figure 102 Total inelastic strain as a function of time for the creep specimens of 316H
material exposed to atmospheric 1% CO/CO2 + 300 vppm H2O environment at 550°C.
From the creep strain measurements in Figure 101, it can be seen that there appeared to
be considerable variation in the creep behaviour, both in terms of creep strain and
deformation rate, between the 4 tests performed on conventional creep specimens of as-
received (AR) header material at 350 MPa in an atmospheric CO2 based environment at
550°C. Similar trends in the creep behaviour of this specific 316H header material were
already reported from creep testing at 320 MPa in air at 550°C (see Section 6.3.1.4 in
Chapter 6), wherein much of the divergence in performance on the creep samples
examined was attributed to the bimodal grain distribution within the microstructure
identified in Section 7.4.2. However, as the purpose of this study was to focus on the
oxidation behaviour rather than on the mechanical response, these creep data will not be
discussed in more detail.

Chapter 8: Oxidation/carburisation of Type 316H SS in a simulated AGR environment
196
8.4.2 Post-exposure evaluation of oxidised material degradation
8.4.2.1 Visual appearance of the oxidised samples
The visual appearance of all the samples after testing is reported in Figure 103 for the
OPS polished surface and the 600-grit ground surface finish. Irrespective of experimental
condition, including exposure time and creep, the 600-grit ground surface formed a
brighter and blue-yellowish coloured oxide, exhibiting more intense oxidation on the
plastically deformed gauge, while the OPS polished surface formed a uniform, dark
coloured oxide along the whole length of each specimen.
Test #1
Test #2
Test #3
Test #4
Test #5
Test #6
(a) (b)
Figure 103 Visual appearance of all the oxidation samples tested at 350 MPa in
atmospheric 1% CO/CO2 + 300 vppm H2O environment at 550°C with different surface
preparation: a) OPS polished, and b) 600-grit ground.

Chapter 8: Oxidation/carburisation of Type 316H SS in a simulated AGR environment
197
Post-test optical micrographs of sample 5, which can be considered to be representative
of all specimens, are presented in Figures 104(b), (c) and (e), (f) for both the OPS polished
and 600-grit ground surface finishes in the two regions examined. These are compared to
the pre-experiment optical images taken on the OPS polished and 600-grit ground
surfaces of the same specimen, Figures 104(a) and (d). The grain morphology on the OPS
polished surface prior to exposure is also depicted, Figure 104(a).
Prior testing After 500 h oxidation under stress at 550°C
OPS
(a) (b) (c)
Region 2 Region 1
(σ ≈ 80 MPa) (σ = 350 MPa)
600-grit
(d) (e) (f)
Figure 104 Representative optical micrographs of a specimen prior to and after exposure
as a function of surface preparation: (a, b, c) OPS and (d, e, f) 600-grit ground finish.
(a, d) prior to testing; (b, e) after 500 h exposure in regions with low stress (~80 MPa,
Region 2 in Figure 99(a)); (c, f) after 500 h exposure in regions with high stress (350 MPa,
Region 1 in Figure 99(a)).
The post-experiment OPS surface finish appeared to form a thick and dark oxide scale
along the whole length, Figures 104(b) and (c); tiny brightly imaging features, possibly
corresponding to less oxidised locations in regions where low stresses were present are
also visible, Figure 104(b). The 600-grit ground surface formed a thin yellow tint layer in
the absence of active stress, Figure 104(e) which then transitioned into a darker imaging
one (and therefore presumably thicker too) in the region that was subject to higher stress,
Figure 104(f). However, the 600-grit SiC grinding marks were still visible after oxidation
when compared to the pre-test micrograph, Figures 104(d) to (f).

Chapter 8: Oxidation/carburisation of Type 316H SS in a simulated AGR environment
198
8.4.2.2 SEM cross-sectional examinations: conventional specimens
The oxides formed on the differing surfaces were identified in greater detail via SEM on
the metallographically prepared cross sections. Typical examples of oxide formation at
regions remote from the active stress (Region 2) for both the OPS polished and 600-grit
SiC ground surfaces of the conventional specimens are shown in Figures 105(a) to (j).
These were then compared to the oxides formed at regions where the nominal stress was
350 MPa. Figures 106(a) to (j) show the cross-sectional view at the gauge (Region 1) for
the OPS polished and 600-grit ground surface of the oxidised samples subjected to various
test conditions. Some artefacts associated with the metallographic preparation of the cross
sections are also visible and are indicated where appropriate. The duplex oxide evolution
on both the OPS polished surface and 600-grit ground surface is also presented as a
function of time in Figure 107.

Chapter 8: Oxidation/carburisation of Type 316H SS in a simulated AGR environment
199
σ ≈ 80 MPa OPS polished surface 600-grit ground surface
Test #1 (Pre-strained + 500 h)
(a) (b)
Test #2 (100 h creep test)
(c) (d)
Test #3 (500 h creep test)
(e) (f)
Test #4 (500 h creep test)
(g) (h)
Test #5 (500 h creep test)
(i) (j)
Figure 105 Secondary electron SEM images of the cross-sections of all standard samples
oxidised at ~80 MPa (Region 2 in Figure 99(a)) at 550°C in 1%CO/CO2 + 300 vppm H2O:
(a, c, e, g, i) OPS surface; (b, d, f, h, j) 600-grit ground surface.

Chapter 8: Oxidation/carburisation of Type 316H SS in a simulated AGR environment
200
σ = 350 MPa OPS polished surface 600-grit ground surface
Test #1 (Pre-strained + 500 h)
(a) (b)
Test #2 (100 h creep test)
(c) (d)
Test #3 (500 h creep test)
(e) (f)
Test #4 (500 h creep test)
(g) (h)
Test #5 (500 h creep test)
(i) (j)
Figure 106 Secondary electron SEM images of the cross-sections of all standard samples
oxidised at 350 MPa (Region 1 in Figure 99(a)) at 550°C in 1%CO/CO2 + 300 vppm H2O:
(a, c, e, g, i) OPS surface; (b, d, f, h, j) 600-grit ground surface.

Chapter 8: Oxidation/carburisation of Type 316H SS in a simulated AGR environment
201
Figure 107 Duplex oxide layer growth as a function of time on both the OPS polished and
600-grit ground cross-sectional surfaces of specimens oxidised at 350 MPa at 550°C in an
atmospheric 1% CO/CO2 + 300 vppm H2O environment. The standard errors measuring
how far the experimental data are from the parabolic fits are indicated in red.
As can be seen from the figures quoted above, the morphology of the oxide scale varied
not just according to the surface finish but also to the level of stress. In the absence of
plastic deformation the OPS polished surface formed a thick duplex oxide with intense
intergranular oxide intrusion, Figures 105(a), (c), (e), (g) and (i). The thickness of the
duplex oxide layer measured in the unstrained regions was typically around 12 µm, except
for the short-term (100 h) experiment (Test #2) where the OPS polished surface formed
a much thinner (~6 μm) duplex scale, suggesting that the rate of duplex oxide growth
depends on the exposure time and that in a nonlinear fashion, Figure 107. At regions with
active stress, the high magnification micrographs taken on the OPS polished surface
revealed similar duplex oxide structures to those reported above, with persistent oxide
penetration down grain boundaries, Figures 106(a), (c), (e), (g) and (i). As a result, neither
the pre-straining (Test #1) nor the dynamic deformation associated with creep (Tests #2
to 5) had a significant effect on the duplex oxidation of a chemically polished surface.
On the other hand, at regions remote from the active stress the 600-grit ground surface
formed a thin protective oxide layer (< 1 μm), Figures 105(b), (d), (f), (h) and (j), but with
increasing stress the thin layer transitioned into a thicker double-layered oxide similar to
the duplex oxide formed on the OPS polished surface, with shallow grain boundary oxide

Chapter 8: Oxidation/carburisation of Type 316H SS in a simulated AGR environment
202
penetrations observed, Figures 106(b), (d), (f), (h) and (j). The depth of the oxide layer
formed on the 600-grit ground surface however appeared to be significantly less (~7 μm)
than for the OPS polished surface, suggesting that formation of the duplex oxide layer on
the abraded material occurred at a later stage than for the chemically polished surface. In
addition, it appears that the initial thin oxide formed on the 600-grit ground surface of the
pre-strained sample subjected to 500 h oxidation without stress (Test #1) was likely
disrupted during the hot loading stage as the sample revealed a similar duplex oxide
structure to specimens tested under creep, both in terms of oxide morphology and
thickness. In this regard, the rapid breakdown of the protective oxide was presumably due
to the plastic strain imposed by the initial applied stress rather than creep. In other words,
creep alone had no considerable effect in the disruption of the thin passive oxide and/or
duplex oxide growth. However, it is worth noting that the magnitude of plastic strain is
much greater than that of the creep strain. Also, the oxide layer thickness on the 600-grit
ground surface too seemed to grow with increasing time, from ~4 μm to ~7 μm after the
100 h and 500 h exposure, respectively, Figure 107. The combined effect of stress and
strain and surface preparation on oxide development will be discussed later.
8.4.2.3 SEM cross-sectional examinations: tapered specimen
A tapered sample with surfaces prepared to a 600-grit SiC ground on one side and
colloidal silica OPS finish on the opposite side prior to exposure was tested in the same
simulated AGR environment as that of the standard specimens (atmospheric 1%CO/CO2
+ 300 vppm H2O) at 550°C for 500 h under an applied nominal stress of 350 MPa. Post-
test dimensional measurements revealed that this sample had been elongated 770 μm,
with the highest deformation and presumably strain rate occurring at the smallest section
of the gauge. The oxides formed on the differing surfaces were investigated in three
distinctive regions on the metallographically prepared cross sections: at the smallest
section (highest strain and strain rate), middle and largest section of the tapered gauge.
The corresponding SEM images taken on the OPS polished and 600-grit ground surfaces
are shown in Figures 108(a) to (f) as a function of increasing stress.

Chapter 8: Oxidation/carburisation of Type 316H SS in a simulated AGR environment
203
σ ≈ 210 MPa σ ≈ 280 MPa σ = 350 MPa
OPS
(a) (b) (c)
600-grit
(d) (e) (f)
Figure 108 Secondary electron SEM images of the cross-section of the tapered creep
sample oxidised for 500 h at 550°C in 1%CO/CO2 + 300 vppm H2O: (a, b, c) OPS surface;
(d, e, f) 600-grit ground surface in regions with applied nominal stresses of ~210, ~280 and
350 MPa, as indicated in Figure 99(b).
As expected, the OPS polished surface formed a duplex oxide with uniform thickness
(~11 μm) over the entire gauge length, Figures 108(a) to (c), and morphology similar to
those observed on the conventional specimens. Thus, stress and strain again appeared to
have little or no influence on duplex oxide growth on the chemically polished surface. On
the other hand, at the largest section of the tapered gauge where the nominal stress was
~210 MPa, the 600-grit ground surface formed a thin oxide film, Figure 108(d) similar to
those identified in the undeformed region of the standard dog-bone samples. Note that at
550°C the stress of 210 MPa is higher than the yield strength (~180 MPa) of this AR
316H header material, and therefore the gauge underwent some degree of plastic
deformation in this region too as proven by the post-test geometric measurements
reported in Appendix-C2. The passive oxide however appeared to be intact despite the
relatively high stress level experienced and had no sign of disruption, suggesting that the
local strain gradients were not large enough to break the initially formed protective oxide
scale. This however occurred in regions where stress was slightly greater (~280 MPa),
wherein small clusters of duplex oxide started to appear on the abraded surface,
Figure 108(e). At even larger stresses, such as 350 MPa, the 600-grit ground surface
exhibited similar duplex oxide scale morphology to that which has been described

Chapter 8: Oxidation/carburisation of Type 316H SS in a simulated AGR environment
204
previously for the conventional specimens that underwent severe plastic deformation,
with a thickness of ~10 μm measured at the smallest section of the gauge, Figure 108(f).
It now becomes more obvious that the evolution and the structure of the oxide depend not
only on the surface finish but also on the presence of active stress and strain. In fact, it is
most likely that the controlling parameter for oxide breakdown on a ground surface is the
plastic strain rather than stress. This will be discussed further in later sections.
8.4.2.4 Hardness measurements: conventional specimens
Plots of the hardness results for the metallographically prepared cross section of each
conventional specimen tested (Tests #1 to 5 in Table 24) are presented in Figures 109 to
113. The hardness of the samples was measured as a function of the distance from the
OPS polished surface to the 600-grit ground surface to demonstrate the different
resistance to carbon penetration of the two surfaces by also considering the effect of stress
and strain. In addition, the surface hardening levels for the OPS polished side of all
standard specimens with creep deformation (Tests #2 to 5) plotted in the form of
normalised, regressed hardness profiles following both 100 h and 500 h of exposure to
the simulated AGR environment are compared in Figure 114. The hardness profiles are
presented as fitted curves for ease of data management, and have been normalised for
comparison purposes, as subtle changes in grain size or shape, for example, may affect
the bulk value and hence dwarf surface effects. The depth of hardness variation observed
only for the OPS polished surface is also presented as a function of time in Figure 115.

Chapter 8: Oxidation/carburisation of Type 316H SS in a simulated AGR environment
205
Figure 109 Hardness profile plotted from measurements taken through the cross section of
the pre-strained sample (Test #1 in Table 24) that was briefly loaded to 350 MPa at 550°C
to introduce plastic deformation, but then unloaded and oxidised with no stress, and hence
no creep for 500 h in the simulated AGR environment. The mean micro-hardness data at
regions 1 and 2 are indicated in red and blue, respectively, as per Figure 99(a). Note that
the horizontal axis is plotted using different scales: a finer scale close to the surfaces and a
coarser one in the bulk where carburisation and oxidation do not occur.

Chapter 8: Oxidation/carburisation of Type 316H SS in a simulated AGR environment
206
Figure 110 Hardness profile plotted from measurements taken through the cross section of
the creep sample oxidised at a nominal applied stress of 350 MPa for 100 h in the
simulated AGR environment (Test #2 in Table 24). The mean nano-hardness data at
regions 1 and 2 are indicated in red and blue, respectively, as per Figure 99(a). Note that
the horizontal axis is plotted using different scales: a finer scale close to the surfaces and a
coarser one in the bulk where carburisation and oxidation do not occur.

Chapter 8: Oxidation/carburisation of Type 316H SS in a simulated AGR environment
207
Figure 111 Hardness profile plotted from measurements taken through the cross section of
the creep sample oxidised at a nominal applied stress of 350 MPa for 500 h in the
simulated AGR environment (Test #3 in Table 24). The mean micro-hardness data at
regions 1 and 2 are indicated in red and blue, respectively, as per Figure 99(a). Note that
the horizontal axis is plotted using different scales: a finer scale close to the surfaces and a
coarser one in the bulk where carburisation and oxidation do not occur.
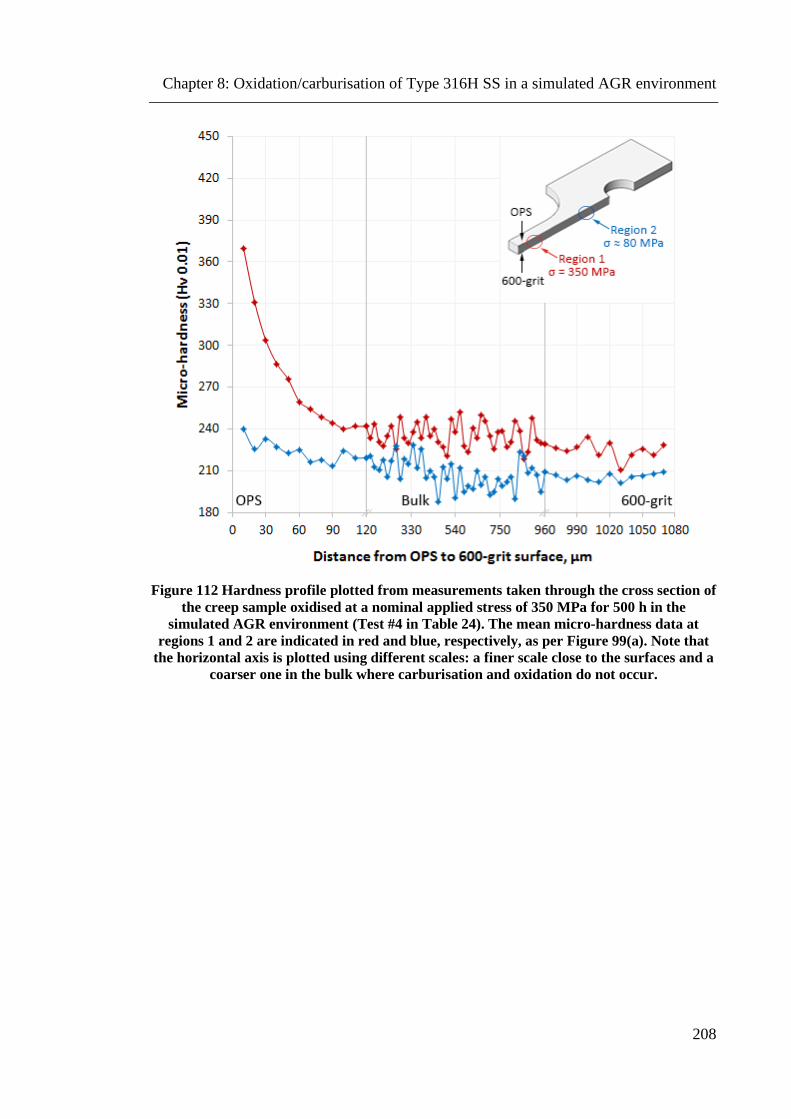
Chapter 8: Oxidation/carburisation of Type 316H SS in a simulated AGR environment
208
Figure 112 Hardness profile plotted from measurements taken through the cross section of
the creep sample oxidised at a nominal applied stress of 350 MPa for 500 h in the
simulated AGR environment (Test #4 in Table 24). The mean micro-hardness data at
regions 1 and 2 are indicated in red and blue, respectively, as per Figure 99(a). Note that
the horizontal axis is plotted using different scales: a finer scale close to the surfaces and a
coarser one in the bulk where carburisation and oxidation do not occur.

Chapter 8: Oxidation/carburisation of Type 316H SS in a simulated AGR environment
209
Figure 113 Hardness profile plotted from measurements taken through the cross section of
the creep sample oxidised at a nominal applied stress of 350 MPa for 500 h in the
simulated AGR environment (Test #5 in Table 24). The mean micro-hardness data at
regions 1 and 2 are indicated in red and blue, respectively, as per Figure 99(a). Note that
the horizontal axis is plotted using different scales: a finer scale close to the surfaces and a
coarser one in the bulk where carburisation and oxidation do not occur.

Chapter 8: Oxidation/carburisation of Type 316H SS in a simulated AGR environment
210
Figure 114 Plot of normalised, regressed hardness profiles measured on the OPS polished
cross-sectional surface of conventional creep specimens following 100 h (Test #2) and 500 h
(Tests #3 to 5) of exposure to the simulated AGR environment at a nominal applied stress
of 350 MPa.
Figure 115 Average depth of carburised material as a function of time on the OPS
polished cross-sectional surface of conventional specimens oxidised at 350 MPa in an
atmospheric 1% CO/CO2 + 300 vppm H2O environment at 550°C. The standard errors
measuring how far the experimental data are from the parabolic fit are indicated in red.
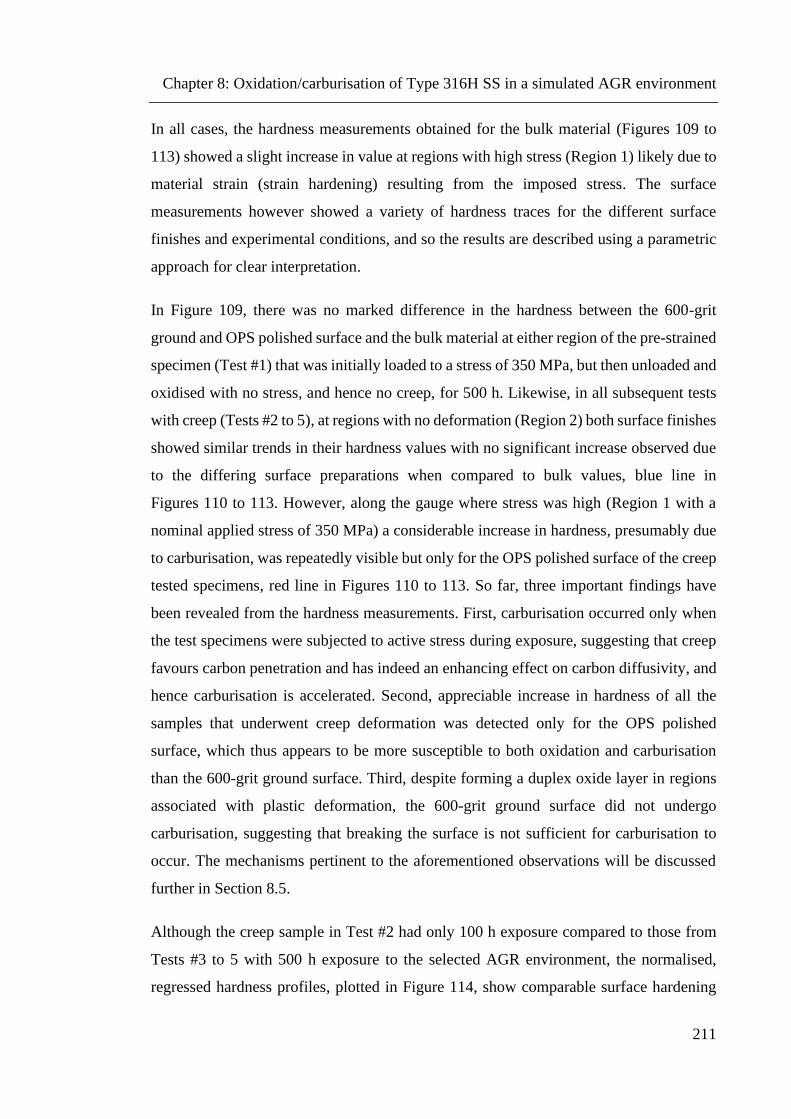
Chapter 8: Oxidation/carburisation of Type 316H SS in a simulated AGR environment
211
In all cases, the hardness measurements obtained for the bulk material (Figures 109 to
113) showed a slight increase in value at regions with high stress (Region 1) likely due to
material strain (strain hardening) resulting from the imposed stress. The surface
measurements however showed a variety of hardness traces for the different surface
finishes and experimental conditions, and so the results are described using a parametric
approach for clear interpretation.
In Figure 109, there was no marked difference in the hardness between the 600-grit
ground and OPS polished surface and the bulk material at either region of the pre-strained
specimen (Test #1) that was initially loaded to a stress of 350 MPa, but then unloaded and
oxidised with no stress, and hence no creep, for 500 h. Likewise, in all subsequent tests
with creep (Tests #2 to 5), at regions with no deformation (Region 2) both surface finishes
showed similar trends in their hardness values with no significant increase observed due
to the differing surface preparations when compared to bulk values, blue line in
Figures 110 to 113. However, along the gauge where stress was high (Region 1 with a
nominal applied stress of 350 MPa) a considerable increase in hardness, presumably due
to carburisation, was repeatedly visible but only for the OPS polished surface of the creep
tested specimens, red line in Figures 110 to 113. So far, three important findings have
been revealed from the hardness measurements. First, carburisation occurred only when
the test specimens were subjected to active stress during exposure, suggesting that creep
favours carbon penetration and has indeed an enhancing effect on carbon diffusivity, and
hence carburisation is accelerated. Second, appreciable increase in hardness of all the
samples that underwent creep deformation was detected only for the OPS polished
surface, which thus appears to be more susceptible to both oxidation and carburisation
than the 600-grit ground surface. Third, despite forming a duplex oxide layer in regions
associated with plastic deformation, the 600-grit ground surface did not undergo
carburisation, suggesting that breaking the surface is not sufficient for carburisation to
occur. The mechanisms pertinent to the aforementioned observations will be discussed
further in Section 8.5.
Although the creep sample in Test #2 had only 100 h exposure compared to those from
Tests #3 to 5 with 500 h exposure to the selected AGR environment, the normalised,
regressed hardness profiles, plotted in Figure 114, show comparable surface hardening

Chapter 8: Oxidation/carburisation of Type 316H SS in a simulated AGR environment
212
levels for the different exposure times, with a clear subsurface peak in hardness of
approximately 150% of the bulk value for all oxidised specimens. The extent of
carburisation in the substrate however appeared to increase significantly with exposure
time, from ~40 μm for the 100 h exposure to a depth of approximately 75 μm for the
500 h exposure. This not only suggests that carburisation occurs quite early on a
chemically polished surface, but also that the subsurface hardness reaches its momentary
peak at the very initial stage (just after 100 h of exposure) with little or no increase up to
500 h as carbon diffuses deeper into the matrix. Carburisation however appears to slow
down with time as indicated by the nonlinear decrease in the depth of the affected material
in Figure 115.
8.4.2.5 Hardness measurements: tapered specimen
The hardness data acquired through the metallographically prepared cross section of the
tapered creep specimen oxidised for 500 h in the simulated AGR environment at an
applied nominal stress of 350 MPa are plotted in Figure 116. Similarly to the conventional
specimens, the hardness of the sample was measured as a function of the distance from
the OPS polished surface to the 600-grit ground surface but this time in three distinctive
regions over the tapered gauge: at the smallest section, middle and largest section of the
gauge with nominal applied stresses of 350 MPa, ~280 MPa and ~210 MPa, respectively,
as indicated in Figure 99(b). In addition, the hardness evolution of the bulk material and
the peak hardness of the OPS polished surface along the entire length of the tapered gauge
was also investigated by a series of micro-indents applied from the largest to the smallest
section in 30 µm steps. The aim here was to quantify the level of stress under which
carburisation becomes significant during the 500 h exposure and to assess whether the
parameter contributing most to carburisation is the presence of active stress or the strain
associated with creep. The hardness evolution of the bulk and the OPS polished surface
plotted as a function of increasing stress is presented in Figure 117.

Chapter 8: Oxidation/carburisation of Type 316H SS in a simulated AGR environment
213
Figure 116 Hardness profile plotted from measurements taken through the cross section of
the tapered creep sample oxidised for 500 h in the simulated AGR environment (Test #6 in
Table 24). The mean micro-hardness data at the three regions examined with an applied
nominal stress of ~210, ~280 and 350 MPa are indicated in red, orange and green,
respectively, as per Figure 99(b). Note that the horizontal axis is plotted using different
scales: a finer scale close to the surfaces and a coarser one in the bulk where carburisation
and oxidation do not occur.

Chapter 8: Oxidation/carburisation of Type 316H SS in a simulated AGR environment
214
Figure 117 Applied nominal stress along the tapered gauge against the bulk hardness
(black line) and the peak OPS surface hardness (gradient line) of the tapered creep sample
oxidised for 500 h in the simulated AGR environment at 350 MPa (Test #6 in Table 24).
The blue dashed line represents the best fit curve for the peak OPS surface hardness data.
Figure 116 shows clearly that the greatest increase in hardness occurred where the applied
stress was the highest (smallest gauge section), with a significant elevation observed only
for the OPS polished surface of the tapered sample. The hardness distribution profile here
shows a gradual decrease to approximately 70 μm below the surface, comparable to those
observed for the conventional specimens with 500 h exposure (see Figure 114), both in
terms of trend and carburised material depth. The peak hardness however was slightly
lower than those of the conventional counterparts, possibly due to lower strain amplitudes
as a result of high geometric constraint imposed at the smallest section of the gauge. The
hardness values measured on the 600-grit ground surface were again within the range of
the bulk material, showing only the amount of strain hardening that the material
experienced in the smallest section area of the gauge section.
Chapter 8: Oxidation/carburisation of Type 316H SS in a simulated AGR environment
215
Furthermore, by analysing the hardness data along the entire length of the tapered gauge,
a distinction can be made between continuous applied stress and creep straining in terms
of the contribution of each parameter to carburisation over the course of the experiment.
Figure 117 shows a barely significant approximately linear increase in OPS surface
hardness elevation in regions with lower stresses which then increases rapidly when the
stress exceeds 330 MPa and where the effective strain was predicted to be the most,
reaching a subsurface peak in hardness of approximately 135% of the bulk value. This
suggests that creep strain rather than stress is the main parameter enhancing carbon
diffusivity. However, more work is required to understand whether, in the long term and
in the absence of straining (e.g. constant load and under conditions more relevant to
plant), the stress alone could also have an additional accelerating effect on carbon ingress
during exposure.
8.5 Discussion
8.5.1 Effect of surface preparation on oxide evolution
As reported above, Type 316H samples tested at 550°C in atmospheric 1% CO/CO2 +
300 vppm H2O were surface finish sensitive since the different surface preparation
methods resulted in very different surface characteristics during oxidation. This was
already visible after visual examination and was confirmed by FEG-SEM examinations.
Specifically, mechanical (600-grit) grinding effectively promoted the formation of a thin
protective oxide film, Figures 105(b), (d), (f), (h) and (j), whilst chemical polishing (OPS)
resulted in extensive oxidation characterised by the formation of a thick duplex oxide
scale and preferential intergranular oxidation, Figures 105(a), (c), (e), (g) and (i).
As already stated in the literature review (Chapter 1 – Section 1.5.1), surface grinding and
mechanical polishing generates an ultrafine grained layer of 1-2 µm, visible in
Figure 105(j), as well as a work hardened layer underneath. This ultrafine crystalline layer
is believed to play a key role in promoting the formation of the passive external oxide
film due to the higher diffusivity of the alloying elements in the material because of the
high volume fraction of grain boundaries [99, 129]. Diffusion of reactants along grain
boundaries is faster than through grains; grain boundaries therefore act as rapid diffusion
paths for chromium to reach the surface, which essentially results in good oxidation
properties. The oxide scales formed on the 600-grit ground surface were found to be
Chapter 8: Oxidation/carburisation of Type 316H SS in a simulated AGR environment
216
highly protective, proving that the presence of the ultrafine grained layer in addition to
the higher dislocation density in the work hardened layer does provide fast diffusion paths
for the chromium to form and maintain the protective oxide film, as can be seen in
Figures 105(b), (d), (f), (h) and (j). In addition, the activation energy for diffusion in fine
grained structures is lower than for materials with larger grains [100], and thus diffusion
of the alloying elements towards the oxide-metal interface is enhanced. Moreover, the
fast diffusion paths allow rapid transport of the selectively oxidised element even from
regions deep in the metal, whereas in an OPS polished material these elements arise from
a region immediately beneath the oxide scale [98]. In other words, grinding not only
enhances chromium mobility but also aids the chromium to replenish faster.
The present study revealed that the removal of a work hardened surface layer allows for
the duplex oxide growth and carburisation to occur much sooner, hence oxidation and
carburisation progress at an accelerated rate. Removal of the ultrafine grained layer by
electro-polishing or via chemical polishing (OPS) therefore results in a remarkable
reduction of dislocation cores, predominantly at grain boundaries near the surface that in
turn decelerates the chromium diffusivity towards the surface oxide [99]. Since there are
no effective paths for chromium to reach the outer surface, local chromium depletion and
hence duplex oxidation becomes inevitable. In consequence, the duplex oxides formed
on the OPS polished surfaces were poorly protective and grew faster and thicker as shown
in Figures 105(a), (c), (e), (g) and (i).
8.5.2 Effect of stress on oxide evolution
Despite the beneficial effect of surface grinding on oxide evolution, in regions under
active stress the 600-grit ground surface formed a thicker oxide, comparable to the duplex
oxide scale developed on the OPS polished surfaces, Figures 106(d), (f), (h) and (j) and
Figure 108(f). In fact, from Test #1 where the sample was pre-strained but then subjected
to 500 h oxidation with no stress, the passive oxide formed on the ground surface was
shown to already be disrupted during the hot loading stage, and that deformation (e.g.
creep) is not necessarily required for the breakdown of the thin oxide film and duplex
scale formation, Figure 106(b). The initial thin oxide formed supposedly within the first
hours, if not minutes, of exposure on a ground surface has lower plasticity and a larger
Young’s modulus compared to the substrate [99]. Therefore, the applied stress upon hot

Chapter 8: Oxidation/carburisation of Type 316H SS in a simulated AGR environment
217
loading and/or deformation associated with creep can readily disrupt the oxide film
which, being brittle in nature becomes less protective. For this reason the passive oxide
transitions from protective to duplex similar to an OPS polished surface.
Another plausible mechanism of passive film breakdown is that the substrate undergoes
more plastic deformation than the ultrafine grained layer which is harder and has a higher
yield strength and elastic energy storage capability. Consequently this hard layer is able
to recover more elastic strain than the bulk material. Therefore, when a sample is
unloaded, the surface can remain in tension. The tensile residual stresses accumulated at
the surface can later account for the breakdown of the protective oxide and the growth of
a duplex scale, even in the absence of a constant applied stress. An additional accelerating
effect could be stress assisted oxidation; this however is not believed to be the dominant
effect and is probably of secondary importance since, in this case, creep would lead to a
decrease in this stress.
Surprisingly, creep had no accelerating effect on duplex oxide growth rate neither for the
600-grit ground nor the chemically treated (OPS) surfaces. Both surfaces however
showed some extent of preferential grain boundary oxide penetration, Figures 106(a) to
(j), confirming that oxidation down grain boundaries occurs more rapidly than within the
grains. Deformation promoted the protective oxide to breakdown and this led to the more
discontinuous oxidation including along the grain boundaries, but with a reduced
occurrence compared to the more susceptible OPS finish where the grain boundary oxide
intrusion was more severe and quite consistent along the whole sample length.
It is most likely that AGR components went into service with a surface preparation that
is more similar to a ground surface than a chemically polished one. Therefore, whilst from
an operational point of view it is good news that ground surfaces perform better than
polished ones, it is important to understand whether the effect is long lasting. As plant
components have been in service for several decades, it is important to understand the
evolution of the oxide layer with time and whether the ultrafine grained surface layer is
consumed over very long exposures. In this work, whilst the effect of oxidation of the
ultrafine grained layer could not be investigated, the effect of applied stress was
demonstrated to be particularly important. In fact, comparing regions with low and high

Chapter 8: Oxidation/carburisation of Type 316H SS in a simulated AGR environment
218
applied stresses, the 316H specimens were found to undergo transitions from the thin
protective form to the thick unprotective duplex oxide with increasing stress.
8.5.3 Effect of exposure time on oxide evolution
One creep test has been carried out for 100 hours and others have been carried out for 500
hours. As expected, in the selected AGR environment the exposure time did affect the
duplex oxide growth of Type 316H steel, regardless of the surface preparation. Based on
thickness variations, the duplex oxide growth on both the ground and the chemically
treated surfaces showed a progressively decreasing trend, Figure 107. The oxide growth
process is usually diffusion controlled and should theoretically obey a parabolic time
dependence. Experimentally, the duplex oxide growth does indeed follow the parabolic
law which essentially implies a slowdown of the oxidation kinetics with time, and would
presumably attain an approximately constant value at long times. This type of behaviour
might be explained considering that it is likely that the duplex morphologies were formed
and grew the most in the initial stage of deformation, during and/or shortly after hot
loading (primary creep) when dislocation mobility and density, and hence diffusion rates
are the highest. Local depletion of the oxide-forming alloying elements over the course
of exposure may also be ascribed to the swift slowdown in the duplex scale growth [139].
In the case of the thin oxide formed on the ground surfaces, providing the oxide layer is
not perturbed or externally damaged, the effect of surface treatment on the oxidation is
expected to be long lasting. However, if breakdown of the oxide occurs, for instance
because it is disrupted by plasticity, the underlying substrate would be exposed to the
environment. Hence the oxidation would proceed locally at higher rates and in the form
of a duplex structure similar to those formed on the OPS polished surfaces.
8.5.4 Surface hardening
Nano- and micro-indentation on the cross sections showed a detectable difference in
surface hardness due to carburisation between surface preparations and also between
regions under high and low stress, Figures 110 to 113. Hardening depends on carbon
ingress which can be slowed down by the protective oxide. However on an OPS surface
where the oxide is not protective a hardened layer is not found unless there is active stress
(creep). At this stage, it remains unknown whether it is an effect of stress or strain.

Chapter 8: Oxidation/carburisation of Type 316H SS in a simulated AGR environment
219
However, the peak hardness data acquired for the OPS surface over the whole gauge
portion of the tapered sample showed an initial linear rate followed by a sharp transition
to a rapidly increasing rate, Figure 117, only at the smallest cross section where plasticity
is the greatest. Hence, it can be inferred that the parameter most likely responsible for the
enhanced diffusivity of carbon, as in the case of oxide breakdown, is again the strain
rather than stress.
A recent study conducted by Ramsay et al. [140], on notched specimens of the Ni-based
superalloy RR1000 tested at 750°C in air, found that stress enhances grain boundary
oxidation and stress aided grain boundary oxidation occurs. Specifically, a significant
increase in the depth of intergranular penetrations was found in the highly stressed regions
at the base of notches; approximately a factor 2 over that found in unstressed regions.
Previous studies conducted by Arioka et al. [141, 142], examining the formation of
cavities at the tip of creep cracks of grade 316 stainless steel specimens tested in air at
450°C, have demonstrated a considerable Ni enrichment ahead of cracks, particularly due
to the diffusion and accumulation of vacancies during creep. Moreover, intergranular
oxide penetrations lead to higher stresses and Cr depletion in regions near grain
boundaries. In simulated PWR primary water at 360°C and under static constant load
conditions, the increase in vacancies concentration was also found to promote Ni
enrichment near the grain boundaries of Alloy 690 [143]. The above described
interactions on solute mobility are considered to be plausible for the present study too,
since an increased density of mobile dislocations due to creep, similar to void nucleation,
can readily enhance the diffusion of interstitial elements such as C, and thus accelerate
carburisation. Although no direct measurement of the carbon diffusion has been given
here, the results provide clear support for the enhanced hardening and are in good
agreement with carburisation kinetics reported in relevant studies [144, 145].
A further explanation for this phenomenon could lie in the formation of subgrains and
other dislocation networks as a natural consequence of plastic deformation during creep.
Subgrain growth is known to occur by low-angle boundary migration [40], whereby climb
and glide of the dislocations is considerably faster than through high‐angle boundaries,
providing fast pathways for diffusion, and hence contributing to a more rapid C ingress.

Chapter 8: Oxidation/carburisation of Type 316H SS in a simulated AGR environment
220
This however could not be derived from the present study but the interpretation may serve
as a hypothesis for future experiments.
8.5.5 Effect of time on carburisation
Carburisation rates, inferred from the surface hardness increase detected only on the OPS
polished surfaces, appeared to decelerate in an almost logarithmic fashion with exposure
time, Figure 115. The OPS polished surface revealed an elevated hardness to a depth of
~40 μm for the 100 h experiment (Test #2) and ~75 μm for the 500 h experiments
(Tests #3 to 5), in the near surface regions under active stress only compared to the fairly
constant hardness measured on the 600-grit surfaces. It is likely that the formation of the
duplex oxide allows the material to be more susceptible to carburisation due to its high
porosity. As the oxide thickens, and recalling that C ingress is likely to be under diffusion
control, carburisation also slows down, allowing the carbon to offset the declining
hardness by instead diffusing deeper into the base metal. Although no direct measurement
of the carbon diffusion has been given here, it is likely that carbon penetration into the
matrix is highly promoted by local strains resulting from the imposed stress, as previously
described. Conversely, a work hardened surface layer enables the chromium to diffuse to
the outer surface to enhance the passive film resulting in its permanence.
Although the 600-grit ground surface exhibited duplex oxide formation following the
breakdown of the passive oxide, carburisation does not occur or may progress at a much
slower rate in the initial stage. One possible mechanism is that in an ultrafine grained
layer, which has a very high strength, the dislocation creep is low, and so C diffusivity
through this layer is not as enhanced as in the bulk. In this respect, the ultrafine crystalline
layer still provides a certain protection, even if the thin oxide is disrupted. Such properties
however may become exhausted for much longer periods of time and extensive
carburisation may occur, if, for instance, the exposed material gets underneath the initial
cold worked layer. However this hypothesis still remains to be tested.

Chapter 8: Oxidation/carburisation of Type 316H SS in a simulated AGR environment
221
8.6 Conclusions
1. It has been observed that a chemically treated (OPS) surface finish promotes the
formation of a thick duplex oxide as well as intergranular oxide penetration, being
more susceptible to oxidation, hence carburisation than a work hardened surface. The
tendency to non-protective (duplex) scale formation is suppressed by surface
deformation (600-grit abrasion) of Type 316H stainless steel, allowing for the
formation of a protective oxide film, which is thinner (< 1 µm) and does not protrude
along the grain boundaries.
2. No effect of the applied axial stress on duplex oxide evolution on the OPS
polished surface was detected by comparing the regions of maximum stress (gauge
of the samples) with low-stressed regions. By contrast, when the substrate is
plastically deformed and under the effect of active stress the thin oxide on the 600-
grit ground surface can be disrupted. This leads to the formation of a much thicker
oxide as well as the formation of intergranular oxide penetration.
3. Results of the creep test on the tapered specimen lead to an estimate that the
breakdown of the protective oxide on a ground surface occurs at stresses greater than
210 MPa, which is well above the yield strength of the test material at 550°C.
Plasticity therefore has been inferred to be the leading cause of oxide disruption.
4. Duplex oxide measurements on the SEM images of the oxidised cross sections,
for both the OPS polished and 600-grit ground surfaces, showed a significant time
dependence in evolution, with rapid oxidation rates occurring in the initial stage (first
100 hours) followed by a gradual slowdown in duplex scale growth, obeying a power
law relation.
5. Nano- and micro-indentation measurements on the oxidised specimens identified
an increased hardness only for the OPS polished surface suggesting that carburisation
occurs quite early on a chemically treated surface if elevated hardness is used as a
measure. In fact, the elevated hardness was observed only at regions associated with
significant plastic deformation (> 10%) under steady load conditions (straining).
Thus, it can be concluded that stress and especially strain does have an enhanced

Chapter 8: Oxidation/carburisation of Type 316H SS in a simulated AGR environment
222
effect on both carburisation and the rate and extent of growth of the oxide scale of
Type 316H stainless steel.
6. The oxidation studies also revealed that a work hardened surface (ground finish)
prevents extensive carbon transmission into the substrate and provides additional
protection against carburisation even if the passive oxide is broken and duplex
oxidation occurs.
7. There was very little, if any, effect of time on the severity of surface hardening
detected. In contrast, the extent of carbon penetration showed an increase in depth
and a seemingly logarithmic slowdown as a function of time, suggesting that
carburisation is more severe in the early stages of exposure, and can effectively
saturate over much longer times.
8. It should be noted that the above results are most relevant for very short term
(500 h) exposures, but this would not prevent the successful use of these findings in
AGR power plant applications if long-term extrapolations are carefully considered.

Chapter 9: General summary and conclusions
223
9. General summary and conclusions
The aim of the project was to develop a better understanding of the environmentally
induced microstructural and mechanical degradation of Type 316H stainless steel
material used in AGR nuclear power plants. Improvements in this understanding will
support development of better assessment methodologies for evaluating the extent of this
phenomenon in the AGR fleet. The outcomes are also expected to provide validation of
both numerical and analytical modelling. The most salient results obtained throughout the
work described in this thesis are highlighted and discussed further below.
Various metallographic examinations and mechanical testing activities were used
throughout this work to analyse and characterise the samples investigated. Uniaxial creep
deformation properties of 316H material have been measured in creep tests at 550°C in
air as a function of material conditioning and applied stress. This activity was selected to
obtain complementary information and statistical data related to the failure time and
deformation rate of samples with the differing material conditions. Surprisingly, there
was a remarkable increase in creep ductility observed for the pre-carburised (PC)
specimens when compared to their as-received (AR) counterparts. This is rather unusual
and is somewhat contradictory to previous findings reported in the literature [94, 146],
where Type 316 steels generally showed a marked drop in creep ductility when
carburised. Similar creep behaviour of carburised 316H material, however, has also been
observed within the ENVISINC testing programme and is reported in [103]. The expected
reduction in both the tensile ductility and the creep life of the carburised samples was also
noticed. Additionally, the creep deformation of the carburised material was invariably
dominated by rapid initial primary creep. Although the creep life of the carburised
material increased considerably with decreasing stress, the creep strain at failure seemed
to be notably unaffected and comparable to that of the thermally aged (TA) material. This
again is quite uncommon since the creep strain at failure usually decreases as stress is
reduced.
The creep response of carburised test specimens is not simple to interpret due to the
effects of stress redistribution and premature cracking, which directly impacts the
apparent creep deformation behaviour. Observations at high stresses (280 MPa - 320 MPa)
have led to primary creep strains greater than 2% which generally result in extensive

Chapter 9: General summary and conclusions
224
cracking in the carburised layer and premature failure. As previously stated, the
carburised region has significantly modified material properties compared to the bulk
material due to an increased carbon concentration. Evidence presented in Section 6.3.2.3
suggests that the carburised layer cracks in the early stages of creep testing, if not on
loading, which would be expected to impact on the deformation response, predicting a
severe reduction in creep ductility. The influence of plasticity on creep ductility should
also be taken into account when interpreting the data as it is known that at higher loading
strain cracking can occur on loading [64]. For assessment purposes the effective creep
ductility of the carburised layer will be derived as the creep strain at which cracks reach
a critical depth. The experimental results suggest the recommended effective uniaxial
creep ductility for carburised material will be in the region of <1%. Noting the lower
bound creep ductility given by R66 [147] at 550°C is 2.6%, it seems appropriate to treat
this cast as having lower bound creep properties. Therefore it is considered conservative
that the carburised creep ductility values derived from the testing will be used directly
and not factored compared to the as-received properties.
A key requirement of any assessment methodology is to understand the role of
oxidation/carburisation in the crack initiation processes. Currently very limited
information is available which could be directly applicable to an AGR environment. For
instance, there are significant knowledge gaps pertaining to environmentally induced
degradation mechanisms and their relevance to creep-oxidation interactions. The present
research addressed several key unknowns relating to material - environment interactions,
including the combined effects of stress and strain and surface preparation on oxidation
and carburisation behaviour of Type 316H stainless steel under simulated AGR
conditions.
The surface preparation and finish, particularly in a carburising environment, plays a very
important role. Thus prior to exposure to the AGR stimulant environment, the residual
surface work (or work hardened layer) was removed through a progressive polishing
procedure (OPS) to a mirror metallographic finish. The reduction of surface work
appears, at least qualitatively, to have increased both the oxidation and hardening rates.
In addition, a clear theoretical link exists between surface finish and the local diffusion
coefficient [148]. The values used for alloy diffusion coefficients are typically assumed

Chapter 9: General summary and conclusions
225
to be those of the bulk alloy, however, factors such as local dislocation density and grain
boundary effects will locally enhance the diffusion rate in any cold worked surface. This
will be especially prevalent at the relatively low temperatures seen in AGRs. Hence short
circuit diffusion pathways will dominate any mass transport that takes place. In short, a
heavily cold worked surface will show locally enhanced Cr diffusion and will both grow
and maintain a M2O3 film over a considerable portion of its life.
Thus far, the effect of stress and strain on oxidation kinetics has not been systematically
assessed in reactor components. The present work studying the variation of oxidation
behaviour around a strained tensile sample demonstrated that plastic (creep) strain greatly
focussed the development of a duplex oxide surface layer to the strained region. Creep
was also found to have an enhancing effect on C penetration and led to a rapid surface
hardening on a chemically (OPS) polished surface (representative of the bulk material).
Whilst the oxidation behaviour of the 300 series stainless steels is clearly a key factor in
the surface hardening behaviour of these materials and hence has formed a major part of
the above discussions, it must also be remembered that the structural integrity issue is
predominantly associated with the production of a very hard and brittle surface layer. The
evidence gathered in this study appears to show that whilst breakdown of the thin passive
film is necessary for significant levels of carbon injection, this does not always appear to
be sufficient cause for carbon injection to occur. The experimental evidence speaks for
itself, where hardening is minimal, if present at all (scatter), ahead of a duplex oxidation
front in a work hardened (600-grit ground) surface. In any case, an effect of surface
condition and stress on oxidation and carburisation behaviours has clearly been
demonstrated. It is difficult, however, to envisage a situation where oxide can be
developed without the injection of carbon into the substrate, or at the very least the
deposition of carbon onto the reacting interface. Thus reconsideration of carbon ingress
mechanisms is recommended.
Chapter 10: Future work
226
10. Future work
In the present work the creep strain at which cracks start to initiate in a carburised material
was not confirmed. It remains a possibility that cracks may nucleate and the carburised
layer may have already failed during loading, well before entering the creep stage. Hence
it is important to carry out further tests in a more systematic way.
An additional experimental approach addressing the above theme would be to carry out
4-point bending tests with in-situ digital image correlation (DIC) on miniature carburised
samples that already have a duplex oxide layer developed. This technique would not only
provide an insight into how strain within the carburised layer evolves but could also detect
crack initiation and monitor crack propagation during deformation at both RT and
elevated temperatures.
The metallographic examinations identified a bimodal grain size distribution of the
service aged 316H header material used in the study, which later has been accounted for
as a possible cause for the observed discrepancy in creep performance. Grain size can
play a major role in dislocation creep, and thus cannot be treated impartially in measuring
creep deformation properties accurately. Therefore, additional creep testing on a virgin
material with controlled microstructure (homogeneous grain size and alloy distribution)
is highly recommended for precise observations and creep related data generation.
One of the key finding was to demonstrate the combined effects of stress, strain and
surface preparation on oxidation and carburisation behaviour which had not been
investigated simultaneously in a carburising environment. The experimental method
adopted however was limited in carrying out testing at atmospheric pressure and at high
stresses/strains for relatively short exposures. To determine whether the findings are
relevant to plant applications, consideration needs to be given to the effects of a higher
pressurised gas environment, loading at lower stress/strain levels and over longer periods.
This poses significant experimental challenges and requires a novel method for designing
an experimental setup which can be practicably deployed in an autoclave environment.
In several instances only one test was performed under the desired test conditions and
although trends are generally clear and consistent, it would be worthwhile to invest in

Chapter 10: Future work
227
repeating some tests (i.e. pre-strained and tapered specimens) in order to determine both
the degree of scatter and validity.
Finally, the oxidation study could be further extended on pre-cracked samples wherein
the effect of stress (creep) at the crack tip could be assessed. This could be performed
with the same creep frame presented in Chapter 5.

Chapter 11: References
228
11. References
1. E. Nonbol, “Description of the Advanced Gas Cooled Type of Reactor (AGR),”
NKS/RAK2(96)TR-C2, Riso National Laboratory, Roskilde, Denmark, Nov.
1996.
2. J. Bryers and S. Ashmead, (17 February 2016), “Preparation for future defuelling
and decommissioning works on EDF Energy’s UK fleet of Advanced Gas Cooled
Reactors,” PREDEC 2016. OECD Nuclear Energy Agency. Retrieved 18 Aug.
2017.
3. EDF Energy, “Nuclear lifetime management.” [Online]. Available at URL:
https://www.edfenergy.com/energy/lifetime-management. Accessed May 2018.
4. T. McKeen, “Advanced Gas Cooled Reactors,” Nuclear Energy Materials and
Reactors, vol. II, pp. 1–28, 2010.
5. R. Viswanathan and J. Stringer, “Failure Mechanisms of High Temperature
Components in Power Plants,” Journal of Engineering Materials and
Technology, vol. 122, pp. 246–255, Jul. 2000.
6. S. Holdsworth, “Creep-fatigue interaction in power plant steels,” Materials at
High Temperatures, vol. 28, no. 3, pp. 197–204, 2011.
7. R. Viswanathan, Damage Mechanisms and Life Assessment of High Temperature
Components. Metals Park, Ohio: ASM International, 1989.
8. S. Sakurai and N. Isobe, “Life assessment for creep and fatigue of steam turbine
components,” Transactions of the Indian Institute of Metals, vol. 63, no. 2–3, pp.
281–288, 2010.
9. B. Chen, J. N. Hu, P. E. J. Flewitt, A. C. F. Cocks, R. A. Ainsworth, D. J. Smith,
D. W. Dean and F. Scenini, “Effect of thermal ageing on creep and oxidation
behaviour of Type 316H stainless steel,” Materials at High Temperatures, vol.
32, no. 6, pp. 592–606, 2015.
10. B. Chen, P. E. J. Flewitt, A. C. F. Cocks and D. J. Smith, “A review of the
changes of internal state related to high temperature creep of polycrystalline
metals and alloys,” International Materials Reviews, vol. 60, no. 1, pp. 1–29,
2015.
11. A. A. Mamun, R. J. Moat, J. Kelleher and P. J. Bouchard, “Generation of
intergranular strains during high temperature creep fatigue loading of 316H
stainless steel,” Materials at High Temperatures, vol. 31, no. 4, pp. 378–382,
2014.
12. Ashwin Rao, “Review of the Environmental Impact on the Structural Integrity of
Type 316 Steels,” A report prepared by Atkins on behalf of EDF Energy,
5115728/12/03 Issue 1, Mar. 2013.

Chapter 11: References
229
13. R. A. Ainsworth, “R5 procedures for assessing structural integrity of components
under creep and creep-fatigue conditions,” International Materials Reviews, vol.
51, no. 2, pp. 107–126, 2006.
14. M. J. Chevalier, “Carburisation of Type 316 Stainless Steel in an AGR
Environment: Status of Current Understanding,” EDF Energy Report,
E/REP/BBGB/0120/AGR/13 Revision 002, Oct. 2015.
15. M. P. Ryan, D. E. Williams, R. J. Chater, B. M. Hutton and D. S. McPhail, “Why
stainless steel corrodes,” Nature, vol. 415, no. 6873, pp. 770–774, 2002.
16. ASME, “Section II, Part A - Ferrous Material Specifications (Beginning to SA-
450),” in ASME Boiler and Pressure Vessel Code, p. 247, 2010.
17. P. Marshall, Austenitic Stainless Steels: Microstructure and Mechanical
Properties. London: Elsevier Applied Science Publishers, 1984.
18. M. J. Chevalier, “HNB/HPB: Analysis of Material Compositions of Cracked
Superheater Bifurcations Compared with the Total Bifurcation Population,” EDF
Energy Engineering Report, E/REP/BBGB/0055/AGR/09 Revision 000, Mar.
2011.
19. B. S. Rho, H. U. Hong and S. W. Nam, “Effect of δ-ferrite on fatigue cracks in
304L steels,” International Journal of Fatigue, vol. 22, no. 8, pp. 683–690, 2000.
20. A. D. Warren, I. J. Griffiths, R. L. Harniman, P. E. J. Flewitt and T. B. Scott,
“The role of ferrite in Type 316H austenitic stainless steels on the susceptibility
to creep cavitation,” Materials Science and Engineering: A, vol. 635, pp. 59–69,
2015.
21. T. L. Burnett, R. Geurts, H. Jazaeri, S. M. Northover, S. A. McDonald, S. J.
Haigh, P. J. Bouchard and P. J. Withers, “Multiscale 3D analysis of creep cavities
in AISI type 316 stainless steel,” Materials Science and Technology, vol. 31, no.
5, pp. 522–534, 2015.
22. M. F. McGuire, Stainless Steels for Design Engineers. ASM International,
Materials Park, Ohio 44073-0002, 2008.
23. J. M. Leitnaker, “Prevention of chi and sigma phases formation in aged 16-8-2
weld metal,” Welding Journal, vol. 61, no. 1, pp. 9–12, 1982.
24. L. P. Stoter, “Thermal ageing effects in AISI type 316 stainless steel,” Journal of
Materials Science, vol. 16, no. 4, pp. 1039–1051, 1981.
25. B. Clausen, T. Lorentzen and T. Leffers, “Self-consistent modelling of the plastic
deformation of FCC polycrstals and its implications for diffraction measurements
of internal stresses,” Acta Materialia, vol. 46, no. 9, pp. 3087–3098, 1998.

Chapter 11: References
230
26. B. Chen, J. N. Hu, P. E. J. Flewitt, D. J. Smith, A. C. F. Cocks and S. Y. Zhang,
“Quantifying internal stress and internal resistance associated with thermal
ageing and creep in a polycrystalline material,” Acta Materialia, vol. 67, pp.
207–219, 2014.
27. B. Chen, J. N. Hu, Y. Q. Wang, S. Kabra, A. C. F. Cocks, D. J. Smith and P. E.
J. Flewitt, “Internal strains between grains during creep deformation of an
austenitic stainless steel,” Journal of Materials Science, vol. 50, no. 17, pp.
5809–5816, 2015.
28. W. D. Callister Jr. and D. G. Rethwisch, Materials Science and Engineering: An
Introduction, 7th ed. 2007.
29. C. T. F. Ross, Mechanics of Solids. London: Prentice Hall, 1996.
30. W. Ramberg and W. R. Osgood, “Description of Stress-Strain Curves by Three
Parameters,” Technical Note No. 902. National Advisory Committee for
Aeronautics, Washington DC, 1943.
31. A. S. Khan and S. Huang, Continuum Theory of Plasticity. John Wiley & Sons,
Inc., New York, 1995.
32. E. Schmid and W. Boas, Plasticity of Crystals: with special reference to metals.
(A translation from the German by F.A. Hughes & Co. Limited of
“KRISTALLPLASTIZITAET mit besonderer BerUcksichtigung der Metalle”),
1935.
33. R. Peierls, “The size of a dislocation,” Proceedings of the Physical Society, vol.
52, Issue 1, pp. 34–37, 1940.
34. V. Tsakiris and D. V. Edmonds, “Martensite and deformation twinning in
austenitic steels,” Materials Science and Engineering: A, vol. 273–275, pp. 430–
436, 1999.
35. R. E. Smallman and A. H. W. Ngan, Modern Physical Metallurgy, 8th ed. Oxford:
Butterworth-Heinemann, 2014.
36. C. B. Carter and M. G. Norton, Ceramic Materials: Science and Engineering, 2nd
ed. Springer, 2013.
37. B. E. Warren and E. P. Warekois, “Stacking faults in cold worked alpha-brass,”
Acta Metallurgica, vol. 3, no. 5, pp. 473–479, 1955.
38. G. E. Dieter, Mechanical Metallurgy. McGraw-Hill: Metallurgy and
Metallurgical Engineering Series, 1961.
39. J. P. Hirth and J. Lothe, Theory of Dislocations, 2nd ed. Malabar, FL: Krieger
Pub. Co., 1992.
Chapter 11: References
231
40. D. Hull and D. J. Bacon, Introduction to Dislocations, 5th ed. Oxford:
Butterworth-Heinemann, 2011.
41. V. Borovikov, M. I. Mendelev, A. H. King and R. Lesar, “Effect of stacking fault
energy on mechanism of plastic deformation in nanotwinned FCC metals,”
Modelling and Simulation in Materials Science and Engineering, vol. 23, no. 5,
pp. 1–19, 2015.
42. S. D. Washko and G. Aggen, “Wrought Stainless Steels,” in ASM Handbook,
Properties and Selection: Irons, Steels and High-Performance Alloys, vol. 1,
Ohio: ASM International, p. 2049, 1993.
43. F. C. Frank and W. T. Read Jr, “Multiplication Processes for Slow Moving
Dislocations,” Physical Review, vol. 79, no. 4, pp. 722–723, 1950.
44. W. Yang and W. B. Lee, “Mesoplasticity and its Applications.” pp. 192–194,
Springer-Verlag Berlin Heidelberg, 1993.
45. G. Schoeck and R. Frydman, “The Contribution of the Dislocation Forest to the
Flow Stress,” Physica Status Solidi (B), vol. 53, no. 2, pp. 661–673, 1972.
46. Z. Shen, R. H. Wagoner and W. A. T. Clark, “Dislocation pile-up and grain
boundary interactions in 304 stainless steel,” Scripta Metallurgica, vol. 20, no. 6,
pp. 921–926, 1986.
47. S. V. Kailas, “Chapter 7. Dislocations and Strengthening Mechanisms,” in
Material Science, NPTEL course, 2004.
48. R. J. D. Tilley, Understanding Solids: The Science of Materials. John Wiley &
Sons Ltd., Chichester, England, 2004.
49. J. C. Fisher, W. G. Johnston, R. Thomson and T. Vreeland Jr. (Eds.),
Dislocations and Mechanical Properties of Crystals. John Wiley & Sons, Inc.,
New York, 1957.
50. U. F. Kocks, “Latent Hardening and Secondary Slip in Aluminum and Silver,”
Transactions of the Metallurgical Society of AIME, vol. 230, p. 1160–1167,
1964.
51. A. D. Rollett and U. F. Kocks, “A Review of the Stages of Work Hardening,”
Solid State Phenomena, vol. 35–36, pp. 1–18, 1993.
52. H. Mughrabi, “Dislocation wall and cell structures and long-range internal
stresses in deformed metal crystals,” Acta Metallurgica, vol. 31, no. 9, pp. 1367–
1379, 1983.
53. R. Sedláček, W. Blum, J. Kratochvíl and S. Forest, “Subgrain formation during
deformation: Physical origin and consequences,” Metallurgical and Materials
Transactions A: Physical Metallurgy and Materials Science, vol. 33, no. 2, pp.
319–327, 2002.

Chapter 11: References
232
54. G. A. Webster and R. A. Ainsworth, High Temperature Component Life
Assessment, 1st ed. London: Chapman and Hall, 1994.
55. R. W. Evans and B. Wilshire, Introduction to creep. London: Institute of
Materials, 1993.
56. H. J. Frost and M. F. Ashby, Deformation-mechanism maps: the plasticity and
creep of metals and ceramics. Oxford: Pergamon Press, 1982.
57. R. W. Evans and B. Wilshire, Creep of Metals and Alloys. London: Institute of
Metals, 1985.
58. M. E. Kassner, Fundamentals of Creep in Metals and Alloys, 2nd ed. London:
Elsevier Science, 2009.
59. K. Naumenko and H. Altenbach, Modeling High Temperature Materials
Behavior for Structural Analysis. Part I: Continuum Mechanics Foundations and
Constitutive Models, vol. 28. Springer, Cham, 2016.
60. E. O. Hall, “The Deformation and Ageing of Mild Steel: III Discussion of
Results,” Proceedings of the Physical Society, p. 747, 1951.
61. N. J. Petch, “The Cleavage Strength of Polycrystals,” Journal of the Iron and
Steel Institute, vol. 174, pp. 25–28, 1953.
62. C. Herring, “Diffusional viscosity of a polycrystalline solid,” Journal of Applied
Physics, vol. 21, no. 5, pp. 437–445, 1950.
63. R. L. Coble, “A Model for Boundary Diffusion Controlled Creep in
Polycrystalline Materials,” Journal of Applied Physics, vol. 34, no. 6, pp. 1679–
1682, 1963.
64. M. J. Chevalier and J. Aveson, “Development of R5 Volume 2/3 Methodology
for the Treatment of Carburised Stainless Steels,” EDF Energy Report,
E/REP/BBGB/0202/GEN/16 Revision 000, May 2017.
65. B. Wilshire and P. J. Scharning, “A new methodology for analysis of creep and
creep fracture data for 9–12% chromium steels,” International Materials
Reviews, vol. 53, no. 2, pp. 91–104, 2008.
66. J. Bauschinger, “Mittheilung XV: On the changes of the elastic limit and the
strength of iron by straining in tension and in compression, Mittheilungen aus
dem Mechanisch-Technischen Laboratorium der Königlichen Technischen
Hochschule München,” vol. 13, no. 8, pp. 1–115, 1886.
67. R. Hales, S. R. Holdsworth, M. P. O’Donnell, I. J. Perrin and R. P. Skelton, “A
Code of Practice for the determination of cyclic stress-strain data,” Materials at
High Temperatures, vol. 19, no. 4, pp. 165–185, 2002.

Chapter 11: References
233
68. J. L. Chaboche, “Constitutive equations for cyclic plasticity and cyclic
viscoplasticity,” International Journal of Plasticity, vol. 5, no. 3, pp. 247–302,
1989.
69. E. Orowan, “Causes and Effects of Internal Stresses,” in Internal Stresses and
Fatigue in Metals, pp. 59–80, Elsevier Publishing, Amsterdam, 1959.
70. J. Hu, B. Chen, D. J. Smith, P. E. J. Flewitt and A. C. F. Cocks, “On the
evaluation of the Bauschinger effect in an austenitic stainless steel – The role of
multiscale residual stresses,” International Journal of Plasticity, vol. 84, pp. 203–
223, 2016.
71. A. Al Mamun, R. J. Moat, J. Kelleher and P. J. Bouchard, “Origin of the
Bauschinger effect in a polycrystalline material,” Materials Science and
Engineering: A, vol. 707, no. 7, pp. 576–584, 2017.
72. R. P. Skelton, “Strain-Induced – Oxidation-Environment Interactions relative to
AGR Lifetime Assessment Procedures: A Review,” Imperial Consultants Report,
ME06144, Nov. 2012.
73. J. Sumner and N. J. Simms, “9Cr-1Mo Ferritic Steel Oxidation / Carburisation
Mechanisms and Wall-Loss. Part 2: Thermodynamic Evaluation of the Gas
Stream / Heat Exchanger Surface,” Centre for Energy and Resource Technology,
Cranfield University, Cranfield, UK, CERT/0201, NRS/CHEM/BEGL/P(13)136,
Oct. 2013.
74. N. Birks, G. H. Meier and F. S. Pettit, Introduction to the High-Temperature
Oxidation of Metals, 2nd ed. Cambridge University Press, 2006.
75. G. R. Millward, H. E. Evans, M. Aindow and C. W. Mowforth, “The Influence of
Oxide Layers on the Initiation of Carbon Deposition on Stainless Steel,”
Oxidation of Metals, vol. 56, no. 3–4, pp. 231–250, 2001.
76. B. Chen, J. Lindsay, R. A. Ainsworth and F. Scenini, “Oxidation Behavior of an
Austenitic Stainless Steel used in the UK Advanced Gas-Cooled Reactors,”
CORROSION 2015 Conference and Expo, Jul. 2015.
77. J. Zhang, K. Boddington and D. J. Young, “Oxidation, carburisation and metal
dusting of 304 stainless steel in CO/CO2 and CO/H2/H2O gas mixtures,”
Corrosion Science, vol. 50, no. 11, pp. 3107–3115, 2008.
78. P. Y. Hou, “Oxidation of Metals and Alloys,” Shreir’s Corrosion, vol. 1, pp.
195–239, 2010.
79. V. B. Trindade, U. Krupp, P. E. G. Wagenhuber and H. J. Christ, “Oxidation
mechanisms of Cr-containing steels and Ni-base alloys at high-temperatures -
Part I: The different role of alloy grain boundaries,” Materials and Corrosion,
vol. 56, no. 11, pp. 785–790, 2005.

Chapter 11: References
234
80. T. Gheno, “Oxidation and carburisation of model chromia-forming alloys in
carbon dioxide,” Doctoral Dissertation, School of Materials Science and
Engineering, The University of New South Wales, 2012.
81. M. G. Angell, “Surface Hardening and Oxide Fingers on Type 316 Boiler Tubing
Oxidised Under AGR Conditions,” AMEC Technical Report, 17777–TR–002
Issue 4, Aug. 2013.
82. H. E. Evans, “Stress effects in high temperature oxidation,” International
Materials Reviews, vol. 40, no. 1, pp. 1–40, 1995.
83. S. P. Kinniard, D. J. Young and D. L. Trimm, “Effect of scale constitution on the
carburization of heat resistant steels,” Oxidation of Metals, vol. 26, no. 5–6, pp.
417–430, 1986.
84. P. Deem, “ENVISINC, Metallography Workpack, Summary of Progress to
2014,” AMEC Report, 201710–TR–0001 Issue 01, Nov. 2014.
85. C. M. Younes, “Oxidation and Carburisation of Type 316 Stainless Steels in
AGRs Environments,” University of Bristol Report, CMY/IAC/15/C04, Jun.
2015.
86. D. J. Young and S. Watson, “High-temperature corrosion in mixed gas
environments,” Oxidation of Metals, vol. 44, no. 1–2, pp. 239–264, 1995.
87. C. M. Younes, “Environmental Impact on the Structural Integrity of Nuclear
Components,” ENVISINC Project: Work Progress - Task 1.2a, University of
Bristol Report, CMY/IAC/14/C03, Aug. 2014.
88. P. Deem, “ENVISINC Metallography Report, Summary of Results 2013-2015,”
Amec FW Report, 203634–TR–0001 Issue 04, Jan. 2017.
89. A. Wisbey and S. Flannagan, “Summary of Testing Activities in Support of the
ENVISINC Project,” Amec FW Report, AMEC/205420-01/001 Issue 03, Jan.
2017.
90. M. J. Chevalier, “Carburised Material Properties for R5 Volume 2/3
Assessments,” EDF Energy Report, E/REP/BBGB/0202/GEN/16 Revision 001,
Feb. 2018.
91. S. J. Kimmins, “Tensile Properties of ex-Heyshame Superheater Forgings and a
Correlation of Proof Strength with Hardness,” Nuclear Electric plc Report,
EPD/GEN/REP/0008/96, Feb. 1996.
92. C. Austin, S. May and L. Higham, “Tensile Properties and Metallography of Thin
Section Type 316H Stainless Steel Tube Materials and Associated Welds
(Interim Report),” AMEC Report, 204128–TR–0004/01, Apr. 2015.

Chapter 11: References
235
93. P. J. Jeffcoat and A. W. Thorley, “The Influence of Carburisation on the
Structure and Mechanical Properties of a 9Cr1Mo Ferritic Steel,” UKAEA
Northern Division Report, ND-R-365(R), Jul. 1979.
94. I. R. McLauchlin, “A Model for the Secondary Creep Behaviour of Steel
Deforming in a Carburising Environment, and its Application to the Creep of 9Cr
Steel in CO2-CO,” CEGB Report, RD/B/N3439, Feb. 1976.
95. M. P. O. Donnell, R. A. W. Bradford, D. W. Dean, C. D. Hamm and M. J.
Chevalier, “High Temperature Issues in Advanced Gas Cooled Reactors (AGR),”
TAGSI/FESI Symposium 2013, pp. 1–8, 2013.
96. C. J. Bolton and I. R. McLauchlin, “Creep of 9Cr-1Mo Steel in a Carburising
Environment,” CEGB Report, RD/B/N4831, Jun. 1980.
97. S. R. Collins, P. C. Williams, S. V. Marx, A. H. Heuer, F. Ernst and H. Kahn,
“Low-Temperature Carburization of Austenitic Stainless Steels,” ASM
Handbook, vol. 4D, pp. 451–460, 2014.
98. C. Ostwald and H. J. Grabke, “Initial oxidation and chromium diffusion. I.
Effects of surface working on 9-20% Cr steels,” Corrosion Science, vol. 46, no.
5, pp. 1113–1127, 2004.
99. L. Chang, M. G. Burke and F. Scenini, “Stress corrosion crack initiation in
machined type 316L austenitic stainless steel in simulated pressurized water
reactor primary water,” Corrosion Science, vol. 138, no. 1, pp. 54–65, 2018.
100. J. R. Davis, ASM Specialty Handbook: Heat-Resistant Materials. Materials Park,
Ohio: ASM International, 1997.
101. R67, “CO2 Oxidation Handbook.” Issue 1, British Energy Generation Ltd,
Barnwood, 1997.
102. G. H. Meier, K. Jung, N. Mu, N. M. Yanar, F. S. Pettit, J. P. Abellán, T.
Olszewski, L. N. Hierro, W. J. Quadakkers and G. R. Holcomb, “Effect of Alloy
Composition and Exposure Conditions on the Selective Oxidation Behavior of
Ferritic Fe–Cr and Fe–Cr–X Alloys,” Oxidation of Metals, vol. 74, no. 5–6, pp.
319–340, 2010.
103. S. Flannagan and A. Wisbey, “Summary of Amec Foster Wheeler Testing
Activities in Support of ENVISINC Project - 2014,” AMEC Report,
AMEC/203963-01/001 Issue 01, May 2015.
104. P. Deem, “ENVISINC, Metallography Work-pack, Summary of Progress to
2014,” AMEC Report, 201710–TR–0001 Issue 02, Jun. 2015.

Chapter 11: References
236
105. B. Chen, P. E. J. Flewitt and D. J. Smith, “Microstructural sensitivity of 316H
austenitic stainless steel: Residual stress relaxation and grain boundary fracture,”
Materials Science and Engineering: A, vol. 527, no. 27–28, pp. 7387–7399, 2010.
106. J. Lindsay, F. Scenini, X. Zhou, G. Bertali, R.A. Cottis, M.G. Burke, F. Carrette
and F. Vaillant, “Characterisation of stress corrosion cracking and internal
oxidation of alloy 600 in high temperature hydrogenated steam,” 16th
International Conference on Environmental Degradation of Materials in Nuclear
Power Systems - Water Reactors, NACE, Asheville, 2013.
107. G. F. Vander Voort, G. M. Lucas and E. P. Manilova, “Metallography and
Microstructures of Stainless Steels and Maraging Steels,” in ASM Handbook,
Metallography and Microstructures, vol. 9, p. 1598, Ohio: ASM International,
2004.
108. “ASTM A262 – 01: Standard Practices for Detecting Susceptibility to
Intergranular Attack in Austenitic Stainless Steels.” pp. 1–17, ASTM
International, West Conshohocken, Pennsylvania, 2001.
109. D. N. Githinji, S. M. Northover, P. J. Bouchard and M. A. Rist, “An EBSD study
of the deformation of service-aged 316 austenitic steel,” Metallurgical and
Materials Transactions A, vol. 44, no. 9, pp. 4150–4167, 2013.
110. S. Flannagan, “Creep Testing Work Instruction - ENVISINC,” Amec FW,
AMEC/200324-AA-0015/WI/002 Issue 02, Oct. 2015.
111. “BS EN ISO 204:2009, Metallic materials – Uniaxial creep testing in tension –
Method of test, BSI British Standards,” 389 Chiswick High Road, London, W4
4AL, UK.
112. “BS EN ISO 9513:2012, Metallic materials – Calibration of extensometer
systems used in uniaxial testing, BSI British Standards,” 389 Chiswick High
Road, London, W4 4AL, UK.
113. “BS EN ISO 7500-2:2006, Metallic materials – Verification of static uniaxial
testing machines – Part 2: Tension creep testing machines – Verification of the
applied force, BSI British Standards,” 389 Chiswick High Road, London, W4
4AL, UK.
114. V. K. Sikka, “Effects of Thermal Aging on the Mechanical Properties of Type
316 Stainless Steel – Elevated-Temperature Properties,” Oak Ridge National
Laboratory Report, ORNL/TM-8371, Oct. 1982.
115. “BS EN ISO 6892-1:2009, Metallic materials – Tensile testing – Part 1: Method
of test at room temperature, BSI British Standards,” 389 Chiswick High Road,
London, W4 4AL, UK.

Chapter 11: References
237
116. “BS EN ISO 7500-1:2004, Metallic materials – Verification of static uniaxial
testing machines – Part 1: Tension/compression testing machines – Verification
and calibration of the force-measuring system, BSI British Standards,” 389
Chiswick High Road, London, W4 4AL, UK.
117. T. Slater, “Three Dimensional Chemical Analysis of Nanoparticles Using Energy
Dispersive X-ray Spectroscopy,” Doctoral Dissertation, School of Materials,
Faculty of Engineering and Physical Sciences, The University of Manchester,
2015.
118. B. Chen, Private communication, 2016.
119. S. G. Hong and S. B. Lee, “Dynamic strain aging under tensile and LCF loading
conditions, and their comparison in cold worked 316L stainless steel,” Journal of
Nuclear Materials, vol. 328, no. 2–3, pp. 232–242, 2004.
120. B. Wilshire and C. J. Palmer, “Grain size effects during creep of copper,” Scripta
Materialia, vol. 46, no. 7, pp. 483–488, 2002.
121. R. K. Desu, H. Nitin Krishnamurthy, A. Balu, A. K. Gupta and S. K. Singh,
“Mechanical properties of Austenitic Stainless Steel 304L and 316L at elevated
temperatures,” Journal of Materials Research and Technology, vol. 5, no. 1, pp.
13–20, 2016.
122. R. P. Reed, “The spontaneous martensitic transformations in 18% Cr, 8% Ni
steels,” Acta Metallurgica, vol. 10, no. 9, pp. 865–877, 1962.
123. B. M. Gonzalez, C.S.B. Castro, V.T.L. Buono, J.M.C. Vilela, M.S. Andrade,
J.M.D. Moraes and M.J. Mantel, “The influence of copper addition on the
formability of AISI 304 stainless steel,” Materials Science and Engineering: A,
vol. 343, pp. 51–56, 2003.
124. J. Talonen, “Effect of Strain-Induced α’-Martensite Transformation on
Mechanical Properties of Metastable Austenitic Stainless Steels,” Doctoral
Dissertation, Department of Mechanical Engineering, Helsinki University of
Technology, 2007.
125. G. C. Soares, M. C. M. Rodrigues and L. de A. Santos, “Influence of
Temperature on Mechanical Properties, Fracture Morphology and Strain
Hardening Behavior of a 304 Stainless Steel,” Materials Research, vol. 20, suppl.
2, pp. 141–151, 2017.
126. A. Al Mamun, “Origin of Creep-Fatigue Back Stress and its Effect on
Deformation and Damage,” Doctoral Dissertation, Department of Engineering
and Innovation, The Open University, 2016.
127. S. K. Lister, “CO2 Oxidation of 9Cr Steels: Treatment of the Carburised Layer
for Integrity Assessments.,” British Energy Report, E/EAN/BEEB/0009/AGR/03
Revision 000, Jun. 2003.

Chapter 11: References
238
128. F. Scenini, J. Lindsay, L. Chang, Y. L. Wang, M. G. Burke, S. Lozano-Perez, G.
Pimentel, D. Tice, K. Mottershead and V. Addepalli, “Oxidation and SCC
initiation studies of Type 304L SS in PWR primary water,” in Proceedings of the
18th International Conference on Environmental Degradation in Nuclear Power
Systems - Water Reactors, pp. 793–810, 2018.
129. L. Chang, L. Volpe, Y. L. Wang, M. G. Burke, A. Maurotto, D. Tice, S. Lozano-
Perez and F. Scenini, “Effect of Machining on Stress Corrosion Crack Initiation
in Warm-Forged Type 304L Stainless Steel in High Temperature Water,” Acta
Materialia, vol. 165, pp. 203–214, 2019.
130. C. Pascal, M. Braccini, V. Parry, E. Fedorova, M. Mantel, D. Oquab and D.
Monceau, “Relation between microstructure induced by oxidation and room-
temperature mechanical properties of the thermally grown oxide scales on
austenitic stainless steels,” Materials Characterization, vol. 127, pp. 161–170,
2017.
131. N. M. Smith, “Summary of AGR Coolant Composition 2010,” EDF Energy
Report, Barnwood: EDF Energy plc., E/REP/BPKB/0093/AGR/11, 2013.
132. G. H. Meier, W. C. Coons and R. A. Perkins, “Corrosion of Iron-, Nickel-, and
Cobalt-Base Alloys in Atmospheres Containing Carbon and Oxygen,” Oxidation
of Metals, vol. 17, no. 3–4, pp. 235–262, 1982.
133. N. K. Othman, J. Zhang and D. J. Young, “Water Vapour Effects on Fe-Cr Alloy
Oxidation,” Oxidation of Metals, vol. 73, no. 1–2, pp. 337–352, 2010.
134. G. Hultquist, B. Tveten and E. Hornlund, “Hydrogen in Chromium: Influence on
the High-Temperature Oxidation Kinetics in H2O, Oxide-Growth Mechanisms,
and Scale Adherence,” Oxidation of Metals, vol. 54, no. 1–2, pp. 1–10, 2000.
135. M. Michalik, M. Hansel, J. Zurek, L. Singheiser and W. J. Quadakkers, “Effect
of water vapour on growth and adherence of chromia scales formed on Cr in high
and low pO2-environments at 1000 and 1050°C,” Materials at High
Temperatures, vol. 22, no. 3–4, pp. 213–221, 2005.
136. S. K. Putatunda, “Corrosion Behaviour of Sensitised Austenitic (AISI 304)
Stainless Steel in a CO2 Atmosphere,” Materials Science and Engineering, vol.
91, pp. 89–95, 1987.
137. M. R. Ardigo, I. Popa, S. Chevalier, S. Weber, O. Heintz and M. Vilasi, “Effect
of Water Vapor on the Oxidation Mechanisms of a Commercial Stainless Steel
for Interconnect Application in High Temperature Water Vapor Electrolysis,”
Oxidation of Metals, vol. 79, no. 5–6, pp. 495–505, 2013.
138. B. Gleeson, “1.09 - Thermodynamics and Theory of External and Internal
Oxidation of Alloys,” Shreir’s Corrosion, vol. 1, pp. 180–194, 2010.

Chapter 11: References
239
139. P. Huczkowski, S. Ertl, J. Piron-Abellan, N. Christiansen, T. Höfler, V. Shemet,
L. Singheiser and W.J. Quadakkers, “Effect of component thickness on lifetime
and oxidation rate of chromia forming ferritic steels in low and high pO2
environments,” Materials at High Temperatures, vol. 22, no. 3/4, pp. 253–262,
2005.
140. J. D. Ramsay, H. E. Evans, D. J. Child, M. P. Taylor and M. C. Hardy, “The
influence of stress on the oxidation of a Ni-based superalloy,” Corrosion Science,
vol. 154, pp. 277–285, 2019.
141. K. Arioka, T. Yamada, T. Terachi and T. Miyamoto, “Dependence of Stress
Corrosion Cracking for Cold-Worked Stainless Steel on Temperature and
Potential, and Role of Diffusion of Vacancies at Crack Tips,” Corrosion Science,
vol. 64, no. 9, pp. 691–706, 2008.
142. K. Arioka, Y. Iijima and M. Miyamoto, “Acceleration of nickel diffusion by high
tensile stress in cold-worked type 316 stainless steel at 450°C,” Philosophical
Magazine, vol. 98, no. 28, pp. 2609–2617, 2018.
143. K. Arioka, T. Yamada, T. Miyamoto and T. Terachi, “Dependence of Stress
Corrosion Cracking of Alloy 690 on Temperature, Cold Work, and Carbide
Precipitation – Role of Diffusion of Vacancies at Crack Tips,” Corrosion
Science, vol. 67, no. 3, pp. 1–18, 2011.
144. H. J. Lee, G. O. Subramanian, S. H. Kim and C. Jang, “Effect of pressure on the
corrosion and carburization behavior of chromia-forming heat-resistant alloys in
high-temperature carbon dioxide environments,” Corrosion Science, vol. 111, pp.
649–658, 2016.
145. C. Liu, P. J. Heard, I. Griffiths, D. Cherns and P. E. J. Flewitt, “Carbide
precipitation associated with carburisation of 9Cr–1Mo steel in hot CO2 gas,”
Materialia, vol. 7, p. 100415, 2019.
146. M. J. Chevalier and J. Aveson, “Carburised Material Properties for R5 Volume
2/3 Assessments,” EDF Energy Report, E/REP/BBGB/0202/GEN/16 Revision
000, May 2017.
147. C. D. Hamm (ed.), “AGR Materials Data Handbook, R66.” Revision 009, EDF
Energy Nuclear Generation, 2011.
148. T. D. Nguyen, J. Zhang and D. J. Young, “Effects of silicon on high temperature
corrosion of Fe-Cr and Fe-Cr-Ni alloys in carbon dioxide,” Oxidation of Metals,
vol. 81, no. 5–6, pp. 549–574, 2014.

Chapter 12: Appendix
240
12. Appendix
A1 - Uniaxial creep specimen design (adapted from [88])

Chapter 12: Appendix
241
A2 - Overview of creep tests conducted at The University of Manchester
within the ENVISINC programme
*Test interrupted (sample not ruptured) - derived values are up to the interruption stage.
Tim
e to 3
% C
reep S
train
Tim
e to 2
% C
reep S
train
Tim
e to 1
% C
reep S
train
Ln
(Tru
e Stress/1
MP
a)
Ln
(Min
. Stra
in R
ate
/h)
Min
. Stra
in R
ate
Av
erag
e Stra
in R
ate
Tru
e Creep
Fa
ilure S
train
Tru
e Creep
Fa
ilure S
train
En
g. C
reep F
ailu
re Stra
in
Tru
e Stress In
c. Ca
rb.
Tru
e Stress
Elo
nga
tion
Red
uctio
n in
Area
Po
st-Test P
2P
Len
gth
Po
st-Test G
au
ge L
eng
th
Po
st-Test D
iam
eter
Tim
e to F
ractu
re
Test C
om
pletio
n D
ate
Test C
om
pletio
n T
ime
Stra
in o
n L
oa
din
g
Hea
ting
Sta
rt Da
te
Hea
ting
Sta
rt Tim
e
P2
P L
eng
th
Pa
rallel G
au
ge L
eng
th
Dia
meter
Test S
tress
Test T
emp
eratu
re
Ma
terial (3
16
H) C
on
ditio
n
Sp
ecimen
ID
[h]
[h]
[h]
[1/h
]
[1/h
]
[%]
[mm
/mm
]
[mm
/mm
]
[MP
a]
[MP
a]
[%]
[%]
[mm
]
[mm
]
[mm
]
[h]
DD
/MM
/YR
HR
/MN
[mm
/mm
]
DD
/MM
/YR
HR
/MN
[mm
]
[mm
]
[mm
]
[MP
a]
[°C]
68
9
5.8
7
-11
.68
8.3
97
E-0
6
1.4
08
E-0
5
1.5
30
E+
00
1.5
30
E-0
2
1.5
42
E-0
2
35
4
-
14
.08
50
.44
-
6.4
7
10
95
03
/08
/201
4
01
:45
0.1
052
2
17
/06
/201
4
12
:48
45
.22
39
.52
6.9
8
32
0
55
0
As-receiv
ed head
er (HR
A 1
C2
/3, C
ast 559
15
)
AC
S0
5
22
18
5.8
5
-12
.80
2.7
59
E-0
6
5.1
71
E-0
6
1.1
88
E+
00
1.1
88
E-0
2
1.1
95
E-0
2
34
7
-
17
.56
- -
6.3
1
23
11
20
/08
/201
4
21
:11
0.0
852
2
14
/05
/201
4
16
:42
45
.23
39
.54
6.9
5
AC
S0
6
24
63
5.8
5
-12
.89
2.5
15
E-0
6
4.8
58
E-0
6
1.3
06
E+
00
1.3
06
E-0
2
1.3
14
E-0
2
34
7
-
8.9
6
51
.04
-
6.6
6
27
05
29
/08
/201
4
09
:10
0.0
853
1
29
/04
/201
4
14
:24
45
.24
39
.39
6.9
8
AC
S0
7
19
17
11
60
25
8
5.8
5
-11
.56
9.4
72
E-0
6
1.7
07
E-0
5
3.4
34
E+
00
3.4
34
E-0
2
3.4
94
E-0
2
34
6
-
10
.07
- -
6.6
0
20
47
27
/11
/201
4
19
:56
0.0
824
1
02
/09
/201
4
14
:47
45
.23
39
.45
6.9
6
AC
S0
8
28
15
5.7
1
-12
.90
2.4
83
E-0
6
3.2
38
E-0
6*
1.1
28
E+
00*
1.1
28
E-0
2*
1.1
34
E-0
2*
30
2
-
7.5
6*
48
.77*
-
6.7
3*
35
02
*
05
/03
/201
5
09
:58
0.0
766
0
09
/10
/201
4
12
:21
45
.24
39
.32
7.0
0
28
0
AC
S0
9*
37
3
11
4
16
5.8
2
-10
.35
3.1
94
E-0
5
6.5
93
E-0
5
4.1
15
E+
00
4.1
15
E-0
2
4.2
00
E-0
2
37
8
33
8
-
10
.73
- -
6.7
0
63
7
07
/01
/201
5
02
:05
0.0
567
9
10
/12
/201
4
15
:31
45
.26
39
.77
7.0
9
32
0
Pre-carb
urised
AC
S1
9
44
52
92
6
37
5.6
4
-11
.83
2.9
32
E-0
6
5.8
96
E-0
6
3.9
63
E+
00
3.9
63
E-0
2
4.0
42
E-0
2
31
8
28
4
7.4
2
12
.33
49
.66
42
.28
6.6
2
68
55
27
/12
/201
5
03
:09
0.0
166
9
26
/02
/201
5
11
:50
45
.18
39
.36
7.0
7
28
0
AC
S3
6
10
44
18
2
12
5.7
3
-11
.36
1.1
60
E-0
5
1.9
66
E-0
5
4.1
90
E+
00
4.1
90
E-0
2
4.2
79
E-0
2
34
6
31
0
-
11
.99
49
.06
-
6.6
4
21
76
28
/05
/201
5
09
:21
0.0
326
6
26
/02
/201
5
13
:08
45
.15
39
.96
7.0
8
30
0
AC
S3
8
29
30
19
35
70
4
5.8
4
-11
.70
8.2
75
E-0
6
1.2
83
E-0
5
4.3
84
E+
00
4.3
84
E-0
2
4.4
82
E-0
2
34
6
9.2
9
14
.03
49
.16
42
.93
6.4
9
34
93
02
/08
/201
5
04
:57
0.0
831
0
09
/03
/201
5
12
:02
45
.23
39
.28
7.0
0
32
0
Th
erm. ag
ed
AC
S4
6

Chapter 12: Appendix
242
A3 - Overview of interrupted creep tests conducted on pre-carburised
316H material at The University of Manchester
Note: during the load calculation, a reduction of 0.2 mm of the outer diameter (to isolate the
oxide layer formed in the course of the preconditioning procedure) for all three samples was
omitted, so the applied stress level was higher than intended, and thus equivalent to a stress
of ~254 MPa. All test data are calculated accordingly.
Specimen ID ACS11 ACS17 ACS29
Material (316H) Condition Pre-carburised
Test Temperature [°C] 550
Test Stress Intended [MPa] 240
Test Stress Applied [MPa] 254.2 254.4 254.2
Diameter [mm] 7.03 7.05 7.03
Parallel Gauge Length [mm] 39.22 40.17 40.21
P2P Length [mm] 45.27 45.24 45.31
Heating Start Time HR/MN 15:45 15:24 16;58
Heating Start Date DD/MM/YR 21/01/2016 21/01/2016 21/01/2016
Strain on Loading [mm/mm] 0.00880 0.00950 0.00527
Test Completion Time HR/MN 17:09 17:09 17:09
Test Completion Date DD/MM/YR 05/02/2016 05/02/2016 05/02/2016
Time to Interruption [h] 338 338 335
Post-Test Diameter [mm] 6.92 6.91 6.94
Post-Test Gauge Length [mm] 39.80 40.76 40.63
Post-Test P2P Length [mm] 45.91 45.89 45.79
Reduction in Area [%] 3.12 3.95 2.55
Elongation [%] 1.48 1.47 1.04
True Stress [MPa] 256 257 256
True Stress Inc. Carb. [MPa] 272 272 271
Eng. Creep Strain [mm/mm] 0.760E-02 0.710E-02 0.622E-02
True Creep Strain [mm/mm] 0.757E-02 0.707E-02 0.620E-02
True Creep Strain [%] 0.757E+00 0.707E+00 0.620E+00
Average Strain Rate [1/h] 2.249E-05 2.100E-05 1.857E-05
Min. Strain Rate [1/h] - - -
Ln (Min. Strain Rate/h) - - -
Ln (True Stress/1 MPa) 5.55 5.55 5.55
Chapter 12: Appendix
243
B - Overview of RT tensile tests conducted on as-received 316H header
material at The University of Manchester
*Incremental tensile loading; measurements from the dimensional analyses performed after
each loading phase are presented separately beneath the overview table.
Specimen ID 1 2 3* 4 5
Material (316H) Condition As-received header (HRA 1C2/3, Cast 55915)
Test Temperature [°C] RT
Specimen Loading / Stress [MPa] To rupture Incremental 320 350
Strain Rate [%/s] 0.035 0.14
Gauge Width [mm] 3.02 3.01 3.01 3.00 3.01
Gauge Thickness [mm] 1.11 1.08 1.12 1.10 1.13
Parallel Gauge Length [mm] 12.106 12.257 12.138 12.057 12.092
P2P Length [mm] 22.007 22.013 22.011 22.018 22.050
Overall Length [mm] 49.082 49.161 49.105 49.150 49.122
Young’s Modulus [GPa] 187 190 178 168 172
0.2% Proof Stress [MPa] 376 357 332 309 316
UTS [MPa] 625 623 631 - -
Post-Test Width [mm] 1.62 1.71 1.77 2.99 2.98
Post-Test Thickness [mm] 0.76 0.70 0.81 1.07 1.10
Post-Test Gauge Length [mm] 18.924 18.645 17.871 12.128 12.244
Post-Test P2P Length [mm] 32.521 32.051 31.618 22.096 22.225
Post-Test Overall Length [mm] 59.604 59.195 58.720 49.217 49.289
Reduction in Area [%] 63.2 62.8 57.2 - -
Elongation [%] 56.3 52.1 47.2 - -
Specimen ID Plastic Strain Level, %
3 0 10 30 44 47
Gauge Width [mm] 3.01 2.88 2.54 1.91 1.77
Gauge Thickness [mm] 1.12 1.07 0.98 0.85 0.81
Parallel Gauge Length [mm] 12.138 13.350 15.785 17.457 17.871
P2P Length [mm] 22.011 24.212 28.514 31.036 31.618
Overall Length [mm] 49.105 51.306 55.608 58.130 58.720

Chapter 12: Appendix
244
C1 - Overview of oxidation tests under load conducted on conventional
dog-bone specimens of as-received 316H header material in atmospheric
1% CO/CO2 + 300 vppm H2O environment at 550°C.
*Values are calculated from measurements recorded by the LVDT sensors during testing; ☼Percent elongation determined using the pre- and post-test dimensional analyses
performed on the parallel gauge of each sample.
Specimen ID 1 2 3 4 5
Material (316H) Condition As-received header (HRA 1C2/3, Cast 55915)
Test Temperature [°C] 550
Test Stress [MPa] 350
Loading condition Load -
unload Load + creep
Specimen positioning Vertical Horizontal Vertical
Exposure time [h] 500 100 500
Gas flow rate [L/h] 2.2 4.5 2.2
Gauge Width [mm] 2.98 3.01 3.00 2.99 2.99
Gauge Thickness [mm] 1.07 1.02 1.12 1.16 1.08
Parallel Gauge Length [mm] 12.095 12.058 12.001 12.055 12.026
P2P Length [mm] 22.130 21.984 22.008 22.047 22.025
Overall Length [mm] 48.751 49.001 49.003 49.004 48.946
Strain on Loading* [%] 14.70 13.82 14.12 15.09 13.77
Post-Test Width [mm] 2.88 2.87 2.83 2.81 2.86
Post-Test Thickness [mm] 1.00 0.96 1.03 1.08 1.00
Post-Test Gauge Length [mm] 13.221 13.477 13.560 13.590 13.387
Post-Test P2P Length [mm] 23.553 23.708 23.846 23.996 23.669
Post-Test Overall Length [mm] 50.165 50.724 50.843 50.965 50.592
Reduction in Area [%] 9.68 10.26 13.25 12.91 11.43
Elongation☼ [%] 9.31 11.77 12.99 12.73 11.32
Eng. Creep Strain* [%] - 0.83 1.78 1.47 0.59
Total Inelastic Strain* [%] 14.70 14.65 15.89 16.55 14.36

Chapter 12: Appendix
245
C2 - Overview of the oxidation test under load conducted on the sample
with taper gauge geometry of as-received 316H header material in
atmospheric 1% CO/CO2 + 300 vppm H2O environment at 550°C.
*Values are calculated from measurements recorded by the LVDT sensors during testing; ☼Percent elongation determined using the pre- and post-test dimensional analyses
performed on the tapered gauge of the sample.
Specimen ID 6
Material (316H) Condition As-received header
(HRA 1C2/3, Cast 55915)
Test Temperature [°C] 550
Test Stress [MPa] 350
Loading condition Load + creep
Specimen positioning Vertical
Exposure time [h] 500
Gas flow rate [L/h] 2.2
Gauge Width on the Narrow End
[mm]
2.97
Gauge Width at the Middle 3.96
Gauge Width on the Wide End 4.99
Gauge Thickness [mm] 1.09
Gauge Length [mm] 12.005
P2P Length [mm] 21.050
Overall Length [mm] 48.981
Strain on Loading* [%] 8.08
Post-Test Width on the Narrow End
[mm]
2.88
Post-Test Width at the Middle 3.88
Post-Test Width on the Wide End 4.94
Post-Test Thickness on the Narrow End
[mm]
1.01
Post-Test Thickness at the Middle 1.03
Post-Test Thickness on the Wide End 1.06
Post-Test Gauge Length [mm] 12.775
Post-Test P2P Length [mm] 21.983
Post-Test Overall Length [mm] 49.919
Reduction of Area on the Narrow End
[%]
10.12
Reduction of Area at the Middle 7.32
Reduction of Area on the Wide End 3.76
Elongation☼ [%] 6.41
Eng. Creep Strain* [%] 0.94
Total Inelastic Strain* [%] 9.02


