

1
"This accepted author manuscript is copyrighted and published by Elsevier. It is posted here
by agreement between Elsevier and MTA. The definitive version of the text was subsequently
published in [GEODERMA (ISSN: 0016-7061) 235-236: 260-270 (2014), DOI
10.1016/j.geoderma.2014.07.017]. Available under license CC-BY-NC-ND."
Effect of metal oxide on surface area and pore size of
water-dispersible colloids from three German silt loam
topsoils.
Canlan Jianga,1
, Jean-Marie Séquarisa,*, András Wacha
b, Attila Bóta
b, Harry
Vereeckena, Erwin Klumpp
a
aAgrosphere, IBG 3, Forschungszentrum Jülich GmbH, D-52425 Jülich, Germany
bDepartment of Biological Nanochemistry, Institute of Molecular Pharmacology, Research
Centre for Natural Sciences, Hungarian Academy of Sciences (IMP RCNS HAS), Pusztaszeri
út 59-67, H-1025 Budapest, Hungary1
*Corresponding author: Tel. +492461616635; fax: +49246161251823
E-mail address: [email protected] (J.-M. Séquaris)
Abstract: The surface area and pore structure of easily dispersed soil particles < 2 µm in size
(water-dispersible colloids, WDCs) are important for carbon sequestration and transport in
soil. Two processes are essential for the terrestrial carbon cycling. In this work, we determine
the effects of dithionite-citrate-bicarbonate (DCB) extractable metal oxides, and oxalate
extractable metal oxides on the specific surface area (SSA) and pore structure of WDCs from
silt loam topsoils of three TERENO test sites with a similar clay content (20%) in Germany
1
Abbreviations: BJH, Barret-Joyner-Halenda; CB, citrate-carbonate; DCB, dithionite-citrate-
bicarbonate; DLS, dynamic light scattering; Dm, mass fractal dimensions; DOC, dissolved organic
carbon; Ds, surface fractal dimension, dp, particle diameter; dz,, z-average particle diameter; k, pore
fractal dimension; MCB, citrate-bicarbonate extractable metal; MDCB, dithionite-citrate-bicarbonate
extractable metal; Moxalate, oxalate-extractable metal; ME, microelectrophoretic; Vp, total pore
volumes; q, scattering vector; Roll, Rollesbroich; Rp, pore radii; SAXS, small-angle X-ray scattering;
Selh, Selhausen; SSA, specific surface area; TOC, total organic carbon; WDC, water-dispersible
colloid; Wuest, Wuestebach; ζ, zeta potential; 70, before OC removal; 400, after OC removal.
2 1present address:The College of Resources and Environmental Sciences, Nanjing
Agricultural University, Nanjing, 210095, People’s Republic of China

2
(arable (Selhausen), grassland (Rollesbroich) and forest (Wuestebach) soils). The N2 gas-
adsorption (−196°C), small-angle X-ray scattering (SAXS), dynamic light scattering (DLS)
and microelectrophoretic (ME) methods were used and compared. Results show that 1) the
SSA of the WDCs from Selhausen, Rollesbroich, and Wuestebach decreased more after DCB
treatment (27%, 35%, and 44%) than after oxalate treatment (5%, 14%, and 22%). DCB
removed metal oxide nanoparticles from WDCs were found to have diameters (dp) ranging
from 4 nm to 8 nm and the surface loading ratios on the surface of aluminosilicate residues in
WDCs were estimated to be 11% to 22% for three soils where the highest value was found in
the acidic forest soil. 2) Pore sizes in the mesopore range (2 nm to 50 nm) were analyzed in
the WDC fractions. The results were discussed in terms of accessible open pores for the
pristine WDCs and WDC samples from which metal oxide nanoparticles and organic carbon
(OC) had been removed. The lower average pore radius (Rp) measured by the N2 gas-
adsorption method based on the total volume (Vt) to SSA ratio variations in WDCs without
metal oxides compared to WDC with metal oxides indicated a contraction of the porous
structure of WDCs due to the presence of metal oxide nanoparticles. The pore size
distribution (PSD) analysis showed a sensitive contribution of metal oxide nanoparticles in
the low range of pore sizes (< 25 nm) of WDCs. In SAXS measurements, higher surface
fractal dimensions (Ds) were observed in WDCs before the metal oxides removal, which
supports a roughness increase of the interfaces in the presence of nanoparticles. The colloidal
characterization of WDCs by the DLS and ME methods shows, at a µm scale, the role of
positively charged metal oxide nanoparticles in forming WDCs with a more compact structure
by decreasing the particle size (dz) and the negative zeta potential (ζ). 3) The comparison of
Rp, k, dz and dp results between different soils also indicates the dependence on the clay
mineralogy of WDCs so that the heterocoagulation between kaolinite and illite (clay minerals
of different aspect ratios) increases the size of soil mesopores (Rollesbroich). In conclusion,
the results of this study clearly show that the combination of the N2 gas-adsorption, SAXS,
DLS and ME methods allows the characterization of soil porosity in the nanometer range
where metal oxide nanoparticles contribute to a more compact structure of WDC.
Key words: Metal oxide; Water dispersible colloid; Particle size; Surface area; Mesopore;
Small-angle X-ray scattering; N2 gas-adsorption; Dynamic light scattering;
Microelectrophoretic method.

3
1. Introduction
Soil structures have an important influence on environmental processes such as water
filtration and carbon sequestration. The large specific surface area (SSA) of the soil clay
fraction traps and stabilizes organic carbon (OC) through electrostatic and chemical
complexations (Mikutta et al. 2007). The inclusion of the soil clay fraction in the narrow
porous structure of soil hinders the accessibility of OC to microbial degradation (Sollins et al.
1996; Baldock and Skjemstad 2000; Six et al. 2002). Water dispersible colloids (WDCs) that
can be easily dispersed in contact with soil water are soil particles < 2 µm from soil clay
fractions. They mainly include aluminosilicate and metal oxide particles, which can be
released from soil aggregate structures. The dispersions of the soil clay content into a WDC
form promotes the accessibility of uncomplexed organic matter and leads to its further
transport as dissolved organic matter (DOM) (McCarthy and Zachara, 1989; Kretzschmar, et
al., 1999). By strongly associating with the clay surfaces of WDC, transport of OM into
deeper soil layers is also possible (Séquaris et al., 2010). Mechanical and chemical processes
in soil are key factors which affect the stability of soil aggregates and thus the release and
stability of mobile WDCs such as a combination of hydrodynamic parameters (intensive rain,
splash erosion, infiltration water rate) and chemical dispersion conditions (the presence of
organic matter, increasing pH, decreasing ionic strength and increasing sodium adsorption
ratio (SAR)) (Jarvis et al., 1999; Kjaergaard et al., 2004a, b). It has been shown that shaking
soil aggregates in low-ionic strength water simulates erosive dispersion (Séquaris et al., 2010).
WDC release has been modeled by formulating a two-step mechanism (Ryan & Gschwend,
1994; Ryan & Elimelech, 1996). A rapid detachment step of WDC is shown by modeling the
net-interaction energy potential between colloids and mineral grains. It is followed by a
diffusion-controlled transport step of the mobilized WDC through immobile water layers at
the soil aggregate surfaces in the low mechanical energy range of batch experiments (Ryan &
Gschwend, 1994;Jiang et al., 2014).
The heterogeneous WDC structure contributes to the sequestration of organic matter.
The organic matter is stabilized by physical inclusion and chemical reaction with metal oxide
surfaces (Kaiser and Guggenberger, 2000; Wagai and Mayer, 2007; Kiem and Kögel-Knabner
2002; Kaiser and Guggenberger 2003; Eusterhues et al. 2005). Various forms of iron oxides
can be found in soils (Cornell and Schwertmann, 2003). Iron oxides in crystalline form such
as goethite and in less-crystalline forms such as hydrous oxide ferrihydrite are the most
abundant (Childs, 1992; Gaboriaud and Ehrhardt, 2003; Roden and Zachara, 1996). In the

4
case of aluminium oxide, less-crystalline forms such as hydrous oxide gibbsite are the most
common (Gilkes et al., 2006; Rosenqvist et al., 2003). These metal oxides can be selectively
extracted by different dissolution methods. Dithionite–citrate–bicarbonate (DCB) treatment
(Turchenek and Oades, 1979, Cornell and Schwertmann, 1996, Kiem and Kögel-Knabner,
2002; Mehra and Jackson, 1960) mainly extracts Fe oxyhydroxides, which can be used to
calculate the total iron oxide (MDCB) via reduction and parts of the dissolve oxides for Al and
Si. Ammonium oxalate treatment (pH 3) (Kiem and Kögel-Knabner, 2002; Schwertmann,
1964) is generally used for the selective dissolution of Fe, Al, and Si (Moxalate) from poorly
crystalline aluminosilicates, ferrihydrite and Al- and Fe-humus complexes, but the Al, Fe, Si
from gibbsite, goethite, hematite and layer silicates are not included (Mikkuta et al., 2005).
Despite the relatively low mass contribution of metal oxides to German soil, these nanometer-
sized mineral particles have significant effects on the total surface of soil aggregates because
of their inherently large surface area. (Eusterhues et al., 2005; Kaiser and Guggenberger, 2003;
Pronk et al., 2011). These particles are located as free clusters or cover the surface of much
larger particles (Desphande et al. 1968; Hendershot and Lavkulich 1983). They contribute to
the porous structure of WDC by their interactions with large plate-like particles of clay
minerals. Thus, small organic molecules, such as organic acids, should be able to enter
micropore space (< 2 nm), where they would be protected from microorganisms and their
enzymes (Eusterhues et al., 2005). A comprehensive characterization of the heterogeneous
porosity of WDCs in air-dried and water-dispersed states requires different chemical and
physical approaches. Pores can be defined as open pores if they communicate with the
external surface and are accessible to molecules or ions from the surroundings. By contrast,
closed pores are closed as individual voids in the mineral matrix which is not interconnected
to the external surface (Radlinski et al., 2004). The N2-gas adsorption method has been widely
used to measure the specific surface area (SSA) and characterize the open porosity of air-
dried soil particles, especially the mesoporosity (pore width between 2-50 nm) and
microporosity (pore width not exceeding 2 nm) (Mayer et al., 2004; Pronk et al., 2011). The
small-angle X-ray scattering (SAXS) technique (Guinier and Fournet, 1955) has been used
more generally for the internal and external structural characterization of porous solid
materials on a length scale of typically 1 nm to 100 nm as in the case of silica gel (Schmidt,
1991; Schmidt et al., 1991) and clay minerals (Pernyeszi and Dékány, 2003). It has been
shown that SAXS technique is suitable for studying fractal dimensions, (D) of powders with
porous or irregular surface (Höhr et al., 1988; Schmidt, 1991) where D values are provided
from a power law of the measured scattered intensity I(q) as a function of the scattering angle

5
2θ. D values have thus expressed the compactness of allophane aggregate clusters in andosols
(Chevallier et al., 2010) and the surface roughness of soil grains (Borkovec et al., 1993).
Broadly speaking, higher D values point to higher surface roughness, higher aggregation
mechanism and higher cluster compactness (Marliere et al., 2001).
The effect of metal oxides on soil SSA and pores can be determined through N2 gas-
adsorption method while investigations using the SAXS method are not aware to our
knowledge. Kaiser & Guggenberger found that the SSA of soils is highly correlated with the
amount of Fe oxyhydroxides (Kaiser and Guggenberger, 2003). Eusterhues et al. (Eusterhues
et al., 2005) studied two German acid forest soils and found only a few micropores remaining
in samples after the dissolution of iron oxides. The soluble minerals in the DCB extraction
method were identified as the main microporous phases in soil. Filimonova et al. (Filimonova
et al., 2006) demonstrated that the removal of iron oxides by DCB treatment decreases the
SSA by up to 50%. In their study, the micropores completely vanished in two German luvisol
and gleysol soils.
In the present study, both gas adsorption and SAXS were applied to investigate the
effect of metal oxide particles in the SSA and porous structure of the mineral matrix in WDC
samples in the freeze-dried state. The variations of colloidal properties of WDCs were
detected in the water-dispersed state of WDC samples by dynamic light scattering (DLS) and
microelectrophoretic (ME) methods. Soil samples were obtained from the TERENO project,
whose observatories span Germany and supply data regarding the impact of long-term climate
change on ecosystems, land use, and infrastructure at the regional level (www.TERENO.net)
(Zacharias et al., 2011). This study is part of the SoilCan project (Puetz et al., 2009) of
TERENO and mainly focuses on the stability of soil aggregates. (Séquaris et al., 2013; Jiang
et al., 2014). Three German silt loam topsoils were systematically analyzed after applying the
DCB and oxalate extraction methods. The three soils were luvisol, cambisol, and gleysol, all
of which are widespread and important for agriculture all over the world (Driessen et al.,
2001). With N2 gas-adsorption, SSA variations in WDC fractions and bulk soils were
examined. In the case of WDC fractions, total pore volumes (Vp) were also measured to
further calculate the distribution of pores and the average pore radii (Rp). Particular attention
was paid to estimating the size extent of the coverage of metal oxide nanoparticles in the
mesopore size range of the WDC mineral matrix. Information obtained by the SAXS method
about the surface fractal dimensions from power law scattering intensity was recorded. The
diameter and zeta potential of colloidal WDCs were further investigated by the DLS and ME

6
methods, respectively. The results of the colloidal characterization of the samples in the
micrometer range were related and compared to the N2 gas-adsorption and SAXS results. This
study aims to reconcile results using very different measurements and to provide information
on WDC structure parameters affected by metal oxides.
2. Materials and methods
2.1. Soil samples
Topsoil samples (0 cm to10 cm) were collected in July 2010 from three test sites in
Germany, Selhausen (Selh) (50°52′08′′N; 6°26′59′′E; arable luvisol), Rollesbroich (Roll)
(50°37′18′′N; 6°18′15′′E; grassland cambisol) and Wuestebach (Wuest) (50°37′18′′N;
6°18′15′′E; forest gleysol). The topsoil samples were air- dried. Visible stones and large
pieces of plant materials were removed by hand. The soil samples were ground to pass
through two sieves (mesh widths 5 and 2 mm). The < 2 mm fraction was defined as bulk soil.
2.2. Analytical characterization of topsoil samples.
Total organic carbon (TOC) was determined with a LECO RC-612 carbon analyzer
after correcting the total carbon from the inorganic carbon content. Total nitrogen (TN)
contents were analyzed with a C/N analyzer (Vario EL cube; Elementar, Hanau, Germany).
Total metal contents were determined with an inductively coupled plasma–optical emission
spectroscopy (ICP–OES) Thermo Elemental (TJA) Iris Intrepid spectrometer. The pH was
measured with an Expandable Ion Analyzer EA 940 from Orion Research. The mineralogy of
the clay fraction (Table 1) was determined by standard XRD with Mg-glycerol- and K-
glycerol-saturated samples. XRD analysis was performed using a Philips diffractometer
(Model PW 1130/90, Almelo, The Netherlands) with Co-Kα radiation (1600 watts, Ni filter)
at a scanning speed of 2° per minute.
2.3. Soil WDC fractionation
In order to obtain the WDC fraction in batch experiments with minimum artificial
impacts on soil structure, a soft soil particle-size fractionation method (Séquaris and
Lewandowski, 2003) including shaking and sedimentation processes was chosen. Indeed, an
estimation of the kinetic energy to disperse WDC was made (Jiang et al., 2014). This is
relatively low in comparison with the total energy applied in end-over-end shaking and
7
ultrasonic methods. According to the method, a 1000 mL Duran bottle (Schott, Germany)
containing 100 g of air-dried soil and 200 mL of Millipore deionized water was shaken
horizontally using a thermostated incubator at a rotational speed of 170 rpm for 6 h at 23°C.
The mixed suspension was allowed to settle after the addition of 600 mL of Millipore
deionized water. After a sedimentation time of 12 h at 23°C, a separate aqueous phase
containing the nonsettling colloidal particle fraction (< 2 µm) was obtained. This easily
dispersed colloidal soil content in the aqueous phase was designated WDCs. A solid size
fraction ranging from 0.05 µm to 2 µm was obtained after high-speed centrifugation (10,000 g;
90 min) of the colloidal dispersion without any filtration. The remaining upper aqueous phase
was designated the electrolyte phase. The organic carbon content of this phase (<0.6% of
TOC) was not considered in the present study. WDCs and bulk soil samples were freeze-dried
before analysis of the TOC, TN, and total metal contents. The N2 gas- adsorption and SAXS
methods were applied before and after thermal oxidation of the freeze-dried samples.
2.4. Determination of dithionite-extractable Fe, Al and Si (DCB method)
Dithionite-extractable Fe (FeDCB), Al (AlDCB) and Si (SiDCB) were determined in the
three replicates through DCB extraction(Kiem et al., 2002). DCB stock solution was prepared
by mixing 600 mL of sodium citrate (0.3 M), 0.2 L of sodium hydrogenocarbonate (1 M), and
15 g of sodium dithionite. The soil samples (200 mg) were dispersed in 40 mL of DCB stock
solution in a centrifugation tube. After shaking on a horizontal shaker for 16 h at room
temperature, the soil dispersion was centrifuged at 7741 g for 30 minutes and the supernatant
was retained. The centrifugate was dispersed again in 32 mL of magnesium sulfate (0.05 M)
to exchange the sorbed metals from DCB extraction and then centrifuged for the second time.
The two supernatant phases were combined and the FeDCB, AlDCB and SiDCB contents were
analyzed with an ICP-OES Thermo Elemental (TJA) Iris Intrepid spectrometer. The soil
samples treated without the dithionite reagent (CB treatment, MCB) were used as reference to
distinguish possible complexation and exchange effects of free metals by citrate/bicarbonate
and magnesium, respectively from the metal oxide dissolution effects due to dithionite
(Barberis et al., 1991). Fe (FeCB), Al (AlCB), and Si (SiCB) were assigned to soluble forms of
metal complexes. The treated soil samples were collected and freeze-dried. N2 gas- adsorption
and SAXS were applied after thermal oxidation of the freeze-dried samples.
8
2.5. Determination of oxalate-extractable Fe, Al, and Si
The soil samples were extracted in triplicate with ammonium oxalate to measure the
concentrations of Feoxalate, Aloxalate and Sioxalate (Kleber et al., 2005; Masiello et al., 2004;
Mikutta et al., 2005). A 0.2 M oxalate solution was prepared with 0.113 M ammonium
oxalate and 0.087 M oxalic acid (Kiem and Kögel-Knabner, 2002). A centrifugation tube
containing 200 mg of the soil samples (bulk soil sample and WDC) and 40 mL of an acidic
oxalate solution (0.2 M, pH around 3) was shaken on a horizontal shaker for 2 hours in the
dark. After shaking, the soil dispersion was centrifuged (7741 g and 30 minutes). The
supernatant containing Feoxalate, Aloxalate and Sioxalate was analyzed by an ICP-OES Thermo
Elemental (TJA) Iris Intrepid spectrometer. Average values were obtained from the three
replicate measurements. The soil samples were treated without the oxalate reagent (Millipore
water, blank) and were used as a reference to distinguish a possible water leaching effect from
the dissolution effect due to oxalate. The contents of Fe (Feblank), Al (Alblank), and Si (Siblank)
were analyzed and the treated soil samples were collected and freeze- dried. N2 gas-
adsorption was applied after thermal oxidation of the freeze-dried samples.
2.6. Thermal oxidation
OM was removed from the freeze-dried bulk soil and WDC fractions by thermal
oxidation (Mayer, 1994b; Mayer et al., 2004; McCarthy et al., 2008; Séquaris et al., 2010;
Sollins et al., 2007) at 400°C for 16 h. This treatment can remove 95% of the TOC originally
present in the soil sample (Séquaris et al., 2013). The samples after OC removal were labeled
as CB400, DCB400, blank400, and oxalate400. The samples before OC removal were labeled
as CB70, DCB70, blank70, and oxalate70 (see also 2.7 N2 gas-adsorption).
2.7. N2 gas-adsorption experiment
SSA (m2
g −1
) was analyzed by N2 adsorption at −196°C with an AUTOSORB-1
(Quantachrome) apparatus. SSA was calculated according to the multilayer adsorption
isotherm derived by Brunauer, Emmet and Teller, also known as the BET isotherm (Lowell et
al., 2006) in a relative pressure range P/P0 <0.3. Three replicate measurements were
performed. The soil samples were degassed for 16 h at 70°C using N2 as the carrier gas before
determining SSACB70. This procedure removed the water content without destroying the OM.
The OM of the soil samples was removed by thermal oxidation to measure the SSACB400,

9
SSADCB400, SSAblank400 and SSAoxalate400 of the mineral phase. The soil samples were degassed
for 2 h at 200°C using N2 as the carrier gas before SSA determination. During the thermal
oxidation process, possible mineral surface modifications of metal oxide content were brought
about (Kaiser and Guggenberger, 2003). Indeed, phase changes in goethite and ferrihydrite to
hematite were generally observed in the temperature range from 50°C to 400°C under Si-free
conditions (Campbell et al., 2002). This results in an SSA increase of 50% for goethite and an
SSA decrease of 80% for ferrihydrite (Clausen and Fabricius, 2000). Low-temperature
chemical oxidation processes of OM were thus proposed (Kaiser and Guggenberger, 2003;
Kiem and Kögel-Knabner, 2002; Kahle et al., 2003; Wagai et al., 2009) for the removal of
OM. Results of low-temperature chemical oxidation and thermal oxidation on mineral SSA
for similar soils have been discussed (Wagai et al., 2009; Sequaris et al., 2010). It was found
that the lower efficiency of low-temperature chemical oxidation for total OM removal mainly
limits the comparison of SSA (Wagai et al., 2009).
In the same way, we have removed the OM from WDC samples by using sodium
peroxodisulfate (Na2S2O8) according to the method of Kiem and Kögel-Knaber (Kiem and
Kögel-Knabner, 2002). The SSAchemical results were compared to SSA400. Slightly higher
values were measured for SSAchemical (m2g
-1): 92.9, 77.9 and 93.9 in comparison to SSA400
(m2g
-1): 84.1, 74.7 and 83.6 for Selhausen, Rollesbroich and Wuestebach WDC samples,
respectively. Corresponding SSAchemical/SSA400 ratios of 1.1, 1.04 and 1.1 were calculated for
Selhausen, Rollesbroich and Wuestebach respectively which indicate some maximal SSA
variations of about 10% between the both methods. Furthermore, the detection of possible
alterations of the mineral surface due to the muffling technique in the temperature range from
70°C to 400°C was investigated in the case of Selhausen soils. Comparative SSA
measurements were made of six bulk soil samples (Table 2) taken at two sampling points C1
and C16 (Borneman et al., 2011) from depths of 0-30 cm, 30-60 cm, and 60-90 cm. Soil
samples with the lowest TOC contents (TOC < 13 g kg-1
) were thus chosen to minimize the
potential interference of OC contents on the SSA measurement of the mineral surface. After
dry heating at 70°C (SSA70) and thermal oxidation at 400°C (SSA400), an average
SSA70/SSA400 value of 0.97 0.10 was calculated for the six soil samples. In the case of the
subsoil samples with the lowest OC contents (TOC < 5 g kg-1
), an average SSA70/ SSA400
value of 1.07 0.03 was found (table 2). It can be thus concluded to that thermal oxidation at
400°C led to a surface alteration with a decrease of SSA by less than 10%. Thus the reported
SSA400 values being considered to be the SSA value of the soil mineral surface are reasonable.

10
SAXS data have also shown that the arrangement of aluminosilicate particles forming
mesopores in soil and sediment samples remains largely unaffected after the removal of
organic matter (OM) by muffling at 375 °C (Mayer et al., 2004). It is to be noted that a rather
high Si content in natural ferrihydrite may also hinder a hematite transformation under
temperature conditions comparable to those used in laboratory syntheses (Campbell et al.,
2002).
The total pore volume (Vp) of the soil samples was determined at a P/P0 of 0.995. The
volume - to - surface area ratio of the pore was used to scale the average pore radius (Rp)
variations. According to IUPAC (1985), Vp /SSA is the radius of parallel -sided slit shaped
pores. In nonintersecting cylindrical capillaries, Rp is calculated as 2 Vp /SSA (Lowell et al.,
2006). The pore size distributions (PSDs) were obtained by the Barret–Joyner–Halenda (BJH)
method from the adsorption branch of the N2 isotherm, which was hardly affected by the
tensile strength effect of N2 in comparison to the desorption branch (Groen et al., 2003). The
modified Kelvin equation based on a cylindrical pore model serves as the basis for the BJH
method (Lowell et al., 2006).
The Dubinin-Radushkevitsch (DR) equation (Lowell et al., 2006) was used to
calculate the micropore volume (Vµpore) in WDC (pore widths not exceeding 2 nm) in a
relative pressure range P/P0 < 0.0025.
2.8. Characterization of metal oxide effects in soil samples using N2 gas- adsorption.
Contribution of metal oxide content to total mineral SSA
The differences between SSACB400 and SSADCB400 were used to estimate the
contribution of DCB extracted metal oxide content to the total mineral SSACB400 of WDCs and
bulk soil samples:
400
400400oxide metal total %
CB
DCBCB
SSA
SSASSAoncontributiSSA
(1)
The differences between SSAblank400 and SSAoxalate400 were used to estimate the contribution of
oxalate extractable metal oxide content to the total mineral SSAblank400 of WDCs and bulk soil
samples:

11
400
400400oxide metal ecrystallin-non %
blank
oxalateblank
SSA
SSASSAoncontributiSSA
(2)
Estimation of extracted metal oxide SSA (SSAmetal oxide) from WDC
The SSAmetal oxide of the WDCs was estimated by considering a simple additive law for
the SSA contributions of metal oxide particles and WDC residues after dithionite dissolution
(SSADCB400) to the mineral surface of WDC (SSACB400) :
w
SSAwSSASSA DCBCB 400400
oxides metal
1 (3)
where SSADCB400 is assigned to the SSA of the aluminosilicate content in WDC and w (g g-1
,
Table 3) is the mass (g) of released metal oxide per g of WDC (weight fraction).
Surface loading ratio (θ) estimation of metal oxide particles in WDC
For particles with a spherical shape and radius r, the sum of the projected circular
surface area from the total content of N spherical nanoparticles (considered as non-porous
spheres) of per g WDC was calculated as Nπr2
= SSA metal oxide *w / 4 where SSA metal oxide is the
spherical surface area (surface = 4πr2). Thus, the surface loading ratio (θ) per g of WDC was
calculated as
4004 DCB
oxidemetal
SSA
wSSA (4)
Calculation of metal oxide particle diameter (dp)
The SSA per particle mass (m2 g
−1) was calculated as
rrN
rNSSA
3
3
4
4
3
2
oxides metal (5)
where r is the particle radius and ρ is the particle density (g cm-3
). The average mean diameter
(dp) of the metal oxide particles (nm) was calculated as
oxide metal
6000
SSAd p (6)

12
2.9. SAXS measurement
The SAXS measurements were performed to compare the effect of metal oxides on
the aggregate compactness and the surface roughness of WDC samples from the fractal nature
of the scattering materials. Cu Kα X-rays were provided by a GeniX3D Cu ULD X-ray beam
delivery system (Xenocs, Sassenage, France), consisting of a microfocus X-ray tube operated
at 30W and a parabolic multilayer mirror, which parallelizes and monochromatizes the beam.
Collimation of the X-ray beam was done by three Pt-Ir pin-holes, 0.3, 0.3 and 0.5 mm
diameter. Samples were measured in vacuum between two layers of foils (Tixo, Cellux). The
scattering of the foils was negligible compared to that of the samples. Scattered X-rays were
detected by a Pilatus-300k CMOS hybrid pixel detector (Dectris, Baden, Switzerland).
Resulting X-ray scattering patterns were corrected for background scattering, geometrical
distortions, and sample self-absorption. They were calibrated into absolute intensity units of
1/sterad using a pre-calibrated glassy carbon sample. All of the data reduction was done by
the control software of the instrument. In order to cover a wider scattering vector q = 4 π
sinθ/λ where λ is the X-ray wavelength, experiments were repeated with short (454 mm) and
long (1216 mm) sample-to-detector distances. The one-dimensional scattered intensity (I)
curves were scaled together and plotted as a function of the scattering vector q between 0.075
nm-1
and 6 nm-1.
The logarithmic form of the power-law scattering relation gives the exponent k, whose
magnitude has been discussed in terms of fractal dimension in the case of porous systems
(Bale and Schmidt, 1984; Borkovec et al., 1993; Schmidt, 1991). The power-law scattering of
SAXS results over a large range of q, has been considered in the following equation:
q
pqI
k)( (7)
Power-law scattering exponents k ≤ 3 are typical of mass fractals that are often aggregates of
sub-units. For objects whose surface is fractal, 3 < k <4 exponents are related to the surface
fractal dimension Ds by
Dk s 6 (8)
which generally characterize powders with porous or irregular surface (Höhr et al., 1988;
Schmidt, 1991).

13
2.10. Dynamic light scattering (DLS) and microelectrophoretic (ME) measurements
The colloidal properties of WDCs were investigated by DLS and ME methods. DLS
measurements were performed using a Malvern Nano-ZS apparatus. The measurements were
made at the scattering angle of 173° for colloidal soil materials at 20 °C. The monomodal
cumulant method of the Nano-ZS apparatus software was used to analyze the correlation
function. The averaged translational diffusion constant obtained was used to calculate an
equivalent spherical hydrodynamic diameter (z-average diameter, dz) for the particles. The
freeze-dried WDC suspension concentration (0.4 g L-1
) was vigorously shaken for 12 h after
ultrasonication for 4 min, and the dispersion was sonicated for another 10 min before the
measurements were made. The samples were transferred to a disposable polystyrene cuvette
during the measurement. For the electrokinetic investigation, a Malvern Nano-ZS apparatus
was used to measure the ζ-potential (Smoluchowski equation) from the microelectrophoretic
mobility (u) at 20°C. The suspension concentration was 0.4 g L-1
. Our schematic diagram of
the soil sample preparation is shown in Fig. 1.
3. Results and discussion
3.1 Soil sample physicochemical characteristics
The mean grain size distribution, pH, TOC, TN and total metal (Fe, Al, Si) contents in
the bulk soil samples are listed in Table 1. XRD analysis revealed that all the three silt loam
topsoils had 20% clay content, with illite being the most abundant clay mineral. The soil
acidity, TOC content, and TN content increased along the series Selhausen < Rollesbroich <
Wuestebach. The contents of Fe and Al were also higher in Wuestebach soil than in the
Selhausen and Rollesbroich soils. The highest mass of the released WDC fraction in
Selhausen soil sample (Table 3) has recently been discussed (Jiang et al., 2014).
3.2. Metal oxide content and surface properties of WDCs and bulk soil samples
3.2.1. Distribution of metal oxides in WDCs and bulk soils
The DCB chemical extraction method was used to characterize the metal oxide
content of WDC and the bulk soil samples (Cornell and Schwertmann, 2003). It is generally
assumed that Fe extracts obtained by the DCB method (FeDCB) include both crystalline and
less-crystalline forms of Fe oxides. AlDCB represents Al substituted in Fe oxides and from the

14
partial dissolution of poorly ordered Al-(oxy)hydroxides (Mikutta et al., 2005). The
comparison of contents extracted by the CB and DCB method confirmed higher distributions
of AlCB and SiCB which are not related to the reductive dissolution of iron oxides. The
subtraction of the corresponding MCB extracted contents (readily soluble forms of metal
complexes) from MDCB (Material and methods, Table 4) thus yielded M extracts closely
associated with the both crystalline and less- crystalline forms of metal oxides. The mass
distributions of Fe, Al, and Si in the MDCB-CB of all WDCs and bulk soils ranged from 88%to
90%, 7% to 11% and 0.5% to 2.9%, respectively. The corresponding molar distributions of Fe,
Al, and Si in MDCB-CB ranged from 79% to 82%, 13% to 20% and 1% to 6%, respectively.
These results confirm the significant contribution of Fe to the total metal oxide content of the
WDCs and bulk soil samples. The extracted FeDCB-CB mass from the bulk soils corresponded
to 44% (Selhausen), 55% (Rollesbroich), and 53% (Wuestebach) of the total Fe content
(Table 1).
The Aloxalate, Feoxalate and Sioxalate contents determined through oxalate extraction are
listed in Table 5. Negligible contents of the corresponding metals under shaking conditions in
water, Mblank, were also reported. In comparison to DCB extraction results, lower Aloxalate,
Feoxalate and Sioxalate contents in the WDCs and bulk soil samples were operationally related to
the less-crystalline forms of metal oxides. The mass distributions of Fe, Al, and Si in the
Moxalate of the WDCs and bulk soil samples ranged from 63% to 76%, 20% to 35% and 1% to
5%, respectively. The corresponding molar distributions of Fe, Al, and Si in Moxalate ranged
from 45% to 59%, 32% to 52% and 1% to 8%, respectively, confirming the significant
contribution of Fe in the less-crystalline form of metal oxides. The distribution of the less-
crystalline form of Fe (Feoxalate /FeDCB) was markedly higher (0.45 to 0.54) in Wuestebach
samples (forest soil) than in other topsoils samples (0.26 to 0.38). Feoxalate /FeDCB distributions
of 0.27 to 0.94 have been reported for a large collection of agricultural topsoil (Hiemstra et al.,
2010a) and of 0.31 to 0.74 in particle size fractions of loamy arable topsoils (Pronk et al.,
2011).
3.2.2. Effect of metal oxides on SSA in WDCs and bulk soils
An interesting aspect is the determination of SSA variations, which accompany the
removal of metal oxide particles from the WDCs and bulk soils (Kiem and Kögel-Knabner,
2002; Kretzschmar et al., 1993; Pronk et al., 2011; Séquaris et al., 2013). The effects of the
extraction method (DCB and oxalate) on the mineral SSAs of the different soil samples are

15
compared in Table 6. The SSA of different samples, before and after treatments was
compared after OC removal by thermal oxidation (SSA400). The results before OC removal
(SSA70) were also shown. As shown in Table 6, SSADCB400 and SSAoxalate400 decreased after
the extraction of metal oxides compared to the blank samples (SSACB400 and SSAblank400).
These results confirm the significant contributions of metal oxides to mineral surface
properties (Borggaard, 1982; Eusterhues et al., 2005; Pronk et al., 2011; Trolard et al., 1995).
The contributions of total metal oxide contents to the total mineral SSA of the WDCs and
bulk soil samples were calculated according to Eq. (1). The percentage of variation of the total
SSA [(SSACB400- SSADCB400) / SSACB400 and (SSAblank400- SSAoxalate400) /SSAblank400] in Table
6 can be positively related to the increase in the contents of MDCB-CB (Tables 4 and 5) along
the series Selhausen < Rollesbroich < Wuestebach. In the Selhausen topsoil, for example,
SSA contributions from the total and less-crystalline metal oxide contents were 41% and 27%
in the bulk soil and 16% and 5% in the WDCs, respectively. In this topsoil, the lower SSA
contributions of the oxalate extracted metal oxide contents were related to the lower oxalate
extracted metal oxide distribution given by Feoxalate /FeDCB of 0.29 in Table 5. The results
show that the contribution of metal oxide to the total SSA in the case of WDCS, a potential
representative of the clay fraction, is lower than in the bulk soils. This result can be explained
by a large distribution of metal oxides outside the free clay fraction in bulk soil samples
(Blum, 2007).
As shown in Tables 6 and 3, the DCB extracted metal oxides increased the SSA of the
WDCs samples along the series Selhausen (27%) < Rollesbroich (35%) < Wuestebach (44%)
while the TOC content increased along the series Selhausen (21 g kg−1
) < Rollesbroich (67 g
kg−1
) < Wuestebach (71 g kg−1
) in WDCs. These data further support the direct surface
interactions. In the clay fraction, OM sequestration as organo-mineral complexes is mainly
due to interactions with less-crystalline and crystalline metal oxide contents in the studied
acidic soils (Mikutta et al., 2005).
3.2.3. Estimation of the SSA and particle size of the metal oxide extracted from the WDC
samples
The SSA of DCB extracted metal oxides (SSAmetal oxide) was estimated by Eq.(3).As
shown in Table 3, SSA values for DCB extracted metal oxides ranged from 217 m2g
-1 to 420
m2g
-1, which are typical of iron oxide nanoparticles, such as ferrihydrite (Cornell and
Schwertmann, 2003). The SSADCB400 values ranged from 32 m2g
-1 to 64 m
2g
-1 (Table 6), which

16
is typical of illite (Kaiser and Guggenberger, 2003), the major aluminosilicate in the clay
fraction of topsoils (Table 1). It must be remarked that freeze-dried WDC samples were
characterized by the typical platelet–like structure of clay minerals (Séquaris et al., 2013). The
metal oxide nanoparticles was assumed to cover on aluminosilicate surfaces in WDC and the
possible coverage of was estimated by Eq. (4) with the surface loading ratio (θ). An increase
in θ along the series Selhausen (11%) < Rollesbroich (16%) < Wuestebach (22%) was
calculated for the maximal surface loading in the monolayer (Table 3). At lower pH, the
WDCs from the acidic forest soil apparently had the largest surface loading of metal oxides.
This is promoted by the precipitation of metal oxides carrying sufficient positive charge at the
negatively charged clay surface (Goldberg, 1989). Based on the SSAmetal oxide values, we
calculated the diameter of the nanoparticles (dp) with Eqs. (5) and (6), in which ρ for total
metal oxides from three soils of approximately 3.6 g cm−3
(values: 3.56-3.57 gcm−3
) was
calculated from a mass distribution of FeDCB-CB, AlDCB-CB and SiDCB-CB and the density of
typical Fe oxide (ferrihydrite, 3.8 g cm−3
), typical Al oxide gibbsite (2.44 g cm−3
) and typical
Si oxide, Silica(2.32 g cm−3
), respectively, in the metal oxide particle mixture. dp values in
the range of 4 nm to 8 nm were estimated for the metal oxide nanoparticles (Table 3). Similar
particle sizes (1 nm to 10 nm) of metal oxides were reported after DCB extraction of
agricultural topsoils (Hiemstra et al., 2010a) and haplic podzol soils (Eusterhues et al., 2005).
3.3. Substructural study on the effect of metal oxides in WDCs
The major sequestration of OM in the heterogeneous microstructure of the soil clay-
size fraction (Chenu and Plante, 2006) is controlled by the accessibility of the mineral porous
matrix formed by metal oxides and aluminosilicate particles. SAXS and N2 gas-adsorption
methods were used to characterize the WDCs structures before and after metal oxide removal
by the DCB method and to establish relationships between the two methods and to obtain
complementary information on the porous structure of the WDC samples. The diameter and
zeta potential of colloidal WDCs before and after DCB treatment were further investigated by
dynamic light scattering (DLS) and microelectrophoretic (ME) methods, respectively. The
results of the colloidal characterization in the micrometer range were related and used in the
interpretation of the N2 gas-adsorption and SAXS results.
3.3.1. Application of N2 gas- adsorption methods for the pore size investigation of WDCs
(effect of metal oxide particles and OC contents)

17
For WDCDCB400 and WDCCB400, the SSA and total pore volume (Vp) of all pore radii up
to 180 nm were obtained with the N2 adsorption isotherms at a P/P0 of 0.995 (Table 7). The
volumes of the micropores (Vµpore) with pore radii of less than 2 nm were also reported for
comparison.. In this study, they correspond to a low fraction (5% ± 2%) of Vp. Sensitive
variations of SSA, Vp and Vµpore results are observed after metal oxide extraction by DCB
treatment. The volume-to-surface area ratios were used to calculate the average pore radius
(Rp) for the general case of cylindrical pores (Rp = 2 Vp /SSA) in Table 7. The interpretation of
pore size in a slit configuration for calculating the radius (Rp = Vp / SSA) has been discussed
with respect to continental shelf sediment (Mayer, 1994a). In Table 7, Rp values were
determined in the mesopore range (2 nm to 50 nm) for WDCCB400 and WDCDCB 400 samples
were determined. The Rp of WDCCB400 decreased, indicating that the pore sizes were lower
before than after metal oxide extraction. The coverage of metal oxide nanoparticles in
accessible open mesopores, mainly formed by the arrangement of larger aluminosilicate
particles such as the clay minerals illite or kaolinite in WDC (Table 1), can thus be concluded.
In Fig. 2, the cumulative pore volume and differential pore size distribution (PSD)
curves with N2 gas are reported in the case of Rollesbroich WDCCB70, WDCCB400, and
WDCDCB 400 samples which precisely determine the effects of metal oxide nanoparticles on
the porosity in the low pore diameter range. A higher pore volume distribution in a pore
diameter range < 25 nm was calculated for the WDCCB400 sample (25%) due to the presence
of metal oxide nanoparticles in comparison with the WDCDCB400 sample (16%) in this soil.
For the Selhausen and Wuestebach WDC samples, higher pore volume distributions in a pore
diameter range < 25 nm of 35% and 25% were measured for WDCCB400 samples in
comparison with 29% and 17%, respectively, for WDCDCB400 samples after metal oxide
extraction which confirm that metal oxides will constrain the soil porous structure with lower
pore size.
The detection of open pores by N2 gas- adsorption was demonstrated when the
presence of OC in pristine WDCs was considered. Significant differences in Rp were found
between WDCCB70 and WDCCB400 which can be attributed to the presence of OC. The
accessibility of N2 gas to open pores is hindered by the blocking effect of OC (Mayer et al.,
2004, McCarthy et al. 2008; Séquaris et al., 2010). This phenomenon can result in a shift in
the distribution of open pores detected with N2 gas to the greatest value in WDCCB70, as
shown by RpCB70/RpCB400 >1. In Fig. 2, for Rollesbroich soil, in pristine WDCCB70 sample, the

18
pore volume distribution in the pore diameter range > 25 nm is higher (80%) than in the
WDCCB400 sample (75%). In the case of Selhausen and Wuestebach WDC samples, pore
volume distributions in the pore diameter range > 25 nm of 70% and 76% are also found for
WDCCB70 samples in comparison with 65% and 75%, respectively, for WDCCB400 samples
after OC removal. These results support the preferential OC blocking effect in the low pore
diameter range.
3.3.2. Effect of metal oxides on fractal dimensions of WDC measured with SAXS
The power-law behavior of the scattering SAXS resulted in a large range of q:
0.08nm−1
to 2 nm-1
(d =2*π/q of 3.1nm to78 nm) is observed in Fig. 3. The effect of metal
oxides on the nature of the fractal structure of WDC was investigated with Eq. (7). The
logarithmic form of the power-law scattering relation gives the exponent k (Fig. 3) by a least-
squares fitting procedure.
In Table 8, k values ≤ 4 are calculated which indicates that conditions for a randomly
oriented extended scatterer with uniform electron density and a smooth boundary surface (k =
4 for inhomogeneities with smooth separating surfaces) were not fulfilled with the WDC
samples. k values between 3 and 4 characterize a rough interface of surface fractal dimensions
Ds between 2 and 3 with Eq. (8). Ds values in the case of WDCDCB400 decrease significantly
during DCB treatment, indicating that the surface roughness of the samples also decreases.
Higher Ds values with WDCCB400 thus support the presence of nanoparticles causing the
roughness of the pristine mineral surfaces or porosity with a low pore diameter range.
3.3.3. Contribution of metal oxide nanoparticles to the colloidal properties of mineral WDCs
The colloidal properties of WDCCB400 and WDCDCB400 were investigated after the
dispersion of freeze-dried mineral WDC in water (0.4 g L−1
) by DLS and ME methods. The
respective hydrodynamic diameter (dz) and zeta potential (ζ) values at pH of about 7 ± 0.2 are
reported in Table 8. In WDCDCB400 samples, the ζ values became more negative after the
release of positively charged metal oxide particles. Metal oxide particles containing Fe and Al
generally have points of zero charge of about pH 7 to 9 (Essington, 2004; Tombácz and
Szekeres, 2001). The permanent negative charge of the remaining aluminosilicate, as in the
case of illite clay minerals (Jiang et al., 2012), determines the ME properties of
WDCDCB400.The dz values of WDCDCB400 samples increased compared with that of WDCCB400,

19
supporting the expansion of aggregate size due to electrostatic repulsion between negatively
charged aluminosilicate residues. A possible aggregation of dispersed clay minerals through
edge/plate (cardhouse structure) contacts (Lagaly et al., 2006; Jiang et al., 2012) under low
ionic strength conditions may also increase dz and the porosity. These colloidal results
obtained on a micrometer scale can thus be directly related to k (SAXS), and Rp (N2 gas-
adsorption) results on a nanometer scale, also demonstrating a corresponding increase of the
porous mineral matrix structure for the WDCs after the removal of metal oxide nanoparticles.
Systematically higher dz, Rp and k values (Tables 7 and 8) are generally observed in
the Rollesbroich WDC sample, which can be related to the mineralogical composition of the
soil fraction < 2 µm in size. Indeed, higher kaolinite content than for the other two soil clay
fractions (Table 1) was found in this soil. The contribution of the typically lower SSA of
kaolinite than montmorillonite and illite (Manning and Goldberg, 1996) was also detected in
the lowest SSA of the Rollesbroich WDC sample compared with the other soil samples (Table
6). In the Rollesbroich WDC sample, the introduction of the kaolinite particle structure of
lower aspect ratios (Wilkinson and Lead, 2007) possibly creates large pores in the compact
arrangement of dominant illite thin platelets of higher aspect ratios (ratio of platelet diameter
to thickness) in the WDC microstructure. The calculated dp (8 nm) of the metal oxide particles
from the Rollesbroich WDCs sample (Table 3) was larger than that of the particles from
Selhausen (5 nm) and Wuestebach (4 nm). This result supports a low steric hindrance for their
formation and deposition in larger accessible WDC mesopores (Rp of 18 nm, Table 7).
4. Conclusion
The crystalline and less-crystalline iron oxides are the major metal oxide forms in the
WDCs and bulk soils of the three topsoils investigated, and the highest distribution of less-
crystalline iron oxide was observed in the acidic forest soil of Wuestebach. The decrease in
SSA after the removal of metal oxides in the bulk soils and WDC samples is related to the
released MDCB-CB and Moxalate-blank contents. Metal oxide nanoparticles (DCB extracted) of 4
nm to 8 nm in size (dp) covered the surface of aluminosilicate residues in three soils and up to
22% of the WDCs from forest soil (Wuestebach). The results from the pore size (Rp)
investigation of WDCs in freeze-dried state, using N2 gas- adsorption, show that the presence
of metal oxides in WDCCB400 implies the contraction of the pore structure in the low pore
diameter range < 25 nm. Pore size distribution analysis also reveals a preferential blocking
effect of the OC content in the same range of small open pore sizes. The characterization of
20
the fractal structure (from k exponent in Eq. (7)) of WDCs in freeze-dried state, using SAXS,
indicates an increase of the surface fractal dimension (Ds) in the presence of metal oxides in
WDCCB400. This result clearly supports an increase of the interface roughness in WDC due to
the contributions of metal oxide nanoparticles.
The colloidal characterization of WDCs in a water-dispersed state from the three
topsoils by DLS and ME methods also indicates that the measured colloidal particle size (dz)
and surface negative ζ-potential increased after the removal of metal oxides (DCB treatment).
Results also indicate that the presence of positively charged metal oxides make the mineral
matrix of WDCCB400 more compact, in the micrometer range, due to electrostatic interactions.
Furthermore, the comparison of Rp, k, dz and dp results between soils also indicates some
dependence of structure on the clay mineralogy of WDCs where effects of kaolinite and illite
aspect ratios contribute to the mesopore size in the clay microfabric.
.The combination of the N2 gas-adsorption, SAXS, DLS, and ME methods allows thus
the porosity of air-dried and water-dispersed WDC to be characterized in the nanometer range
where the large contribution of metal oxides can be detected and compared in different soils.
The expansion of the SAXS method to include low scattering angles, the adsorption results of
other gases as CO2, and the use of improved models show great promise in enabling different
pore structures and their distributions in soil aggregates to be described.
Acknowledgements
The presented work is part of the TERENO SoilCan project (Puetz et al., 2009). We
would like to thank C. Walraf for her skilful laboratory assistance. The SAXS part of this
work was supported by the Hungarian Scientific Research Fund (OTKA, Hungary) and the
National Innovation Office (NIH, Hungary) under grant agreement CNK-81056, by the
Hungarian Development Agency (NFÜ, Hungary) under grant agreement PT-0061 KMOP-
1.1.2-07/1-2008-002, and by Gedeon Richter Plc, Hungary. We also wish to thank the
University of Bonn (Dr. G. Welp, Institute of Soil Sciences, Agricultural Faculty) for the
distribution analysis of particle sizes and the mineral XRD analysis. The elemental chemical
analyses performed at the Central Division of Analytical Chemistry (ZCH) of
Forschungszentrum Jülich Germany are gratefully acknowledged. Canlan Jiang thanks the
Chinese Scholarship Council for the financial support of her PhD in Germany.

21
Reference Baldock, J.A., Skjemstad, J.O., 2000. Role of the soil matrix and minerals in protecting natural organic
materials against biological attack. Org. Geochem. 31, 697-710. Bale, H.D., Schmidt, P.W., 1984. Small-Angle X-Ray-Scattering Investigation of Submicroscopic
Porosity with Fractal Properties. Phys. Rev. Lett. 53(6), 596-599. Barberis, E., Marsan, F.A., Boero, V., Arduino, E., 1991. Aggregation of soil particles by iron oxides in
various size fractions of soil B horizons. J. Soil Sci.J. Soil Sci. 42(4), 535-542. Blum, W.E.H., 2007. Bodenkunde in Stichworten. Gebr. Borntraeger Verlagsbuchhandlung, Berlin,
Stuttgart, pp. 24-25. Borggaard, O.K., 1982. The influence of iron oxides on the surface area of soil. J. Soil Sci. 33, 443-449. Borkovec, M., Wu, Q., Degovics, G., Laggner, P., Sticher, H., 1993. Surface area and size distributions
of soil particles. Colloids Surf., A 73, 65-76. Campbell, A.S., Schwertmann, U., Stanjek, H., Friedl, J., Kyek, A., Campbell, P.A., 2002. Si
incorporation into Hematite by heating Si-Ferrihydrite. Langmuir 18, 7804-7809 Chenu, C., Plante, A.F., 2006. Clay-size organo-mineral complexes in a cultivation chronosequence:
revisiting the concept of the primary organo-mineral complex. Eur. J. Soil Sci. 57, 596-607. Chevallier, T., Woignier, T., Toucet, J., Blanchart, E., 2010. Organic carbon stabilization in the fractal
pore structure of Andosols. Geoderma 159(1–2), 182-188. Childs, C.W., 1992. Ferrihydrite: A review of structure, properties and occurrence in relation to soils.
Z.Pflanzenernaehr.Dueng.Bodenkd 155(5), 441-448. Clausen, L., Fabricius, I., 2000. BET measurements: outgassing of minerals.J. Colloid Interface
Sci. 227(1), 7-15. Cornell, R.M., Schwertmann, U., 1996. The iron oxides-structure, properties, reactions, occurrence
and uses. VCH, New York. Cornell, R.M., Schwertmann, U., 2003. The Iron Oxides: Structure, Properties. Reactions, Occurrence
and Uses, 2nd Edition. Wiley-VCH Verlag GmbH & Co. KGaA, Weinheim. Deshpande, T.L., Greenland, D.J., Quirk, J.P., 1968. Charges in soil properties associated with the
removal of iron and aluminium oxides J. Soil Sci. 19, 108-122. Dékány, I., Turi, L., Fonseca, A., Nagy, J.B., 1999. The structure of acid treated sepiolites: small-angle
X-ray scattering and multi MAS-NMR investigations. Appl.Clay Sci. 14(1–3), 141-160. Driessen, P., Deckers, J., Spaargaren, O., Nachtergaele, F., 2001. Lecture notes on the major soils of
the world. World Soil Resources Reports. Essington, M. E. (2004). Soil and water chemistry: An integrative approach. CRC press. Boca Raton,
Florida, pp. 328. Eusterhues, K., Rumpel, C., Kögel-Knabner, I., 2005. Organo-mineral associations in sandy acid forest
soils: importance of specific surface area, iron oxides and micropores. Eur. J. Soil Sci. 56(6), 753-763.
Filimonova, S.V., Knicker, H., Kögel-Knabner, I., 2006. Soil micro- and mesopores studied by N2 adsorption and 129Xe NMR of adsorbed xenon. Geoderma 130(3-4), 218-228.
Gaboriaud, F., Ehrhardt, J.-J., 2003. Effects of different crystal faces on the surface charge of colloidal goethite (α-FeOOH) particles: an experimental and modeling study. Geochim. Cosmochim. Acta 67(5), 967-983.
Gilkes, R., Scholz, G., Dimmock, G., 2006. Lateritic deep weathering of granite. J. Soil Sci. 24(4), 523-536.
Goldberg, S., 1989. Interaction of aluminum and iron oxides and clay minerals and their effect on soil physical properties: A review. Commun. Soil Sci. Plant Anal. 20(11-12), 1181-1207.
Groen, J.C., Peffer, L.A.A., Pérez-Ramírez, J., 2003. Pore size determination in modified micro-andmesoporous materials. Pitfalls and limitations in gas adsorption data analysis. Microporous Mesoporous Mater. 60(1), 1-17.
Guinier, A., Fournet, G., 1955. Small Angle Scattering of X-rays. J. Wiley & Sons, New York.

22
Hendershot, W.H., Lavkulich, L.M., 1983. Effect of sesquioxide coatings on surface charge of standard mineral and soil samples. Soil Sci. Soc. Am. J. 47, 1252-1260.
Herbst, M., Welp, G., Vereecken, H., & Amelung, W. (2011). Rock fragments control size and saturation of organic carbon pools in agricultural topsoil. Soil Sci. Soc. Am. J. 75(5), 1898-1907.
Hiemstra, T., Antelo, J., Rahnemaie, R., Riemsdijk, W.H.v., 2010a. Nanoparticles in natural systems I: The effective reactive surface area of the natural oxide fraction in field samples. Geochim. Cosmochim. Acta 74(1), 41-58.
Höhr, A., Neumann, H.-B., Schmidt, P.W., Pfeifer, P., Avnir, D., 1988. Fractal surface and cluster structure of controlled-pore glasses and Vycor porous glass as revealed by small-angle x-ray and neutron scattering. Physical Review B 38(2), 1462-1467.
IUPAC, 1985, Reporting physisorption data for gas/solid systems with special reference for the determination of surface area and porosity. Pure Appl. Chem. 57(4), 603-619.
Jarvis, N.J., Villholth, K.G., Ulén, B., 1999. Modelling particle mobilization and leaching in macroporous soil. Eur. J. Soil Sci. 50, 621-632.
Jiang, C., Séquaris, J.-M., Vereecken, H., Klumpp, E., 2012. Effects of inorganic and organic anions on the stability of illite and quartz soil colloids in Na-, Ca- and mixed Na-Ca systems. Colloids Surf., A 415, 134-141.
Jiang, C., Séquaris, J. -M., Vereecken, H., Klumpp, E., 2013. Diffusion-controlled mobilization of water-dispersible colloids from three German silt loam topsoils: effect of temperature, Eur. J. Soil Sci. 64(6), 777-786.
Kaiser, K., Guggenberger, G., 2000. The role of DOM sorption to mineral surfaces in the preservation of organic matter in soils. Org. Geochem. 31(7-8), 711-725.
Kaiser, K., Guggenberger, G., 2003. Mineral surfaces and soil organic matter. Eur. J. Soil Sci. 54(2), 219-236.
Kiem, R., Knicker, H., Kögel-Knabner, I., 2002. Refractory organic carbon in particle-size fractions of arable soils I: distribution of refractory carbon between the size fractions. Org. Geochem. 33(12), 1683-1697.
Kiem, R., Kögel-Knabner, I., 2002. Refractory organic carbon in particle-size fractions of arable soils II: organic carbon in relation to mineral surface area and iron oxides in fractions < 6 μm. Org. Geochem. 33(12), 1699-1713.
Kjaergaard, C., de Jonge, L.W. Moldrup, P., Schjonning, P., 2004a. Water-dispersible colloids: effects of measurement method, clay content, initial soil matric potential, and wetting rate. Vadose Zone J. 3, 403-412.
Kjaergaard, C., Hansen, H.C.B., Koch C.B., Villholth, K.G., 2004b. Properties of water-dispersible colloids from macropore deposits and bulk horizons of an agrudalf. Soil Sci. Soc. Am. J. 68, 1844-1852.
Kleber, M., Mikutta, R., Torn, M.S., Jahn, R., 2005. Poorly crystalline mineral phases protect organic matter in acid subsoil horizons. Eur. J. Soil Sci. 56(6), 717-725.
Kretzschmar, R., Robarge, W.P., Weed, S.B., 1993. Flocculation of kaolinitic soil clays: effects of humic substances and iron oxides. Soil Sci. Soc. Am. J. 57(5), 1277-1283.
R. Kretzschmar, M. Borkovec, D. Grolimund, M. Elimelech, 1999 Mobile subsurface colloids and their role in contaminant transport, in Advances in Agronomy, Vol 66. Academic Press, San Diego. pp. 121-193.
Lagaly, G. Colloid clay science, in: F. Bergaya, B.K.G. Theng, G. Lagaly (Eds.), Handbook of Clay Science, Elsevier, Amsterdam, 2006, pp. 141-245.
Lowell, S., Shields, J., Thomas, M., Thommes, M., 2006. Characterization of Porous Solids and Powders: Surface Area, Pore Size and Density. Particle Technology Series. Springer Netherlands.
Manning, B.A., Goldberg, S., 1996. Modeling arsenate competitive adsorption on kaolinite, montmorillonite and illite. Clays Clay Miner. 44(5), 609-623.

23
Marliere, C., Woignier, T., Dieudonné, P., Primera, J., Lamy, M., Phalippou, J., 2001. Two fractal structures in aerogel. Journal of non-crystalline solids, 285(1), 175-180.
Masiello, C.A., Chadwick, O.A., Southon, J., Torn, M.S., Harden, J.W., 2004. Weathering controls on mechanisms of carbon storage in grassland soils. Global Biogeochem. Cycles 18(4), GB4023.
Mayer, L.M., 1994a. Surface area control of organic carbon accumulation in continental shelf sediments. Geochim. Cosmochim. Acta. 58, 1271-1284.
Mayer, L.M., 1994b. Relationships between mineral surfaces and organic carbon concentrations in soils and sediments. Chemical Geology. 114(3-4), 347-363.
Mayer, L.M., Schick, L.L., Hardy, K.R., Wagai, R., McCarthy, J., 2004. Organic matter in small mesopores in sediments and soils. Geochim. Cosmochim. Acta 68(19), 3863-3872.
J.F. McCarthy, J.M. Zachara, 1989, Subsurface transport of contaminants. Environ. Sci. Technol., 23(5), 496-502.
McCarthy, J.F., Ilavsky, J., Jastrow, J.D., Mayer, L.M., Perfect, E., Zhuang, J., 2008. Protection of organic carbon in soil microaggregates via restructuring of aggregate porosity and filling of pore with accumulating organic matter. Geochim. Cosmochim. Acta 72, 4725-4744.
Mehra, O.P., Jackson, M.L., 1960. Iron oxide removal from soils and clays by dithionite-citrate system bufferd with sodium bicarbonate, Clays Clay Miner. Proceedings of the 7th National Conference, pp. 317-327.
Mikutta, R., Kleber, M., Jahn, R., 2005. Poorly crystalline minerals protect organic carbon in clay subfractions from acid subsoil horizons. Geoderma 128(1-2), 106-115.
Mikutta, R., Kleber, M., Torn, M.S., Jahn, R., 2006. Stabilization of soil organic matter: association with minerals or chemical recalcitrance? Biogeochemistry 77(1), 25-56.
Mikutta R, Mikutta C, Kalbitz K, Scheel T, Kaiser K, Jahn R 2007 Biodegradation of forest floor organic matter bound to minerals via different binding mechanisms. Geochim. Cosmochim. Acta 71, 2569-2590.
Mittelbach, P., 1964. Zur Röntgenkleinwinkelstreuung verdünnter kolloider systeme:VIII Diskussion des Streuverhaltens regelmäÿiger Körper und Methoden zur Bestimmung von Gröÿe und Form kolloider Teilchen. Acta Phys. Anstriaca 19, 53-102.
Pernyeszi, T., Dékány, I., 2003. Surface fractal and structural properties of layered clay minerals monitored by small-angle X-ray scattering and low-temperature nitrogen adsorption experiments. Colloid. Polym. Sci. 281(1), 73-78.
Pinheiro-Dick, D., Schwertmann, U., 1996. Microaggregates from Oxisols and Inceptisols: dispersion through selective dissolutions and physicochemical treatments. Geoderma 74(1-2), 49-63.
Pronk, G.J., Heister, K., Kögel-Knabner, I., 2011. Iron Oxides as Major Available Interface Component in Loamy Arable Topsoils. Soil Sci. Soc. Am. J. 75(6), 2158-2168.
Puetz, T., Burauel, P., Bogena, H., Vereecken, H., 2009. TERENO-SoilCan-Soil-Atmosphere Interactions Induced by Land Use Changes as a Result of Global Change, EGU General Assembly Conference Abstracts, pp. 11611.
Radlinski, A.P., Mastalerz, M., Hinde, A.L., Hainbuchner, M., Rauch, H., Baron, M., Lin, J.S., Fan, L., Thiyagarajan, P., 2004. Application of SAXS and SANS in evaluation of porosity, pore size distribution and surface area of coal. Int. J. Coal Geol. 59(3-4), 245-271.
Roden, E.E., Zachara, J.M., 1996. Microbial reduction of crystalline iron (III) oxides: Influence of oxide surface area and potential for cell growth. Environ. Sci. Technol. 30(5), 1618-1628.
Rosenqvist, J., Axe, K., Sjöberg, S., Persson, P., 2003. Adsorption of dicarboxylates on nano-sized gibbsite particles: effects of ligand structure on bonding mechanisms. Colloids Surf., A 220(1–3), 91-104.
Ryan, J.N., Gschwend, P.M., 1994. Effects of ionic strength and flow rate on colloid release: relating kinetics to intersurface potential energy. J. Colloid Interface Sci. 164, 21-34.
Ryan, J.N., Elimelech, M., 1996. Colloid mobilization and transport in groundwater. Colloids Surf., A, 107, 1-56.
Saunders, J.M., Goodwin, J.W., Richardson, R.M., Vincent, B., 1999. A Small-Angle X-ray Scattering Study of the Structure of Aqueous Laponite Dispersions. J.Phys.Chem.B 103(43), 9211-9218.

24
Schahabi, S., Schwertmann, U., 1970. Der Einfluß von synthetischen Eisenoxiden auf die Aggregation zweier Lößbodenhorizonte. Z.Pflanzenernaehr.Dueng.Bodenkd 125(3), 193-204.
Schmidt, P., 1991. Small-angle scattering studies of disordered, porous and fractal systems. J. Appl. Crystallogr. 24(5), 414-435.
Schmidt, P.W., Avnir, D., Levy, D., Höhr, A., Steiner, M., Röll, A., 1991. Small-angle x-ray scattering from the surfaces of reversed-phase silicas: Power-law scattering exponents of magnitudes greater than four. J. Chem. Phys. 94, 1474.
Schwertmann, v.U., 1964. The differentiation of iron oxide in soils by a photochemical extraction with acid ammonium oxalate. Z. Pflanzenernaehr. Dueng. Bodenkd 105, 194-201.
Séquaris, J.-M., Guisado, G., Magarinos, M., Moreno, C., Burauel, P., Narres, H.-D., Vereecken, H., 2010. Organic-carbon fractions in an agricultural topsoil assessed by the determination of the soil mineral surface area. J. Plant Nutr. Soil Sci. 173(5), 699-705.
Séquaris, J.-M., Klumpp, E., Vereecken, H., 2013. Colloidal properties and potential release of water-dispersible colloids in an agricultural soil depth profile. Geoderma 193, 94-101.
Séquaris, J.M., Lewandowski, H., 2003. Physicochemical characterization of potential colloids from agricultural topsoils. Colloids Surf., A 217(1-3), 93-99.
Six, J., Conant, R.T., Paul, E.A., Paustian, K., 2002. Stabilization mechanisms of soil organic matter: Implications for C-saturation of soils. Plant Soil 241, 155-176.
Sollins, P., Homann, B., Caldwell, A., 1996. Stabilization and destabilization of soil organic matter: mechanisms and controls. Geoderma 74, 65-105.
Sollins, P., Swanston, C., Kramer, M., 2007. Stabilization and destabilization of soil organic matter—a new focus. Biogeochemistry 85(1), 1-7.
Tombácz, E., Szekeres, M., 2001. Interfacial Acid−Base Reactions of Aluminum Oxide Dispersed in Aqueous Electrolyte Solutions. 1. Potentiometric Study on the Effect of Impurity and Dissolution of Solid Phase. Langmuir 17(5), 1411-1419.
Trolard, F., Bourrie, G., Jeanroy, E., Herbillon, A.J., Martin, H., 1995. Trace metals in natural iron oxides from laterites: A study using selective kinetic extraction. Geochim. Cosmochim. Acta 59(7), 1285-1297.
Turchenek, L. W., Oades, J. M., 1979. Fractionation of organo-mineral complexes by sedimentation and density techniques. Geoderma 21(4), 311-343.
Wagai, R., Mayer, L.M., 2007. Sorptive stabilization of organic matter in soils by hydrous iron oxides. Geochim. Cosmochim. Acta 71(1), 25-35.
Wagai, R., Mayer, L. M., & Kitayama, K., 2009. Extent and nature of organic coverage of soil mineral surfaces assessed by a gas sorption approach.Geoderma 149(1), 152-160.
Wilkinson, K.J., Lead, J.R., 2007. Environmental colloids and particles: behaviour, separation and characterisation, 10. Wiley, USA.
Zacharias, S., Bogena, H., Samaniego, L., Mauder, M., Fuß, R., Pütz, T., Frenzel, M., Schwank, M., Baessler, C., Butterbach-Bahl, K., 2011. A network of terrestrial environmental observatories in Germany. Vadose Zone J. 10(3), 955-973.
Van Oost, K., Govers, G., Quine, T.A., Heckrath, G., Olesen, J.E., De Gryze, S., et al. 2005. Landscape-scale modeling of carbon cycling under the impact of soil redistribution: the role of tillage erosion. Glob. Biogeochem. Cycles 19c, GB4014.

Fig. 1. A schematic diagram of the soil samples preparation
Fig. 1.
Soil samples (<2mm,bulk soil) Soil WDC extraction
70°C,16h: removal of water (X70)
400°C, 12h: removal of OC (X400)
Dithionite-citrate-bicarbonate (DCB) for
removing crystalline and less-crystalline total
metal oxide
CB blank (XCB
) and
DCB (XDCB
) samples
X designates soil samples (WDC, bulk soils) and physicochemical results (SSA, M, Rp)
WDC (0.05 - 2 µm)
Oxalate solution for removing less-crystalline
metal oxide
Oxalate blank (Xblank
) and
oxalate (Xoxalate
) samples
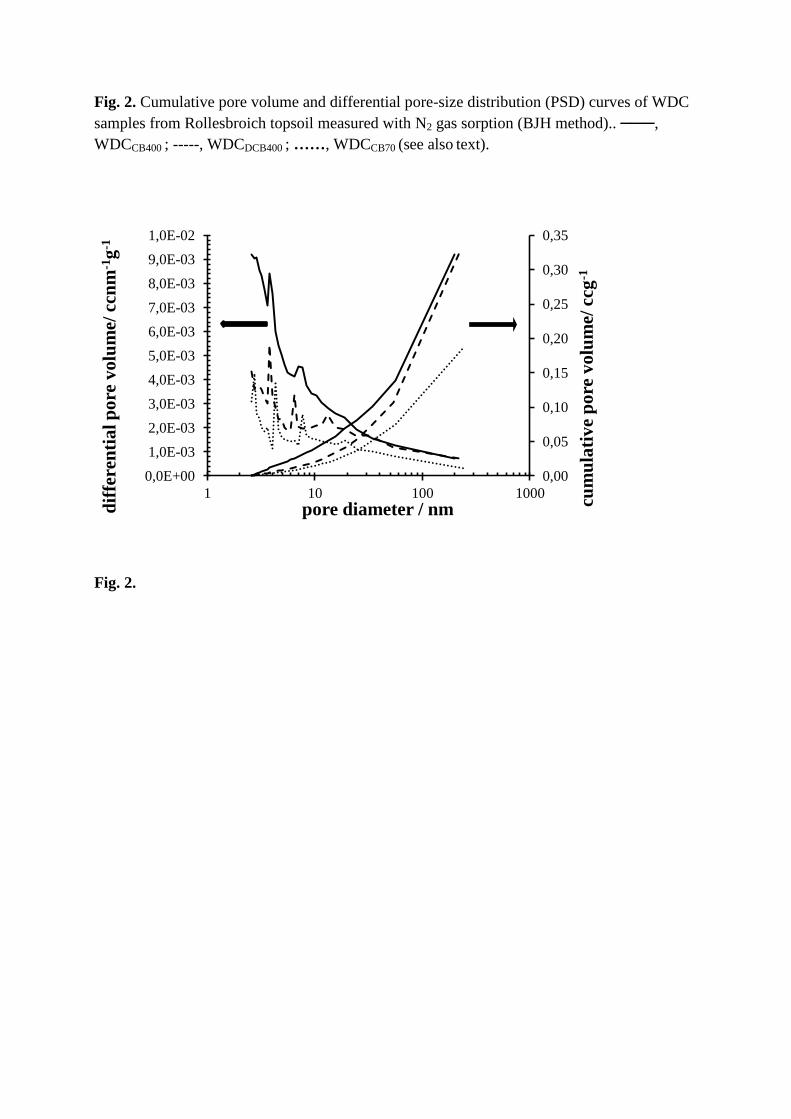
Fig. 2. Cumulative pore volume and differential pore-size distribution (PSD) curves of WDC
samples from Rollesbroich topsoil measured with N2 gas sorption (BJH method).. ───,
WDCCB400 ; -----, WDCDCB400 ; ……, WDCCB70 (see also text).
Fig. 2.
0,00
0,05
0,10
0,15
0,20
0,25
0,30
0,35
0,0E+00
1,0E-03
2,0E-03
3,0E-03
4,0E-03
5,0E-03
6,0E-03
7,0E-03
8,0E-03
9,0E-03
1,0E-02
1 10 100 1000
cum
ula
tiv
e p
ore
vo
lum
e/ c
cg-1
dif
fere
nti
al p
ore
vo
lum
e/ c
cnm
-1g
-1
pore diameter / nm

Fig. 3. SAXS scattering curves (log I(q) vs log q) of WDCs from Wuestebach topsoil after
CB and DCB treatments being followed by the thermal oxidation of organic matter. ······,
WDCDCB400; , WDCCB400. Linear least-squares fitting of Eq. (8) in the range of q < 2 nm-1
was applied.
Fig. 3.
1,0E-01
1,0E+00
1,0E+01
1,0E+02
1,0E+03
1,0E+04
1,0E+05
1,0E+06
0,01 0,1 1 10
Inte
nsi
ty (
arb
. u
nit
s)
q (nm-1)
WDC CB400
WDC DCB400

Table 1 Soils physicochemical characteristics.
Soil pH a TOC
b TN Fe Al Si Clay Silt Sand Minerals in clay
fractionc g kg
-1 g kg
-1 g kg
-1 g kg
-1 g kg
-1 % % %
Selh 7.07 10.0 ± 0.2 1.07 ± 0.05 25.7 44.4 355 19 65.6 15.7 IA, C/V
B, K
C
Roll 5.82 40.4 ± 1.7 4.62 ± 0.09 26.2 58.0 324 20 59.2 20.8 IA, K
B, C/V
C
Wuest 4.25 83.1 ± 2.5 6.10 ± 0.40 35.9 65.5 266 21 60.2 18.5 IA, C/V
B, K
C
a soil / water = 1 / 2.5;
b values are average of three different experiments ± standard
deviation; c XRD mineral analysis: I, illite; C/V, chlorite and/ or vermiculite; K, kaolinite;
A =
abundant; B = present;
C = little

Table 2 Comparison of specific surface area (SSA) of Selhausen bulk soils after temperature
pre-treatment.
Soil samples Clay / % TOC / g kg-1
FeDCB / g kg-1
SSA70 / m2 g
-1 SSA400 / m
2 g
-1 SSA70 / SSA400
C1 (0-30 cm) 18.3 11.3 ± 0.6 7.7 ± 0.4 12.8 15.2 0.84
C1(30-60 cm) 21.7 3.6 ± 0.2 9.2 ± 0.2 23.2 22.3 1.04
C1(60-90 cm) 21.7 2.3 ± 0.2 10.3 ± 0.3 22.8 21.7 1.05
C2 (0-30 cm) 12.3 12.6 ± 0.3 6.9 ± 0.3 7.8 8.1 0.96
C2(30-60 cm) 15.7 5.6 ± 0.1 6.8 ± 0.3 9.7 11.9 0.82
C2(60-90 cm) 17 4.2 ± 0.4 7.5 ± 0.5 10.8 9.7 1.11

Table 3:Physicochemical characteristics for WDC and metal oxide content
WDC
metal oxide content
pH
mass in
bulk soil a
TOC a Fe Al Si w
b SSA metal oxide Θ
c dp
d
g kg-1
g kg-1
g kg-1
g kg-1
g kg-1
g kg-1
m2 g
-1 % nm
Selh 7.4 81±2 21.7±0.1 75 115 207 84±9 342 11.1 5
Roll 6.6 41±2 67.74±1.1 55.6 124 163 93±5 217 15.6 8
Wuest 4.5 41±1 71.25±0.1 75. 9 124 173 76±16 420 21.6 4 a values are average of three different experiments ± standard deviation .
bmass of released
metal oxide from WDC. csurface loading ratio of metal oxide Eq. (4).
ddiameter of metal
oxide particle Eq. (6)

Table 4 CB and DCB extracted metals contents in WDC and bulk soil samples.
Soil Fraction MCB mg g
-1 a
MDCB mg g
-1 a
MDCB-CB mg g
-1 a
Al Fe Si Al Fe Si Al Fe Si
Selh Bulk soil 0.18±0.04 0.31±0.01 0.23±0.12 1.07±0.04 11.75±0.48 0.56±0.01 0.89±0.05 11.44±0.48 0.33±0.12
WDC 0.57±0.02 0.91±0.06 0.39±0.04 3.93±0.05 39.47±0.71 1.64±0.03 3.36±0.06 38.56±0.72 1.26±0.05
Roll Bulk soil 1.63±0.01 2.35±0.03 0.20±0.01 3.31±0.10 16.68±0.64 0.33±0.04 1.68±0.10 14.33±0.64 0.13±0.04
WDC 6.68±0.18 14.7±0.29 0.52±0.01 11.73±3.38 56.54±15.10 0.75±0.15 5.04±3.38 41.80±15.1 0.23±0.15
Wuest Bulk soil 3.85±0.01 7.49±0.16 0.91±0.01 5.71±0.22 26.26±1.66 0.79±0.02 1.87±0.21 18.77±1.67 0.1±0.02
WDC 4.45±0.12 5.24±0.12 0.36±0.07 9.37±1.87 45.12±8.55 0.67±0.14 4.91±1.87 39.89±8.55 0.31±0.16 a values are average of three different experiments ± standard deviation.

Table 5 Oxalate extracted metal contents in WDC and bulk soil samples and their distribution in total
metal oxides.
Soil Fraction Mblank mg g
-1 Moxalatemg g
-1 a
Moxalate /MDCB
Al Fe Si Al Fe Si Fe
Selh Bulk soil 0.04 0.03 0.12 0.88±0.03 3.36±0.19 0.21±0.01 0.29
WDC 0.03 0.02 0.14 3.74±0.01 11.5±0.05 0.85±0.01 0.29
Roll Bulk soil 0.03 0.01 0.04 2.60±0.02 6.43±0.17 0.11±0.01 0.38
WDC 0.02 0.03 0.07 8.11±0.05 14.6±0.12 0.33±0.01 0.26
Wuest Bulk soil 0.08 0.05 0.04 4.17±0.28 11.9±0.84 0.11±0.01 0.45
WDC 0.22 0.17 0.26 8.77±0.14 24.3±0.58 0.36±0.01 0.54 a values are average of three different experiments ± standard deviation.

Table 6 The measured specific surface areasusing N2 gas- adsorption method forWDC and bulk soil
samples from three topoils.
Soils
Metal oxideDCB
Metal oxideoxalate
SSACB70/
SSACB400
SSADCB70/
SSADCB400
SSA((CB-
DCB)/CB)400
SSAblank70/
SSAblank400
SSAoxalate70/
SSAoxalate400
SSA((blank-
oxalate)/blank)400
m2 g
-1 m
2 g
-1 % m
2 g
-1 m
2 g
-1 %
Selh
Bulk
soil
5.3/
10.4
4.9/
6.2 41
12.8/
18.8
6.1/
15.8 16
WDC 58.1/
87.7
34.5/
64.3 27
66.7/
87.4
37.3/
83.2 5
Roll
Bulk
soil
7.0/
15.8
4.9/
9.0 43
7.6/
23.1
5.6/
15.2 34
WDC 25.1/
49.2
20.2/
32.1 35
30.9/
69.7
21.8/
59.8 14
Wuest
Bulk
soil
8.3/
17.1
5.3/
9.5 45
14.1/
29.6
5.8/
19.3 35
WDC 36.6/
66.5
20.6/
37.2 44
55.5/
87.3
23.2/
67.8 22

Table 7 Pore size investigation of WDCs using N2 gas- adsorption methodforWDCCB70,WDCCB400,
and WDCDCB400 samples from three topoils.
Sample
SSA Vµpore Total
Vpore Rp(N2) RpDCB400/
RpCB400
RpCB70/
RpCB400
PSD PSD
m2g
-1 cm
3 g
-1 cm
3g
-1 nm
Pore < 25nm
(%)
Pore >25nm
(%)
WDCCB70 58.1 0.014 0.23 9.53 30 70
Selh WDCCB400 87.7 0.025 0.31 7.02 1.17 1.36 35 65
WDCDCB400 64.3 0.020 0.27 8.23
29 71
WDCCB70 25.1 0.007 0.19 17.43 20 80 Roll WDCCB400 49.2 0.015 0.33 12.62 1.40 1.38 25 75
WDCDCB400 32.1 0.009 0.37 17.68
16 84
WDCCB70 36.6 0.008 0.21 13.51 24 76
Wuest WDCCB400 66.5 0.020 0.31 10.56 1.46 1.28 25 75
WDCDCB400 37.2 0.009 0.27 15.38 17 83

Table 8 Pore structure characteristics (,k, DS) and colloidal properties (dz , ζ-potential) of WDC
samples measured with SAXS, DLS and ME methods.
alinear fitting results of Eq. (7).
b Ds results with Eq. (8).
b values are average of three different experiments ± standard deviation.
Sample name
SAXS
DLS and ME
power-law scattering pH dz(nm)c ζ (mV)
c
ka Ds
b r
2
Selh WDCCB400 3.31±0.01 2.69±0.01 1 7.13 542±11 -28.9±0.4
Selh WDCDCB400 3.60±0.01 2.40±0.01 1 6.91 639±1 -29.6±0.4
Roll WDCCB400 3.48±0.01 2.52±0.01 1 7.10 721±30 -26.9±0.7
Roll WDCDCB400 3.80±0.01 2.20±0.01 1 6.89 769±19 -28.1±0.1
Wüst WDCCB400 3.30±0.01 2.70±0.01 1 7.26 715±28 -26.9±0.0
Wüst WDCDCB400 3.70±0.01 2.30±0.01 1 7.17 802±11 -32.5±0.8


