

International Journal of Applied Environmental Sciences
ISSN 0973-6077 Volume 11, Number 5 (2016), pp. 1303-1316
© Research India Publications
http://www.ripublication.com
Effect of Non-Migrating Bar to Planform Migration
Zamri, Za,*, Abdullah,Jb, Ali, A.N.Ac Ariffin, J.d
a Post Graduate Student, Faculty of Civil Engineering , Universiti Teknologi MARA, Malaysia.
b&d Faculty of Civil Engineering ,Universiti Teknologi MARA, Malaysia.
c Faculty of Civil Engineering ,Universiti Teknologi MARA Campus Samarahan, Sarawak, Malaysia.
Abstract
A study to determine on the effect of non-migrating bar to lateral movement was
carried out on large scale river physical model at the Universiti Teknologi
MARA, Puncak Alam, Selangor, Malaysia with special focus. This paper
explains the methodology for measurement and and illustrates the effect of non-
migrating bar on planform migration for different flows, 13.53 m3/hr, 10.91
m3/hr, 8.62 m3/hr and 6.64 m3/hr. The experiment was designed with a steady
non-uniform flow with uniform grain size channel bed, uniform rectangular
cross-section, and a constant slope. Planform of channel migration and the rate
of width change are highlighted.
Keywords: river physical model, lateral migration, mid-bar
INTRODUCTION
The dynamic process of a river forms is attributed to its responses to variability of water
and sediment discharges impacted upon them. Human activities have been identified as
one of the key factors that accelerate changes in river profile.. Changes in flow and

1304 Zamri Z., Abdullah J., Ali A.N.A and Ariffin J.
sediment composition generate changes in width, depth, slope and planform due to
water and sediment load. (Knighton, 1998). Shifting or migrating of bankline and
meander development warrantsspecial intention because such movement often
threatens adjacent property and infrastructure.
Basic concept of lateral migration
Lateral migration is the process of river movement in which water flows to erode the
riverbank at the outer layer and will move the deposit to the inner bank. Lateral
movement can take different forms depending on the input condition. The river is
subject to the possibilities of narrowing, widening, avulsion and cutoffs. (Richard,
2001). Narrowing is the result of the sedimentation near one bank in excess of erosion
rate of the opposite bank. Alternately, widening is a result of erosion on one bank in
excess of sedimentation near the opposite bank. (Julien, 2002). As a result, river
meandering is a net outcome between erosion and deposition.
Research on meandering river has been regularly conducted in the last decades.
Measurements have been taken through on-site investigations, time-sequence maps and
laboratory tests to gather specific data such as hydraulic parameters, channel or bed
properties, historical data, and channel planform geometry. The pioneer research for
river physical model on meander migration was done by Friedkin (1945). The purpose
of this research was to investigate the effect of discharge, slope, initial cross-section,
sediment, angle of attack and sediment feeding to meander channel. In recent years,
numerous studies on experimental work on lateral migration with meander channel
have been done i.e Bertoldi and Tubino (2005), Park (2007), Yeh (2009) and Kuang
(2011). In these studies, lateral migration that occurs in the channel is observed and
established. This includes channel cross-section, secondary flow, channel width, radius
of curvature, angle of channel bank, and bankline profile in their experiment because
these parameter were influenced to the lateral migration.
Prediction of migrating channel using an empirical model was identified and proposed
by Nanson and Hickin (1983,1984,1986), Richard (2005), and Yeh et al (2011). Nanson
and Hickin (1983) suggested that sediment transport as well as the ratio of radius of
bend curvature channel width influence the migration rates. Unfortunately, the sediment
transport was not considered during the field study by Hickin and Nanson (1984)
because of the condition of the field study, whereas the sediment load is likely to be
determined largely by local bank erosion and channel migration. Therefore, it was
suggested that the migration rates are dependent on stream power per unit area of the
Effect of Non-Migrating Bar to Planform Migration 1305
bed. In 1986, Nanson and Hickin found that the volume of sediment eroded from the
outer bank of meander influenced the bank erosion and channel migration. Thus, bank
resistance and the size of sediment at the base of the outer bank were the important
variables as an accurate predictive model relationship. Richard (2001) suggested the
migration rate is significantly associated with measures of flow energy and ratio of
active channel width to total channel width. Park (2007) named five coefficients in
order to predict the maximum lateral migration with regard to the ability of flow to
erode the channel bankline and is denoted as excessive Froude Number. In addition to
that to the above, the angle of channel bend affects the maximum migration distance.
Lateral migration should be highly considered in designing bridges, highways, or any
structure standing nearby a river. Channel migration will scour at excess bridge pier
and abutment, pose threats to bridge and infrastructure nearby, worsen debris problem
and impede transportation through the bridge. (Lagasse et al, 2004).
Bars in river
Bars refer to large bed form configuration that is often exposed during low flows. In a
normal circumstance, they are submerged and can be viewed as alluvial bed deposition.
Bars can be transported easily under the high flow. Three types of bars are alternate
bars, point bars and tributary bars. Mid-bar or middle bar, also a main concern for this
research, is truncated from point bar and associated with erosion of the outer bank and
lateral migration of the river. During major floods or heavy flow, point bar can be
transported to form chute cutoffs. At low flow, chute cutoffs can lead sedimentation in
both river branches. (Julien, 2002). Schuurman (2015) has documented that the
developed mid-bar will form a bifurcation which divides discharge and sediment over
the downstream of the bar. The sediment will then be transported in the main channel
instead of over the bar due to the non-linear relation between flow velocity and
sediment transport rate. Thus, the channel will become wider because of bank
retreatment, as sediment transport was concentrated in the center of the main channel.
This fact supports Ashworth's (1996) finding. Furthermore, water depth will also be
decreased. There are two types of bars in the river channel, migrating and nonmigrating
bar (Lanzoni, 2000 and Wu et al, 2011). The nonmigrationg bar can develop and replace
migrating bar in long term and re-main in constant discharge.
An extensive studies on migrating bar and interactions with bed morphology in the field
study had been done by Leopold and Wolman (1957), Asworth, (1992) and Richardson

1306 Zamri Z., Abdullah J., Ali A.N.A and Ariffin J.
and Thorne (2001), and an experimental work studies had been done by Lazoni (2000),
Asworth (1995) and Federici and Paola (2003). Lazoni (2000) had carried out an
experimental investigation on bar formation in straight channel. The experiment shows
various aspects of alternate bar development. Few more studies by Asworth (1996)
have focused on mid bar development after post-confluence.
However, investigation performed on the effects of non-migrating mid-bar with regard
to lateral migration is limited. Therefore, the present study investigates river
morphology on lateral migration in the upstream and downstream of a non-migrating
bar. It is hope that the phenomena of lateral migration in assessing the impact of human
activity upon the river basin/ floodplain area can be fully understand.
EXPERIMENTAL SETUP
The experiment was conducted in a concrete flume measuring 45m long, 2.4m wide
and 1.8m deep, located at Universiti Teknologi MARA. Three (3) main types of
equipment had been installed, which are water pump, to recirculate water from sump to
the water tank, V-notch angled at 60 degrees at the entrance of flume to control designed
flow rate, and pipes with varied sizes ranging between 102 mm to 76mm diameter. To
ensure the initial slope, three (3) sticks levelling gauge were installed along the side of
the brick wall.
The experiment was conducted in a wide and shallow flume of sufficient size to permit
the stream to meander freely. The initial channel was molded with 10m long, 0.4m
width and 0.15m deep which is rectangular cross-section. The flume is connected with
a water tank (6m long, 6m wide and 1.8m height) through connected pipes supply as
mentioned above. This channel was designed with a size large enough to accommodate
the channel to migrate either to the left or the right of the bank. The channel was carved
using a mold on the sand bed to simulate the natural process of meander of a natural
river. Figure 1 shows the schematic diagram of the channel equipped with the other
accessories.

Effect of Non-Migrating Bar to Planform Migration 1307
Figure 1: Schematic diagram of river physical model
For the channel bed and bank material, uniform size of sediment was filled in the flume
with average median grain diameter, d50 value of 0.348 mm. The grain size distribution
curve was obtained from sieve analysis in accordance to British Standard Methods of
Test for Soils for Civil Engineering Purposes BS1377: Part 2:1990 as shown in Figure
2. The grain size distribution is important to be applied with shear stress in relation to
the mobility of sediment. The threshold motion of sediment, which exerts forces, tends
to initiate particle motion. For this, Shields diagram (modified after Yalin and Karahan,
1979) (Julien, 2010) grain shear Reynolds number, Re* and critical value of the Shields
parameter, *c should be considered. From the Shields diagram, the values for Re* and
*c are 6.055 and 0.054 respectively. These values have exceeded the threshold limits.
The initial velocity of 0.802 m/s is evident that erosion is expected at the bankline.
Figure 2: Typical grain size distribution curve

1308 Zamri Z., Abdullah J., Ali A.N.A and Ariffin J.
The sediment with different layers of material as shown in Figure 3 was naturally
compacted to replicate natural river by soaking the sediment for 24 hours. From the
compaction test implemented, results show that the sediment layers are fully compacted
and saturated with 85% compaction.
Figure 3: Layers of sediment in the flume
The channel was designed to fit the scale with the maximum flume. The first 5m from
the V-notch was disregarded because the flow needs to be fully-developed before
entering the curve bend. Initially, the experiment was conducted with a bend curve of
380 at the entrance followed by a straight channel downstream as shown in Figure 4. A
mid-bar was constructed at a distance of 1.5 m from the entrance curve. The mid-bar
was designed with bar aspect ratio (width-length ratio) (Schuurman, 2015) of 1:2 which
is 200mm width and 400mm length. Dimension of the constructed mid-bar was
replicated from several mid-bars in Sungai Kelantan, Kelantan, Malaysia.
Construction of the mid-bar at 1.5 m after the bend (shown in Figure 6) is to ensure that
flow will take place naturally without obstruction. The channel has a rectangular cross-
section (400mm width and 150mm depth), sloping 0.01 with uniform mean particle
size of sediment (0.348mm) for bed and bank. The other parameter for initial condition
for this study are as shown in Table 1.

Effect of Non-Migrating Bar to Planform Migration 1309
Figure 4: Schematic of designated channel
Table 1: Initial condition of the experiment
Experiment/
Parameter
1 2 3 4 5 7 8 9 10 11 12
Flow rate (m3/hr) 13.53
13.53
10.91
8.62
6.64
6.64
10.91
8.62 10.91
8.62 6.64
Mid-bar ratio 1:2
1:4
Type of channel Straight
Meander
Straight
Location of constructed mid-bar (CH) 9.1
8.1
9.1
During data collection, flow depth, velocity, bed profile and river bankline marks were
taken. Nixon Streamflow Velocity Meter model 430, connected with probes type 403
(suitable for low-speed velocity – from 5.0 cm/s up to 150 cm/s), was used to measure
mean velocity at each cross-section along the channel. Laser distance meter was used
to measure bed profile. Measurement of the range of the Laser mEssfix ranges from
0.05m to 50m and has a tolerance of +/- 1.5mm. These sets of equipment were mounted
at point gauge which is attached to a movable platform. The experiment set-up is as
shown in Figure 5.

1310 Zamri Z., Abdullah J., Ali A.N.A and Ariffin J.
Figure 5: The arrangement of the equipment
By using laser distance meter as mentioned above, the bed profile data was collected
using grid method. Point gauge was moved in longitudinal, transverse and vertical
direction (bed profile) to represent X, Y and Z axis respectively. The bed elevation data
was captured every 20cm interval at X direction and 5 cm interval at Y direction. Data
was collected starting from CH 5.0 until CH15 as mentioned above. Figure 6 shows the
layout of the grid method.
Figure 6: The Layout of the grid system
For this study, the experiment was set-up with various flowrates. Flow was allowed to
run for half hour to remove any loose sediment before measurement began. Data was

Effect of Non-Migrating Bar to Planform Migration 1311
recorded at every 0, 6, 30 and up to 54 hours throughout the experiment. Based on
Friedkin, (1945), the absence of sediment supply at the upstream of the channel does
not prevent the channel from meandering, as sediment supply can come from the bank
and transported downstream. At the end of the experiment, erosion process was stopped
when the channel reached the equilibrium state. In addition, inability of the channel to
meander because of the limitation of the space led to the abrupt end of the experiment.
On the other hand, Experiment 1, shows values of Re* and *c are 5.588 x 10⁻³ and
2.739 x 10⁻³ respectively after 30 hours. Referring to the Shields Diagram (modified
after Yalin and Karahan, 1979) (Julien, 2010) the values show that there is no sediment
motion. Thus, there was no erosion process and the channel reached the equilibrium
state after 30 hours.
RESULT AND DISCUSSION
Channel migration
The morphology behavior of a straight and meander channel with a constant flowrate
was examined for every experiment. The experiment was set up with various flowrate
as mentioned above, whereas the designated flow was a steady non-uniform flow. The
bed and the river bank of the channel were designed with a 0.01 slope along the channel.
Figure 7 (a), (b), (c) (d) and (e) illustrate the planform of channel migration after 30
hours. These figures show a comparison on the channel planform for four different
flowrates. There is evidence of erosion throughout the channel on both sides of the bank.
Large bank retreat occurred before the non-migrating bar and proceeded downstream
with broadened channel width. In experiment 5 and 12, the channel exhibit a more
uniform migration at lowest flowrate. Nevertheless, experiment 7, 8 and 9 exhibit
different features with broadened width at low flowrates. Thus, channel progression
takes place laterally. This development promotes meandering of the channel as
documented by Nagata et al in 2000. At the end of the experiment, the constructed mid-
bar was fully covered with deposited sand as bank material is get eroded and transported
to downstream.

1312 Zamri Z., Abdullah J., Ali A.N.A and Ariffin J.
(a) (b) (c) (d) (e)
Figure 7: The planform of channel migration based on different flowrates and type of
channel (a) 13.53 m3/hr (b) 10.91 m3/hr (c) 8.62m3/hr (d) 6.64 m3/hr for straight channel
(e) all the flowrate for meander channel
Rate of width change
Width of the channel was measured at every cross-section. The total channel width,
Wtot including mid-bar and island were measured. The changes of Wtot respond to
water and sediment, and planform adjustment of bar size. The total channel width rate
of change, dWtot, can be calculated from the difference between the initial total width
of the time period and the total width at the end of the period, divided by the length of
the period. (Richard, 2001).
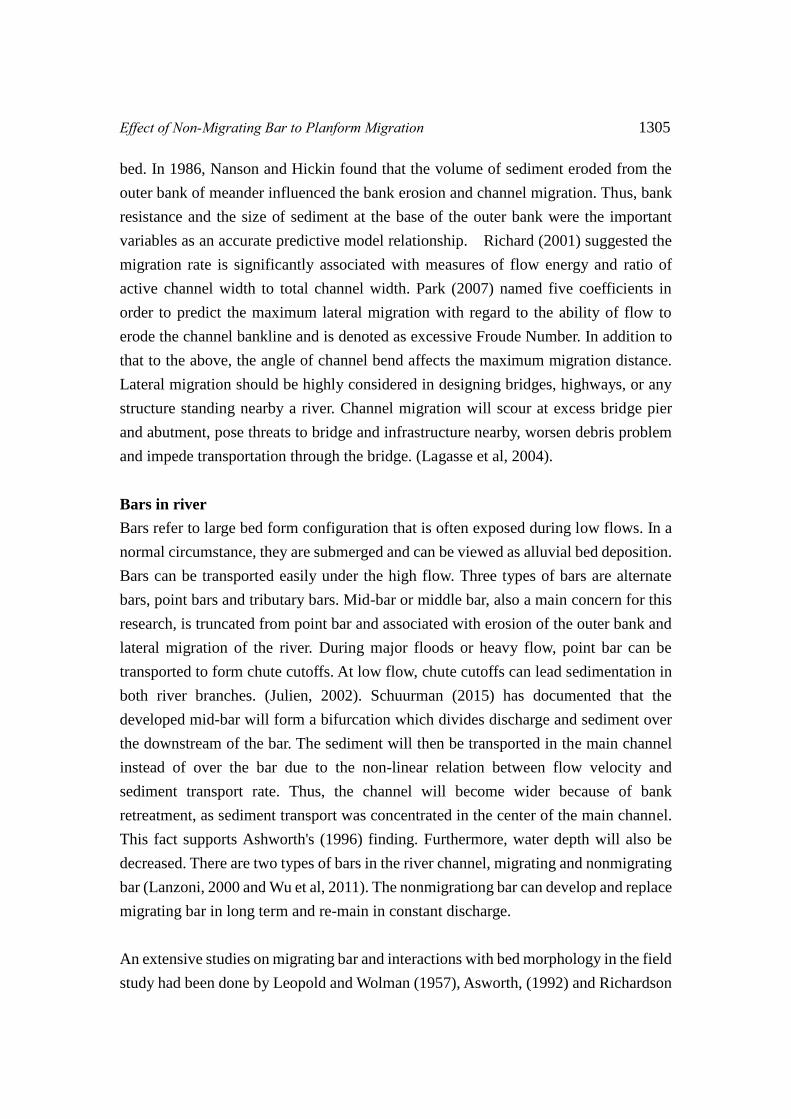
Figure 8 shows the rate of width change for experiment 1 and 5. dWtot6 and dWtot30
denote rate of width change for 6 and 30 hours respectively. Illustrations feature
aggressive increase and decrease in rate of width for the first 6 hours after the running
of the experiment. While, after 30 hours, the rate had decreased.
Effect of Non-Migrating Bar to Planform Migration 1313
(a) (b)
Figure 8: The rate of width change based on (a) experiment 1 with 13.53 m3/hr (b)
experiment 5 with 6.64 m3/hr
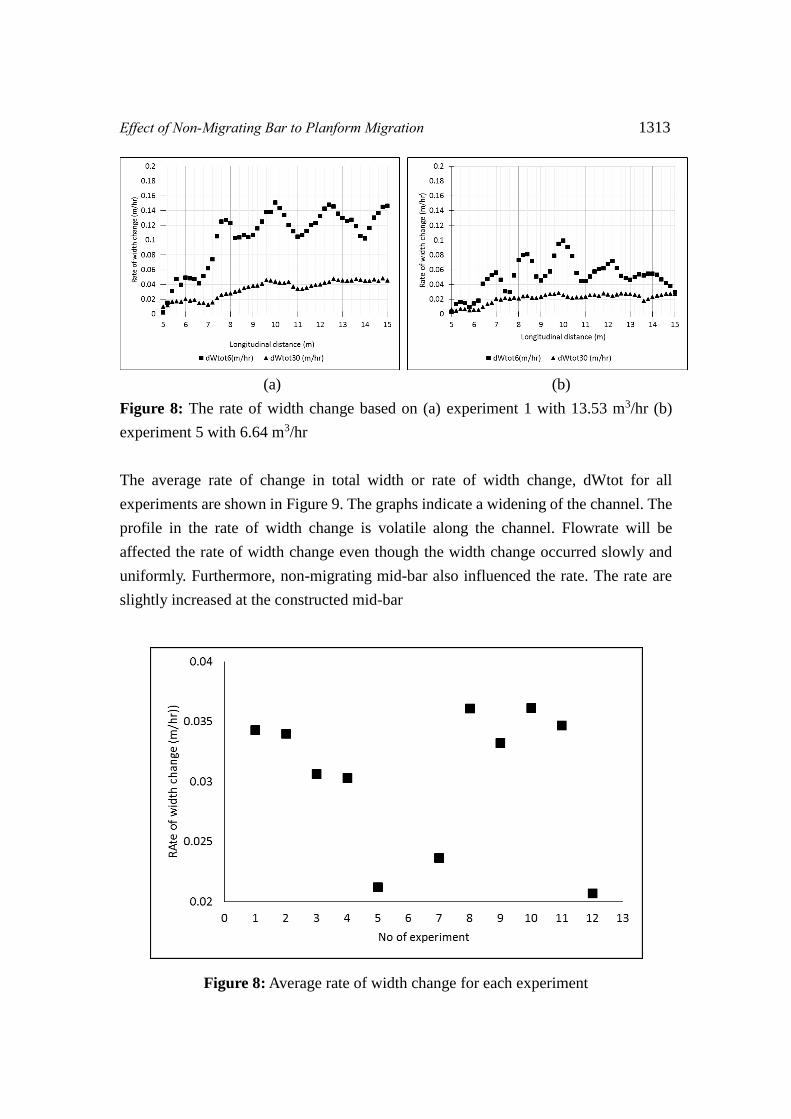
The average rate of change in total width or rate of width change, dWtot for all
experiments are shown in Figure 9. The graphs indicate a widening of the channel. The
profile in the rate of width change is volatile along the channel. Flowrate will be
affected the rate of width change even though the width change occurred slowly and
uniformly. Furthermore, non-migrating mid-bar also influenced the rate. The rate are
slightly increased at the constructed mid-bar
Figure 8: Average rate of width change for each experiment

1314 Zamri Z., Abdullah J., Ali A.N.A and Ariffin J.
CONCLUSION
The aim of this study is to investigate river morphology for lateral migration influenced
by non-migrating mid-bar at the upstream and downstream of the channel. The
experimental works were conducted in a rectangular straight channel with constant flow
rate and constant mean grain size of sediment. The channel moved laterally and the
width of the channel had broaden alternately along the channel. When the channel
began to reach the equilibrium state, the rate of channel became constant until the end
of the experiment. The rate was affected at mid-bar point (CH 9.0 onward) and
downstream of the channel.
The findings help to improve future experiment, with various condition of initial
discharge and ratio of the constructed mid-bar implemented to achieve varying results.
The initial discharge should be an appropriate design so that the miniature of flow
sensing probe could be used in all cases. The layout of the channel will be improved,
especially the constructed mid-bar. The mid-bar will be lifted up slightly higher than
the riverbank to ensure that the mid-bar is not fully covered by the deposited sediment,
especially during the highest discharge.
ACKNOWLEDGEMENTS
The writers sincerely acknowledge Universiti Teknologi MARA and Ministry of Higher
Education Malaysia for funding this research with rags grant
(RAGS/1/2014/tk02/UiTM/15) and Faculty of Civil Engineering for providing facility
and equipment during this research
REFERENCES
[1] Ashworth, P.J. (1991). How do gravel-bed rivers braid. Journal Earth Science,
Vol.28, 326-341.
[2] Ashworth, P.J. (1992). Measurement in a braided River Chute and Lobe 2.
Sorting of bed load during entrainment, transport and deposition. Water Resources Research, 28(7), 1887-1896.
[3] Ashworth, P.J. (1996). Mid-channel bar growth and its relationship to local flow
strength and direction. Journal of Earth Surface Processes and Landforms, vol. 21, 103-123.
Effect of Non-Migrating Bar to Planform Migration 1315
[4] Bertoldi, W., and Tubino, M. (2005). Bed and bank evolution of bifurcation
channels. Water Resources Research, Vol 41. [5] Federici, B. and Paola, C. (2003). Dynamics of channel bifurcation in
noncohesive sediments. Water Resource Research, Vol 39, 1162
[6] Friedkin, J.F. (1945). A laboratory study of the meander of alluvial rivers. U.S. Army water-ways experiment station, Vicksburg Mississippi.
[7] Hickin, E J. and Nanson, G. C.(1984). Lateral Migration Rates of River Bends.
Journal of Hydraulic Engineering. 110(11), 1557-1567.
[8] Julien, P.Y. (2002). River mechanics. Cambridge University Press. UK.
[9] Julien, P.Y, (2010). Erosion and sedimentation. Cambridge University Press.
[10] Kuang, H. (2011). Physical and Numerical modelling Study of meandering in
fluvial rivers, Cardiff University. (Doctoral dissertation)
[11] Knighton, D. (1998). Fluvial form and processes – A New Perspective. John
Wiley & Sons. Inc, New York.
[12] Lagasse, P.F., Zevenbergen, L.W., Soitz, W.J. and Thorne, C.R. (2004).
Methodology for predicting channel migration. Transportation Research Board of The National Academies.
[13] Lanzoni, S. (2000). Experiment on bar formation in a straight flume – uniform
sediment. Journal of Water Resources Research, 36(11), 3337-3349.
[14] Leopold, L.B. and Wolman, M.G. (1957). River channel patterns: braided,
meandering and straight. Geological survey professional paper 282-B. United State, 29:2, 465-475
[15] Nanson, G. C. and Hickin, E. J. (1983). Channel migration and incision on the
Beatton River. Journal Hydraulic Engineering, 109, 327-337.
[16] Nanson, G. C. and Hickin, E. J. (1986). A statistical analysis of bank erosion
and channel mi-gration in western Canada. Geological Society of America Bulletin, 97(4), 497-504.
[17] Nagata, N., Hasoda, T. and Muramoto, Y. (2000) Numerical analysis of river
channel processes with bank erosion. Journal Hydraulic Engineer, 126(4), 243-
252.
[18] Park, N. 2007. A prediction of meander migration based on large-scale flume test clay. Texas A&M University. (Doctoral dissertation)
[19] Richard, G. A. (2001). Quantification and prediction of lateral channel adjustments downstream from Cochiti Dam, Rio Grande, NM. Colorado State
University. (Doctoral dissertation)
1316 Zamri Z., Abdullah J., Ali A.N.A and Ariffin J.
[20] Richard, G. A. (2005). Statistical analysis of lateral migration of the Rio Grande,
New Mexico. Geomorphology, 71(1-2), 139-155.
[21] Richardson, W. R. and Thorne, C. R. (2001). Multiple threads flow and channel
bifurcation in a braided river: Brahmaputra-Jamuna River, Bangladesh. Journal of Geomorphology, 38, Pp 185-196.
[22] Schuurman, F. (2015). Bar and channel evolution in meandering and braiding rivers using physicsbased modeling. Utrecht University. (Doctoral dissertation)
[23] Yeh, P.H. (2009). Channel meander migration in large-scale physical model
study. Texas A&M University. (Doctoral dissertation)
[24] Yeh, P.H., Park, N., Chang, K.A., Chen, H.C. and Briaud, J.L. (2011).
Prediction of time-dependent channel meander migration based on large-scale
laboratory experiments. Journal of Hydraulic Research, 49(5), 617-629.
[25] Wu, F.C., Shao, Y.C., Chen, Y.C., (2011). Quantifying the forcing effect of
channel width variations on free bars: morphodynamic modeling based on
characteristic dissipative Galerkin scheme. Journal of Geophysical Research, 116.


