
Journal of Engineering Science and Technology Vol. 11, No. 2 (2016) 296 - 310 © School of Engineering, Taylor’s University
296
EFFECTIVE SENSOR CLUSTERING FOR ONLINE MONITORING IN TRANSMISSION TOWERS
A. MOJTAHEDI
Faculty of civil Engineering, University of Tabriz, Tabriz, Iran
E-mail: [email protected]
Abstract
Health monitoring systems are essential to investigate the performances during
the service life of a structure such as the three-dimensional transmission tower.
However, many real-world sensors and transducers require sensor positioning
drafts before a computer based measurement procedure can effectively and
accurately acquire the signal. This paper develops a direct physical property
adjustment method, named as cross-model cross-mode method. In dealing with
spatially incomplete situations, model reduction schemes were used. The
selection procedure of the inactive degrees of freedom in process of the model reduction evaluated with a reasonable criterion by using the sensitivity analysis
of system response under base excitation. Also, the noisy data measurements
are the other crucial factors. The success rates based on the correct detection
probability factor were defined in order to evaluate the noise effect on the
accuracy of the method. The efficiency of the method is validated by different
damage scenarios. The results show that the developed methods are suitable for
damage classification. But in the cases of the less used sensors than the degrees
of the freedoms, the location of the sensors must be considered an important
factor influencing the success rates.
Keywords: Structural health monitoring, Damage detection, Transmission tower,
Model reduction, sensor clustering.
1. Introduction
Research on vibration-based damage identification using changes in output
signals from the structure has expanded rapidly in last decades [1]. Uhl [2] and
Wang et al. [3] can be served as the state-of-the-art reviews on the vibration-
based methods. In recent years, several researchers have studied damage detection
in transmission towers.

Effective Sensor Clustering for Online Monitoring in Transmission Towers 297
Journal of Engineering Science and Technology February 2016, Vol. 11(2)
Abbreviations
CMCM Cross Model Cross Mode
FE Finite Element
Heung and Tao [4] discussed structural monitoring in this kind of structures
described a fault-detection algorithm using dynamic reduction-based methods.
This work provides a detailed overview of the background research and serves as
a good reference in this field.
Since the damage may cause the change on the stiffness distribution of the
structural system, subsequently the modal properties of the system may be altered
as well. Damage detection methods using techniques based on modal parameters
can be divided into direct and iterative methods. Using the direct methods the
matrices are updated by forming a constrained optimization problem. However,
because of changes in the dynamic matrices in the mathematical model, the
physical meanings of the original practical structures cannot be preserved. In the
iterative methods, the solving procedure follows an optimization problem, in
which the inconsistencies between the numerical and practical dynamic
characteristics are minimized by adjusting the modal parameters. The major
advantage of iterative methods over direct methods is the ability to preservation
of the initial correspondence between the degrees of freedom within the dynamic
matrices of the practical structures.
The focus of the present paper is on the problems of uncertainties were
considered to be the main objectives in developing and evaluating a robust
damage detection system. These concepts are investigated by the adaptation of
two methods based on different standpoints: experimental modal analysis and
time-capture data processing. In addition, one implicit objective of this study is to
discuss the inherent difficulties in implementing SHM techniques for complex
structures, such as transmission towers. The expansion of such methodologies can
be extremely useful in assisting technologies that can be applied to structures in
service. In this work, a physical model was constructed for this purpose.
The concept of global monitoring methods is established based on the
dynamic responses of systems. These responses can be recorded during excitation
of structures by each type of the external dynamic forces. As the considered
feature sets of this study are the natural frequencies which are independent of the
excitation types, the proposed method is adaptable to each type of input forces
and the inherent structural dynamic output response must be considered more
carefully which is the significant key point for the related method.
On the other hand, the updating process of the stiffness matrix is extended
based on the cross modal cross model method to detect and quantify the severity
of damage under the supposition that only the first few modal parameters have
been recognized. The change of modal parameters can be used as a basis for these
kinds of the fault recognition methods [5].
The global structural health monitoring methods are facing two major
problems for the situ towers; the lack of coordination of measurement sensors and
degrees of-freedoms of the numerically model, namely the spatial incompleteness
[6]. In dealing with spatially incomplete situations, model reduction schemes can
be used.
298 A. Mojtahedi
Journal of Engineering Science and Technology February 2016, Vol. 11(2)
Vibration phenomena have always been a cause of concern to engineers, even
more today as structures are becoming lighter and more flexible due to increased
requests for efficiency and safety. It is clear that a comprehensive understanding
of the existing vibration levels in service is essential. Accordingly, precise
analytical models of structures are required to explain the vibration
characteristics. A most widely used analytical tool is the Finite Element method
based on the modal testing. The Finite Element method is widely used in industry
as it can produce a good representation of a factual structure [7]. However, it must
be approved that due to limitations in this method, a Finite Element model is
always a rough calculation of the prototype. Inaccuracies in the model can occur
due to inaccurate estimation of the physical properties of the structure, in
individual element shape functions or a poor quality mesh, poor approximation of
the boundary conditions and occurrence of additional inaccuracies during the
solution phase [8].
The modal measurements are taken directly from a physical structure without
any assumptions about the structure and as such they are considered to be more
reliable than their Finite Element counterpart. Inaccuracies in the empirical
attitudes may occur due to errors owing to noise, the assumption of linear
response while there can also be non-linear responses and nonlinearities in the
measurements. It is generally believed that more confidence can be placed on
experimental data as measurements are taken on the true structure. Therefore, the
analytical model of a structure is usually updated on the strength of the
experimental model. In this study for the sake of improvement of the well-known
cross-model cross mode method we evaluated selection procedure of the slave
DOFs by using the sensitivity analysis of system response under a base excitation.
This performance leads to faster convergence of iterative algorithm.
2. Cross Model Cross Mode and Model Reduction terminologies and
representations
One main scope of the experimental modal analysis is extraction of the frequency
response functions (FRF's). In the first step of an experimental modal analysis, the
elements of at least one full raw or one full column of the FRF matrix should be
measured and then the natural frequencies can be identified using a variety of
different methods such as Rational Fraction Polynomial (RFP) method. Another
very important aspect of modal testing is the correlation and correction of a
numerical model such as a finite element models.
The main outline of the methods being used in this study is based on the
methodology similar to cross-model cross mode [10]. So the method is
introduced briefly. The equation of motion of an un-damped dynamic system is
given as follows: ��� + �� = 0 (1)
where, M and K are the mass and stiffness matrix, respectively. Also, V and V&&
vectors denote the displacements and accelerations. The ith eigenvalues and
eigenvectors are expressed as: �∅ = �∅ (2)

Effective Sensor Clustering for Online Monitoring in Transmission Towers 299
Journal of Engineering Science and Technology February 2016, Vol. 11(2)
where and ∅ is the ith eigenvalue and eigenvector corresponding to baseline K
and M matrixes which can be obtained from a finite element model. The stiffness
matrix �∗ of the experimental model is formulated as a modification form of K: �∗ = � + � �������� (3)
where nK is the stiffness matrix corresponding to the nth element, eN is the
number of elements and � are unknown correction factors must be determined.
The jth eigenvalue and eigenvector associated with �∗ and �∗ are formulated as
follows:
(4) ∗∗∗∗∗ Φ=Φ jjj MK λ
Here, it will be assumed that a few of ∗
jλ and ∗Φ
j
are known measurements
available from modal testing then with pre multiplying by ∅� yields:
(5) ∅��∗∅�∗ = �∗∅��∗∅�∗
Substituting Eq. (3) into Eq. (5) yields:
(6) ��� + � ���,�� = �∗��������
Index � is used to replace ij:
(7) �∈� + � ���,∈� = �∗�∈������
Then
(8) � ���,∈� = �∈������
when Ni modes are taken from the baseline finite element model, and Nj modes
are measured from the damaged structure, totally Nε=Ni×Nj equations can be
formed from Eq. (8). Equations formed based on Eq. (8) are named cross model
cross mode:
(9) ���∗�∈� ��∗� = ���∗�
If Nv is greater than Ne then more equations are available than unknowns and
to gain the parameter of , the least squares solution can be taken as follows:
(10) = ���!"����� 2.1. Spatial Incompleteness and Guyan Model Reduction Technique
The problem of vibration analysis consists of determining the conditions under
which the equilibrium condition expressed by Eq. (1) will be satisfied. It would
be assumed that the free vibration motion is simple harmonic and be expressed
as follow:
300 A. Mojtahedi
Journal of Engineering Science and Technology February 2016, Vol. 11(2)
V(t)=Vsin(ωt+ϴ) (11)
where, V̂ represents the stationary shape of the system and θ is a phase angle.
Therefore, the accelerations in free vibration can be derived:
VtVV ωθωω =+−= )sin(ˆ2&& (12)
and with the considering of Eq. (1)
0)sin(ˆ)sin(ˆ2 =+++− θωθωω tVktVm (13)
by omitting the arbitrary sine function:
[ ] 02 =− Vmk &&ω (14)
Now it can be shown by Cramer's rule that the solution of this set of
simultaneous equations is of the form:
mkV
2
0ˆ
ω−= (15)
Hence, the finite amplitude free vibrations are possible only when:
02 =− mk ω (16)
The N roots of this equation (222 ,...,,
21 Nωωω ) represent the frequencies of the N
modes of vibration. Using the MATLAB software, [V, D] = eig (A) produces
matrices of eigenvalues (D) and eigenvectors (V) of matrix A. Matrix D is the
canonical form of a diagonal matrix A. Matrix V is the modal matrix.
The major problem inherent to dynamic structural analysis is the time-
consuming and costly amount of computation required. As practical finite element
models can contain tens of thousands of degrees of freedom, the time and expense
of computing all of the frequencies and mode shapes are prohibitive. Fortunately,
to obtain reasonable approximations of dynamic response, it is seldom necessary
to solve the full eigenvalue problem. Two practical arguments underlie the
preceding statement. First, the lower-valued frequencies and corresponding mode
shapes are more important in describing structural behaviour. Second, when
structures are subjected to time-dependent forcing functions, the range of forcing
frequencies to be experienced is reasonably predictable. Therefore, only system
natural frequencies around that range are of concern in examining resonance
possibilities [11].
A well-known model reduction method is a static reduction method
introduced by Guyan [11]. This technique partitions the mass and stiffness
matrices, and the displacement vector into a set of master and slave degree of
freedoms. The Guyan transformation matrix and the reduced Guyan mass and
stiffness matrices are presented as follows:
[ ] [ ][ ] [ ]
[ ] [ ][ ] [ ]
=
+
0
0
s
m
sssm
msmm
s
m
sssm
msmm
V
V
KK
KK
V
V
MM
MM
&&
&& (17)
Effective Sensor Clustering for Online Monitoring in Transmission Towers 301
Journal of Engineering Science and Technology February 2016, Vol. 11(2)
Here, the subscripts m and s correspond to master and slave coordinates,
respectively. The inertia terms are neglected to obtain the equation:
[ ]{ } [ ]{ } [ ]{ }mssssmsm VTVKVK =+ (18)
This equation may be used to eliminate the slave coordinate to leave
the following:
[ ][ ] [ ] { } [ ]{ }msm
smsss
mVTV
KK
I
V
V=
−=
−1 (19)
#$%& = ' #(&−#�%%&"�#*+&, (20)
sT is Guyan transformation matrix and I is identify matrix.
The reduced Guyan mass and stiffness matrices are then given by #�-& = #$%&#�&#$%& (21)
#�-& = #$%&#�&#$%& (22)
In dealing with spatial incompleteness, usually applies model reduction
schemes. The transformation matrix the master coordinates of the full order
coordinates for the baseline model is denoted as T. The final relations are produced
by applying ( )mii T Φ=Φ and ( )
mjj T ∗∗∗ Φ=Φ the previous equations, where ( )miΦ ,
( )mj
∗Φ and ∗T are the ith
mode shape of the baseline structure calculated only at the
master coordinates, the jth
mode shape of the damaged structure measured only at
the master coordinates and the counterpart of T for the damaged structure
respectively.. (23) �/ = #∅+&�$��$∗0∅�∗1+
(24) ��,/ = #∅+&�$���$∗0∅�∗1+
(25) �/ = #∅+&�$��$∗0∅�∗1+
Here, T is equal with the reduced stiffness matrix ( [ ] [ ][ ][ ]∗= TKTKt
R ). For the
implementation the proposed technique, initially extracted from ANSYS software
the mass and stiffness matrices under substructure analysis. Then, is done in
MATLAB software all calculations including; the calculated frequencies and
displacement and eigenvalues vectors, select the master degrees of freedom,
calculating the transformation matrix, formation and solving the Eq. (9). Thus,
while applying the proposed method, the only source of errors Source from ∗T ,
assuming that ( )miΦ (measured only at the master coordinates) has been a noise-free
measurement. Because ∗T is unknown originally, an iterative procedure to have
TT =∗ as its first iteration is proposed.
2.2. Selections of Slave Degrees of Freedom Based on the Dynamic Sensitivity Analysis
302 A. Mojtahedi
Journal of Engineering Science and Technology February 2016, Vol. 11(2)
Sensitivity analysis allows one to evaluate the impact that changes in a certain
parameter will have on the structural responses and also it can help the analyser to
identify which parameters are the key drivers of a model’s results. In this study,
spectrum analysis with Single-Point Response Spectrum was used for the
sensitivity analysis.
For single-point response spectrum analysis and dynamic design analysis
method, the structure is excited by a spectrum of known direction and frequency
components, acting uniformly on all support points or on specified unsupported
master degrees of freedom. The general process for performing a single-point
response spectrum analysis consists of six primary steps. These are consisting of
building the model, obtaining the modal solution, obtaining the spectrum solution,
expanding the modes, combining the Modes, and reviewing the results.
It must be attending that only the linear behaviour is valid in a spectrum
analysis. For this study, the tower model was excited in the range of first mode
in the vertical direction. As a result, seismic displacement in the form of
equivalent nodal stress was checked as response of the tower. ANSYS offers
five different mode combination methods for the single-point response
spectrum analysis. Here, the Square Root of Sum of Squares (SRSS) method
was applied for the prepared model.
3. Modal analysis and FE model updating based on the modal
assurance criterion
Experimental modal analysis is known simply as a process for describing a
structure in terms of its dynamic properties. The methods can be classified into
Operational Modal Analysis and the Experimental Modal Analysis [13, 14].
When the numerically and experimentally identified dynamic characteristics are
compared to each other, some differences between numerical and experimental
are found due to various types of uncertainties in the finite element model which
can produce the false alarms (in a finite element model updating process for the
damage detection purposes, the final experimental modal results are far more
acceptable and considered as the objective if the experimental modal analysis was
performed satisfactory and the good measurements were obtained). In the
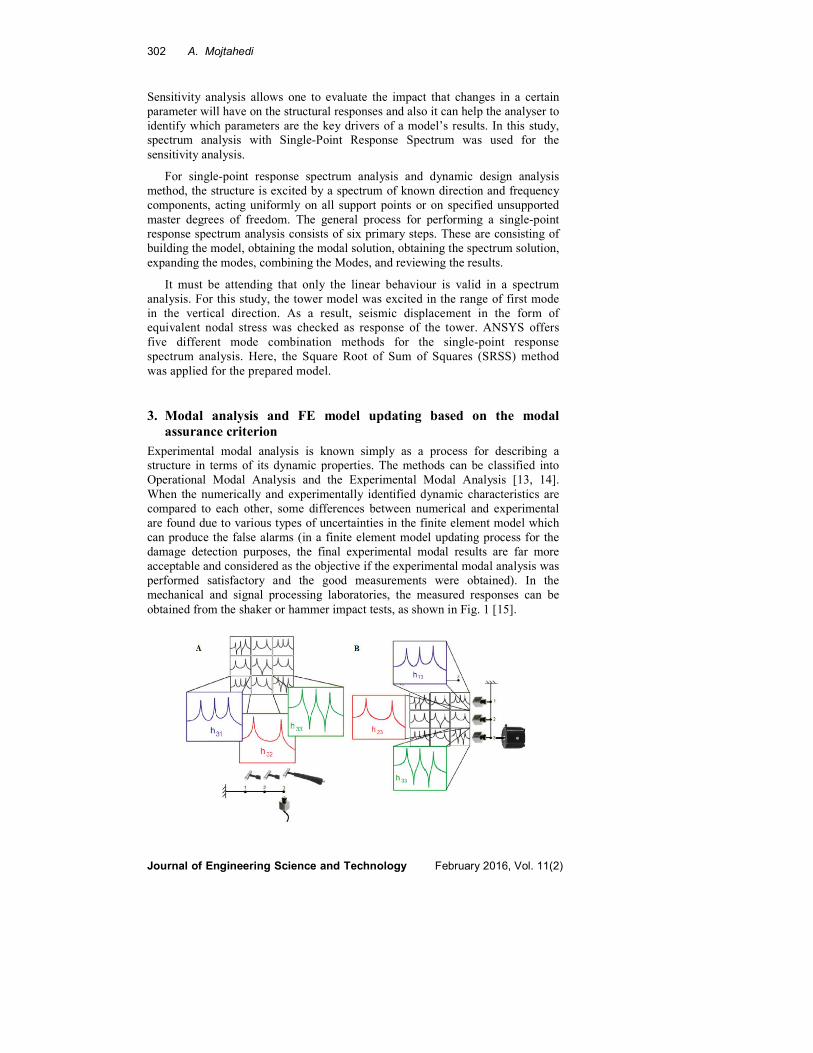
mechanical and signal processing laboratories, the measured responses can be
obtained from the shaker or hammer impact tests, as shown in Fig. 1 [15].
Effective Sensor Clustering for Online Monitoring in Transmission Towers 303
Journal of Engineering Science and Technology February 2016, Vol. 11(2)
Fig. 1. Experimental modal analysis;
A) moving impact test, B) moving response test [12].
The ANSYS FE package was employed to obtain the numerical modal
parameters. The Young’s modulus, Poisson ratio and density were 200 GPa,
0.3 and 7850 kg/m3 respectively. The updating of the initial finite element
model is necessary to minimize the numerical model error according to the
experimental signatures. The concepts of the “Modal Assurance Criterion”
method can be explained as follows: Eq. (26) defines a vector of parameters
related to modal properties:
2 = 32�…256 (26)
The parameters in the above equations are defined below:
2� =788988:
...<=>=�?... @88A88B
, 25 =7898:
...�C�... @8A8B
and �C� = ' 0D�ED>1F0D�ED�10DGED>1, (27)
where H and I are theJ�K Eigenvalue and mode shape, respectively, and the
subscripts L and M denote the analytical and corresponding experimental values.
Using the first-order Taylor‘s series, gives: 2� = 2N + O∆Q + � (28)
where 2� and 2N are the experimental and analytical function vectors, $ is the
design sensitivity matrix of 2N , Q∆Q are the changes in Q for the least squares
minimization, and � is a residual vector. The least squares solution for ∆Q to
minimize �R� is: ∆Q = ORO!"�OR∆2 = ORO!"�OR 2� − 2N! = ORO!"�OR S1U − 2N! (29)
where the design sensitivity matrix modal functions of the Eigenvalue and the
Eigenvector can define as follows:
O = VWXY>WZ…WXF>WZ[ = VW#=> =�\ &WZ…W#]^_&WZ
[ (30)
The Eq. (27) is rearranged as follow:
�C� = ' 0D�ED>1F0D�ED�10D>ED>1, ≡ <ab? (31)
where c ≡ I�RIN!5..Lde..f ≡ I�RI�! INRIN! . If the MAC with value of 1
indicates perfect correlation, then the partial derivative of �C� with respect to
the design variable Qg can be written as follow:
304 A. Mojtahedi
Journal of Engineering Science and Technology February 2016, Vol. 11(2)
W]^_GWZh = bGijGikh"aGilGikhbGF
WaGWZh = W0D�ED>1GFWZh = 2 I�RIN! nI�R WD>WDho (32)
WbGWZh = I�RI�! nWD>EWZh IN + INR WD>WZho = 2 I�RI�! nINR WD>WDho
Description of the physical model and test setup
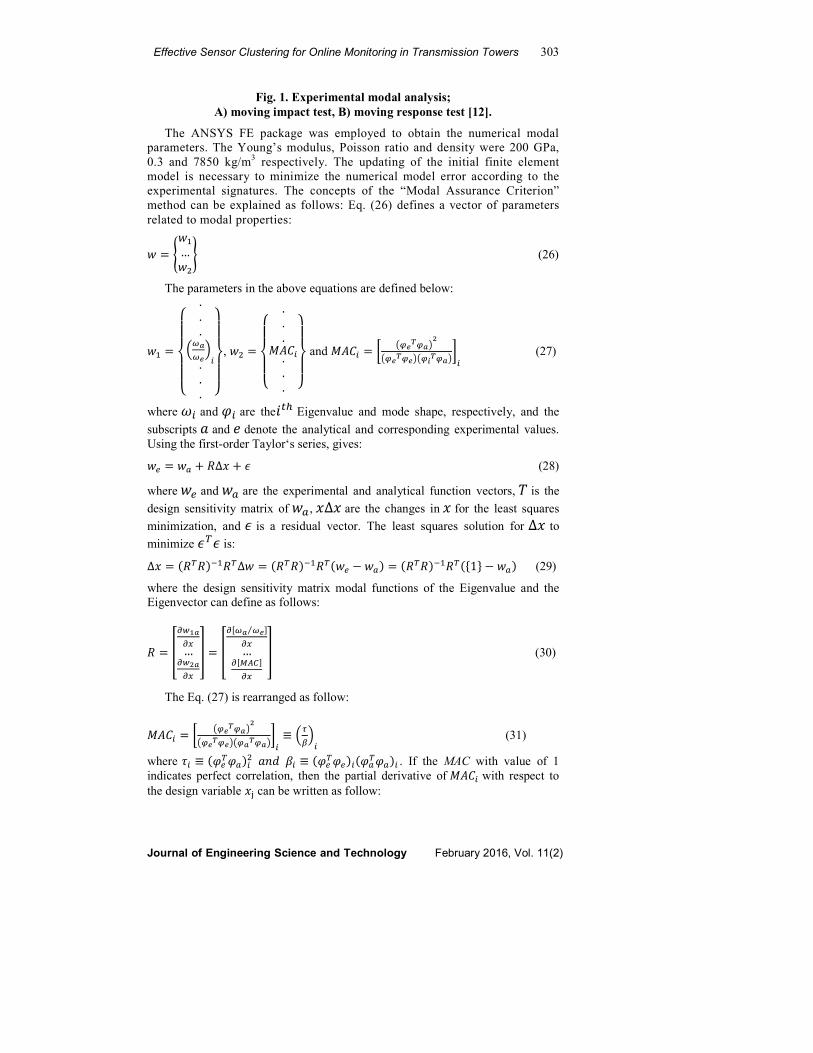
For the sake of validation of the methods described above, experimental modal
tests were performed on a physical model. The general shape of the model is
shown in Fig. 2(a).
Fig. 2. The physical model description,
(a) general view, (b) Facilities for damage simulation.
The replaceable diagonal bracings were attached separately at the joints of the
each space frame spans as illustrated in Fig. 2(b). The external white noise
excitation signals were produced by an electro dynamic exciter (type 4809) with a
force sensor (AC20, APTech) driven by a power amplifier (model 2706), all made
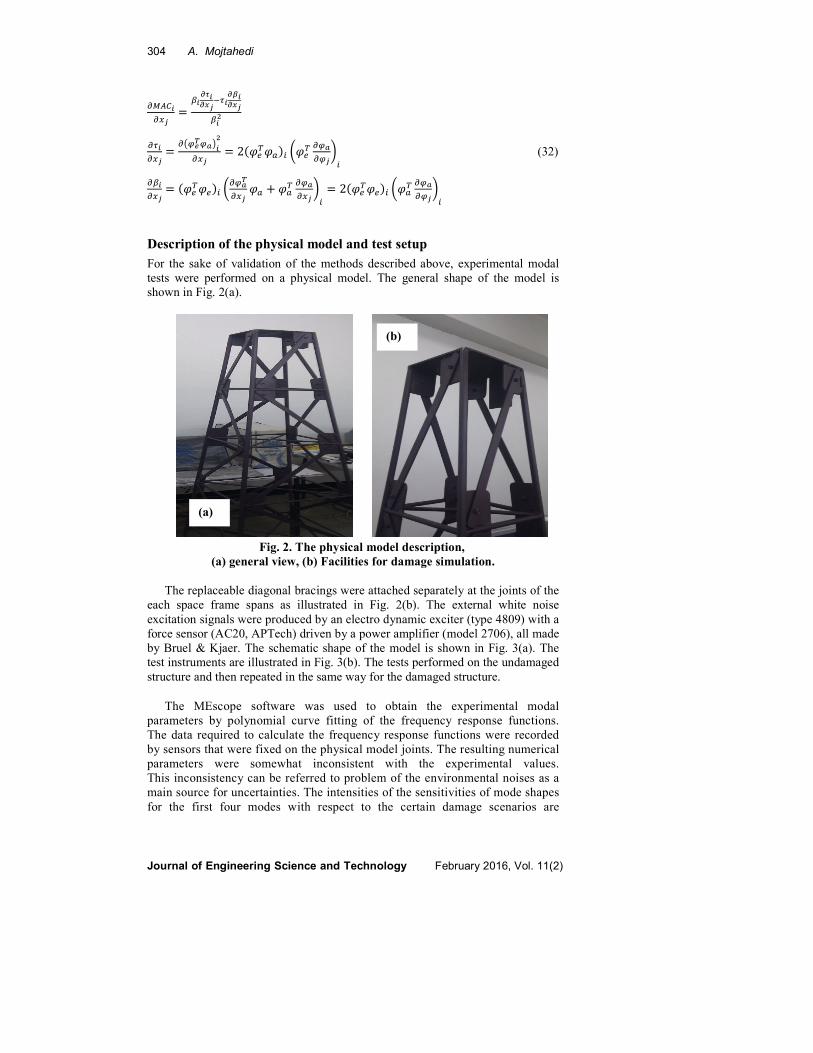
by Bruel & Kjaer. The schematic shape of the model is shown in Fig. 3(a). The
test instruments are illustrated in Fig. 3(b). The tests performed on the undamaged
structure and then repeated in the same way for the damaged structure.
The MEscope software was used to obtain the experimental modal
parameters by polynomial curve fitting of the frequency response functions.
The data required to calculate the frequency response functions were recorded
by sensors that were fixed on the physical model joints. The resulting numerical
parameters were somewhat inconsistent with the experimental values.
This inconsistency can be referred to problem of the environmental noises as a
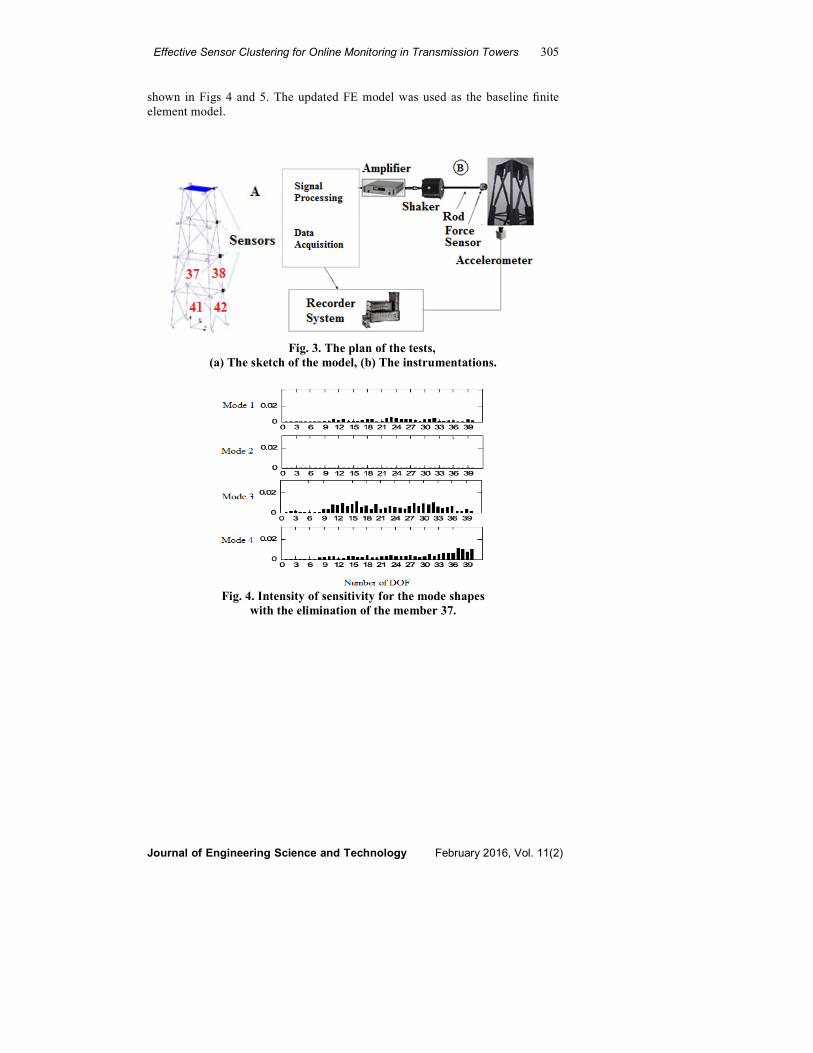
main source for uncertainties. The intensities of the sensitivities of mode shapes
for the first four modes with respect to the certain damage scenarios are
(a)
(b)
Effective Sensor Clustering for Online Monitoring in Transmission Towers 305
Journal of Engineering Science and Technology February 2016, Vol. 11(2)
shown in Figs 4 and 5. The updated FE model was used as the baseline finite
element model.
Fig. 3. The plan of the tests,
(a) The sketch of the model, (b) The instrumentations.
Fig. 4. Intensity of sensitivity for the mode shapes
with the elimination of the member 37.
306 A. Mojtahedi
Journal of Engineering Science and Technology February 2016, Vol. 11(2)
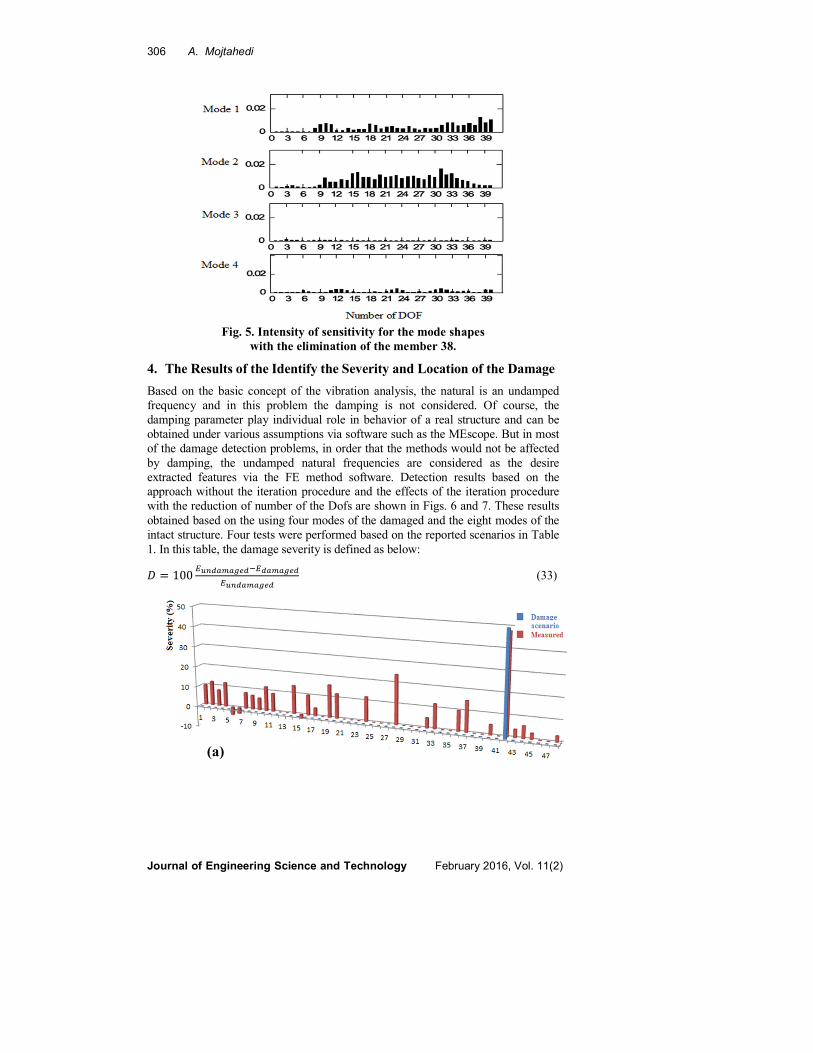
Fig. 5. Intensity of sensitivity for the mode shapes
with the elimination of the member 38.
4. The Results of the Identify the Severity and Location of the Damage
Based on the basic concept of the vibration analysis, the natural is an undamped
frequency and in this problem the damping is not considered. Of course, the
damping parameter play individual role in behavior of a real structure and can be
obtained under various assumptions via software such as the MEscope. But in most
of the damage detection problems, in order that the methods would not be affected
by damping, the undamped natural frequencies are considered as the desire
extracted features via the FE method software. Detection results based on the
approach without the iteration procedure and the effects of the iteration procedure
with the reduction of number of the Dofs are shown in Figs. 6 and 7. These results
obtained based on the using four modes of the damaged and the eight modes of the
intact structure. Four tests were performed based on the reported scenarios in Table
1. In this table, the damage severity is defined as below: � = 100 pqrs>t>u�s"ps>t>u�spqrs>t>u�s (33)
(a)
Effective Sensor Clustering for Online Monitoring in Transmission Towers 307
Journal of Engineering Science and Technology February 2016, Vol. 11(2)
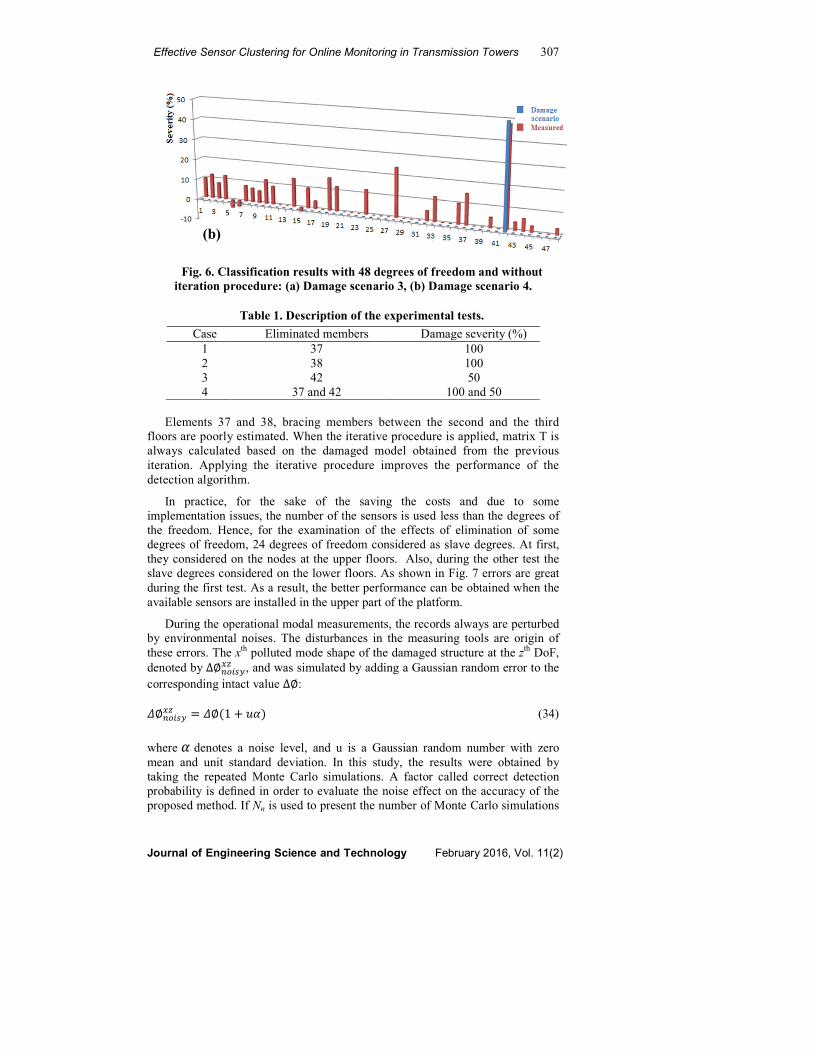
Fig. 6. Classification results with 48 degrees of freedom and without
iteration procedure: (a) Damage scenario 3, (b) Damage scenario 4.
Table 1. Description of the experimental tests.
Case Eliminated members Damage severity (%)
1 37 100
2 38 100
3 42 50
4 37 and 42 100 and 50
Elements 37 and 38, bracing members between the second and the third
floors are poorly estimated. When the iterative procedure is applied, matrix T is
always calculated based on the damaged model obtained from the previous
iteration. Applying the iterative procedure improves the performance of the
detection algorithm.
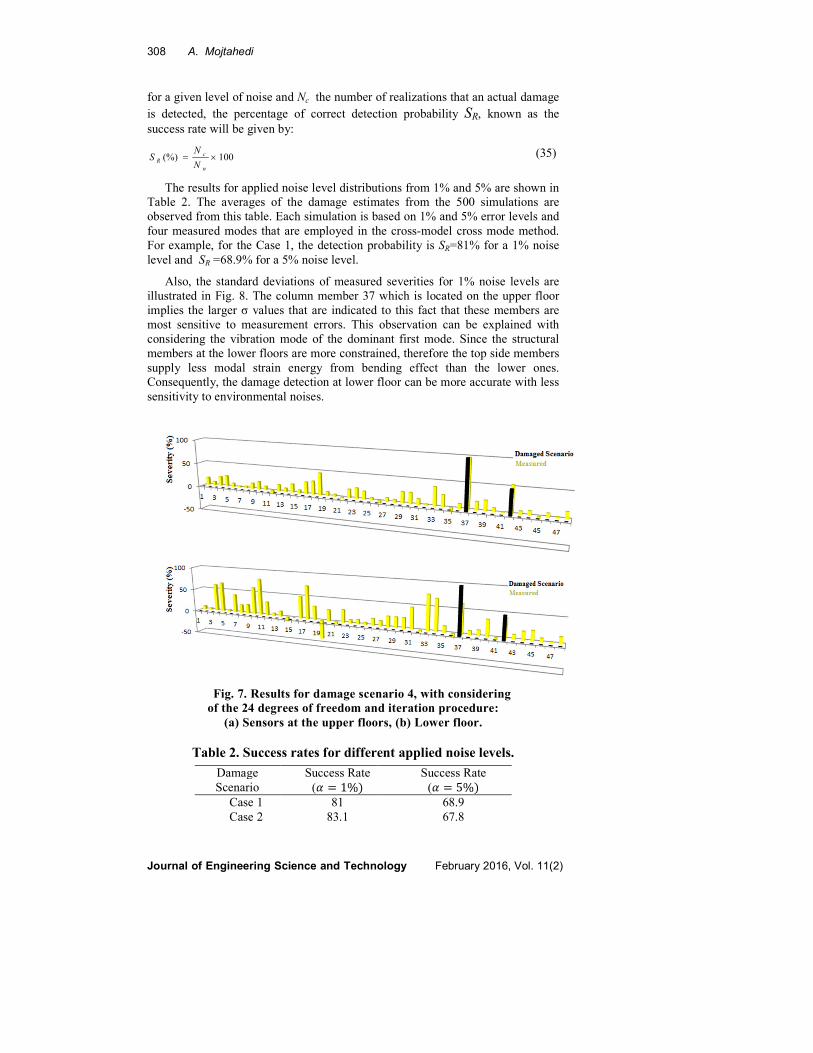
In practice, for the sake of the saving the costs and due to some
implementation issues, the number of the sensors is used less than the degrees of
the freedom. Hence, for the examination of the effects of elimination of some
degrees of freedom, 24 degrees of freedom considered as slave degrees. At first,
they considered on the nodes at the upper floors. Also, during the other test the
slave degrees considered on the lower floors. As shown in Fig. 7 errors are great
during the first test. As a result, the better performance can be obtained when the
available sensors are installed in the upper part of the platform.
During the operational modal measurements, the records always are perturbed
by environmental noises. The disturbances in the measuring tools are origin of
these errors. The xth
polluted mode shape of the damaged structure at the zth
DoF,
denoted by ∆∅�v%wZx , and was simulated by adding a Gaussian random error to the
corresponding intact value ∆∅:
y∅�v%wZx = y∅ 1 + z ! (34)
where denotes a noise level, and u is a Gaussian random number with zero
mean and unit standard deviation. In this study, the results were obtained by
taking the repeated Monte Carlo simulations. A factor called correct detection
probability is defined in order to evaluate the noise effect on the accuracy of the
proposed method. If Nn is used to present the number of Monte Carlo simulations
(b)
308 A. Mojtahedi
Journal of Engineering Science and Technology February 2016, Vol. 11(2)
for a given level of noise and Nc the number of realizations that an actual damage
is detected, the percentage of correct detection probability SR, known as the
success rate will be given by:
100(%) ×=n
cR
N
NS (35)
The results for applied noise level distributions from 1% and 5% are shown in
Table 2. The averages of the damage estimates from the 500 simulations are
observed from this table. Each simulation is based on 1% and 5% error levels and
four measured modes that are employed in the cross-model cross mode method.
For example, for the Case 1, the detection probability is SR=81% for a 1% noise
level and SR =68.9% for a 5% noise level.
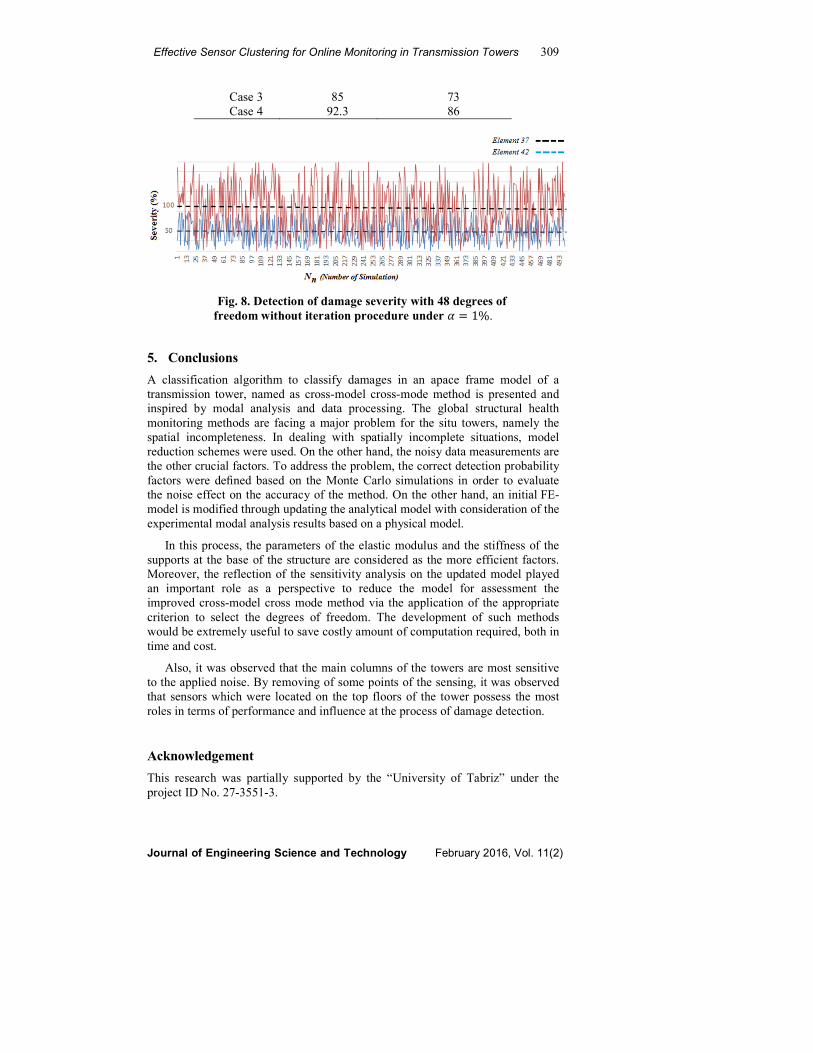
Also, the standard deviations of measured severities for 1% noise levels are
illustrated in Fig. 8. The column member 37 which is located on the upper floor
implies the larger σ values that are indicated to this fact that these members are
most sensitive to measurement errors. This observation can be explained with
considering the vibration mode of the dominant first mode. Since the structural
members at the lower floors are more constrained, therefore the top side members
supply less modal strain energy from bending effect than the lower ones.
Consequently, the damage detection at lower floor can be more accurate with less
sensitivity to environmental noises.
Fig. 7. Results for damage scenario 4, with considering
of the 24 degrees of freedom and iteration procedure:
(a) Sensors at the upper floors, (b) Lower floor.
Table 2. Success rates for different applied noise levels.
Damage
Scenario
Success Rate
( = 1{!
Success Rate
( = |{!
Case 1 81 68.9
Case 2 83.1 67.8
Effective Sensor Clustering for Online Monitoring in Transmission Towers 309
Journal of Engineering Science and Technology February 2016, Vol. 11(2)
Case 3 85 73
Case 4 92.3 86
Fig. 8. Detection of damage severity with 48 degrees of
freedom without iteration procedure under = 1{.
5. Conclusions
A classification algorithm to classify damages in an apace frame model of a
transmission tower, named as cross-model cross-mode method is presented and
inspired by modal analysis and data processing. The global structural health
monitoring methods are facing a major problem for the situ towers, namely the
spatial incompleteness. In dealing with spatially incomplete situations, model
reduction schemes were used. On the other hand, the noisy data measurements are
the other crucial factors. To address the problem, the correct detection probability
factors were defined based on the Monte Carlo simulations in order to evaluate
the noise effect on the accuracy of the method. On the other hand, an initial FE-
model is modified through updating the analytical model with consideration of the
experimental modal analysis results based on a physical model.
In this process, the parameters of the elastic modulus and the stiffness of the
supports at the base of the structure are considered as the more efficient factors.
Moreover, the reflection of the sensitivity analysis on the updated model played
an important role as a perspective to reduce the model for assessment the
improved cross-model cross mode method via the application of the appropriate
criterion to select the degrees of freedom. The development of such methods
would be extremely useful to save costly amount of computation required, both in
time and cost.
Also, it was observed that the main columns of the towers are most sensitive
to the applied noise. By removing of some points of the sensing, it was observed
that sensors which were located on the top floors of the tower possess the most
roles in terms of performance and influence at the process of damage detection.
Acknowledgement
This research was partially supported by the “University of Tabriz” under the
project ID No. 27-3551-3.

310 A. Mojtahedi
Journal of Engineering Science and Technology February 2016, Vol. 11(2)
References
1. Doebling, S.W.; Farrar, C.R.; and Prime, M.B. (1998). A summary review of
vibration based damage identification methods. Journal of Shock and
Vibration, 30(2), 91-105.
2. Uhl, T. (2012). Structural health monitoring II. Selected, peer reviewed
papers from the Second International Conference on Smart Diagnostics of
Structures, Cracow, Poland. (1st Ed.), Trans Tech Publications Ltd.
3. Wang, M.L.; Lynch, J.P.; and Sohn, H. (2014). Sensor technology for civil
infrastructures, Vol. 2 applications in structural health monitoring. Elsevier
Ltd. Woodhead Publishing Series in Electronic and Optical Materials.
4. Lam, H.-F.; and Yin, T. (2011). Dynamic reduction-based structural damage
detection of transmission towers: Practical issues and experimental
verification. Journal of Engineering Structures, 33(5), 1459-1478.
5. Ewins, D.J. (2000). Modal testing: Theory, practice and application. (2nd
Ed.) Research Studies Press Ltd.
6. Farrar, C.R.; and Worden, K. (2007). An introduction to structural health
monitoring. Philosophical Transactions of the Royal Society, 365, 303-315.
7. Fu, Z.-F.; and He, J. (2001). Modal analysis. (1st Ed.) Butterworth-
Heinemann, Oxford.
8. Tshilidzi, M. (2010). Finite element model updating using computational
intelligence techniques, applications to structural dynamics. Springer-
Verlag London.
9. Hu, S.-L.J.; Li, H.; and Wang, S. (2007). Cross-model cross-mode method for
model updating. Mechanical Systems and Signal Processing, 21(4), 1690-1703.
10. Hutton, D.V. (2004). Fundamentals of finite element analysis. (1st Ed.),
McGraw-Hill, New York.
11. Guyan, R.J. (1965). Reduction of stiffness and mass matrices. AIAA Journal,
3(2), 380-380.
12. Rytter, A. (1993). Vibration based inspection of civil engineering structures.
PhD dissertation, Aalborg University, Denmark.
13. Wang, S. (2013). Iterative modal strain energy method for damage severity
estimation using frequency measurements. Structural Control and Health
Monitoring, 20(2), 230-240.
14. Li, H.; Wang, J.; Zhang, M. and Hu S.-L.J. (2006). Damage detection in offshore
jacket structures by cross-model cross-mode method. Proceedings of the 7th
International Conference on Hydrodynamics, Naples, Italy, 171-178.
15. Beena, P.; and Ganguli, R. (2011). Structural damage detection using fuzzy
cognitive maps and Hebbian learning. Applied Soft Computing, 11(1),
1014-1020.


