
International Journal of
Advances in Scientific Research and Engineering (ijasre)
E-ISSN : 2454-8006
DOI: 10.31695/IJASRE.2020.33916
Volume 6, Issue 10
October - 2020
www.ijasre.net Page 126
Licensed Under Creative Commons Attribution CC BY-NC * C. Author: [email protected]
Effects of Corporate Social Responsibility and Managerial
Ownership on Corporate Value (Evidence from Consumer Goods Companies Listed on Indonesian Stock Exchange
during 2015-2019)
Indrayati1
1Accounting Department
State Polytechnic of Malang, Indonesia
ABSTRACT
Abstract: This research aimed to determine the effect of Corporate Social Responsibility and Managerial Ownership on Corporate
Valuessimultaneously or partially. Data were collected using a purposive sampling method on manufacturing companies in the
consumer goods industry sectorlisted on the IDX during 2015-2019. The population covered 34 companies, 24 of which were
chosen as the samples due to meeting the specified criteria. Corporate Social Responsibility in this research was calculated by
Corporate Social Disclosure Index while management ownership was obtained by knowing the percentage of share ownership by
boards of managers. Corporate values in this research were calculated by the value of Tobin's Q. The results of this research
indicate that Corporate Social Responsibility and Management Ownership simultaneously did not affect corporate values.
However, partially, Corporate Social Responsibility had a positive effect on corporate values while managerial ownership did not
affect corporate values.
Keywords: Corporate Social Responsibility, Managerial Ownership, Corporate Value.
1. INTRODUCTION
As many companies are continuously growing, social inequality and surrounding environmental damage are also likely to
occur. Therefore, efforts are made to reduce negative impacts. Many companies are now developing what is called Corporate
Social Responsibility (CSR).
Currently, Corporate Social Responsibility is no longer only voluntary or commitmentbut also an obligation in being
responsible for the activities carried out by companies. Corporate Social Responsibility is often considered as the core of business
ethics, meaning that companies do not have economic and legal obligations to shareholders only but also to other stakeholders.
Corporate Social Responsibility refers to all relationships occurring between a company and its stakeholders, including
customers, employees, communities, owners or investors, government, suppliers and even competitors. The Global Impact
Initiative (2002) states, “This understanding uses the 3Ps (profit, people, planet), in which the business goals are not only about
profit but also the welfare of the people and the sustainability of the life of this planet. Development of social programs can be in
the form of physical, health services, community development, scholarships and so on. The objectives of this research are as
follows:
a. To determine the effect of Corporate Social Responsibility on Corporate Value
b. To determine the effect of Managerial Ownership on Corporate Value
c. To determine the simultaneous effect of Corporate Social Responsibility and Managerial Ownership on Corporate Value
2. LITERATURE REVIEW
Corporate Value
Corporate value in this research is defined as market value. Corporate value can provide shareholders with prosperity if
the company’s share price increases. The higher the share price, the higher the level of the shareholder’s prosperity. To achieve
International Journal of Advances in Scientific Research and Engineering (ijasre), Vol 6 (10), October -2020
www.ijasre.net Page 127
DOI: 10.31695/IJASRE.2020.33916
corporate values, investors generally hand management over the professionals. Professionals can be positioned as managers or
commissioners Nurlela and Islahuddin [1]
The objective of financial management is to maximize corporate values. If a company’s finance is smooth, the value of the
company’s share price will increase while the value of the company’s debt in the form of bonds will not be affected at all. In
conclusion, the value of share ownership can be a measuring tool for the level of company effectiveness . Therefore, as said
earlier, financial management aims to maximize the value of corporate share ownership or maximize share prices. Maximizing
share prices is meaningless if managers increase share prices by victimizing the bondholders.
Good corporate values can be reflected in corporate good performance and share values. If the share values are high, the
corporate values are also considered good. Because the main goal of companies is to increase corporate values by increasing the
prosperity of the owners or shareholders.
One of the alternatives used in assessing corporate values is to use Tobin’s Q, which was developed by Tobin [2]. This
ratio is a concept representing current financial market estimates of the return on each dollar of incremental investment.
If the Q ratio reaches > 1, it indicates that the investment in assets generates returns providing higher value than
investment expenditure, triggering new investment. Meanwhile, if the Q ratio is < 1, the investment in assets is not appealing
Herawaty [3]
The Q ratio is a studied measure of how effectively management uses economic resources in its power. A study
conducted by Copeland [4] , cited by Darmawati [5] in Herawati [3], shows how the Q ratio can be applied to each company.
They found that several companies were able to maintain a Q ratio of > 1. The economic theory states that a Q ratio of > 1 will
attract new flows of resources and competition until the Q ratio is close to 1.
Corporate Social Responsibility
According to the CSR Forum, Corporate Social Responsibility means open and transparent business practices based on
ethical values and respect for employees, communities and the environment. Meanwhile, based on the ISO (Internal Organization
for Standardization) 26000 , Corporate Social Responsibility is an organization’s responsibility for the impact of its decisions and
activities on society and the environment through transparent and ethical behavior, which is:
1. Consistent with sustainable development and community welfare
2. Paying attention to the interest of stakeholders
3. Following applicable law and international norms
4. Integrated into all organizational activities, in the sense covering both product and service activities
The business activities carried out by companies, in addition to having positive impacts, can also cause negative impacts.
Some definitions of Corporate Social Responsibility have emphasized on the efforts to reduce negative impacts and maximize
positive impacts. As explained by Lingkar Studi CSR, Corporate Social Responsibility is a genuine effort by a business entity to
minimize negative impacts and maximize positive impacts of the business operation on all economic, social and environmental
stakeholders for sustainable development.
Corporate Social Responsibility is a mechanism for an organization to voluntarily integrate environmental and social
concerns into its operations and interactions with stakeholders, beyond its legal responsibilities Anggraini [6].
Disclosure of social responsibility, commonly known as Sustainability Reporting, is significant. Sustainability Reporting
is reporting on economic, environmental and social policies, the effects and performance of the organization and its products in
the context of sustainable development. Sustainability Reporting includes the report of the organizational economy, environment
and the performance effect on organizational performance Anggraini [6]. Sustainability Reporting must be a high-level strategic
document placing issues, challenges and opportunities towards the core business and its industrial sector.
The Objectives and Benefits of Implementing Corporate Social Responsibility
The objectives of implementing Corporate Social Responsibility include:
1. To disclose the social benefits generated by companies
2. To show the social damage caused by companies
3. To change corporate behavior to be better
The benefits of implementing Corporate Social Responsibility are as follows:
1. Companies are easier to get access to capital.
2. Companies can grow and be sustainable as well as get a positive image from the wide-community.
3. Companies can maintain their qualified human resources.
4. Companies can improve decision making on critical matters and facilitate risk management
.
International Journal of Advances in Scientific Research and Engineering (ijasre), Vol 6 (10), October -2020
www.ijasre.net Page 128
DOI: 10.31695/IJASRE.2020.33916
In conclusion, Corporate Social Responsibility is considered as one of the future investments for a company. The capital
owner's interest in investing in companies that have implemented Corporate Social Responsibility is higher than in those that have
not implemented Corporate Social Responsibility Sugiono [7]
Principles of Corporate Social Responsibility
According to Aaker [8] the principles of corporate social responsibility are generally divided into three as follows:
1. Sustainability is related to how companies keep considering the sustainability of future resources in every activity carried
out
2. Accountability refers to the company's efforts to be open and responsible for the activity carried out. It is highly necessary
when there is an activity influencing and being affected by external parties.
3. Transparencyis an important principle, especially for external parties. Transparency is concerned with reporting corporate
activities and their impacts on external parties, which is beneficial in reducing misunderstanding of information particularly
on the responsibility for various environmental impacts.
Reporting on Corporate Social Responsibility Activities
The implementation of Corporate Social Responsibility activities has now commonly been disclosed in a report called
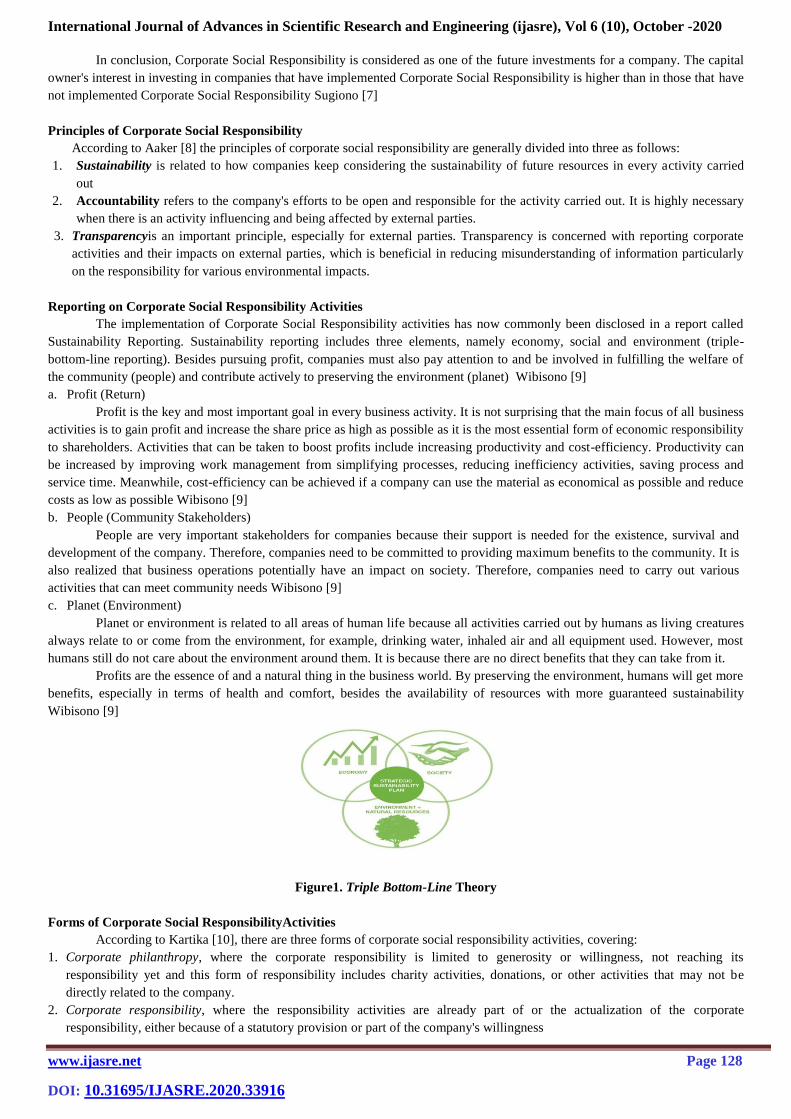
Sustainability Reporting. Sustainability reporting includes three elements, namely economy, social and environment (triple-
bottom-line reporting). Besides pursuing profit, companies must also pay attention to and be involved in fulfilling the welfare of
the community (people) and contribute actively to preserving the environment (planet) Wibisono [9]
a. Profit (Return)
Profit is the key and most important goal in every business activity. It is not surprising that the main focus of all business
activities is to gain profit and increase the share price as high as possible as it is the most essential form of economic responsibility
to shareholders. Activities that can be taken to boost profits include increasing productivity and cost-efficiency. Productivity can
be increased by improving work management from simplifying processes, reducing inefficiency activities, saving process and
service time. Meanwhile, cost-efficiency can be achieved if a company can use the material as economical as possible and reduce
costs as low as possible Wibisono [9]
b. People (Community Stakeholders)
People are very important stakeholders for companies because their support is needed for the existence, survival and
development of the company. Therefore, companies need to be committed to providing maximum benefits to the community. It is
also realized that business operations potentially have an impact on society. Therefore, companies need to carry out various
activities that can meet community needs Wibisono [9]
c. Planet (Environment)
Planet or environment is related to all areas of human life because all activities carried out by humans as living creatures
always relate to or come from the environment, for example, drinking water, inhaled air and all equipment used. However, most
humans still do not care about the environment around them. It is because there are no direct benefits that they can take from it.
Profits are the essence of and a natural thing in the business world. By preserving the environment, humans will get more
benefits, especially in terms of health and comfort, besides the availability of resources with more guaranteed sustainability
Wibisono [9]
Figure1. Triple Bottom-Line Theory
Forms of Corporate Social ResponsibilityActivities
According to Kartika [10], there are three forms of corporate social responsibility activities, covering:
1. Corporate philanthropy, where the corporate responsibility is limited to generosity or willingness, not reaching its
responsibility yet and this form of responsibility includes charity activities, donations, or other activities that may not be
directly related to the company.
2. Corporate responsibility, where the responsibility activities are already part of or the actualization of the corporate
responsibility, either because of a statutory provision or part of the company's willingness

International Journal of Advances in Scientific Research and Engineering (ijasre), Vol 6 (10), October -2020
www.ijasre.net Page 129
DOI: 10.31695/IJASRE.2020.33916
3. Corporate policy, where corporate responsibility is part of the policy
Managerial Ownership
Wahidawati [11], Junaidi [12] stated that managerial ownership is the percentage of share ownership by directors,
managers, and the board of commissioners. The presence of managerial ownership in a company will lead to an interesting
assumption that the corporate value will increase as a result of increased managerial ownership.
Jensen & Meckling [13] analyzed how corporate values are affected by the distribution of ownership between managers
who enjoy benefits and outsiders who do not. In this framework, increased managerial ownership will reduce agency difficulties
by reducing incentives to get benefits and take over shareholder wealth. This reduction is very potential in the location of
resources, which in turn increases corporate values.
3.METHOD
Object of Research
The object of this research consisted of manufacturing companies in the sector of Consumer Goods industries listed on
the Indonesia Stock Exchange (IDX) in the 2015-2019 period. Companies listed on the IDX were grouped into five sector
subsections, including:
a. Food and Beverage Sub Sector
b. Cigarette Sub Sector
c. Pharmaceutical Sub Sector
d. Cosmetics and Household Necessities Sub Sector
e. Household Appliances Sub Sector
Types of Data Required
The type of data used in this research is secondary data. The secondary data in this research were obtained from the
Indonesia Stock Exchange. The data used in this research were in the form of Annual Reports of companies listed on the
Indonesia Stock Exchange during 2015-2019.
Data Collection Technique
Data in this research were collected bytracing annual reports and sustainability reports or corporate social information
selected as samples. This research also used instruments in the form of a checklist or a list of questions containing items of social
responsibility disclosure.
Population and Samples
The population in this research covered all manufacturing companies listed on the Indonesia Stock Exchange (IDX) that
disclose Corporate Social Responsibility activities and implement them within the company.
Meanwhile, the samples selected were manufacturing companies in the consumer goods industry sector listed on the
Indonesia Stock Exchange (IDX) during 2015-2019 which did not experience delisting and disclosed their Corporate Social
Responsibility activities. The sampling criteria are as follows:
a. Manufacturing companies in the Consumer Goods Industry sector listed on the IDX during 2015-2019
b. The companies did not experience delisting during 2015-2019
c. The companies presented annual reports during 2015-2019
d. The companies presented the data needed in this research
Research Variables and Operational Definitions
There are three variables used in this research, including:
Independent Variable
Corporate Social Responsibility
Corporate Social Responsibility symbolized (X1), based on the ISO 26000:2010 standard, includes 7 core subjects of
disclosure (www.CSRIndonesia.com) as follows:
1. Organizational Governance
Organizational Governance is a system created and implemented by an organization in achieving its goals by applying
the following principles and preamble of Corporate Social Responsibility:
a) Accountability
b) Transparency
c) Ethical Conduct
International Journal of Advances in Scientific Research and Engineering (ijasre), Vol 6 (10), October -2020
www.ijasre.net Page 130
DOI: 10.31695/IJASRE.2020.33916
d) Respect for the interests of stakeholders and legal compliance
All of these must be included in the company’s decision making.
2. Human Rights
The aspect of human rights referred to in this research includes as follows:
a) In-depth research
b) Conditions posing Human Right risks
c) Avoidance of violations
d) Resolution of complaints
e) Discrimination and vulnerable
f) Civil and political rights
g) Economic, social and cultural rights
h) Fundamental labor rights
3. Employment Practices
The aspect of employment practices in this research includes as follows:
a) Work and employment relations
b) Conditions of work and social security
c) Employment dialogue
d) Occupational health and safety
e) Human resources development and training
4. Environment
The aspect of the environment in this research includes as follows:
a) Pollution prevention
b) Sustainable use of resources
c) Adaptation to climate change
d) Protection of the environment and biodiversity and habitat restoration
5. Fair Operating Practices
The aspect of fair operating practices in this research includes as follows:
a) Anti-corruption
b) Responsible involvement in the political landscape
c) Fair competition
d) Promotion of Social Responsibility
e) Respect for copyright
6. Consumer Issues
The aspect of consumer issues in this research includes as follows:
a) Fair marketing
b) Maintenance of consumer health and safety
c) Sustainable consumption
d) Service and support to consumer
e) Protection and privacy of consumer data
f) Access to essential services
g) Education and awareness
7. Community Involvement and Development
The aspect of community involvement and development in this research include as follows:
a) Community involvement
b) Education and culture
c) Job creation and skill improvement
d) Development and access to technology
e) Prosperity and increased income
f) Health
g) Investment
International Journal of Advances in Scientific Research and Engineering (ijasre), Vol 6 (10), October -2020
www.ijasre.net Page 131
DOI: 10.31695/IJASRE.2020.33916
2. Steps for Disclosure of Corporate Social Responsibility
Considering that there are still a few of Indonesia's companies reporting these seven aspects in the form of sustainability
reporting, this research was limited to only involving the data contained in the company's annual report. This was to avoid the
emergence of gaps between companies that have and have not made sustainability reporting Raja [14].
a. Providing Corporate Social Responsibility Index Score
In this research, the Corporate Social Responsibility using an index by tracing the company’s annual report would be
scored as follows:
Score 0: If the company does not disclose the item on the questionnaire
Score 1: If the company discloses the item on the questionnaire
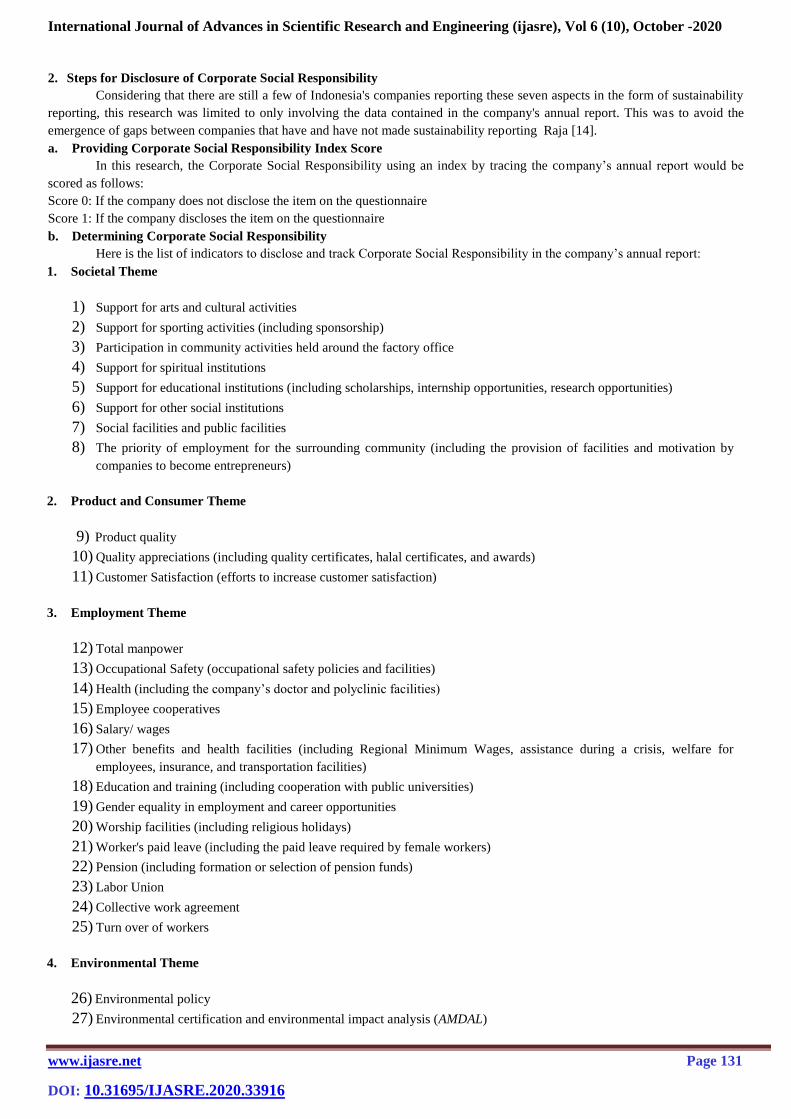
b. Determining Corporate Social Responsibility
Here is the list of indicators to disclose and track Corporate Social Responsibility in the company’s annual report:
1. Societal Theme
1) Support for arts and cultural activities
2) Support for sporting activities (including sponsorship)
3) Participation in community activities held around the factory office
4) Support for spiritual institutions
5) Support for educational institutions (including scholarships, internship opportunities, research opportunities)
6) Support for other social institutions
7) Social facilities and public facilities
8) The priority of employment for the surrounding community (including the provision of facilities and motivation by
companies to become entrepreneurs)
2. Product and Consumer Theme
9) Product quality
10) Quality appreciations (including quality certificates, halal certificates, and awards)
11) Customer Satisfaction (efforts to increase customer satisfaction)
3. Employment Theme
12) Total manpower
13) Occupational Safety (occupational safety policies and facilities)
14) Health (including the company’s doctor and polyclinic facilities)
15) Employee cooperatives
16) Salary/ wages
17) Other benefits and health facilities (including Regional Minimum Wages, assistance during a crisis, welfare for
employees, insurance, and transportation facilities)
18) Education and training (including cooperation with public universities)
19) Gender equality in employment and career opportunities
20) Worship facilities (including religious holidays)
21) Worker's paid leave (including the paid leave required by female workers)
22) Pension (including formation or selection of pension funds)
23) Labor Union
24) Collective work agreement
25) Turn over of workers
4. Environmental Theme
26) Environmental policy
27) Environmental certification and environmental impact analysis (AMDAL)

International Journal of Advances in Scientific Research and Engineering (ijasre), Vol 6 (10), October -2020
www.ijasre.net Page 132
DOI: 10.31695/IJASRE.2020.33916
28) Rating (including awards in the environmental sector)
29) Energy (including the energy-saving, total energy used, and so on)
30) Pollution prevention/management (including waste management)
31) Support for animal conservation
32) Support for environmental conservation
c. Calculating Corporate Social Disclosure Index
The measurement of the Corporate Social Responsibility variable employed the Corporate Social Disclosure Index
(CSDI). The social disclosure level on the company’s annual report stated in CSDI was assessed by comparing the number of
social disclosures that had been made by the company with the maximum number of social disclosures if all items were met. This
corporate social disclosure index has previously been used by Raja [14].
Zuhroh and Sukmawati [15] explained that the calculation of the social disclosure index can be carried out in the following
steps:
1. Making a social disclosure checklist. The checklist is compiled in the form of a list of disclosure items, each of which is
provided with an answer space to the status of disclosure in the annual report concerned. This social disclosure checklist is
based on the list of items that have been done by the previous study conducted by Sembiring [16]
2. Determining the social disclosure index for each sample company based on the social disclosure checklists using the following
stages:
a. The score obtained by each company is added up to get a total score.
b. The index calculation for each company is done by dividing the total disclosure score of each company by the maximum
disclosure score
Managerial Ownership
Managerial ownership was given the MGR symbol measured by natural logarithms, symbolized by (X2). Management
ownership is the percentage of share ownership by directors, management, commissioners and any parties directly involved in
making corporate decisions Diyah and Widanar [17]. This variable was used to determine the benefits of management ownership
in the agency conflict reduction Haruman [18]. In this research, managerial ownership was measured by the percentage of the
number of shares, in which the proportion of shareholders was from management who actively participate in corporate decision
making (directors and commissioners) Diyah and Widanar [17].
Dependent Variable
Corporate Values
Corporate value symbolized by (Y) was an alternative used to assess the value of the company using Tobin’s Q, a ratio
developed by Tobin [2]. This ratio is a valuable concept because it represents current financial market estimates of the return on
each incremental investment.
If the Q ratio reaches > 1, it indicates that the investment in assets generates returns providing higher value than
investment expenditure, triggering new investment. Meanwhile, if the Q ratio is < 1, the investment in assets is not appealing
Herawaty [3].
The Q ratio is a studied measure of how effectively management uses economic resources in its power. A study
conducted by Copeland [4] cited by Darmawati [5] in Herawati [3], shows how the Q ratio can be applied to each company. They
found that several companies were able to maintain a Q ratio of > 1. The economic theory states that a Q ratio of > 1 will attract
new flows of resources and competition until the Q ratio is close to 1. This variable is given the symbol Q. This variable has been
used by Herawaty [3], Suranta and Pranata [19] and Nurlela and Islahudin [1].
Here is the formula:
Where :
International Journal of Advances in Scientific Research and Engineering (ijasre), Vol 6 (10), October -2020
www.ijasre.net Page 133
DOI: 10.31695/IJASRE.2020.33916
q = Corporate Values
EMV = Equity Market Value (EMV = closing price x number of outstanding shares)
D = Book value of total debt
EBV = Book value of total assets
4. ANALYSIS RESULTS
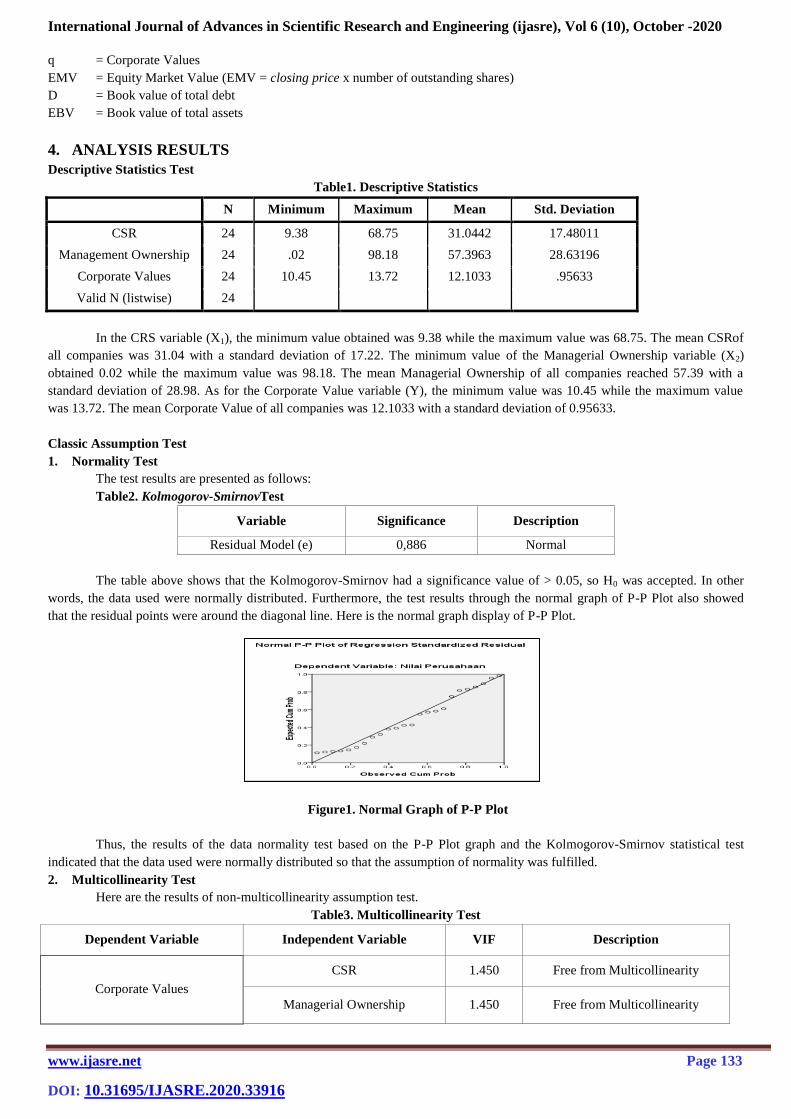
Descriptive Statistics Test
Table1. Descriptive Statistics
N Minimum Maximum Mean Std. Deviation
CSR 24 9.38 68.75 31.0442 17.48011
Management Ownership 24 .02 98.18 57.3963 28.63196
Corporate Values 24 10.45 13.72 12.1033 .95633
Valid N (listwise) 24
In the CRS variable (X1), the minimum value obtained was 9.38 while the maximum value was 68.75. The mean CSRof
all companies was 31.04 with a standard deviation of 17.22. The minimum value of the Managerial Ownership variable (X2)
obtained 0.02 while the maximum value was 98.18. The mean Managerial Ownership of all companies reached 57.39 with a
standard deviation of 28.98. As for the Corporate Value variable (Y), the minimum value was 10.45 while the maximum value
was 13.72. The mean Corporate Value of all companies was 12.1033 with a standard deviation of 0.95633.
Classic Assumption Test
1. Normality Test
The test results are presented as follows:
Table2. Kolmogorov-SmirnovTest
Variable Significance Description
Residual Model (e) 0,886 Normal
The table above shows that the Kolmogorov-Smirnov had a significance value of > 0.05, so H0 was accepted. In other
words, the data used were normally distributed. Furthermore, the test results through the normal graph of P-P Plot also showed
that the residual points were around the diagonal line. Here is the normal graph display of P-P Plot.
Figure1. Normal Graph of P-P Plot
Thus, the results of the data normality test based on the P-P Plot graph and the Kolmogorov-Smirnov statistical test
indicated that the data used were normally distributed so that the assumption of normality was fulfilled.
2. Multicollinearity Test
Here are the results of non-multicollinearity assumption test.
Table3. Multicollinearity Test
Dependent Variable Independent Variable VIF Description
Corporate Values
CSR 1.450 Free from Multicollinearity
Managerial Ownership 1.450 Free from Multicollinearity

International Journal of Advances in Scientific Research and Engineering (ijasre), Vol 6 (10), October -2020
www.ijasre.net Page 134
DOI: 10.31695/IJASRE.2020.33916
The table of test results above shows that all independent variables had a VIF value of < 10, so no multicollinearity was
found in this model.
3. Autocorrelation Test
The autocorrelation test is used to find out whether the errors in the model are correlated or not. A good regression is a
regression whose residuals are independent of each other. To determine the presence of autocorrelation in the residuals, the
Durbin Watson test is used. The regression results are said to have met the non-autocorrelation assumptions if 1,5464< DW <
2,4536.
Table4. Durbin Watson Test
Variable DW Description
Residual Model (e) 1,735 Non-autocorrelation
The table above shows that the DW value was 1.735. This value lies between the specified limits so that the non-
autocorrelation assumption is met.
4. Heteroscedicity Test
The results of testing the heteroscedasticity assumption with the Glejser test are as follows:
Table5. Glejser Test
VariableY Variable X Significance of t-Test Decision
Absolute Residual CSR 0.384 H0is accepted
Managerial Ownership 0.203 H0 is accepted
Based on the table of the glejser test results, it can be learned that all independent variables had a significance value
(probability) > α = 0,05, so H0 was accepted. This indicates that no heteroscedasticity case was found in the data used, so this
assumption is met. Besides, the plot results obtained showed points spreading randomly and not forming a pattern as can be seen
below. It means that there was no heteroscedasticity in the model being tested.
Figure2. Scatter Plot
Regression Analysis
When all the assumptions are met, it means that the regression results obtained are BLUE (Best Linear Unbiased
Estimation). The multiple regression results of this research entitled "Effects of CSR and Managerial Ownership on Corporate
Values" can be seen in the following table:
International Journal of Advances in Scientific Research and Engineering (ijasre), Vol 6 (10), October -2020
www.ijasre.net Page 135
DOI: 10.31695/IJASRE.2020.33916
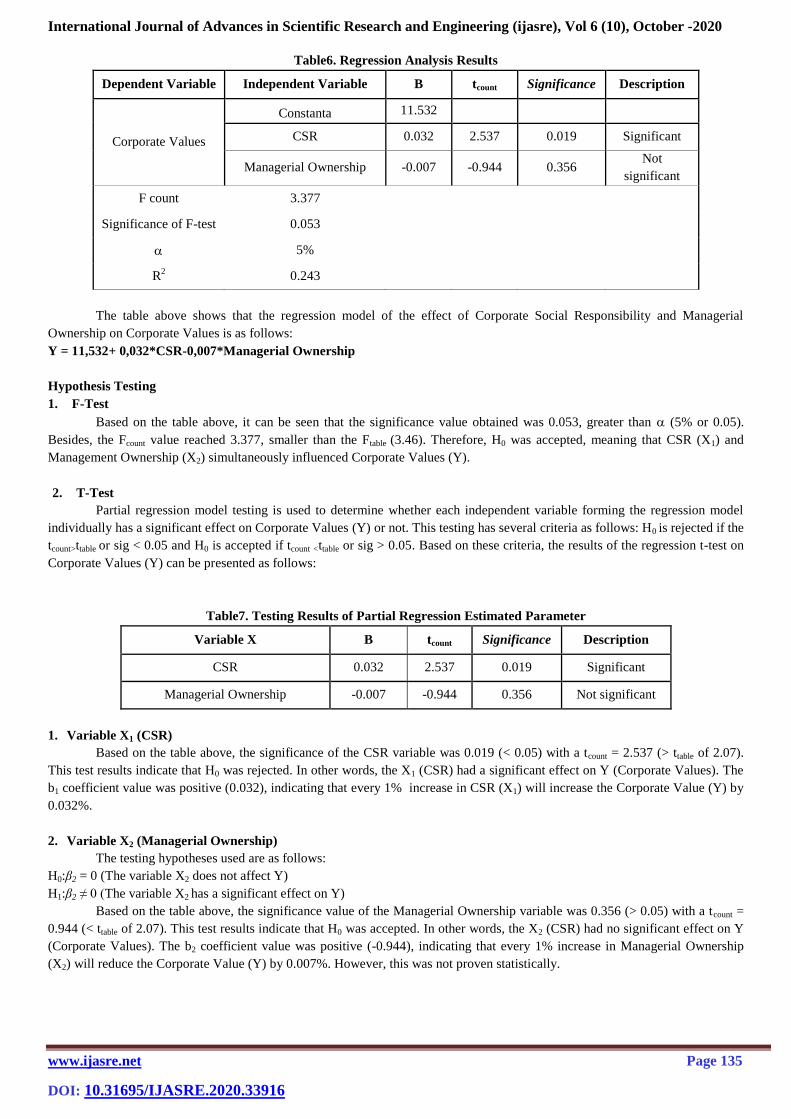
Table6. Regression Analysis Results
Dependent Variable Independent Variable B tcount Significance Description
Corporate Values
Constanta 11.532
CSR 0.032 2.537 0.019 Significant
Managerial Ownership -0.007 -0.944 0.356 Not
significant
F count 3.377
Significance of F-test 0.053
5%
R2
0.243
The table above shows that the regression model of the effect of Corporate Social Responsibility and Managerial
Ownership on Corporate Values is as follows:
Y = 11,532+ 0,032*CSR-0,007*Managerial Ownership
Hypothesis Testing
1. F-Test
Based on the table above, it can be seen that the significance value obtained was 0.053, greater than (5% or 0.05).
Besides, the Fcount value reached 3.377, smaller than the Ftable (3.46). Therefore, H0 was accepted, meaning that CSR (X1) and
Management Ownership (X2) simultaneously influenced Corporate Values (Y).
2. T-Test
Partial regression model testing is used to determine whether each independent variable forming the regression model
individually has a significant effect on Corporate Values (Y) or not. This testing has several criteria as follows: H0 is rejected if the
tcount>ttable or sig < 0.05 and H0 is accepted if tcount <ttable or sig > 0.05. Based on these criteria, the results of the regression t-test on
Corporate Values (Y) can be presented as follows:
Table7. Testing Results of Partial Regression Estimated Parameter
Variable X B tcount Significance Description
CSR 0.032 2.537 0.019 Significant
Managerial Ownership -0.007 -0.944 0.356 Not significant
1. Variable X1 (CSR)
Based on the table above, the significance of the CSR variable was 0.019 (< 0.05) with a tcount = 2.537 (> ttable of 2.07).
This test results indicate that H0 was rejected. In other words, the X1 (CSR) had a significant effect on Y (Corporate Values). The
b1 coefficient value was positive (0.032), indicating that every 1% increase in CSR (X1) will increase the Corporate Value (Y) by
0.032%.
2. Variable X2 (Managerial Ownership)
The testing hypotheses used are as follows:
H0:β2 = 0 (The variable X2 does not affect Y)
H1:β2 ≠ 0 (The variable X2 has a significant effect on Y)
Based on the table above, the significance value of the Managerial Ownership variable was 0.356 (> 0.05) with a tcount =
0.944 (< ttable of 2.07). This test results indicate that H0 was accepted. In other words, the X2 (CSR) had no significant effect on Y
(Corporate Values). The b2 coefficient value was positive (-0.944), indicating that every 1% increase in Managerial Ownership
(X2) will reduce the Corporate Value (Y) by 0.007%. However, this was not proven statistically.
International Journal of Advances in Scientific Research and Engineering (ijasre), Vol 6 (10), October -2020
www.ijasre.net Page 136
DOI: 10.31695/IJASRE.2020.33916
3. Determination Coefficient (R2) Test
The determination coefficient (R2) is a statistical measurement providing the goodness of fit information from the
regression equation, which provides a proportion or percentage of the effect of Corporate Social Responsibility and Management
Ownership on Corporate Values. Based on the table of the regression analysis results, it can be seen that the R2 value was 0.243.
These results explained that the contribution of the independent variables in influencing the Variable Y amounted to 24.3% while
the remaining 75.7% was contributed by other variables not included in this equation.
DISCUSSION
Based on this research, Corporate Social Responsibility partially has a significant effect on Corporate Values. This result
should be able to open the minds of policyholders in the company that corporate social responsibility must be aimed at
maintaining the surrounding environment not only from the natural aspect but also the wide community. Early on, people have
also started to care about the environment and sort out which products are good for the environment. If people know that the
products they consume are environmentally friendly and socially responsible, this surely can increase the corporate value. Also,
the high disclosure of corporate social responsibility will lead to increased corporate values since investors are interested in
investing in the company with a high level of social responsibility disclosure.
This research is supported by Murwaningsari [20] finding that Corporate Social Responsibility (CSR) disclosure affects
corporate values. The higher Corporate Social Responsibility (CSR) disclosure will also increase corporate values.
The positive coefficient value of the Corporate Social Responsibility variable of 0.032 indicates that every 1% increase in
CSR will increase the corporate value by 0.032%.
Conversely, the testing results of the Variable X2showed a significance value of 0.356, not significant on Corporate
Values. This result indicates that managerial ownership in Indonesia, especially in manufacturing companies of the consumer
goods industry sector, is still low. This condition demands management still act to maximize its utility which can harm other
shareholders. Low management ownership also results in a non-optimal performance, making it unable to become a mechanism to
increase corporate values.
5. CONCLUSION
The results of this research indicate that in manufacturing companies, especially of the consumer goods industry sector,
Corporate Social Responsibility and managerial ownership simultaneously have no significant effect on corporate values. This is
shown by the Fcount value reaching 3.377, smaller than the Ftable at the 5% significance level of 3.46 (Fcount< Ftable). Thus, H0is
accepted, indicating that Corporate Social Responsibility (CSR) and managerial ownership simultaneously do not affect corporate
values. However, it does not mean that the two variables do not affect at all on corporate values.
Partially, only Corporate Social Responsibility has a significant effect on corporate values. This is indicated by the Tcount
value reaching 2.537, greater than the Ttable of 2.07 (Tcount> Ttable). Thus, H0 is rejected, indicating that Corporate Social
Responsibility has a significant effect on corporate values. The b coefficient value is also positive (0.032), meaning that every 1%
increase in Corporate Social Responsibility will increase the corporate value by 0.032%. Meanwhile, the managerial ownership
variable obtained a Tcount of 0.944, smaller than the Ttable of 2.07 (Tcount< Ttable). Thus, H0 is accepted, indicating that managerial
ownership has no significant effect on corporate values. This indicates that Corporate Social Responsibility is the most influencing
factor of corporate values. In other words, the thing that most encourages workers and investors to decide to join the company is
the Corporate Social Responsibility carried out by the company.
6. Contribution and Implication
This research is useful for investors to invest their funds on the importance of corporate social responsibility and managerial
ownership of the company to increase corporate values. This research has an impact on increasing the value of companies with
good corporate social responsibility.
7. Limitation
This research is limited only to the effect of corporate social responsibility and managerial ownership oncorporate values with a
sample of 24 manufacturing companies listed on the Indonesian Stock Exchange. Further research is expected to add research
variables or samples to generalize and develop the results of this research.
REFERENCES
International Journal of Advances in Scientific Research and Engineering (ijasre), Vol 6 (10), October -2020
www.ijasre.net Page 137
DOI: 10.31695/IJASRE.2020.33916
[1] Nurlela, R. dan Islahuddin. 2008. “Pengaruh Corporate Social Responsibility TerhadapNilai Perusahaan
denganProsentaseKepemilikanManajemenSebagaiVariabel Moderating”.ProsidingSimposiumNasionalAkuntansi XI.
Pontianak.
[2] Tobin, Prof. James. 1967.” Tobin’s Q Ratio As An Indicator of the valuation of the company”. Journal of Financial
Economics, Vol LIII, No.3: June, pp. 287 – 298.
[3] Herawaty. 2006. “PraktekPengungkapanSosialPadaLaporanTahunan Perusahaan di Indonesia”. Proceedings Simposium
Nasional Akuntansi 3.
[4] Copeland, T.E. Weston J.F. 2002. “Financial Theory and Corporate Policy, 3rd
edition”. Addison-Wesley Publishing
Company.
[5] Darmawati, Deni, Khomsiyah, dan Rika GelarRahayu, 2004, “Hubungan Corporate Governance danKinerja
Perusahaan”,SimposiumNasionalAkuntansi VII, Denpasar.
[6] Anggraini, Fr. Reni Retno. 2006. “PengungkapanInformasiSosialdanfaktor-Faktor yang
MempengaruhiPengungkapanInformasiSosialdalamLaporanTahunan (StudiEmpirispada Perusahaan- Perusahaan yang Terdaftar
di BEJ)", SimposiumNasionalAkuntansi 9, Padang, 23-26 Agustus.
[7] Sugiono, Arief. 2009. “ManajemenKeuangan”. Jakarta: Penerbit PT. Gramedia
[8] Aaker, A. David. 2008. “ManajemenEkuitasMerek”. AlihbahasaolehAris Ananda. Jakarta: MitraUtama.
[9] Wibisono. 2007. “MembedahKonsepdanAplikasi Corporate Social Responsibility”. Surabaya: Media Grapka.Widiasarana
Indonesia. Hal: 113.
[10] Kartika,Andi.2010. “PengaruhKomitmenOrganisasidanKetidakpastianLingkungandalamHubungan
TataPartisipasiAnggarandenganSenjanganAnggaran”. KajianAkuntansi, Vol. 2 No. 1.
KeuangandanNilai Perusahaan”. SimposiumNasionalAkuntansi XI, Pontianak.
[11]Wahidawati. 2002. “PengaruhKepemilikanManajerialdanKepemilikanInstitusionalpadaKebijakanHutang
Perusahaan: SebuahPerspektif Theory Agency.”JurnalRisetAkuntansi Indonesia, Vol. 5, No. 1, h. 1-16
[12]Junaidi,MuhammadAR. 2006,“PengaruhKepemilikanManajemendanKebijakanHutangTerhadapKinerjaKeuangan
Perusahaan Manufaktur yang Terdaftar di BEJ”. Thesis, Unsyiah.
[13] Jensen, M. C and W.HMeckling. 1976. “Theory of the Firm: Managerial Behavior, Agency Costs and Ownership Structure".
Journal of Financial Economics, Oktober, 1976, V. 3, No. 4, pp. 305-360.
[14] Raja, AdriSatriawan Surya. 2012.“AkuntansiKeuanganVersi IFRS+”. edisi 1.Yogyakarta :GrahaIlmu.
[15] Zuhroh,Diana dan I PutuPandeHeriSukmawati. 2003. “Perusahaan AnalisisPengaruhLuas
PengungkapanSosialDalamLaporanTahunanTerhadapReaksi Investor (StudiKasusPada
Perusahaan – Perusahaan High Profile di BEJ)”. SimposiumNasionalAkuntansiVI Surabaya.
[16] Sembiring,ER.2005.“Karakteristik Perusahaan danPengungkapanTanggungjawabSosial:Study EmpirispadaPerusahaan
yang TercatatdiBursaEfek Jakarta”. SimposiumNasionalAkuntansi VIII.
[17 Diyah, PujiatidanErman, Widanar. 2009. “PengaruhStrukturKepemilikanTerhadapNilai Perusahaan:
KeputusanKeuanganSebagaiVariabel Intervening”. JurnalEkonomi,BisnisdanAkuntansi Ventura. Vol 12 No. 1. Hal : 71-86.
[18] Haruman, Tendi. 2008. “PengaruhStrukturKepemilikanTerhadapKeputusanKeuangandanNilai
Perusahaan”.ProsidingSimposiumNasionalAkuntansi XI. Pontianak. Makasar 27 November.
[19] Suranta, Eddy danMedistutiPranata. 2004. “Income Smoothing, Tobin’s Q, Agency Problem danKinerja Perusahaan”.
Denpasar-Bali : SNA VII.
[20] Murwaningsari, Etty. 2009. “Hubungan Corporate Governance, Corporate Social Responsibility dan Corporate Financial
Performance DalamSatu Continuum”. JurnalAkuntansidanKeuanganVol : I. Mei.


