
E¤ects of Short-Term Tutoring on Cognitive andNon-Cognitive Skills: Evidence from a Randomized Evaluation
in Chile�
Verónica CabezasPUC-Chile
José I. CuestaJ-PAL
Francisco A. GallegoPUC-Chile and J-PAL
This Version: May 2011
Abstract
A randomized evaluation in Chile �nds that providing a 3-month program of smallgroup tutoring to fourth graders using college student volunteers raise language scores andmeasures of attitudes towards reading for some subgroups of the population. In partic-ular, students from low-performing and poor schools in areas in which the program wasimplemented increased their performance in a reading test by between 0:15 and 0:20 stand-ard deviations and improved signi�cantly their self-perceptions as readers. We also presentcost-e¤ectiveness analyses and �nd that for the students for which the program was e¤ectivethe program was in the range of the current estimates.Keywords: remedial education, tutoring, short-term programs, randomization.JEL codes: I21, I28, O15
�Authors�email address: [email protected], [email protected], and [email protected]. Randomizedevaluations like this require the contributions of a large number of people. While it would be impossibleto recognize everyone who made a contribution to this project, we would like to thank Martín Canessa forsuperb �eld work, Ryan Cooper for useful comments, Daniela Guzmán for help with the implementation of theevaluation, and several members of the Ministry of Education of Chile and "Fundación de Superación de laPobreza" of Chile for providing data and qualitative information on the project. We are also grateful to theMinistry of Education of Chile and Fondecyt (Grant # 1100623) for funding support. The usual disclaimerapplies.
1 Introduction
The improvement of the education outcomes of students from low-performing, poor schools is
probably one the most important and debated topic among both policymakers and academi-
cians. One view is that late interventions are ine¢ cient, and even ine¤ective, given that the
socioeconomic background of the students is too low to attain good results and/or early human
capital investments were too low (eg., Carneiro and Heckman, 2003). A somewhat related view
adds that interventions focused on low-performing, poor students to be e¤ective or e¢ cient
need to be long-term interventions a¤ecting multi-dimensional dimensions. In contrast, some
literature �nds that it is possible to improve the educational skills of children even after a few
months using interventions that target attention to each kid (eg. Banerjee et al., 2007 and
Banerjee and Du�o, 2011).
In this paper we present evidence from a randomized evaluation of a small group tutor-
ing program applied to fourth graders from relatively poor backgrounds from September to
December 2010. The program is called Servicio País en Educación (SPE). The tutors were col-
lege students from di¤erent backgrounds that received small stipends to �nance transportation
costs. The program was allocated among 85 (6136) schools (students) in two Chilean regions
using a strati�ed randomization (the strata are county, socioeconomic group and pre-treatment
language test scores in a national exam). 45 (3171) schools (students) were selected to receive
the treatment (of whom 87% accepted to received the treatment). The control group to the
40 (2965) remaining schools (students).
The program main object is to improve attitudes towards reading and through that improve
reading outcomes. One key factor of the program is the link created between the student
and the tutor.1 The program original design consisted of 15 90-minute sessions in which the
volunteers would read with students a group of texts suitable for 4th graders. However, the
actual implementation of the program varied in the two regions in which we developed the
evaluation. In one region (the Great Santiago region), there was a high volunteer turnover
and in general one volunteer was allocated to groups of about 8 students. This implied that
each student tended to be tutored by about 3.5 di¤erent volunteers. In contrast, in the second
region (the Bío-Bío region) the volunteer turnover was relatively smaller than in the Great
Santiago region and the program managers allocated pairs of volunteers by student group.
Therefore, in this region students were tutored by just two di¤erent tutors. This was the most
important implementation di¤erence among the two regions and, as expected, the impact of
1A related version of the program has been implemented in Chile since 1999 by the Fundación de Superaciónde la Pobreza, our partner institution, and corresponds to a program motivated by the Perach program that hasbeen implemented in Israel 1974 (with about 30,000 volunteers tutoring about 60,000 students in 2008). SeeCarmeli (2000) for a more detailed description of the program.
1
the program was bigger in the Bío-Bío region given that the main hypothesis of the program
had to do with the role of the tutor in creating a link with the tutored students. However,
given that the di¤erences in the implementation of the program were not randomly allocated
across groups we leave this explanation only as suggestive evidence.
Our intention-to-treat and treatment-on-the-treated estimates suggest that the students
intended to be treated or treated do not increase cognitive and non-cognitive performance
with respect to students in the control group. However, we do �nd signi�cant e¤ects in both
cognitive and non-cognitive outcomes of students of some sub-sets of the population. Students
from the poorest schools in the Bío-Bío region and students from the lowest performing schools
in the same region presented signi�cantly increases in both cognitive (speci�cally in the reading
comprehension and use of language portions of a reading test we applied to students) and non-
cognitive (speci�cally in the self-perception as reader portion of an instrument to measure
attitudes toward reading we apply to students) skills. Moreover, we also present supporting
evidence in which we observe a positive correlation because the cognitive and non-cognitive
skills studied in this evaluation, giving support to the main hypothesis of the program.
We also present cost e¤ectiveness analyses in which this program does not seem to be
much more expensive per increase in test scores (for students with positive outcomes) that
other programs aimed at increasing student learning, even though the intervention was very
short-lived.
This evaluation relates mainly to two branches of the literature of impact evaluation of
educational policies. First, some papers study the impact of programs aimed at remedying
educational problems using non-teaching sta¤ (in some cases tutors).2 Banerjee et al. (2007)
evaluate the impact of the randomized introduction of balsakhis �young women working as
assistant teachers with no formal teaching training� that worked separately with students
lagging behind over school hours. Students in this program increased their test scores by 0:14
standard deviations (� from here on) in the �rst year, and 0:28 in the second year, with the
weaker students gain the most. Baker et al. (2000) evaluated the Start Making a Reader Today
(SMART) program in which volunteers tutored in a one-to-one basis �rst and second graders
with two 30-minute sessions a week for six months over two years. The students selected into
the program from poor schools in Western Oregon and have low reading skills and relatively
little reading experience with adults or others at home. Treated students increased their
performance by between 0:30 and 0:40�. Banerjee et al. (2010) evaluate the training of young
college volunteers to improve the learning of children using evening sessions outside schools.
After three months the program was implemented, while all participants students could at
2We just mention RCTs and not quasi-experimental evidence in our discussion of the impact evaluationliterature on this topic.
2
least recognize some letters, only 40% of students in the control villages could do that (and
conditional on being able to recognize some letters, they were 26% more likely to read a short
story than comparison students). Morris et al. (1990) evaluate the Howard Street Tutoring
Program, developed as an after-school program in a poor area of North Chicago with volunteers
(going from undergraduate students to mothers) helping second and third graders presenting
di¢ culties in reading in a one-to-one basis. After one and two years of the program (with an
annual average of 50 hours of tutoring), treated students presented improvements of between
0:40 and 1:77� with respect to control group. Wasik (1998) describes the School Volunteer
Development Project in Dade County, Florida in which community volunteers helped second
through sixth graders having di¢ culty in reading for a half hour a day four or �ve times a
week. After one year of intervention, treated children performed about 0:50� above untreated
children. The program studied in this paper contrasts with all these evaluations in that (i) it
is much shorter, (ii) it is based at the school and treats all students of a speci�c grade in the
school.
The second branch of the literature related to our paper identi�es signi�cant short-run
e¤ects of educational interventions. For instance, Rocko¤ and Turner (2010) present evidence
using an RDD that students from New York City schools facing the threat of potential closure
in September 2007 if they did not increase tests scores improved student achievement by
January (English) and especially March (Math). The increase in achievement corresponds
to about 0:05�. Giving the timing of the threat, this study captures probably just e¢ ciency
improvements of schools. More related to our subject of analysis, Abeberese et al. (2010) uses a
randomization to study the impact of a very-intense 31-day reading marathon in the Philippines
in which fourth graders receive reading material accurate for their age and are encouraged to
read as many books as possible through daily, in-school activities. The complete program
takes four months. Treated students increase their reading performance by 0:12� (0:06�)
immediately after the program (three months later). Also related to this literature are the
paper by Banerjee et al. (2010) already discussed above in which a three-month program
improves the reading skills of low-achieving kids in India. Hence, these three papers suggest
that reading outcomes can be improved in a short period of time. The program we study is
also a short-term intervention and therefore comes to supplement this literature.
The remainder of the paper is organized as follows. In section 2, we describe the SPE
program in detail, while section 3 describes the evaluation design, the data collection instru-
ments and the statistical methods used later to estimate the impact of the program. Section 4
displays some descriptive statistics regarding balance between groups and process information
regarding the functioning of the program. In section 5, we present and discuss the results of
3
the evaluation, while section 6 displays cost e¤ectiveness calculations for the program. Finally,
section 7 concludes.
2 The Program
The SPE program emerged from a partnership between the Chilean Ministry of Education
(Mineduc) and the Fundación para la Superación de la Pobreza (Poverty Alleviation Founda-
tion, FSP) and was �rst implemented during the period between September and December of
2010. During this �rst implementation, SPE treated 2,749 students from 39 vulnerable schools.
The main objective of the program was to improve both attitudes toward reading (IR) and
reading comprehension (RC) in 4th graders from vulnerable schools. Additionally, the program
aimed at intervening in two additional dimensions: to generate new learning environments in
which to implement the program, being this aspect in�uenced by the earthquake that a¤ected
the central region of Chile in February, 2010. Secondly, SPE intended to include college
students as direct intervention agents. In this evaluation, we only answer the questions related
to the impact of the program on IR and RC, but we do not answer questions related to both
the program methodology and the volunteers that implemented the program.
The methodology by which SPE seek to accomplish its objectives was by implementing 15
weekly sessions with a duration of 90 minutes, in which a class was split in small groups of
between 5 and 6 students assigned to a tutor, which was a volunteer recruited by FSP. The
sessions include a set of activities regarding group reading of traditional stories and informative
texts. The sessions followed a shared-reading instructional approach (or methodology) of
traditional stories and informative texts, which are age-and interest appropriate for students.3
The actual implementation of the program was managed by a paid employee of the FSP
which was inserted permanently in the intervened school. The ideas was that this professional
would verify the accurate implementation of the program and assist pedagogically the volun-
teers. As we discuss below, the actual implementation of the program was far from what was
initially planned by FSP.
The program targeted vulnerable schools of the central region of Chile. Particularly, for
this evaluation, it was o¤ered to schools from ten counties in two regions of Chile,4 in which
the families were classi�ed as middle to low income, and which results in the language section
of a Chilean standardized test called SIMCE were middle to low too.5 In the next section3See Holdaway (1979) for a discussion on the motivation for using shared-reading.4The 2010 version of the program also considered schools of two additional Chilean regions but these two
additional regions are not included in this paper because the allocation of schools to the program was notrandom.
5The SIMCE (Sistema de Medición de la Calidad de la Educación) test is applied nationwide since 1988 tomore than 90% of students in a di¤erent grade each year (4th, 8th or 10th graders). The test includes language,
4
we describe certain constraints that determined the schools that were �nally eligible for the
randomization of the program.
3 Experimental Design
3.1 Sample
On top of being a vulnerable school, a number of logistic restrictions were put by FSP. In
particular, we excluded all schools from counties in which the FSP either was not able to work
because they had no human resources in them or had already committed with some schools in it,
which made randomization impossible there. This reduced the number of counties from which
schools were included in the evaluation to 10: Santiago, Estación Central, Lo Espejo, Maipú,
La Florida and San Bernardo from the Great Santiago region (Metropolitan Region, RM),
and Concepción, Coronel, Hualpén and Talcahuano from the Biobio Region (VIII). In some
of those counties, an additional restriction was set in terms of the administrative dependence
of the schools, restricting us to include either only public schools (P) in some counties or only
private subsidized schools (PS) in other ones.
In addition, to �t the operational model designed by the FSP, each of the included schools
had to have at least 90 students in fourth grade.6 Table 1 summarizes both the eligibility
restrictions and the eligible number of schools in each of the counties included in the sample.
Using this sample, schools were randomly assigned to treatment and control groups, strat-
ifying by county, socioeconomic group and SIMCE test scores. As the eligible school set was
larger than the number of required schools, only some of the schools assigned to each group
were included in the evaluation, decision that was random too. The remaining schools were
kept as replacement lists for the eventual rejection of schools to take part of the evaluation.
With the results of this assignment, schools were contacted and invited to take part of the
evaluation in their corresponding group. Five of them rejected the program but, except in two
cases, all of them accepted to be evaluated anyway. Additionally, two schools in the control
group rejected to be evaluated. All of these schools were randomly replaced by another schools
coming from the replacement lists.
The �nal composition of the evaluation sample is displayed by Table 1. The treatment and
control groups were �nally composed by 45 and 40 schools respectively, grouped in 25 and 24
units. In section 4.1, we provide information regarding balance between groups to validate the
randomization procedure.
mathematics, science, and social science sections.6As the number of schools that �t these size criteria was insu¢ cient in some counties, we set an additional
eligibility criteria that implied that if two schools were less than 1 kilometer away between them, and the sumof their fourth grade student was higher than 90, then that couple of schools could be included in the elegibleschools set too.
5
3.2 Data Collection
The data used for this evaluation was collected �rstly through a baseline applied to the students
in before the start of the program (August, 2010) and a follow up applied after the program
�nished (December, 2010). We included two instruments: one measuring formal reading skills
and the second measuring attitudes towards reading.
The reading instrument is Prueba de Comprensión Lectora y Producción de Textos (Reading
Comprehension and Texts Production Test, CLPT), which measures Reading Comprehension
(RC), Texts Production (TP), and use of Language (UL).7 To measure attitudes towards
reading we use a short questionnaire called Gusto por la Lectura (Taste for Reading, GPL)
where we ask students several questions in four dimensions: Interest for Reading (IR), Self-
perception as a Reader (SPR), Enjoyableness for Reading (ER) and Perception of Reading at
School (PRS). These indexes move discretely between 0 and 3, where 0 is the most negative of
the o¤ered alternatives and 3 is the most positive of the o¤ered alternatives.8
We also collected information on the program operation, which was useful to understand the
reasons behind the heterogeneous impacts of the program in di¤erent subpopulations. First,
we monitored the implementation of the program with random visits to observe the actual
tutoring sessions. Second, we gathered administrative information about student, tutor, and
professional assistance to tutoring sessions and about the numbers of sessions received by each
student in the program.
Finally, we collected data from the Ministry of Education on both schools�and students�
characteristics. Regarding schools, we collected data on Language and Math SIMCE test
scores, average mothers� years of schooling, average household income, socioeconomic level,
a school vulnerability index (IVE), and administrative dependence. Regarding students, we
collected information on gender, grades for 2009 and school attendance for 2009 and 2010,
coming them from Mineduc records too.
3.3 Statistical Methods
The random assignment of the treatment across eligible schools allows us to estimate the e¤ect
of the program just by comparing average outcomes of the treatment and the control group.
Additionally, we perform some statistical exercise in order to understand the relationship
between these two tests�results.
Regarding CLPT scores, we simply run the following OLS regressions to estimate the
7Medina and Gajardo (2010) present a description of the test.8We constructed the instrument motivated by previous research by McKenna and Kear (1990), McKenna et
al. (1995) and Ow (2004)
6
Intention to Treat (ITT) e¤ect:
CLPTisk = �+ �ITTk Ts + Xis + �is (1)
where CLPTk is the score of the student i, from the school s in the dimension k of the CLPT
follow up test, Ts is a dummy variable that equals 1 is the school was assigned to be treated,
�k is the measure of the impact of the program in the dimension k of the CLPT test. Xis is
a set of control variables at the student and school level, that are included in the regression
in order to increase the precision of the estimates (including school dependence and student
gender). Finally, �is is an error term in the regression, clustered at the school level.
In order to estimate the Treatment on the Treated (TT) e¤ect, we estimate the following
IV regression:
CLPTisk = �+ �TTk Nis + Xis + �is (2)
where all the variables are the same as in equation 1, except por Nis, which is number of
sessions of the program received by student i, which stands as a measure of the intensity of
the program, and which we instrument using the intention-to-treat dummy Ts as an IV.
Finally, regarding GPL test scores regressions, they are, as previously discussed, ordered
variables. Thus, we use ordered logit models in order to estimate the impact of the program on
these dimensions, using a dummy for treatment assignment as a regressor for the estimation
of ITT e¤ect, and the number of sessions of the program received by the student added to a
control function procedure to control for endogeneity for the estimation of the TT e¤ect.9
4 Descriptive Statistics
4.1 Balance between Groups
In order to validate the random assignment of the program as a successful identi�cation strategy
for estimating the impact of the program, we test for di¤erences between the treatment and
the control group in several dimensions. First, we test for di¤erences between groups in terms
of their characteristics at the school level, for which Table 2 display the results. No statistical
di¤erences are found between groups in terms of household income, mothers�years of schooling
and language and math SIMCE test scores.
Regarding students characteristics, we test for di¤erences between groups in terms of grades
from 2009 and of school attendance during 2009 and 2010. Panel A in Table 3 displays the
results from these tests. Again, no statistical di¤erence is detected between both group in
terms of these variables. Moreover, there were attriters in both treatment and control groups,
as students either did not attend to school the day in which the tests were applied or have9See Section 15.7.2 in Wooldridge (2001) for further details regarding this procedure.
7
dropped-out from the school. In order to assure the integrity of the experiment, we test for
di¤erences in students�characteristics in each of these groups. Panel B in Table 3 shows the
results of these tests for present, absent and retired students, ensuring that there were no
statistical di¤erences between students into each of these groups, and indeed that attriters
from each group were not statistically di¤erent between them.
Given that baseline tests were applied before the beginning of the program, groups should be
balanced in that dimension too. Panels A and B from Table 4 respectively display the results
from these tests, showing that, again, there are no statistical di¤erences between groups in
terms of baseline test scores, neither in CLPT nor in GPL.
4.2 Process Information
Along the implementation of the program, the FSP collected administrative data regarding
tutors and students attendance and pairings, which let us build four process indicators. These
four indicators are the number of sessions received by the student, the number of sessions
received by the school, students� attendance to the program (measured as the ratio of the
sessions attended by the student and the sessions received by the school), and the average
number of di¤erent tutors that worked with each student, which we interpret as a measure of
tutor turnover.
As it can be noted from Table 5, there was substantial heterogeneity in the program imple-
mentation, with high variation of these indicators through schools, as shown by Panel A: there
was high variation in students� attendance rates and sessions per student; di¤erent schools
were remarkably di¤erently exposed to the treatment, with some of them receiving as much
as 15 sessions, which is what was initially planned in the program design, and other ones
receiving just nine; and di¤erent students were treated by substantially di¤erent numbers of
tutors through the program which, under the idea that personal relationships between tutors
and students in�uences the way the program works, might indeed a¤ect the impact of the
program.
Moreover, this variation seems to di¤er both through regions and through schools�depend-
ence, as displayed by Panel B in Table 5. This is noticeable in the numbers of di¤erent Tutors
per Student, which is remarkably higher for private subsidized school than for public ones, dif-
ference that is particularly high in region VIII. Among the other indicators, private subsidized
schools seem to do better than public ones, but the di¤erences are not that relevant.
8

5 Results
In this section, we discuss the results �rst for cognitive abilities (the CLPT test) and then
non-cognitive abilities (the GPL test). In both cases, we present results for the full sample
and results for several subsamples of schools, considering school dependence, location, students�
vulnerability and academic achievement. Before presenting the treatment e¤ects of the program
on non-cognitive abilities, we present a short detour and study the correlation between both
cognitive and non-cognitive dimensions in the baseline in order to improve the interpretation
of the GPL results.
5.1 Impact Results for Cognitive Abilities
The impact of the program is estimated separately10 for the three dimensions measured by the
CLPT test using equations (1) and (2). Table 6 shows the results for both the ITT and TT
estimations for each dimension.
5.1.1 Reading Comprehension
Among the cognitive abilities measured by CLPT test, this is surely the most highly linked to
the program. Columns (1) and (2) of Table 6 shows the impact estimations results over RC.
Considering all the schools in the sample, the impact of the program on RC scores appears to
be positive, reaching 0:08� in the ITT estimation and 0:09� in the TT estimation. However,
in both cases the impact is only marginally signi�cant, so we cannot rule out the chance that
the program had no impact on RC test scores.
Next, we look at the e¤ects on several subpopulations of schools in the sample. First,
we study di¤erences in the impact of the program between public (P) and private subsidized
(PS) schools. The impact is bigger for public schools (with 0:13� in the ITT estimation and
0:14� in the TT estimation).11 While both estimates are statistically signi�cant, the impact in
the private subsidized schools is not di¤erent from 0. As we will explain later, this di¤erence
might be explained by di¤erences between these two kinds of schools either in terms of their
own characteristics or in terms of their students�characteristics.
Second, given our previous discussion on the implementation of the program, we estimate
the impact of the program for the subsamples of schools located in each of the regions in
the evaluation. As said before, the program was implemented in a better way in the region
VIII that in RM, which explains the fact that the impact of the program is estimated to be
10Even though student level correlations of CLPT test scores for these three dimensions are positive and ofconsiderable magnitude (0.35-0.50), they are signi�cantly di¤erent from 1. This makes it reasonable to studyimpacts in di¤erent dimensions separately.11The fact that ITT and TT impact estimates are similar in magnitude implies that the higher impact in
public schools is not due to the fact that there were more program sessions in those schools.
9
null in RM and as high as 0:17� and 0:21� in region VIII in the case of the ITT and TT
estimators, respectively (the �rst is statistically signi�cant and the second is only marginally
signi�cant). The magnitude of this impact is relevant by itself considering that the program
lasted only 4 months, as well as the di¤erence between the impact among schools in both
regions is interesting too, in the sense that provides evidence for the relevance of the way
programs are implemented.
Third, we test di¤erentiated e¤ect by combinations of schools dependence and location.
We �nd that the impact is higher for public schools in both regions, as well as it is higher for
region VIII schools among both public and private subsidized schools. Indeed, the subpop-
ulation where the program reaches its highest impact on RC is the one of public schools in
the region VIII, where the ITT estimator of impact rises up to 0:21� and the TT rises up to
0:26�. However, none of these results is statistically signi�cant, so we simply interpret them
as suggestive rather than as quantitative evidence.
Fourth, we study whether the impact was di¤erent considering students characteristics.
We �rst divide the sample in schools with a high (High IVE) and low proportion (Low IVE)
of vulnerable students. Even though the point estimate is higher for schools that serve more
vulnerable students, none of the estimates is statistically signi�cant. Second, we divide the
sample between those schools with high and low initial SIMCE test scores. In this case, the pro-
gram shows to have a strong impact on RC in schools with higher academic achievement, with
the ITT and TT estimates being 0:15� and 0:20�, respectively. These results are interesting
because they imply that the higher estimated impact of the program on RC in public schools
is not due to the fact that they have more vulnerable students and worse initial academic
outcomes than private schools.
Finally, we estimate the program impact on RC in subpopulations of schools with high and
low students�vulnerability and of high and low SIMCE test scores in each of the two regions.
In the �rst case, schools with higher vulnerability show to be impacted more strongly by the
program in both regions, with such impact being statistically signi�cant only for such schools
in region VIII, where the it rises to 0:15� and 0:17� , respectively according to our ITT and
TT estimators. In the second case, we �nd a similar result , as even though impacts seem
to be larger in high SIMCE schools in both regions, the only subpopulation for which impact
estimates are statistically signi�cant are the low SIMCE schools in region VIII. The ITT and
TT estimates for the program impact among those schools respectively reach 0:17� and 0:19�.
Thus, the program seems to produce sizeable impacts on RC for some subpopulation,
which are particularly those that hold higher proportions of vulnerable students or those where
the program was better implemented. Moreover, those impacts are estimated to be of high
10
magnitude, specially when taking into account that the duration of the program was relatively
short.
5.1.2 Use of Language
The second learning dimension measured by the CLPT test was Use of Language, which
estimations�results are shown by columns (3) and (4) of Table 6. This dimension might as
well had been somehow impacted by the program, but that was not a primary objective for
it to do so. Consistent with that fact, the impact of the program on UL is estimated to be
positive but both statistically and economically insigni�cant, with point estimates being as low
as 0:01� for both the ITT and TT estimations.
As with our RC estimations, we estimate the program impact for di¤erent subsamples
of schools. Estimating it separately for public and private subsidized schools shows that,
even though the impact is positive for public ones (0:05� according to both ITT and TT
estimates) and negative for private subsidized ones (�0:08� to both estimates), none of them iseconomically signi�cant. E¤ects in both regions are economically and statistically insigni�cant.
A similar pattern emerges when we consider the interaction of dependence and location.
Regarding the schools�students characteristics, estimating in subsamples of schools with
di¤erent students�vulnerability levels shows that the program had a positive but statistically
insigni�cant impact on the schools with high IVE, as well as a negative and statistically signi-
�cant impact on the school with low IVE, which is estimated to be of a magnitude of �0:07�and �0:09� by the ITT and TT estimates respectively, result for which is di¢ cult to draw
an explanation. Regarding di¤erences in schools�students academic achievement, even though
point estimated di¤er substantially, with the program impact among low SIMCE schools be-
ing estimated as higher than the one among high SIMCE schools, no relevant di¤erences are
detected between the impact of the program on UL among these two subsamples.
Finally, we check if the program impact varies through any of the interactions between
schools� locations and the schools� students characteristics measures, vulnerability and aca-
demic achievement. Regarding student�s vulnerability, while no statistically signi�cant impact
is estimated among neither high IVE nor low IVE schools in RM, impacts with di¤erent signs
are estimated for schools in region VIII. For schools with a high proportion of vulnerable stu-
dents in such region, the program impact on UL is estimated to be 0:26� and 0:33� according
to the ITT and TT estimates, while for schools with a low proportion of them in that re-
gion, such impact is estimated to be of �0:15� and �0:21� respectively. Regarding student�sacademic achievement, the only subsample among which a signi�cant impact is estimated is
the one that includes low SIMCE schools in region VIII, for which the program impact, as
measured by our ITT and TT estimates, rises up to as high as 0:40� and 0:51� respectively.
11
In all, it is clear that even though the program shows no impact in several subsamples
of schools, it does show signi�cant and strong impacts in some of them, which, remarkably,
are the same ones for which stronger impacts where found on RC, namely those region VIII�s
schools with high IVE and low SIMCE.
5.1.3 Texts Production
Results for the impact estimations on TP scores are shown in columns (5) and (6) of Table 6.
This is the learning dimension that is conceptually less likely to be impacted by the program
given the objectives and methodology used in the intervention. Indeed, the point estimates of
the program impact over all the schools in the sample are small in magnitude, only 0:04�, and
statistically insigni�cant.
As for the other dimensions of the CLPT test, we estimate di¤erential program impacts in
a series of subsamples. First, similarly to what we �nd for RC and UL, the estimated impact is
remarkably stronger in public than in private subsidized schools, reaching magnitudes of 0:08�
and 0:09� according to our ITT and TT estimates�however, in both cases the estimated impact
is not statistically di¤erent from zero. In the same line, no statistically signi�cant impact is
found when estimating separately for schools located in both regions in the evaluation.
Moving on to impact estimations in subsamples of schools with di¤erent students�charac-
teristics, no statistically signi�cant is found neither among schools with high and low propor-
tions of vulnerable students nor among schools with high or low academic achievement. Even
though, point estimates suggest that schools with a higher proportion of vulnerable students
were more strongly impacted by the program, with the ITT and TT estimations reaching 0:10�
and 0:11�, respectively.
Finally, we estimate the program impact on TP for subsamples of schools with di¤erent
students�characteristics in di¤erent regions. This analysis shows that schools with high pro-
portions of vulnerable students in RM were positively impacted by the program, showing an
increase of 0:15� in their average TP scores, while schools in RM but with less vulnerable
students present no impact. The same happens with schools with high and low proportions of
vulnerable students in region VIII. Regarding schools with di¤erent levels academic achieve-
ment in both regions, no signi�cant impact is found in any of the analyzed subsamples.
In all, the estimated e¤ects of the program on TP show that e¤ectively this was the cognitive
dimension on which the program had the smallest impacts. Even though, the pattern of the
impacts across di¤erent subsamples of schools is, excepting some subpopulations, quite similar
to what was observed for RC and UL previously.
12
5.1.4 Discussion
Summarizing impact results over students� cognitive abilities, the program has statistically
signi�cant impact on certain subsamples of schools, particularly on public schools, located
in region VIII, with high proportions of vulnerable students and low academic achievement.
Additionally, it is clear that RC is, among the evaluated, the learning dimension that was more
clearly impacted by the program, which is meaningful in the sense that RC is precisely the
dimension that the program initially intended to impact.
Moreover, the magnitude of the estimated impacts, which for RC move between 0:14� and
0:17�, according to ITT estimations and between 0:14� and 0:21� according to our TT estim-
ates among di¤erent subpopulations, is notably high when comparing it to other educational
interventions in developing countries. In fact, as mentioned by Barrera-Osorio and Linden
(2009), the smallest impact estimations for educational programs on test scores in developing
countries are of 0:125�, which includes programs that are of much longer duration that SPE.
Finally, the fact that the program have no signi�cant e¤ects on some dimensions that are not
a¤ected by the program implies that there were no externalities on other learning dimensions.
This is important because a focused program like this may have a¤ected negatively non-treated
dimensions through a substitution e¤ect. This does not seem to be the case in our sample.
5.2 Detour: Correlation between Cognitive and Non Cognitive Abilities
Before going to the estimated e¤ects on non-cognitive dimensions, we present the correlation
between the di¤erent cognitive and non-cognitive dimensions. We do this in order to improve
the interpretation of the estimated e¤ects.
In this section, we estimate simple OLS regressions of the students�scores of each of the
dimensions of the CLPT test on the students�scores in each of the dimensions of the GPL test:
CLPTisk = �+Xg
�gGPLisg + �Xis + �is (3)
where GPLisg is the score of the student i from school s in the dimension g of the GPL test,
and �g is the conditional relationship between the score in dimension g of the GPL test with the
score in dimension k of the CLPT test.12 Even though this regression will not provide causal
e¤ects, it will give us an idea the sign and size of the correlation between both dimensions,
which will be useful to interpret the results obtained for the impact estimations.13
Using equation (3), we estimate correlations between each of the dimensions measured
by GPL test, namely IR, SPR, ER and PRS, and each of the dimensions measured by the12For this regression, we use baseline test scores from both treatment and control groups and follow up test
scores for control group, as all those observations are not contaminated by the program.13Jensen and Lleras-Muney (2010) perform a similar exercise in order to understand impact mechanisms in
the context of a di¤erent educational intervention.
13
CLPT test. Results for these regressions are shown by Table 7, in which results for simple
and conditional correlations between the di¤erent variables are provided. In general terms,
what these results suggest is that SPR and PRS are the two dimensions of GPL that are more
closely linked to results in the di¤erent dimensions measured by the CLPT test. In contrast,
ER shows to have a null, or even negative, correlation with those measures, while IR does
not show a clear pattern for such relationship. It is true that some of these results may be
simply due to collinearity among GPL variables, but we still think they are informative of the
relationship among both dimensions.
These results suggest that some of the non cognitive measures taken from GPL test are
more strongly correlated than other ones with learning outcomes measured using the CLPT,
which is important to check if these kind of abilities can serve as an intermediate mechanism
to cause impact on learning outcomes.
5.3 Impact Results for Non Cognitive Abilities
In this section we present program e¤ects on non-cognitive abilities. We proceed as with
cognitive abilities: we analyze separately each of the four dimensions measured using the GPL
test.14 Tables 8 to 11 present the results for both the ITT and TT estimations for each
dimension, where coe¢ cients are the marginal e¤ects of the estimated logit speci�cations.15
5.3.1 Self Perception as a Reader
This is a dimension of GPL that appears to be closely linked to cognitive results, as shown
previously in section 5.2, which suggests that impact results should be similar in this case to
the �ndings for cognitive abilities discussed previously in section 5.1. Indeed, Table 8 show
that the estimated impact on SPR is positive, although not statistically signi�cant. Basically,
what the program seems to be doing is to move students�self perception as readers from lower
levels to higher ones.
When considering di¤erent subgroups of the population, results show that the program does
not signi�cantly impact students�SPR in private subsidized schools, but that it does impact
those in public schools. In fact, public schools that were treated by SPE show reductions
in the proportion of students in low levels of SPR, reducing by 17% and 12% respectively
the probabilities of being in CAT0 and CAT1, and increases in the proportions of them in
higher levels of SPR, increasing the probabilities of being in CAT and CAT 3 by 3% and 15%
14Analogously to cognitive abilities, student level correlations of GPL test scores for these four dimensionsare positive (0.13-0.52), but they are signi�cantly di¤erent from 1.15For each dimension of the GPL test, test scores are grouped for each student in four categories, among
which CAT0 is the minimum, CAT3 is the maximum and CAT1 and CAT2 are intermediate categories.
14
respectively according to our ITT results.16
There are also regional di¤erences, re�ecting di¤erences in actual program implementation.
While the impact among schools in the RM region is nil, we estimate a strong impact in region
VIII a, which again shows that the program move relevant proportions of treated students
from the lowest level of SPR to the highest one. Regarding the magnitude of this impact,
ITT results show a decrease in the probabilities of being in CAT0 and CAT1 of 22% and 15%
respectively, as well as an increase in the probabilities of being in CAT2 and CAT3 of 4% and
20% respectively.
Estimating the program in subsamples of public and private subsidized schools in both
regions reinforces the results previously obtained, thus showing that the strongest impact of
the program on SPR is observed in public schools in region VIII, with our ITT estimates
showing signi�cant reductions in the probabilities of being in CAT0 and CAT1 of 34% and
25%, as well as signi�cant increases in the probabilities of being in CAT2 and CAT3 of 4% and
30% respectively. Additionally, we estimate a signi�cant negative impact of the program on
SPR for the subsample of private subsidized schools in RM, result for which there is no clear
explanation.
Regarding schools�students characteristics, even though schools with lower academic achieve-
ment seem to have had been more favorably impacted by SPE in terms of SPR, no statistically
signi�cant di¤erences are observed between schools with high an low SIMCE test scores. In
terms of students�vulnerability, we estimate that schools with high proportions of vulnerable
students present a statistically signi�cant impact of SPE. In such subsample, our ITT estim-
ates show that the probabilities of students being in CAT0 and CAT1 of SPR were reduced
by the program in 16% and 11% respectively, while their probabilities of being in CAT2 and
CAT3 were increased by it in 3% and 15%.
Finally, estimating the program impact on SPR in subsamples of schools with di¤erent
students�characteristics in di¤erent regions reinforces the previously discussed results. VIII
region schools with low academic achievement show signi�cant positive impacts on SPR, which
magnitude is remarkably high. ITT estimations results imply reductions in the probabilities
of being in CAT0 and CAT1 of SPR of 129% and 81% and increases in those of being in CAT2
and CAT3 of SPR of 18% and 79% respectively.17 We obtain a similar result for schools with
more vulnerable students: ITT estimates imply a decrease of 106% and 68% in the students�
probabilities of being in CAT0 and CAT1 of SPR and an increase of 15% and 68% in the
16We only present ITT estimates when discussing the size of the e¤ects in this section of the paper to savespace. The TT estimated e¤ects of increasing the number of sessions per student by one-standard deviationyield very similar e¤ects to the ITT e¤ects discussed in the main text of the paper.17A small negative impact of the program on SPR in RM schools with low SIMCE test scores explains why
we �nd no signi�cant impact on the subsample including all low achievement schools, as discussed above.
15
probabilities of being in CAT2 and CAT3 of SPR.
Thus, students�self perception as readers was strongly impacted by the program in several
subsamples of schools, particularly in those where SPE was well implemented, with higher
students� vulnerability levels and lower academic achievement. This is consistent with the
correlations we present in section 5.2. These facts might be interpreted as that SPR is an
indirect mechanism through which RC can be impacted by programs like SPE, and thus that
improving the way in which children perceive them as readers might be an e¤ective way to
improve their achievement in reading. This is the actual interpretation of FSP (the NGO that
designed the program). Another interpretation is that cognitive improvements cause the raise
in students�self perception as readers. Unfortunately we do not have data to test among this
two hypotheses.
5.3.2 Enjoyableness for Reading
The second non-cognitive outcome that we measure through the GPL test is ER, which, as
discussed in section 5.2 does not have a clear relationship with the cognitive outcomes measured
by CLPT. We present results for program impact estimations on ER in Table 9. Program
impact estimations over the full sample of schools show that in average, the program has
neither a statistically nor an economically signi�cant impact.
Even though, when estimating the program impact on ER in di¤erent subsamples of schools,
we �nd a few noteworthy cases. First, regarding school dependence and in contrast to the other
outcomes discussed so far, the program only impacted signi�cantly ER in private subsidized
schools. The magnitude of such impact according to our ITT estimates is of a decrease in
the probabilities of students being in CAT0, CAT1 and CAT2 of ER of 27%, 24% and 10%
respectively and an increase in the probability of them being in CAT3 of ER of 14%. Regarding
implementation di¤erences, similarly to what was �nd for SPR, while we �nd no impact for
RM schools, the program has a signi�cant positive impact on VIII region schools. ITT results
show that SPE reduced the probabilities of students being in CAT0, CAT1 and CAT2 in 18%,
16% and 8%, while it increased the probability of them being in CAT3 by 9%. Both of these
results are con�rmed when estimating into subsamples of schools of each kind of dependence
in each region, estimations that deliver as result that the program�s impact on ER was highly
focused on private subsidized schools in VIII region.
We also estimate a positive impact on ER for schools with lower proportions of vulnerable
students. According to our ITT estimations, this impact is estimated to cause a decrease
in the probabilities of the students being in CAT0, CAT1 and CAT2 of 25%, 22% and 9%
respectively, and an increase in the probability of them being in CAT3 of 13%. This e¤ect
is reinforced when we estimate in the subsample of high IVE schools in RM, for which ITT
16
results for such changes in probabilities are -31%, -27%, -11% and 16% respectively. Regarding
di¤erences between schools�academic achievement, we �nd no di¤erences between schools with
high and low SIMCE tests scores. The same result holds when estimating the program impact
on ER separately for schools with di¤erent level of academic achievement in di¤erent regions.
In all, SPE impacted students�ER in certain subsamples of schools. Even though, those
subsamples are di¤erent to those where impacts have been observed for the other outcomes,
particularly in what regards to impacts on privatized in schools and schools with higher pro-
portions of vulnerable students.
5.3.3 Interest for Reading
The third non cognitive outcome we measure using the GPL test is IR, dimension that, as
discussed in section 5.2 is only slightly correlated to cognitive outcomes (with a signi�cant
correlation only with TP). In general, as Table 10 shows, SPE does not seem to impact IR
strongly, as we just estimate a few signi�cant impacts across the several subsamples of schools
analyzed. In fact, the program impact over all schools in the sample is estimated to be almost
null in magnitude and is statistically insigni�cant.
Moving on to estimations among di¤erent subsamples, we estimate a slight di¤erence in
the program impact across public and private schools, with public schools showing no impact
and private subsidized schools showing a marginally signi�cant negative impact. In addition,
we �nd no di¤erence of the program on schools of di¤erent regions, which might be interpreted
as that implementation di¤erences does not explain the lack of impact of the program on IR.
Estimating in subsamples of schools with di¤erent dependence and location does not yield any
relevant impact results of the program. Similarly, estimating in subsamples of schools that
di¤er in students� characteristics does not provide relevant additional results. Even though
ITT estimates show that the program had no impact on IR in low SIMCE schools, although
TT estimates show a signi�cant negative impact.
Interest for reading does not seem to be a dimension over which SPE had any impact. In
fact, if anything, the impact of the program was negative on certain subsamples. Additionally,
it is di¢ cult to identify a clear pattern for those impacts, which complicates a reasonable
interpretation of the results.
5.3.4 Perception of Reading at School
The �nal non cognitive outcome measured by GPL is the way students perceive reading at
school, PRS. This dimension is, jointly with SPR, highly correlated with cognitive outcomes,
as discussed in section 5.2, reason that makes it useful in terms of understanding the indirect
mechanisms through which cognitive outcomes can be impacted. We present the results in
17
Table 11. The program impact on PRS on the full sample of schools is estimated to be positive
but, similarly to the results obtained with all the other outcomes, not statistically signi�cant.
Regarding the impact magnitudes, they are not economically meaningful either, with changes
in the probabilities of being in the di¤erent PRS levels moving in the range from -6% to 5%.
We �nd positive e¤ects on public schools but results for both subsamples are nos statistically
signi�cant at conventional levels. Doing the same with RM and VIII region schools neither
o¤ers any interesting results, as impact estimations are not signi�cantly di¤erent from zero for
schools in both regions. Looking for impacts among schools of each dependence type in each
region does not yield any interesting impact result either.
Estimating the SPE impact in subsamples of schools which di¤er in terms of their students�
characteristics does provide some interesting results. In fact, students from schools with higher
proportions of vulnerable students were signi�cantly impacted by the program in terms of their
PRS. In fact, the program signi�cantly decreases the probabilities of students being in CAT1
and CAT2 by 31% and 15% and increases the probability of them being in CAT3 by 30%.
When estimating separately in the subsamples of high IVE schools located in RM and those
located in VIII region, these impact estimations remain similar in signi�cance, and slightly
di¤er in magnitude, with a stronger impact in VIII region schools. Regarding di¤erences in
students� academic achievement, we �nd no impact in any of those subsamples, result that
does not change when estimating in subsamples of RM and VIII region schools which di¤er in
students�academic achievement.
Thus, SPE signi�cantly impacted students�PRS in certain subsamples of schools. In partic-
ular, it did so in schools with relatively high proportions of vulnerable students. Moreover, the
pattern of the estimated impacts on PRS is similar to what was found for cognitive outcomes,
particularly for RC, which suggests that PRS, as well as SPR, could be a relevant indirect
mechanism towards impacting cognitive outcomes.
5.3.5 Discussion
Regarding no cognitive outcomes, as measured by the GPL test, what is found is that, excepting
for IR, SPE had statistically and economically signi�cant impacts on these variables over
certain subsamples of schools. The way SPE impacts students is by moving them from low
levels of perception in the measured outcome to higher levels.
The pattern of impacted subsamples vary between the outcomes analyzed in this section.
As discussed in section 5.2, both SPR and PRS are signi�cantly correlated with cognitive
outcomes, which was re�ected in the fact that their impact patterns resulted to be quite similar
to what was found or cognitive outcomes, specially in the case of PRS. These �ndings suggest
that both SPR and PRS were relevant indirect mechanisms through which SPE impacted
18
cognitive outcomes. The fact that ER did not result to be correlated with cognitive outcomes
that its impacts pattern found di¤ered from the one found for cognitive abilities, can be
interpreted as a supportive �nding for the �indirect mechanisms�discussion stated above.
6 Cost E¤ectiveness
In the previous section, we show that the SPE program has a positive impact of relevant mag-
nitude in certain subsamples of schools on both cognitive and non cognitive abilities measures.
In this section we calculate some cost e¤ectiveness measures for the program in order to be able
to understand the cost at which the short run impacts estimated previously can be obtained.
We focus only of cognitive measures, given that they capture a margin typically studied in the
literature.
We assign the total cost of the program (about $520; 000) to di¤erent schools in order to
estimate the cost of the program in each of the subsamples with which we worked through
our estimations of impact. Additionally, we adjusted such costs for the fact that SPE, as
well as PERACH, not only has the objective to impact students�reading, but also volunteers�
attitudes towards poverty, as discussed above. We assume that the proportion of costs related
to the actual tutoring is 75% of the total costs.
Under these assumptions, and working with the results shown by Table 6, we compute cost
e¤ectiveness measures for the impact of the program on cognitive skills. Table 12 shows results
for these calculations for each of the learning dimensions measures by the CL-PT test, for each
of the subsamples of schools for which signi�cant impacts were found by our estimations.
Results show that, according to our impact estimates, SPE requires expenditures of between
$50:218 and $74:5 to obtain improvements of 0:10� on students�RC test scores in schools with
relatively high shares of disadvantaged students where the program is well implemented, and
of between $21:4 and $31:2 for doing so on similar schools but on students�UL test scores.
How well does SPE does in terms of cost e¤ectiveness? Table 13 presents cost e¤ectiveness
measures for several remedial education programs implemented in di¤erent countries. Even
though cost e¤ectiveness calculations might not be perfectly comparable across program, it
does help in terms of illustrating their relative performance. The cheapest programs in the list
cost as low as $2 per 0:10� of improvement in language test scores for incentive programs, such
as the individual incentives program evaluated by Muralidharan and Sundararaman (2011)
or the SNED incentives program in Chile evaluated by Contreras and Rau (2011). On the
other side, certain inputs programs in Africa resulted to have no impact at all on language
test score, which yields a cost e¤ectiveness of in�nity for them. Indeed, the range in which
18All our calculations correspond to 2010 US dollars corrected by PPP di¤erences.
19
educational programs�cost e¤ectiveness moves is wide. Moreover, incentives programs seem to
be the most cost e¤ective ones, followed by those programs that implement changes in teaching
methodologies, leaving inputs programs at the bottom of the ranking.
The cost e¤ectiveness shown by SPE, a program that both adds inputs to schools and pro-
poses innovation in teaching methodologies, ranges in the lower middle of this ranking, below
the cost e¤ectiveness of incentives programs, below the balsakhis program in India evaluated by
Banerjee et al (2007) and below the reading program in the Philippines evaluated by Abeberese
et al. (2010). Even though, SPE shows to be somehow more cost e¤ective than the Literacy
Hour in the UK evaluated by Machin and McNally (2008) and remarkably more cost e¤ective
than JEC, a full day school program implemented in Chile and evaluated by Bellei (2009).
7 Conclusions
The results of this paper demonstrate that a short-term tutoring program that supports stu-
dents reading can have signi�cant e¤ects on both cognitive and non-cognitive skills of some
populations of fourth graders. We show that providing a three month of program of small group
tutoring using college student volunteers (with roughly 10 90-minute sessions and groups of two
tutors and seven students) raise reading scores and measures of attitudes towards reading for
low-performing and poor schools in areas in which the program was well implemented. They
increase reading skills by as much as 0:20 standard deviations. Relatedly, students improve
their attitudes toward reading in a signi�cant way in these same schools, with e¤ects that
typically move a signi�cant share of the students from categories of low perceptions as readers
or as readers in the school to the highest categories.
We also present cost-e¤ectiveness analyses and �nd that for the students for which the
program was e¤ective the program was in the range of the current estimates for interventions
that provide either more resources or change the teaching technology�however, it is much more
expensive than interventions that change the teacher incentives, a result already discussed in
the literature. We interpret this evidence as suggestive that there is room to increase even in
the short-run the reading performance of students coming from poor background in contrast
to some literature that tend to suggest that late interventions are neither e¤ective nor e¢ cient.
In addition, our treatment e¤ects and the correlations we �nd in the data imply an interesting
pattern in which cognitive and non-cognitive skills tend to complement each other. Future
research should study in more detail the dynamic inter-relationship between both dimensions.
20
References
[1] Abeberese, A., T. J. Kumler and L. Linden (2010). �Improving Reading Skills by En-
couraging Children to Read: A Randomized Evaluation of the Sa Aklat Sisikat Reading
Program in the Philippines", Manuscript, Columbia University, October.
[2] Angrist, J., E. Bettinger, E. Bloom, E. King and M. Kremer, Michael (2002). �Vouchers
for Private Schooling in Colombia: Evidence from a Randomized Natural Experiment�,
American Economic Review, 92(5), December, 1535-1558.
[3] Baker, S., R. Gersten, and T. Keating (2000). �When less may be more: A two-year lon-
gitudinal evaluation of a volunteer tutoring program requiring minimal training�, Reading
Research Quarterly, 35 (4), 494-519.
[4] Banerjee, A., S. Cole, E. Du�o and L. Linden (2007). �Remedying Education: Evidence
from Two Randomized Evaluations in India�, Quarterly Journal of Economics, 122(3),
1235-1264.
[5] Banerjee, A., R. Banerji, E. Du�o, R. Glennerster and S. Khemani (2010). �Pitfalls of
Participatory Programs: Evidence from a Randomized Evaluation in Education in India�,
American Economic Journal: Economic Policy, American Economic Association, 2(1),
February, 1-30.
[6] Banerjee, A. and E. Du�o(2011). Poor Economics. Public A¤airs.
[7] Barrera-Osorio, F., and L. Linden (2009). �The Use and Misuse of Computers in Edu-
cation: Evidence from a Randomized Controlled Trial of a Language Arts Program",
Manuscript, Columbia University, March.
[8] Bellei, C. (2009). �Does Lengthening the School Day Increase Students�Academic Achieve-
ment? Results from a Natural Experiment in Chile�, Economics of Education Review,
28(5), 629-40.
[9] Carmeli, A. (2000) �PERACH: A countrywide tutoring and mentoring scheme from Is-
rael�, Widening Participation and Lifelong Learning, 2 (1), 46-48.
[10] Carneiro, P. and J. Heckman (2003). "Human Capital Policy", NBER Working Papers
9495, National Bureau of Economic Research, Inc.
[11] Contreras, D. and T. Rau (2011). "Tournament incentives for teachers: the case of Chile".
Manuscript, Catholic University of Chile.
21
[12] Du�o, E., P. Dupas and M. Kremer (2011). �Peer e¤ects, teacher incentives, and the im-
pact of tracking: evidence from a randomized evaluation in Kenya�, American Economic
Review, forthcoming.
[13] Du�o, E., R. Hanna, and S. Ryan (2011). �Incentives Work: Getting Teachers to Come
to School�, American Economic Review, forthcoming.
[14] Du�o, E., P. Dupas, and M. Kremer (2009). Additional Resources versus Organizational
Changes in Education: Experimental Evidence from Kenya�, Manuscript, Harvard Uni-
versity, May.
[15] Glewwe, P. and M. Kremer (2006). �Schools, teachers, and education outcomes in devel-
oping countries�, Handbook of the Economics of Education, 2, April, 945-1017.
[16] Glewwe, P., M. Kremer and S. Moulin (2009). �Many children left behind? Textbooks and
test scores in Kenya�, American Economic Journal: Applied Economics, 1(1), 112-135.
[17] Glewwe, P., M. Kremer, S. Moulin and E. Zitzewitz (2004). �Retrospective vs. prospective
analyses of school inputs: the case of �ip charts in Kenya�. Journal of Development
Economics, 74(1), 251-268.
[18] Holdaway, Don (1979).The Foundations of Literacy. New Hampshire: Heineman.
[19] Jensen, R. and A. Lleras-Muney (2010). �Does staying in school (and not working) prevent
teen smoking and drinking?�, Manuscript, UCLA.
[20] Kremer, M., E. Miguel and R. Thornton (2009). �Incentives to Learn�. Review of Eco-
nomics and Statistics, August, 437-456.
[21] Machin, S. J. and S. McNally (2008). �The Literacy Hour�, Journal of Public Economics,
92, June, 1141-1162.
[22] McKenna, M.C. and D.J. Kear (1990). �Measuring Attitude Toward Reading: A New
Tool for Teachers�, The Reading Teacher, 43(8), 626-639.
[23] McKenna, M.C., D.J. Kear and R. Ellsworth (1995). �Children�s attitudes toward reading:
A national survey�, Reading Research Quarterly, 30, 934-956.
[24] Medina, A and A.M. Gajardo (2010). Pruebas de Comprensión Lectora y Producción de
Textos (CL-PT) Kinder a 4to año Básico. Ediciones UC. Santiago, Chile.
[25] Morris, D., B. Shaw and J. Perney (1990). �Helping low readers in grade 2 and 3: An
afterschool volunteer tutoring program�. The Elementary School Journal, 91(2), 132-150.
22
[26] Muralidharan, K., and V. Sundararaman (2011). �Teacher Performance Pay : Experi-
mental Evidence from India�, Journal of Political Economy, 119(1), February, 39-77.
[27] Ow, M (2004). El tratamiento didáctico de las lecturas literarias en el primer nivel de
enseñanza media en Chile: una propuesta de formación en didáctica de la literatura,
Doctoral Dissertation, Universidad Complutense de Madrid.
[28] Rocko¤, J. and L. Turner (2010). "Short Run Impacts of Accountability on School Quality"
American Economic Journal: Economic Policy, 2(4), 119-147.
[29] Wasik, B. (1997). "Volunteer Tutoring Programs: A Review of Research on Achievement
Outcomes" Manuscript, Johns Hopkins University, June.
[30] Wooldridge, J. (2001) Econometric Analysis of Cross Section and Panel Data. The MIT
Press.
23
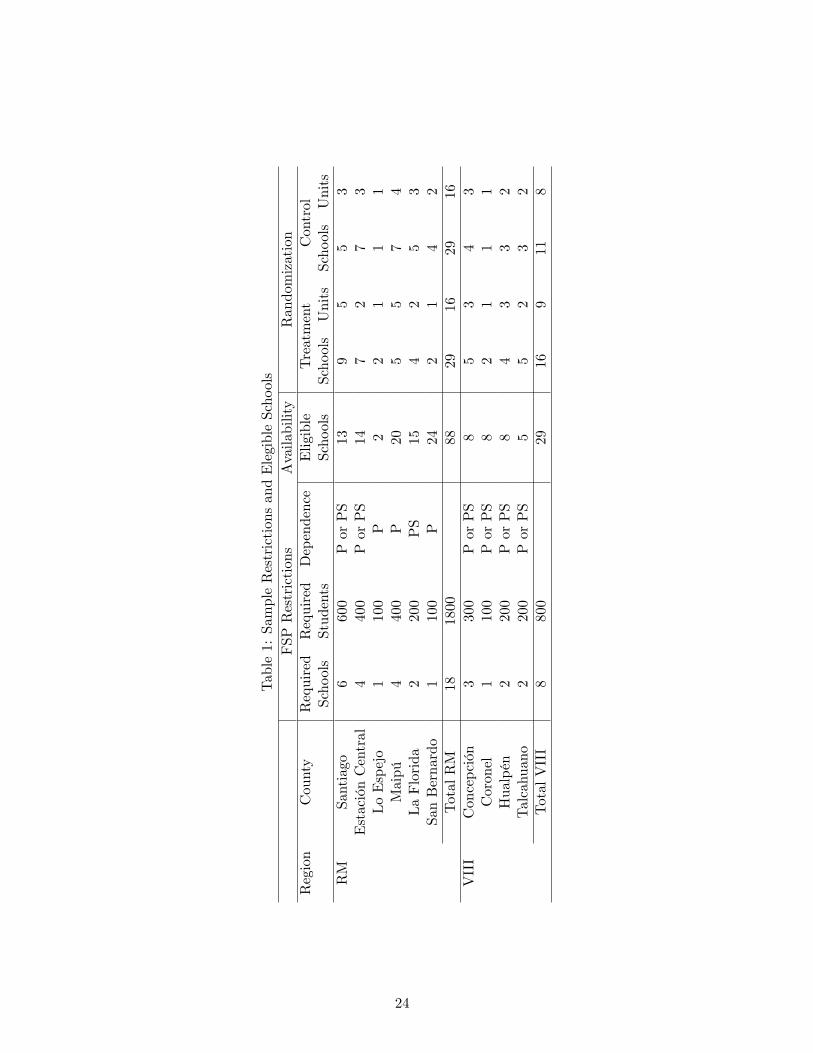
Table1:SampleRestrictionsandElegibleSchools
FSP
Restrictions
Availability
Randomization
Region
County
Required
Required
Dependence
Eligible
Treatment
Control
Schools
Students
Schools
SchoolsUnits
SchoolsUnits
RM
Santiago
6600
PorPS
139
55
3EstaciónCentral
4400
PorPS
147
27
3LoEspejo
1100
P2
21
11
Maipú
4400
P20
55
74
LaFlorida
2200
PS
154
25
3SanBernardo
1100
P24
21
42
TotalRM
181800
8829
1629
16VIII
Concepción
3300
PorPS
85
34
3Coronel
1100
PorPS
82
11
1Hualpén
2200
PorPS
84
33
2Talcahuano
2200
PorPS
55
23
2TotalVIII
8800
2916
911
8
24
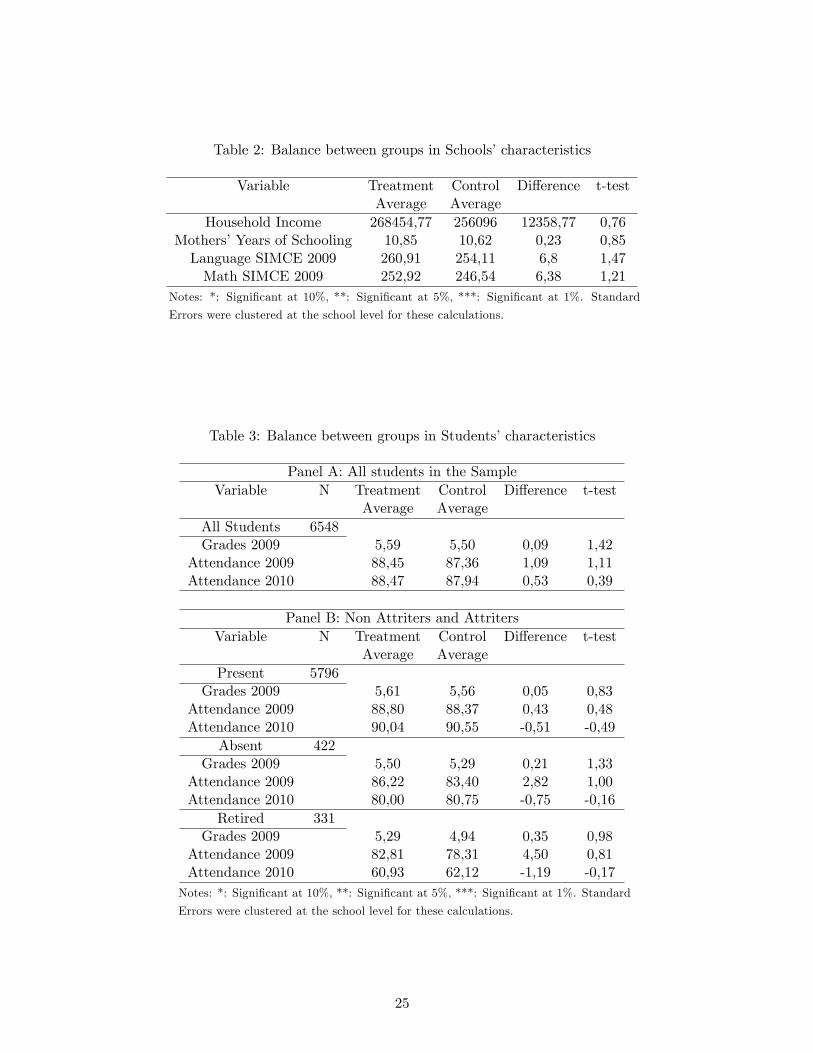
Table 2: Balance between groups in Schools�characteristics
Variable Treatment Control Di¤erence t-testAverage Average
Household Income 268454,77 256096 12358,77 0,76Mothers�Years of Schooling 10,85 10,62 0,23 0,85Language SIMCE 2009 260,91 254,11 6,8 1,47Math SIMCE 2009 252,92 246,54 6,38 1,21
Notes: *: Signi�cant at 10%, **: Signi�cant at 5%, ***: Signi�cant at 1%. Standard
Errors were clustered at the school level for these calculations.
Table 3: Balance between groups in Students�characteristics
Panel A: All students in the SampleVariable N Treatment Control Di¤erence t-test
Average AverageAll Students 6548Grades 2009 5,59 5,50 0,09 1,42
Attendance 2009 88,45 87,36 1,09 1,11Attendance 2010 88,47 87,94 0,53 0,39
Panel B: Non Attriters and AttritersVariable N Treatment Control Di¤erence t-test
Average AveragePresent 5796
Grades 2009 5,61 5,56 0,05 0,83Attendance 2009 88,80 88,37 0,43 0,48Attendance 2010 90,04 90,55 -0,51 -0,49
Absent 422Grades 2009 5,50 5,29 0,21 1,33
Attendance 2009 86,22 83,40 2,82 1,00Attendance 2010 80,00 80,75 -0,75 -0,16
Retired 331Grades 2009 5,29 4,94 0,35 0,98
Attendance 2009 82,81 78,31 4,50 0,81Attendance 2010 60,93 62,12 -1,19 -0,17
Notes: *: Signi�cant at 10%, **: Signi�cant at 5%, ***: Signi�cant at 1%. Standard
Errors were clustered at the school level for these calculations.
25
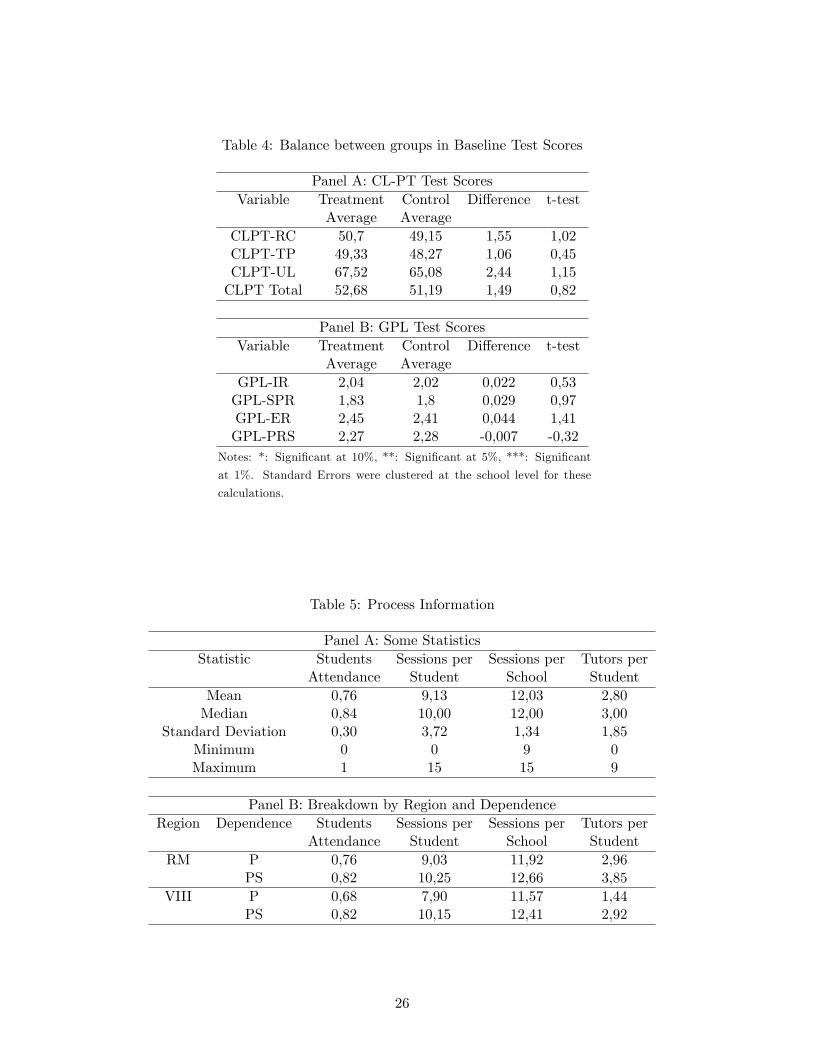
Table 4: Balance between groups in Baseline Test Scores
Panel A: CL-PT Test ScoresVariable Treatment Control Di¤erence t-test
Average AverageCLPT-RC 50,7 49,15 1,55 1,02CLPT-TP 49,33 48,27 1,06 0,45CLPT-UL 67,52 65,08 2,44 1,15CLPT Total 52,68 51,19 1,49 0,82
Panel B: GPL Test ScoresVariable Treatment Control Di¤erence t-test
Average AverageGPL-IR 2,04 2,02 0,022 0,53GPL-SPR 1,83 1,8 0,029 0,97GPL-ER 2,45 2,41 0,044 1,41GPL-PRS 2,27 2,28 -0,007 -0,32
Notes: *: Signi�cant at 10%, **: Signi�cant at 5%, ***: Signi�cant
at 1%. Standard Errors were clustered at the school level for these
calculations.
Table 5: Process Information
Panel A: Some StatisticsStatistic Students Sessions per Sessions per Tutors per
Attendance Student School StudentMean 0,76 9,13 12,03 2,80Median 0,84 10,00 12,00 3,00
Standard Deviation 0,30 3,72 1,34 1,85Minimum 0 0 9 0Maximum 1 15 15 9
Panel B: Breakdown by Region and DependenceRegion Dependence Students Sessions per Sessions per Tutors per
Attendance Student School StudentRM P 0,76 9,03 11,92 2,96
PS 0,82 10,25 12,66 3,85VIII P 0,68 7,90 11,57 1,44
PS 0,82 10,15 12,41 2,92
26
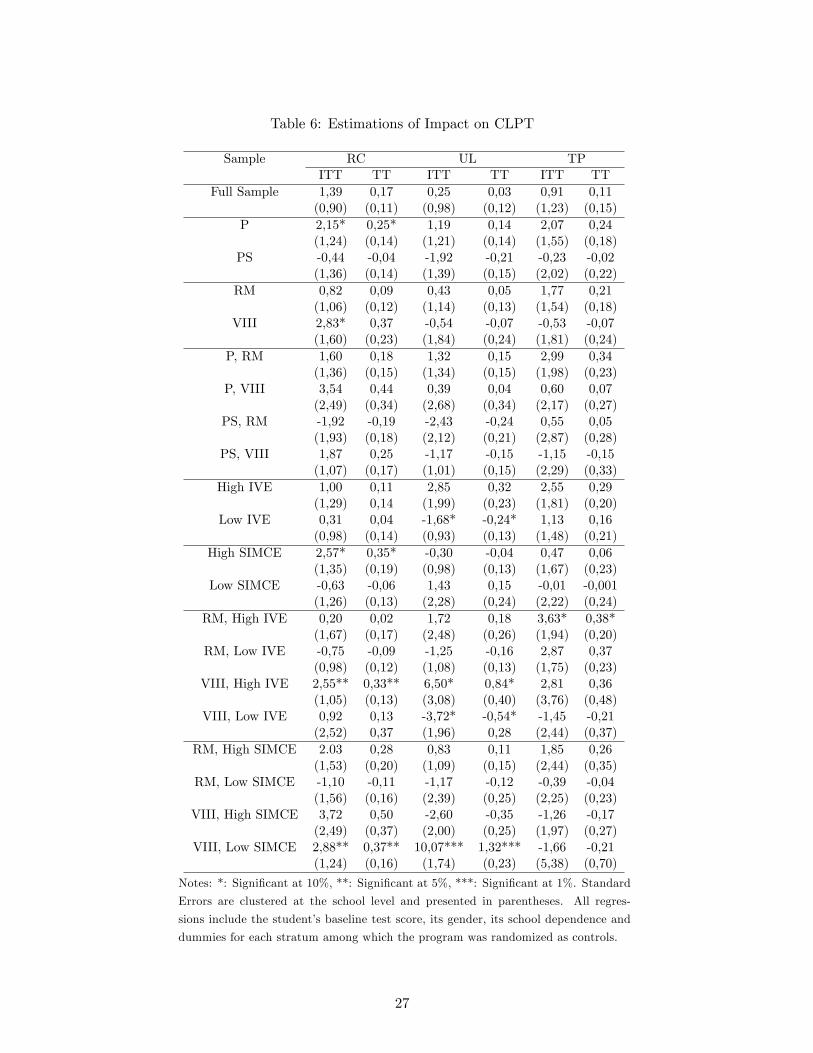
Table 6: Estimations of Impact on CLPT
Sample RC UL TPITT TT ITT TT ITT TT
Full Sample 1,39 0,17 0,25 0,03 0,91 0,11(0,90) (0,11) (0,98) (0,12) (1,23) (0,15)
P 2,15* 0,25* 1,19 0,14 2,07 0,24(1,24) (0,14) (1,21) (0,14) (1,55) (0,18)
PS -0,44 -0,04 -1,92 -0,21 -0,23 -0,02(1,36) (0,14) (1,39) (0,15) (2,02) (0,22)
RM 0,82 0,09 0,43 0,05 1,77 0,21(1,06) (0,12) (1,14) (0,13) (1,54) (0,18)
VIII 2,83* 0,37 -0,54 -0,07 -0,53 -0,07(1,60) (0,23) (1,84) (0,24) (1,81) (0,24)
P, RM 1,60 0,18 1,32 0,15 2,99 0,34(1,36) (0,15) (1,34) (0,15) (1,98) (0,23)
P, VIII 3,54 0,44 0,39 0,04 0,60 0,07(2,49) (0,34) (2,68) (0,34) (2,17) (0,27)
PS, RM -1,92 -0,19 -2,43 -0,24 0,55 0,05(1,93) (0,18) (2,12) (0,21) (2,87) (0,28)
PS, VIII 1,87 0,25 -1,17 -0,15 -1,15 -0,15(1,07) (0,17) (1,01) (0,15) (2,29) (0,33)
High IVE 1,00 0,11 2,85 0,32 2,55 0,29(1,29) 0,14 (1,99) (0,23) (1,81) (0,20)
Low IVE 0,31 0,04 -1,68* -0,24* 1,13 0,16(0,98) (0,14) (0,93) (0,13) (1,48) (0,21)
High SIMCE 2,57* 0,35* -0,30 -0,04 0,47 0,06(1,35) (0,19) (0,98) (0,13) (1,67) (0,23)
Low SIMCE -0,63 -0,06 1,43 0,15 -0,01 -0,001(1,26) (0,13) (2,28) (0,24) (2,22) (0,24)
RM, High IVE 0,20 0,02 1,72 0,18 3,63* 0,38*(1,67) (0,17) (2,48) (0,26) (1,94) (0,20)
RM, Low IVE -0,75 -0,09 -1,25 -0,16 2,87 0,37(0,98) (0,12) (1,08) (0,13) (1,75) (0,23)
VIII, High IVE 2,55** 0,33** 6,50* 0,84* 2,81 0,36(1,05) (0,13) (3,08) (0,40) (3,76) (0,48)
VIII, Low IVE 0,92 0,13 -3,72* -0,54* -1,45 -0,21(2,52) 0,37 (1,96) 0,28 (2,44) (0,37)
RM, High SIMCE 2.03 0,28 0,83 0,11 1,85 0,26(1,53) (0,20) (1,09) (0,15) (2,44) (0,35)
RM, Low SIMCE -1,10 -0,11 -1,17 -0,12 -0,39 -0,04(1,56) (0,16) (2,39) (0,25) (2,25) (0,23)
VIII, High SIMCE 3,72 0,50 -2,60 -0,35 -1,26 -0,17(2,49) (0,37) (2,00) (0,25) (1,97) (0,27)
VIII, Low SIMCE 2,88** 0,37** 10,07*** 1,32*** -1,66 -0,21(1,24) (0,16) (1,74) (0,23) (5,38) (0,70)
Notes: *: Signi�cant at 10%, **: Signi�cant at 5%, ***: Signi�cant at 1%. Standard
Errors are clustered at the school level and presented in parentheses. All regres-
sions include the student�s baseline test score, its gender, its school dependence and
dummies for each stratum among which the program was randomized as controls.
27
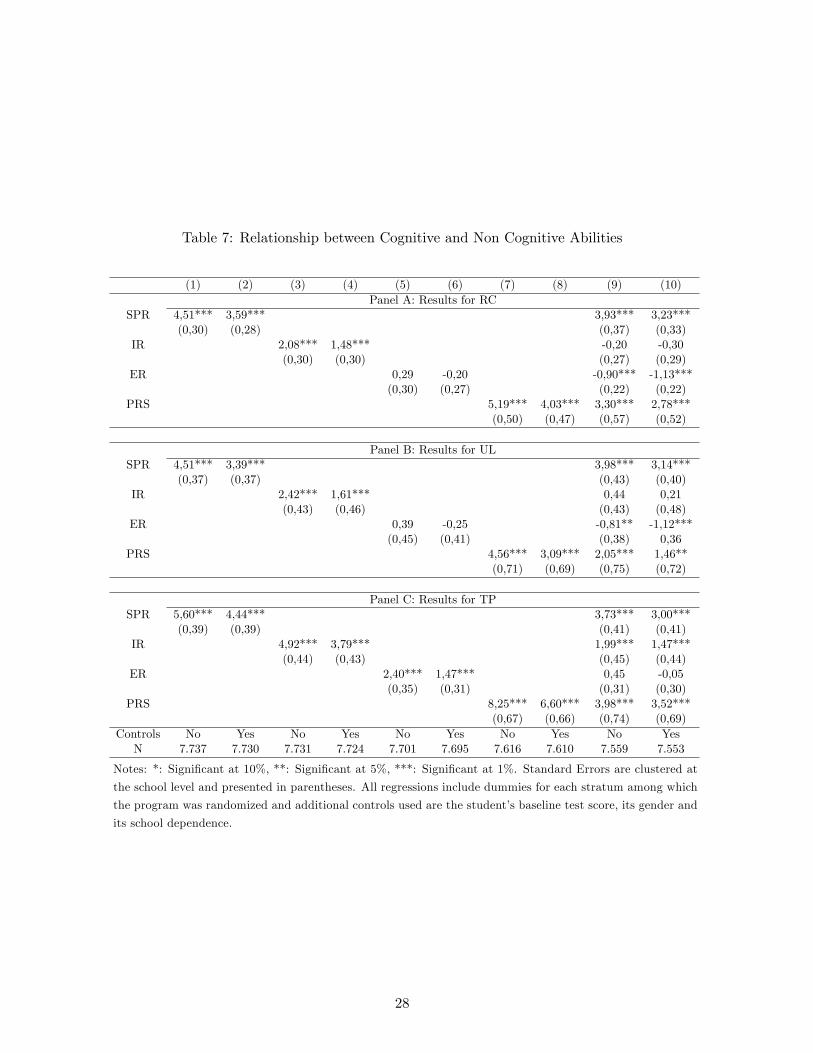
Table 7: Relationship between Cognitive and Non Cognitive Abilities
(1) (2) (3) (4) (5) (6) (7) (8) (9) (10)Panel A: Results for RC
SPR 4,51*** 3,59*** 3,93*** 3,23***(0,30) (0,28) (0,37) (0,33)
IR 2,08*** 1,48*** -0,20 -0,30(0,30) (0,30) (0,27) (0,29)
ER 0,29 -0,20 -0,90*** -1,13***(0,30) (0,27) (0,22) (0,22)
PRS 5,19*** 4,03*** 3,30*** 2,78***(0,50) (0,47) (0,57) (0,52)
Panel B: Results for ULSPR 4,51*** 3,39*** 3,98*** 3,14***
(0,37) (0,37) (0,43) (0,40)IR 2,42*** 1,61*** 0,44 0,21
(0,43) (0,46) (0,43) (0,48)ER 0,39 -0,25 -0,81** -1,12***
(0,45) (0,41) (0,38) 0,36PRS 4,56*** 3,09*** 2,05*** 1,46**
(0,71) (0,69) (0,75) (0,72)
Panel C: Results for TPSPR 5,60*** 4,44*** 3,73*** 3,00***
(0,39) (0,39) (0,41) (0,41)IR 4,92*** 3,79*** 1,99*** 1,47***
(0,44) (0,43) (0,45) (0,44)ER 2,40*** 1,47*** 0,45 -0,05
(0,35) (0,31) (0,31) (0,30)PRS 8,25*** 6,60*** 3,98*** 3,52***
(0,67) (0,66) (0,74) (0,69)Controls No Yes No Yes No Yes No Yes No YesN 7.737 7.730 7.731 7.724 7.701 7.695 7.616 7.610 7.559 7.553
Notes: *: Signi�cant at 10%, **: Signi�cant at 5%, ***: Signi�cant at 1%. Standard Errors are clustered at
the school level and presented in parentheses. All regressions include dummies for each stratum among which
the program was randomized and additional controls used are the student�s baseline test score, its gender and
its school dependence.
28
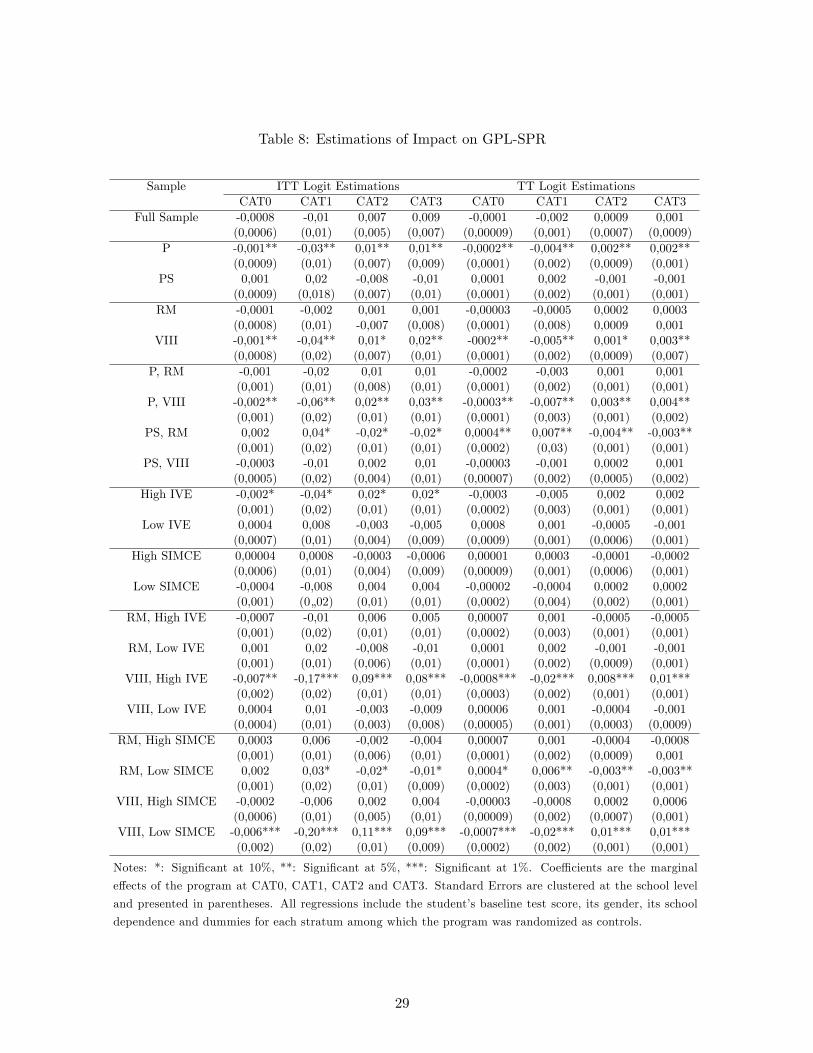
Table 8: Estimations of Impact on GPL-SPR
Sample ITT Logit Estimations TT Logit EstimationsCAT0 CAT1 CAT2 CAT3 CAT0 CAT1 CAT2 CAT3
Full Sample -0,0008 -0,01 0,007 0,009 -0,0001 -0,002 0,0009 0,001(0,0006) (0,01) (0,005) (0,007) (0,00009) (0,001) (0,0007) (0,0009)
P -0,001** -0,03** 0,01** 0,01** -0,0002** -0,004** 0,002** 0,002**(0,0009) (0,01) (0,007) (0,009) (0,0001) (0,002) (0,0009) (0,001)
PS 0,001 0,02 -0,008 -0,01 0,0001 0,002 -0,001 -0,001(0,0009) (0,018) (0,007) (0,01) (0,0001) (0,002) (0,001) (0,001)
RM -0,0001 -0,002 0,001 0,001 -0,00003 -0,0005 0,0002 0,0003(0,0008) (0,01) -0,007 (0,008) (0,0001) (0,008) 0,0009 0,001
VIII -0,001** -0,04** 0,01* 0,02** -0002** -0,005** 0,001* 0,003**(0,0008) (0,02) (0,007) (0,01) (0,0001) (0,002) (0,0009) (0,007)
P, RM -0,001 -0,02 0,01 0,01 -0,0002 -0,003 0,001 0,001(0,001) (0,01) (0,008) (0,01) (0,0001) (0,002) (0,001) (0,001)
P, VIII -0,002** -0,06** 0,02** 0,03** -0,0003** -0,007** 0,003** 0,004**(0,001) (0,02) (0,01) (0,01) (0,0001) (0,003) (0,001) (0,002)
PS, RM 0,002 0,04* -0,02* -0,02* 0,0004** 0,007** -0,004** -0,003**(0,001) (0,02) (0,01) (0,01) (0,0002) (0,03) (0,001) (0,001)
PS, VIII -0,0003 -0,01 0,002 0,01 -0,00003 -0,001 0,0002 0,001(0,0005) (0,02) (0,004) (0,01) (0,00007) (0,002) (0,0005) (0,002)
High IVE -0,002* -0,04* 0,02* 0,02* -0,0003 -0,005 0,002 0,002(0,001) (0,02) (0,01) (0,01) (0,0002) (0,003) (0,001) (0,001)
Low IVE 0,0004 0,008 -0,003 -0,005 0,0008 0,001 -0,0005 -0,001(0,0007) (0,01) (0,004) (0,009) (0,0009) (0,001) (0,0006) (0,001)
High SIMCE 0,00004 0,0008 -0,0003 -0,0006 0,00001 0,0003 -0,0001 -0,0002(0,0006) (0,01) (0,004) (0,009) (0,00009) (0,001) (0,0006) (0,001)
Low SIMCE -0,0004 -0,008 0,004 0,004 -0,00002 -0,0004 0,0002 0,0002(0,001) (0�02) (0,01) (0,01) (0,0002) (0,004) (0,002) (0,001)
RM, High IVE -0,0007 -0,01 0,006 0,005 0,00007 0,001 -0,0005 -0,0005(0,001) (0,02) (0,01) (0,01) (0,0002) (0,003) (0,001) (0,001)
RM, Low IVE 0,001 0,02 -0,008 -0,01 0,0001 0,002 -0,001 -0,001(0,001) (0,01) (0,006) (0,01) (0,0001) (0,002) (0,0009) (0,001)
VIII, High IVE -0,007** -0,17*** 0,09*** 0,08*** -0,0008*** -0,02*** 0,008*** 0,01***(0,002) (0,02) (0,01) (0,01) (0,0003) (0,002) (0,001) (0,001)
VIII, Low IVE 0,0004 0,01 -0,003 -0,009 0,00006 0,001 -0,0004 -0,001(0,0004) (0,01) (0,003) (0,008) (0,00005) (0,001) (0,0003) (0,0009)
RM, High SIMCE 0,0003 0,006 -0,002 -0,004 0,00007 0,001 -0,0004 -0,0008(0,001) (0,01) (0,006) (0,01) (0,0001) (0,002) (0,0009) 0,001
RM, Low SIMCE 0,002 0,03* -0,02* -0,01* 0,0004* 0,006** -0,003** -0,003**(0,001) (0,02) (0,01) (0,009) (0,0002) (0,003) (0,001) (0,001)
VIII, High SIMCE -0,0002 -0,006 0,002 0,004 -0,00003 -0,0008 0,0002 0,0006(0,0006) (0,01) (0,005) (0,01) (0,00009) (0,002) (0,0007) (0,001)
VIII, Low SIMCE -0,006*** -0,20*** 0,11*** 0,09*** -0,0007*** -0,02*** 0,01*** 0,01***(0,002) (0,02) (0,01) (0,009) (0,0002) (0,002) (0,001) (0,001)
Notes: *: Signi�cant at 10%, **: Signi�cant at 5%, ***: Signi�cant at 1%. Coe¢ cients are the marginal
e¤ects of the program at CAT0, CAT1, CAT2 and CAT3. Standard Errors are clustered at the school level
and presented in parentheses. All regressions include the student�s baseline test score, its gender, its school
dependence and dummies for each stratum among which the program was randomized as controls.
29
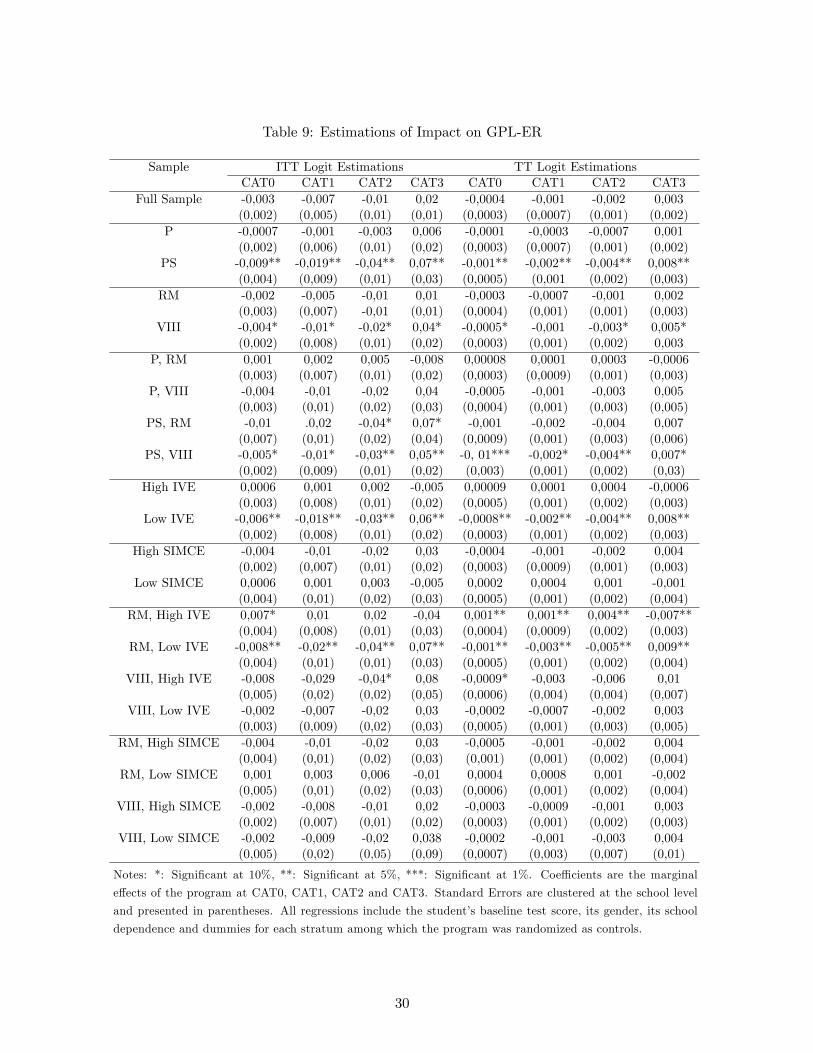
Table 9: Estimations of Impact on GPL-ER
Sample ITT Logit Estimations TT Logit EstimationsCAT0 CAT1 CAT2 CAT3 CAT0 CAT1 CAT2 CAT3
Full Sample -0,003 -0,007 -0,01 0,02 -0,0004 -0,001 -0,002 0,003(0,002) (0,005) (0,01) (0,01) (0,0003) (0,0007) (0,001) (0,002)
P -0,0007 -0,001 -0,003 0,006 -0,0001 -0,0003 -0,0007 0,001(0,002) (0,006) (0,01) (0,02) (0,0003) (0,0007) (0,001) (0,002)
PS -0,009** -0,019** -0,04** 0,07** -0,001** -0,002** -0,004** 0,008**(0,004) (0,009) (0,01) (0,03) (0,0005) (0,001 (0,002) (0,003)
RM -0,002 -0,005 -0,01 0,01 -0,0003 -0,0007 -0,001 0,002(0,003) (0,007) -0,01 (0,01) (0,0004) (0,001) (0,001) (0,003)
VIII -0,004* -0,01* -0,02* 0,04* -0,0005* -0,001 -0,003* 0,005*(0,002) (0,008) (0,01) (0,02) (0,0003) (0,001) (0,002) 0,003
P, RM 0,001 0,002 0,005 -0,008 0,00008 0,0001 0,0003 -0,0006(0,003) (0,007) (0,01) (0,02) (0,0003) (0,0009) (0,001) (0,003)
P, VIII -0,004 -0,01 -0,02 0,04 -0,0005 -0,001 -0,003 0,005(0,003) (0,01) (0,02) (0,03) (0,0004) (0,001) (0,003) (0,005)
PS, RM -0,01 .0,02 -0,04* 0,07* -0,001 -0,002 -0,004 0,007(0,007) (0,01) (0,02) (0,04) (0,0009) (0,001) (0,003) (0,006)
PS, VIII -0,005* -0,01* -0,03** 0,05** -0, 01*** -0,002* -0,004** 0,007*(0,002) (0,009) (0,01) (0,02) (0,003) (0,001) (0,002) (0,03)
High IVE 0,0006 0,001 0,002 -0,005 0,00009 0,0001 0,0004 -0,0006(0,003) (0,008) (0,01) (0,02) (0,0005) (0,001) (0,002) (0,003)
Low IVE -0,006** -0,018** -0,03** 0,06** -0,0008** -0,002** -0,004** 0,008**(0,002) (0,008) (0,01) (0,02) (0,0003) (0,001) (0,002) (0,003)
High SIMCE -0,004 -0,01 -0,02 0,03 -0,0004 -0,001 -0,002 0,004(0,002) (0,007) (0,01) (0,02) (0,0003) (0,0009) (0,001) (0,003)
Low SIMCE 0,0006 0,001 0,003 -0,005 0,0002 0,0004 0,001 -0,001(0,004) (0,01) (0,02) (0,03) (0,0005) (0,001) (0,002) (0,004)
RM, High IVE 0,007* 0,01 0,02 -0,04 0,001** 0,001** 0,004** -0,007**(0,004) (0,008) (0,01) (0,03) (0,0004) (0,0009) (0,002) (0,003)
RM, Low IVE -0,008** -0,02** -0,04** 0,07** -0,001** -0,003** -0,005** 0,009**(0,004) (0,01) (0,01) (0,03) (0,0005) (0,001) (0,002) (0,004)
VIII, High IVE -0,008 -0,029 -0,04* 0,08 -0,0009* -0,003 -0,006 0,01(0,005) (0,02) (0,02) (0,05) (0,0006) (0,004) (0,004) (0,007)
VIII, Low IVE -0,002 -0,007 -0,02 0,03 -0,0002 -0,0007 -0,002 0,003(0,003) (0,009) (0,02) (0,03) (0,0005) (0,001) (0,003) (0,005)
RM, High SIMCE -0,004 -0,01 -0,02 0,03 -0,0005 -0,001 -0,002 0,004(0,004) (0,01) (0,02) (0,03) (0,001) (0,001) (0,002) (0,004)
RM, Low SIMCE 0,001 0,003 0,006 -0,01 0,0004 0,0008 0,001 -0,002(0,005) (0,01) (0,02) (0,03) (0,0006) (0,001) (0,002) (0,004)
VIII, High SIMCE -0,002 -0,008 -0,01 0,02 -0,0003 -0,0009 -0,001 0,003(0,002) (0,007) (0,01) (0,02) (0,0003) (0,001) (0,002) (0,003)
VIII, Low SIMCE -0,002 -0,009 -0,02 0,038 -0,0002 -0,001 -0,003 0,004(0,005) (0,02) (0,05) (0,09) (0,0007) (0,003) (0,007) (0,01)
Notes: *: Signi�cant at 10%, **: Signi�cant at 5%, ***: Signi�cant at 1%. Coe¢ cients are the marginal
e¤ects of the program at CAT0, CAT1, CAT2 and CAT3. Standard Errors are clustered at the school level
and presented in parentheses. All regressions include the student�s baseline test score, its gender, its school
dependence and dummies for each stratum among which the program was randomized as controls.
30
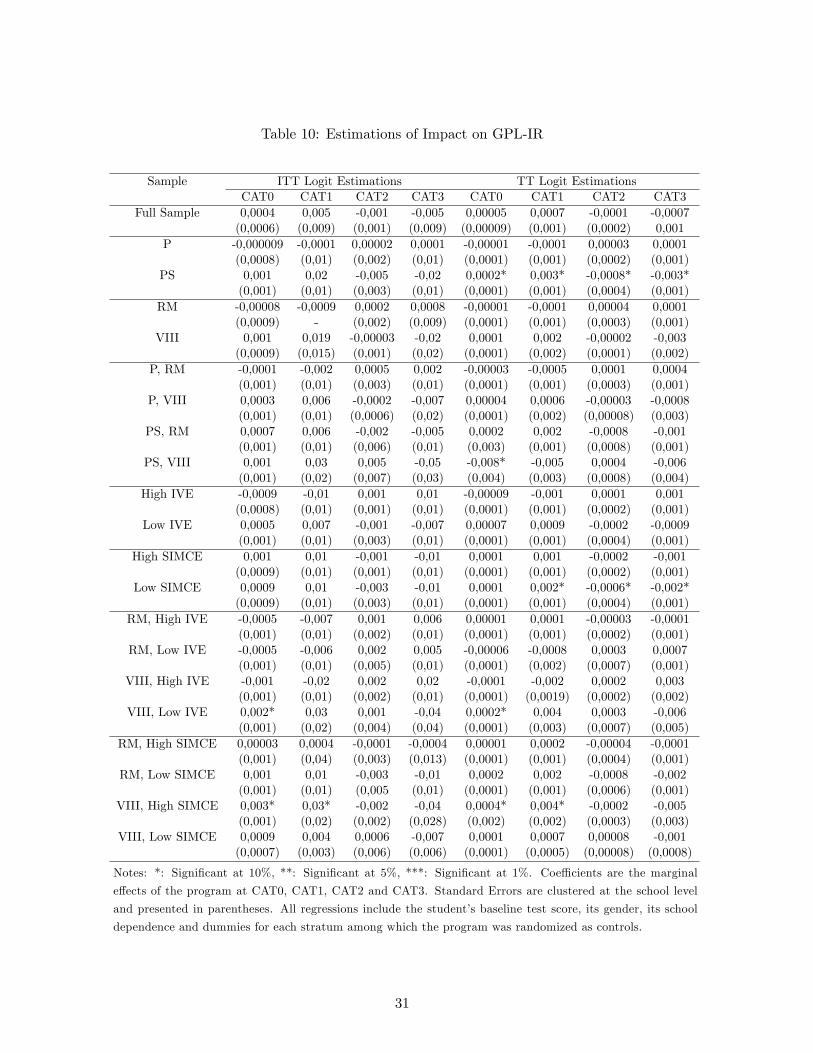
Table 10: Estimations of Impact on GPL-IR
Sample ITT Logit Estimations TT Logit EstimationsCAT0 CAT1 CAT2 CAT3 CAT0 CAT1 CAT2 CAT3
Full Sample 0,0004 0,005 -0,001 -0,005 0,00005 0,0007 -0,0001 -0,0007(0,0006) (0,009) (0,001) (0,009) (0,00009) (0,001) (0,0002) 0,001
P -0,000009 -0,0001 0,00002 0,0001 -0,00001 -0,0001 0,00003 0,0001(0,0008) (0,01) (0,002) (0,01) (0,0001) (0,001) (0,0002) (0,001)
PS 0,001 0,02 -0,005 -0,02 0,0002* 0,003* -0,0008* -0,003*(0,001) (0,01) (0,003) (0,01) (0,0001) (0,001) (0,0004) (0,001)
RM -0,00008 -0,0009 0,0002 0,0008 -0,00001 -0,0001 0,00004 0,0001(0,0009) - (0,002) (0,009) (0,0001) (0,001) (0,0003) (0,001)
VIII 0,001 0,019 -0,00003 -0,02 0,0001 0,002 -0,00002 -0,003(0,0009) (0,015) (0,001) (0,02) (0,0001) (0,002) (0,0001) (0,002)
P, RM -0,0001 -0,002 0,0005 0,002 -0,00003 -0,0005 0,0001 0,0004(0,001) (0,01) (0,003) (0,01) (0,0001) (0,001) (0,0003) (0,001)
P, VIII 0,0003 0,006 -0,0002 -0,007 0,00004 0,0006 -0,00003 -0,0008(0,001) (0,01) (0,0006) (0,02) (0,0001) (0,002) (0,00008) (0,003)
PS, RM 0,0007 0,006 -0,002 -0,005 0,0002 0,002 -0,0008 -0,001(0,001) (0,01) (0,006) (0,01) (0,003) (0,001) (0,0008) (0,001)
PS, VIII 0,001 0,03 0,005 -0,05 -0,008* -0,005 0,0004 -0,006(0,001) (0,02) (0,007) (0,03) (0,004) (0,003) (0,0008) (0,004)
High IVE -0,0009 -0,01 0,001 0,01 -0,00009 -0,001 0,0001 0,001(0,0008) (0,01) (0,001) (0,01) (0,0001) (0,001) (0,0002) (0,001)
Low IVE 0,0005 0,007 -0,001 -0,007 0,00007 0,0009 -0,0002 -0,0009(0,001) (0,01) (0,003) (0,01) (0,0001) (0,001) (0,0004) (0,001)
High SIMCE 0,001 0,01 -0,001 -0,01 0,0001 0,001 -0,0002 -0,001(0,0009) (0,01) (0,001) (0,01) (0,0001) (0,001) (0,0002) (0,001)
Low SIMCE 0,0009 0,01 -0,003 -0,01 0,0001 0,002* -0,0006* -0,002*(0,0009) (0,01) (0,003) (0,01) (0,0001) (0,001) (0,0004) (0,001)
RM, High IVE -0,0005 -0,007 0,001 0,006 0,00001 0,0001 -0,00003 -0,0001(0,001) (0,01) (0,002) (0,01) (0,0001) (0,001) (0,0002) (0,001)
RM, Low IVE -0,0005 -0,006 0,002 0,005 -0,00006 -0,0008 0,0003 0,0007(0,001) (0,01) (0,005) (0,01) (0,0001) (0,002) (0,0007) (0,001)
VIII, High IVE -0,001 -0,02 0,002 0,02 -0,0001 -0,002 0,0002 0,003(0,001) (0,01) (0,002) (0,01) (0,0001) (0,0019) (0,0002) (0,002)
VIII, Low IVE 0,002* 0,03 0,001 -0,04 0,0002* 0,004 0,0003 -0,006(0,001) (0,02) (0,004) (0,04) (0,0001) (0,003) (0,0007) (0,005)
RM, High SIMCE 0,00003 0,0004 -0,0001 -0,0004 0,00001 0,0002 -0,00004 -0,0001(0,001) (0,04) (0,003) (0,013) (0,0001) (0,001) (0,0004) (0,001)
RM, Low SIMCE 0,001 0,01 -0,003 -0,01 0,0002 0,002 -0,0008 -0,002(0,001) (0,01) (0,005 (0,01) (0,0001) (0,001) (0,0006) (0,001)
VIII, High SIMCE 0,003* 0,03* -0,002 -0,04 0,0004* 0,004* -0,0002 -0,005(0,001) (0,02) (0,002) (0,028) (0,002) (0,002) (0,0003) (0,003)
VIII, Low SIMCE 0,0009 0,004 0,0006 -0,007 0,0001 0,0007 0,00008 -0,001(0,0007) (0,003) (0,006) (0,006) (0,0001) (0,0005) (0,00008) (0,0008)
Notes: *: Signi�cant at 10%, **: Signi�cant at 5%, ***: Signi�cant at 1%. Coe¢ cients are the marginal
e¤ects of the program at CAT0, CAT1, CAT2 and CAT3. Standard Errors are clustered at the school level
and presented in parentheses. All regressions include the student�s baseline test score, its gender, its school
dependence and dummies for each stratum among which the program was randomized as controls.
31
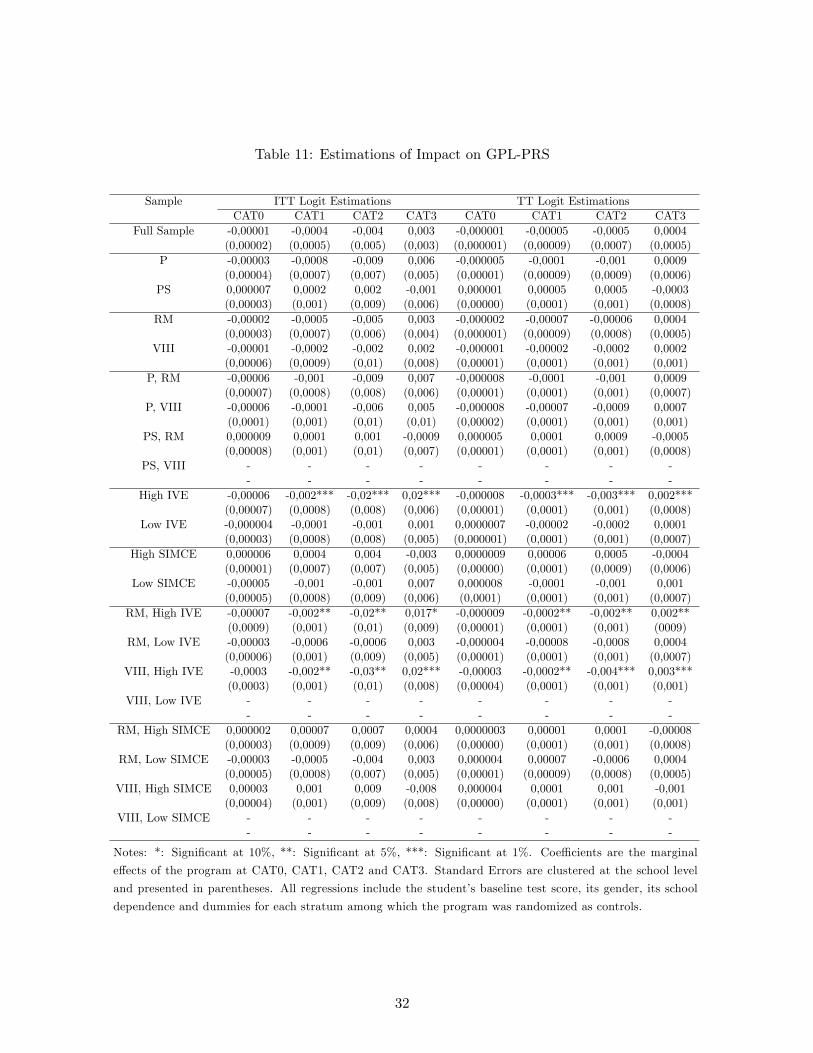
Table 11: Estimations of Impact on GPL-PRS
Sample ITT Logit Estimations TT Logit EstimationsCAT0 CAT1 CAT2 CAT3 CAT0 CAT1 CAT2 CAT3
Full Sample -0,00001 -0,0004 -0,004 0,003 -0,000001 -0,00005 -0,0005 0,0004(0,00002) (0,0005) (0,005) (0,003) (0,000001) (0,00009) (0,0007) (0,0005)
P -0,00003 -0,0008 -0,009 0,006 -0,000005 -0,0001 -0,001 0,0009(0,00004) (0,0007) (0,007) (0,005) (0,00001) (0,00009) (0,0009) (0,0006)
PS 0,000007 0,0002 0,002 -0,001 0,000001 0,00005 0,0005 -0,0003(0,00003) (0,001) (0,009) (0,006) (0,00000) (0,0001) (0,001) (0,0008)
RM -0,00002 -0,0005 -0,005 0,003 -0,000002 -0,00007 -0,00006 0,0004(0,00003) (0,0007) (0,006) (0,004) (0,000001) (0,00009) (0,0008) (0,0005)
VIII -0,00001 -0,0002 -0,002 0,002 -0,000001 -0,00002 -0,0002 0,0002(0,00006) (0,0009) (0,01) (0,008) (0,00001) (0,0001) (0,001) (0,001)
P, RM -0,00006 -0,001 -0,009 0,007 -0,000008 -0,0001 -0,001 0,0009(0,00007) (0,0008) (0,008) (0,006) (0,00001) (0,0001) (0,001) (0,0007)
P, VIII -0,00006 -0,0001 -0,006 0,005 -0,000008 -0,00007 -0,0009 0,0007(0,0001) (0,001) (0,01) (0,01) (0,00002) (0,0001) (0,001) (0,001)
PS, RM 0,000009 0,0001 0,001 -0,0009 0,000005 0,0001 0,0009 -0,0005(0,00008) (0,001) (0,01) (0,007) (0,00001) (0,0001) (0,001) (0,0008)
PS, VIII - - - - - - - -- - - - - - - -
High IVE -0,00006 -0,002*** -0,02*** 0,02*** -0,000008 -0,0003*** -0,003*** 0,002***(0,00007) (0,0008) (0,008) (0,006) (0,00001) (0,0001) (0,001) (0,0008)
Low IVE -0,000004 -0,0001 -0,001 0,001 0,0000007 -0,00002 -0,0002 0,0001(0,00003) (0,0008) (0,008) (0,005) (0,000001) (0,0001) (0,001) (0,0007)
High SIMCE 0,000006 0,0004 0,004 -0,003 0,0000009 0,00006 0,0005 -0,0004(0,00001) (0,0007) (0,007) (0,005) (0,00000) (0,0001) (0,0009) (0,0006)
Low SIMCE -0,00005 -0,001 -0,001 0,007 0,000008 -0,0001 -0,001 0,001(0,00005) (0,0008) (0,009) (0,006) (0,0001) (0,0001) (0,001) (0,0007)
RM, High IVE -0,00007 -0,002** -0,02** 0,017* -0,000009 -0,0002** -0,002** 0,002**(0,0009) (0,001) (0,01) (0,009) (0,00001) (0,0001) (0,001) (0009)
RM, Low IVE -0,00003 -0,0006 -0,0006 0,003 -0,000004 -0,00008 -0,0008 0,0004(0,00006) (0,001) (0,009) (0,005) (0,00001) (0,0001) (0,001) (0,0007)
VIII, High IVE -0,0003 -0,002** -0,03** 0,02*** -0,00003 -0,0002** -0,004*** 0,003***(0,0003) (0,001) (0,01) (0,008) (0,00004) (0,0001) (0,001) (0,001)
VIII, Low IVE - - - - - - - -- - - - - - - -
RM, High SIMCE 0,000002 0,00007 0,0007 0,0004 0,0000003 0,00001 0,0001 -0,00008(0,00003) (0,0009) (0,009) (0,006) (0,00000) (0,0001) (0,001) (0,0008)
RM, Low SIMCE -0,00003 -0,0005 -0,004 0,003 0,000004 0,00007 -0,0006 0,0004(0,00005) (0,0008) (0,007) (0,005) (0,00001) (0,00009) (0,0008) (0,0005)
VIII, High SIMCE 0,00003 0,001 0,009 -0,008 0,000004 0,0001 0,001 -0,001(0,00004) (0,001) (0,009) (0,008) (0,00000) (0,0001) (0,001) (0,001)
VIII, Low SIMCE - - - - - - - -- - - - - - - -
Notes: *: Signi�cant at 10%, **: Signi�cant at 5%, ***: Signi�cant at 1%. Coe¢ cients are the marginal
e¤ects of the program at CAT0, CAT1, CAT2 and CAT3. Standard Errors are clustered at the school level
and presented in parentheses. All regressions include the student�s baseline test score, its gender, its school
dependence and dummies for each stratum among which the program was randomized as controls.
32
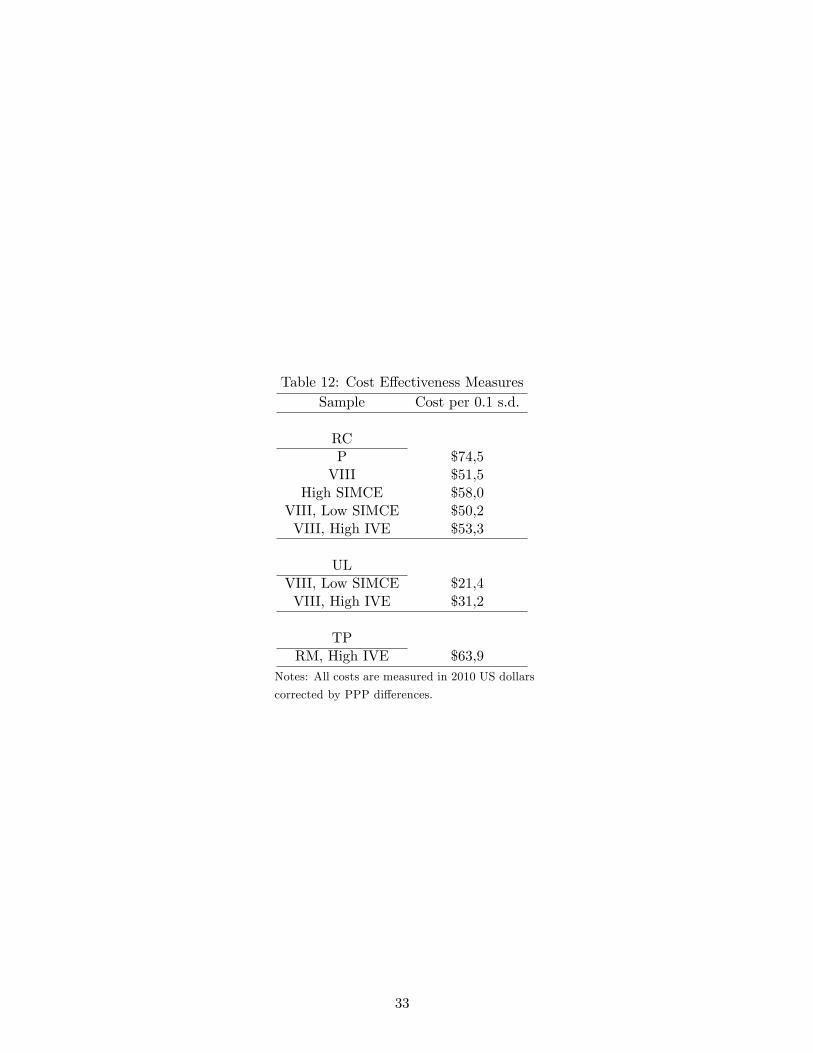
Table 12: Cost E¤ectiveness MeasuresSample Cost per 0.1 s.d.
RCP $74,5VIII $51,5
High SIMCE $58,0VIII, Low SIMCE $50,2VIII, High IVE $53,3
ULVIII, Low SIMCE $21,4VIII, High IVE $31,2
TPRM, High IVE $63,9
Notes: All costs are measured in 2010 US dollars
corrected by PPP di¤erences.
33
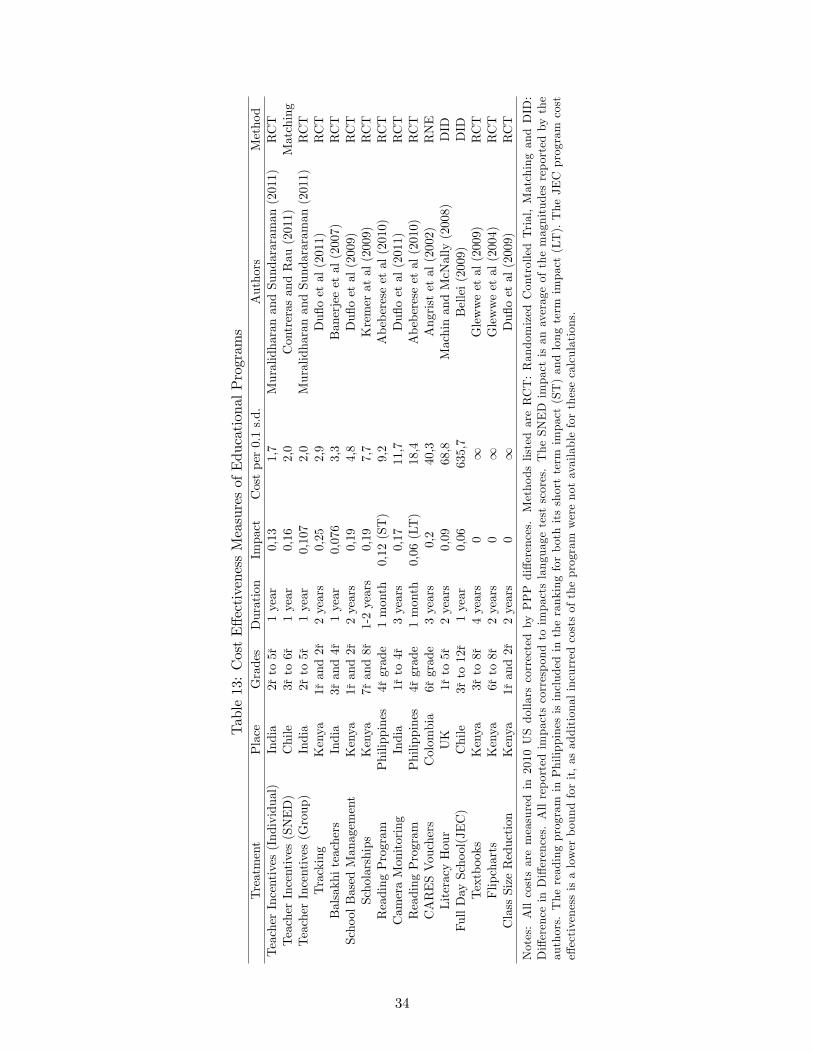
Table13:CostE¤ectivenessMeasuresofEducationalPrograms
Treatment
Place
Grades
Duration
Impact
Costper0.1s.d.
Authors
Method
TeacherIncentives(Individual)
India
2 µrto5 µr
1year
0,13
1,7
MuralidharanandSundararaman(2011)
RCT
TeacherIncentives(SNED)
Chile
3 µrto6 µr
1year
0,16
2,0
ContrerasandRau(2011)
Matching
TeacherIncentives(Group)
India
2 µrto5 µr
1year
0,107
2,0
MuralidharanandSundararaman(2011)
RCT
Tracking
Kenya
1 µrand2 µr
2years
0,25
2,9
Du�oetal(2011)
RCT
Balsakhiteachers
India
3 µrand4 µr
1year
0,076
3,3
Banerjeeetal(2007)
RCT
SchoolBasedManagement
Kenya
1 µrand2 µr
2years
0,19
4,8
Du�oetal(2009)
RCT
Scholarships
Kenya
7 µrand8 µr
1-2years
0,19
7,7
Kremeratal(2009)
RCT
ReadingProgram
Philippines
4 µrgrade
1month
0,12(ST)
9,2
Abebereseetal(2010)
RCT
CameraMonitoring
India
1 µrto4 µr
3years
0,17
11,7
Du�oetal(2011)
RCT
ReadingProgram
Philippines
4 µrgrade
1month
0,06(LT)
18,4
Abebereseetal(2010)
RCT
CARESVouchers
Colombia
6 µrgrade
3years
0,2
40,3
Angristetal(2002)
RNE
LiteracyHour
UK
1 µrto5 µr
2years
0,09
68,8
MachinandMcNally(2008)
DID
FullDaySchool(JEC)
Chile
3 µrto12µr
1year
0,06
635,7
Bellei(2009)
DID
Textbooks
Kenya
3 µrto8 µr
4years
01
Glewweetal(2009)
RCT
Flipcharts
Kenya
6 µrto8 µr
2years
01
Glewweetal(2004)
RCT
ClassSizeReduction
Kenya
1 µrand2 µr
2years
01
Du�oetal(2009)
RCT
Notes:Allcostsaremeasuredin2010USdollarscorrectedby
PPPdi¤erences.MethodslistedareRCT:RandomizedControlledTrial,MatchingandDID:
Di¤erenceinDi¤erences.Allreportedimpactscorrespondtoimpactslanguagetestscores.TheSNEDimpactisanaverageofthemagnitudesreportedbythe
authors.ThereadingprograminPhilippinesisincludedintherankingforbothitsshortterm
impact(ST)andlongterm
impact(LT).TheJECprogramcost
e¤ectivenessisalowerboundforit,asadditionalincurredcostsoftheprogramwerenotavailableforthesecalculations.
34


