

Effects of thermal recycling temperatures on the
reinforcement potential of glass fibers
U. Nagel1, L. Yang1, C. C. Kao2, J. L. Thomason1
1University of Strathclyde, Department of Mechanical and Aerospace
Engineering
2University of Strathclyde, Design, Manufacture and Engineering Management

U. Nagel, L. Yang, C. C. Kao, J. L. Thomason
75 Montrose Street, Glasgow G1 1XJ, United Kingdom.
[email protected]; +44 (0) 141 574 5085
Abstract
In the present work the reinforcement potential of thermally recycled glass fibers
in injection molded Polypropylene (PP) composites was investigated. Microbond
tests showed that fiber sizing lost its compatibility to the PP matrix after
exposure to temperatures of 250 °C in air. The drop of the adhesion between
fibers and PP was mirrored by a large reduction of the tensile strength of the
injection molded PP composites. In inert atmosphere the degradation of the
fiber sizing and the reduction of the IFSS were less rapid than in air but no
significant difference was observed above 400 °C. It was concluded that
thermally recycled glass fibers will require a post-treatment to act as an
effective reinforcement in injection molded PP composites even if the thermal
recycling was performed in an inert atmosphere. The post-treatment will need to
improve the compatibility of the fibers to the polymer matrix and the fiber
strength.

1. Introduction
The development of a recycling process for end-of-life Glass Fiber Reinforced
Plastics (GFRPs) has become important. GFRPs account for more than 90% of
all produced composites. Landfilling of GFRP waste is rapidly becoming
economically, environmentally and legislatively unacceptable [1–3].
Transportation and wind energy are major consumers of GFRPs [4]. The wind
turbine industry is experiencing rapid growth and some countries like Germany
have banned the disposal of GFRP in landfill. The European Union has
released the ‘End of Life Vehicles’ directive which requires car manufacturers to
increase the recyclability of cars to 85 % by 2015 [1, 2]. In the light of these
developments, the need for a cost-effective recycling process for GFRPs has
become critical. Composites are generally difficult to recycle because they
consist of at least two different phases. In addition, most glass fiber composites
are based on thermoset matrices [3] which form chemical crosslinks and are
generally not simple to reprocess.
Mechanical, chemical and thermal recycling processes to separate glass fibers
from thermoset matrices have been investigated in several studies. The
reinforcement efficiency of mechanically recycled fibers is low compared to new
glass fibers because the fibers are short and the fiber surface is not clean.
Chemical recycling processes are still at an early stage of development and are
often limited to specific polymer matrices or involve the use of hazardous
chemicals [1, 3]. Thermal recycling processes can provide relatively long and
clean fibers without the use of chemicals. GFRPs were thermally recycled in a
fluidized bed reactor [5] or via pyrolysis [6, 7]. The recycled fibers were
incorporated into dough molding compound (DMC) composites and bulk
molding compound (BMC) composites. The mechanical properties of the
composites decreased when new glass fibers were replaced by the thermally
recycled glass fibers. The reduction of the composite properties can at least
partially be attributed to a degradation of the glass fiber strength due to
exposure to high temperatures. The strength reduction of glass fibers after
exposure to high temperatures was found to be temperature and time
dependent. Higher temperatures caused a larger drop of the tensile strength
and the retained strength of the fibers decreased as a function of the time until it
reached a very low asymptotic value [8]. According to Jenkins et al. [9] the
strength reduction is caused by at least two different mechanisms. One
mechanism is associated with the degradation of the glass fiber sizing. It was
observed that glass fibers without protective sizing are more susceptible to the
formation of surface flaws due to mechanical handling. The authors postulated
that the second mechanism of strength loss can be attributed to a surface
dehydroxilation or to structural changes of the glass itself [10].
Discontinuous glass fiber thermoplastic composites are an interesting potential
application for fibers produced by GFRP thermal recycling processes such as
the fluidized bed described by Kennerly et al [5]. Similar to other studies they
investigated thermoset composites based on thermally recycled glass fibers [6–
8]. Thermoplastic composites based on mechanically recycled glass fibers have
also been studied [11, 12] but less work has been done on the performance of
thermoplastic composites based on thermally recycled glass fibers. Roux et al.
[13] thermally preconditioned glass fibers before composite processing and

incorporated them into injection molded polypropylene (PP) composites.
However, they performed the thermal preconditioning over a period of 12 hours
which is significantly longer than a thermal recycling process would take and the
aim of their study was to investigate the influence of coupling agents and glass
fiber sizings on the performance of glass fiber PP composites. Their results
demonstrated the importance of glass fiber sizing for glass fiber PP composites.
Even after a prolonged thermal treatment the mechanical performance of the
injection molded composites improved significantly when sizing was applied to
the fibers. The authors explained the beneficial effect of the sizing with an
improvement of the interfacial adhesion between fiber and matrix.
In the present study, the interfacial adhesion between fiber and matrix was
studied in the light of the reinforcement potential of thermally recycled glass
fibers. Sized glass fibers were thermally conditioned at different temperatures in
air and inert atmosphere to imitate thermal recycling processes like the fluidized
bed process [5] and pyrolysis [6]. Microbond tests were performed to study the
effect of the thermal conditioning on the fiber sizing and the interfacial adhesion
between glass fiber and PP. Glass fiber PP composites were injection molded
and mechanically tested to assess the influence of the interfacial adhesion on
the macromechanical composite performance.
2. Experimental
2.1 Materials
The present study is based on commercial Advantex glass fibers with a
diameter of 12.7 ± 0.1 µm. The fibers were received as chopped bundles with a

polypropylene compatible sizing. The average length of the fibers was
measured to be 3.33 ± 0.04 mm which is significantly shorter than the nominal
fiber length of 4 mm as stated by the manufacturer. SABIC® PP 579 S
Polypropylene (PP) was used as composite matrix. 1 wt% Polybond 3200
maleic anhydride-grafted polypropylene (MAPP) by PP weight was used to
improve the interaction between fiber and matrix.
The procedure of other studies was followed to perform the thermal
preconditioning of the glass fibers [9, 14, 15]. A carbolite CWF 12/13 furnace
was used to thermally precondition the glass fibers under air. The fibers were
placed in a preheated furnace and treated at different temperatures. After 25
min the fibers were allowed to cool down at ambient temperature (21 ± 2 °C)
outside of the furnace. A NETSZCH STA 449 F1 Jupiter® thermal analyzer was
used to thermally precondition the glass fibers at different temperatures in a
nitrogen atmosphere. The temperature profile consisted of dynamic section with
a heating rate of 25 °C/min and an isothermal section of 25 min. After the
isothermal section the fibers were cooled down with a cooling rate of 25 °C/min.
The temperature profile for the treatment in a nitrogen rich atmosphere was
therefore similar but not identical to the temperature profile for the treatment in
air. The temperature profile for the heat treatment in a nitrogen rich atmosphere
resembled pyrolysis processes which are batch processes and involve heating
up and cooling down of the pyrolysis reactor while the samples are inside the
reactor [6, 7]. The heating up and cooling down of the glass fibers in the thermal
analyzer also ensured that the fibers were not exposed to air at any point of the

thermal conditioning. The heat treatment under air simulates a fluidized bed
process where the fibers are fed into the preheated fluidized bed [5].
A Betol BC25 single screw extruder was used to compound the PP and MAPP
with the fibers that were thermally conditioned in air. The processing barrel zone
temperatures were set to 170 °C – 220 °C. The extruded material was drawn
through a water bath and cut into pellets using a rotary cutter. The pelletized
material was fed into an Arburg 170-90/200 injection molding machine to
produce dog-bone shaped multipurpose test specimens (ISO 3167, Type B).
The barrel temperatures were set to 210 °C – 230 °C and the mold temperature
was set to 35 °C. The fiber weight fraction of the composites was measured to
be 29.3 ± 0.3 wt% via ashing of the PP and weighting of the fibers. The void
content of the composites was determined to 1.2 ± 0.2 % via density
measurements according to ASTM 2734.
2.2 Macromechanical testing
The tensile tests of the injection molded composites were guided by the
standard ISO 527. An Instron 5969 testing machine equipped with a 50 kN load
cell was used to perform the tensile test. The displacement rate was set to 1
mm/min and the strain was recorded with a video extensometer. The
unreinforced PP was tested in the same way like the composites but the
displacement rate was increased to 5 mm/min after reaching 5 % strain to
reduce the testing time.
2.3 Microstructural characterization
Microbond tests

The PP pellets were heated to 200 °C on a glass slide which was placed on a
hot plate. After 45 s the PP pellets were molten and drawn to form fibers. The
microbond tests were performed on the same glass fibers and PP that was
used to prepare composite samples. Figure 1 illustrates the procedure of the
microbond sample preparation. Tweezers were used to extract single fibers
from fiber bundles. Great care was taken not to touch the center of the glass
fibers. A single glass fiber was suspended on double sided sticky tape next to a
bright desk light and a PP fiber was knotted around the suspended glass fiber.
Then the free ends of the PP fiber were trimmed. It was necessary to trim the
PP fiber close to the knot to reduce the droplet size of the microbond samples.
Glass fibers that were exposed to high temperatures have a low tensile strength
and might break during the microbond test. A small microbond droplet debonds
at lower loads than a large droplet and reduces the probability of fiber breakage.
To cut the PP fiber close to the knot the movement of the PP fiber was
restrained by sticking the fiber ends to double sided sticky tape. Vanna's-Type
microscissors (Straight 80mm provided by Agar scientific) enabled high
precision cutting of the PP fiber.
After cutting the PP fiber, the glass fiber with the PP knot was glued onto a
washer. Two component Araldite epoxy adhesive was applied on top of the
sticky tape and glass fibers. The PP droplets were formed at 220 °C in an OV-
11 vacuum oven that was purged with nitrogen. A procedure as described by
Yang and Thomason [16, 17] was used to test the microbond samples using
washers instead of card frames as sample holders.
Fiber length measurements
A procedure similar to Hartwich et al [18] was used to determine the length of
the glass fibers in the injection molded tensile bars. Glass fibers were extracted
from injection molded tensile bars using an ashing process. The ashing process
was performed in a programmable Carbolite CWF 12/13 furnace. Glass fibers
from the center of the tensile bar were dispersed in water. The dispersion was
diluted and poured into petri-dishes. The petri-dishes were placed into the dark
field box of an IDM FASEP fiber length measurement system and scanned. The
scanned images were analyzed using the macro of the IDM FASEP fiber length
measurement system which is implemented into the Image Pro image analysis
software. The same procedure including the ashing process was followed to
determine the length of the as received fibers before composite processing.
Thermal gravimetric analysis
The weight loss of glass fibers due to exposure to high temperatures was
measured using a TA Instruments Q50 thermogravimetric analyzer. The
analysis was performed under air and nitrogen with a heating rate of 10 °C/min.
3 Results and Discussion
3.1 Thermal gravimetric analysis
The data of the thermal gravimetric analysis (TGA) in Figure 2 indicates that the
organic fraction of the glass fiber sizing degraded at elevated temperatures.
Most of the mass loss was recorded below 300 °C when the TGA was
performed in air. Similar to Feih et al. [8] the present study showed that the
presence of oxygen promotes the degradation of the glass fiber sizing. No
significant mass loss was observed below 300 °C under a nitrogen atmosphere.

Above 450 °C similar mass losses were observed under a nitrogen atmosphere
and air. In contrast, Feih et al. [8] observed that the loss of ignition in the
presence of air was higher than in a nitrogen atmosphere. They observed the
formation of char on the fiber surface when the TGA was performed in a
nitrogen atmosphere. In the present study the sizing was apparently completely
decomposed. Both studies show that glass fibers will lose their sizing during a
thermal recycling process even if they are processed under an inert
atmosphere.
3.2 Fiber-matrix adhesion determined from microbond tests
Figure 3 shows the measured values for the apparent interfacial shear strength
(IFSS) between PP and glass fibers that were preconditioned at different
temperatures in air and nitrogen. Each data point represents at least 15
successfully debonded microbond samples. The IFSS decreased moderately
due to the thermal preconditioning at 200 °C in air. A more pronounced drop
was observed when the fibers were preconditioned at 250 °C. This correlates
well with the data of the thermal gravimetric analysis in Figure 2 which indicates
that in air most of the PP optimized sizing degraded between 200 °C and 250
°C. In contrast, when the fibers were treated in a nitrogen atmosphere the IFSS
did not decrease below 300°C fiber preconditioning temperature. Similar to the
weight loss in Figure 2 the drop of the IFSS was less steep when the fiber
preconditioning was performed in nitrogen instead of air. However, little effect of
the atmosphere was observed when the fibers were thermally conditioned at
400 °C or higher temperatures. Most thermal recycling processes in inert
atmosphere require temperatures oft at least 400°C [6, 7, 19] and an additional

incineration process might be used [6] to separate the fibers from residual char
and contamination. Thus recycling of glass fiber composites in inert atmosphere
does not help to preserve the surface functionality of the glass fibers.
SEM micrographs revealed that all microbond samples exhibited adhesive
failure which indicates the absence of polymer matrix degradation [17]. Menisci
similar to that observed in Figure 4 were found on the fiber surface of tested
samples when the fibers were not preconditioned. These menisci indicate the
presence of matrix cracking. However, the size of the menisci is relatively small
which indicates that the influence of the matrix cracking on the debond force
may be negligible [20]. Figure 5 illustrates the influence of fiber preconditioning
on the load-extension curve after debond at the maximum load. Similar to Yang
and Thomason [16] it was observed that the behavior of the load extension
curves depended on the load when the fiber debonded. When the microbond
droplets debonded at high loads the measured load dropped almost to zero and
oscillated before reaching a slowly decreasing value. This slip-stick behavior
was observed in other glass fiber PP systems with high adhesion. When the
fibers were preconditioned at temperatures higher than 250 °C the samples
debonded at lower loads and no slip-stick effect was observed.
3.3 Residual fiber length
Each fiber length measurement as described above was repeated five times for
each fiber preconditioning temperature. Thus the fiber length distributions in
Figure 6 are based on the length of more than 5000 fibers. Table 1 shows the
arithmetic mean value of the distribution and the standard deviation of the
distribution itself. Similar to the study of Roux et al [13] the standard deviations

of the fiber length distributions in the present study are relatively large. The
large standard deviations are an effect of the wide range of the fiber length
distributions. Table 1 also shows the standard deviations between five repeat
measurements for each fiber preconditioning temperature. It can be seen that
the standard deviations between the repeat measurements are small compared
to the standard deviations of the fiber length distributions.
Figure 6 shows that the percentage in the range between 0 µm and 299 µm
increased with the fiber preconditioning temperature. The percentage of longer
fibers decreased with the fiber preconditioning temperature. These changes are
also reflected by a decrease of the average fiber length in Table 1.
The length degradation of glass fibers in PP composites and other
thermoplastic composites during liquid melt processing has been reported in
numerous studies [21–28]. Fibers are broken during melt processing of
thermoplastic composites due to fiber-polymer interactions, fiber-fiber
interactions and fiber-processor surface interactions [21, 29]. The fiber-polymer
interactions cause fiber buckling and breakage due to forces between the fibers
and the polymer melt. The glass fibers in a polymer melt can be described as
thin rods with a critical buckling radius inversely proportional to their tensile
strength [25, 28]. Thus the additional length degradation of thermally
preconditioned glass fibers in the present study might partially be explained with
a reduction of the fiber strength. The thermally preconditioned glass fibers might
also have been more susceptible to fiber breakage due to fiber-fiber interactions
and fiber processor surface interactions before the melting zone on the
extruder. The fibers were received as chopped bundles with a protective sizing.

The thermal gravimetric analysis data in Figure 2 indicates that the sizing of the
glass fibers started to degrade between 200 °C and 250 °C under air. Thus the
thermally preconditioned glass fibers may be less protected against wear
between fibers and between the fibers and the processor surfaces.
3.4 Tensile strength of the composites
The tensile strength of the composites is plotted in Figure 7 as a function of the
fiber preconditioning temperature in air. It is interesting to note that the tensile
strength dropped sharply between 200 °C and 250 °C fiber preconditioning
temperature. Higher fiber preconditioning temperatures caused a further
reduction of the composite strength. After fiber preconditioning at 500 °C the
composite strength dropped to 37.7±0.5 MPa which is barely higher than the
tensile strength of the unreinforced PP (35.8 ± 0.2 MPa). The strength of
discontinuous glass fiber PP composites is influenced by the fiber content, fiber
orientation, residual fiber length, fiber strength and the adhesion between fiber
and matrix [13, 23, 24, 30–32]. All processing parameters were kept constant.
Only the residual fiber length, fiber strength and the adhesion between fiber and
matrix changed when the fibers were thermally conditioned. The residual fiber
length dropped slightly between 200 °C and 250 °C fiber preconditioning
temperature. However the drop of the residual fiber length is relatively small and
Thomason et al. [23] showed that the tensile strength of glass fiber reinforced
PP composites increases gradually with the residual fiber length. Thus the
sharp drop of the composite tensile strength cannot be explained with the
residual fiber length. The microbond test results in Figure 8 show the interfacial
adhesion between fibers that were thermally conditioned in air and PP with 1 %
added MAPP. The values for the IFSS are higher than in Figure 3 because of
the added MAPP. However, in both cases the IFSS dropped sharply between
200 °C and 250 °C preconditioning temperature. Higher fiber preconditioning
temperatures caused only a minor further reduction of the IFSS. The fracture
surface of the composites also indicated a reduction of the IFSS when the glass
fibers were thermally preconditioned. Figure 9 shows the fracture surface of a
composite reinforced with as received fibers and the fracture surface of a
composite reinforced with fibers that were thermally conditioned at 200 °C.
Figure 10 shows the fracture surfaces of composites reinforced with fibers that
were heat treated at 250 °C and 500 °C. The fibers in Figure 10 are relatively
clean while the fibers in Figure 9 are partially covered with PP. These types of
SEM are often interpreted in terms of the apparent level of fiber-matrix adhesion
in the composite although it has been shown that such conclusions can be
misleading [33]. In any case the SEM evidence is not inconsistent with the
suggestion that the composites based on “as received” glass fibers had a higher
adhesion than the composites based on fibers that were preconditioned at 250
°C or higher temperatures. Figure 10 shows that SEM micrographs of
composite fracture surfaces did not reveal any clear differences between 250
°C and 500 °C fiber preconditioning temperature. In both cases, the fibers are
relatively clean.
The strength degradation of glass fibers due to exposure to elevated
temperatures is well documented but only little strength loss was observed due
to fiber treatment in the range of 200 °C to 300 °C for a period of time similar to
that used in the present study [8, 9, 15]. Consequently, we conclude that the
sharp drop of the composite strength between 200 °C and 250 °C fiber
preconditioning temperature was caused by a degradation of the IFSS. Thus
recycled glass fibers cannot act as an effective reinforcement in injection
molded PP composites when the surface functionality has been degraded by
the recycling process.
The authors believe that the glass fiber sizing degradation close to processing
temperatures deserves further research. Most of the glass fibers will be
embedded in the PP matrix during composite processing and the fiber
preconditioning of this study does therefore not represent processing
conditions. However, processing temperatures are often increased to up to 300
°C to increase the production throughput and even short exposure to these
temperatures under air (e.g. when the polymer melt exits the extruder) might
cause a severe degradation of the glass fiber sizing.
In addition to the reduction of the IFSS a different mechanism is involved with
the reduction of the composite strength after fiber preconditioning at higher
temperatures. It was demonstrated in several studies [23, 27, 30, 34] that the
tensile strength of discontinuous glass fiber PP composites can be described
with the Kelly-Tyson model. Thomason [24, 27, 34] used an iterative algorithm
developed by Bowyer and Bader [35] and based on the Kelly-Tyson model to
calculate the IFSS, fiber orientation and fiber stress at failure in discontinuous
glass fiber PP composites. The same method was used to analyses the fiber
stress at composite failure in the present study but IFSS values obtained from
the microbond tests were used as input parameter. Figure 11 shows the
calculated fiber stress at composite failure as a function of the fiber

preconditioning temperature. Considering the experimental error, the fibers
stress at composite failure did not change significantly due to the thermal
preconditioning at 200 °C. Fiber preconditioning at 250 °C caused a clear
reduction of the fiber stress. The fiber preconditioning at 500 °C caused a
further reduction of the fiber stress at composite failure. The fiber stress was
reduced to 25 % of the value of untreated fibers. Jenkins et al. [9] reported a
strength loss of single fibers of the same relative magnitude when bundles of
aminopropyltriethoxy silane sized fibers were thermally treated at similar
conditions. However, care must be taken when comparing the fiber stress at
composite failure with the single fiber strength since the thermal conditioning of
the glass fibers also influenced other microstructural properties such as the
IFSS and to a lesser extent the residual fiber length. In summary, the main drop
of fiber stress in the composite was observed between 200 °C and 250 °C fiber
preconditioning temperature. This drop can be attributed to a degradation of the
IFSS. The drop of the fiber stress after preconditioning at higher temperatures
may partially be explained by the related reduction of the fiber strength.
3.5 Failure strain
Similar to the tensile strength, the failure strain of the composites in Figure 12
decreased sharply between 200 °C and 250 °C fiber preconditioning
temperature. This was followed by a drop to a minimum at 300 °C fiber
preconditioning temperature and a partial recovery at 450 °C and 500 °C. While
the parameters that influence the strength and stiffness of glass fiber PP
composites have been studied extensively, few parametric studies deal with the
failure strain of discontinuous glass fiber PP composites. The consensus is that

higher fiber contents cause a reduction of the failure strain because of fiber
induced stress concentrations which cause matrix cracking [23, 26, 30, 36]. The
influence of the residual fiber length is less clear. Spahr et al. [36] reported that
long glass fiber PP composites had a lower failure strain than short fiber
composites. In contrast, Thomason et al. [23, 30] did not observe a significant
influence of the fiber length. In a different study [24] Thomason noticed that the
addition of MAPP increased the failure strain of injection molded glass fiber PP
composites. This might be attributed to an improved adhesion between fiber
and matrix which prevents the formation of cracks between fiber and matrix.
The adhesion between fiber and matrix might also explain the reduction of the
composite failure strain in the present study. As shown in Figure 3 and Figure 8
the adhesion between fiber and matrix was poor after fiber preconditioning at
250 °C in air which might have promoted the formation of cracks between fiber
and matrix and subsequent failure of the composite. When the fibers were
preconditioned at temperatures higher than 250°C the failure strain partially
recovered. The stress-strain curves in Figure 13 show that the composites
exhibited a ductile behavior and did not fail at the maximum load when the
fibers were preconditioned at 500 °C. This indicates a matrix dominated
composite behavior and explains the recovery of the failure strain.
3.6 Modulus of the composites
Figure 14 indicates that the Young’s modulus of the composites decreased
slightly when the glass fibers were thermally preconditioned before composite
processing. Higher preconditioning temperature caused a larger reduction of the
Young’s modulus. The Young’s modulus of discontinuous glass fiber PP

composites is mainly influenced by the fiber content, fiber orientation and the
residual fiber length [23, 24, 31, 36] Thus the reduction of the residual fiber
length shown in Figure 6 might explain the behavior of the Young’s modulus in
the present study. It was reported that the modulus of glass fibers increased
[37, 38] after exposure to elevated temperatures. However, other researchers
did not observe an increase of the fiber modulus and no increase of the
composite modulus was observed when the glass fibers were exposed to
elevated temperatures before composite processing [8, 39]. The data of the
present study suggests either that the modulus of the glass fibers was not
significantly changed due to the thermal preconditioning or that the effect was
masked by the influence of the fiber length reduction.
4 Conclusion
The present study showed that glass fibers lost most of their reinforcement
potential after exposure to temperatures of around 250 °C in air. The sharp drop
of the tensile strength of the injection molded polypropylene (PP) composites
between 200 °C and 250 °C fiber preconditioning temperature was attributed to
a reduction of the adhesion between fiber and polypropylene rather than a
reduction of the fiber strength. The surface functionality of recycled glass fibers
is therefore critical for the reinforcement potential. Microbond tests and thermal
gravimetric analysis showed that the degradation of the fiber sizing in a nitrogen
atmosphere was less rapid than in air. However, when the fiber preconditioning
was performed at 400 °C or above the atmosphere had only a minor effect on
the interfacial adhesion between fibers and PP. Thus thermal recycling in
nitrogen is not beneficial for the surface functionality of the fibers because they
require temperatures of at least 400 °C. Fibers that were thermally recycled in
air and fibers that were thermally recycled in an inert atmosphere need further
post treatment to improve the reinforcement effectivity. Such treatment will
ideally need to regenerate both surface functionality of the glass fibers and the
fiber strength.
5 Acknowledgement
The authors gratefully acknowledge the funding from Engineering and Physical
Sciences Research Council through the project EP/I038616/1. The authors
would also like to thank the Advanced Materials Research Laboratory
(University of Strathclyde) for the use of the mechanical testing machines and
the SEM. The help of Saudi Basic Industries Corporation for the supply of the
polypropylene is also acknowledged.

References
1. S. Job, ReinforcedPlastics., 57, 19 (2013).
2. Parliament of the European Union and European Council, “Directive 2000/53/EC of the European Parliament and of the Council of 18 September 2000 on end-of life vehicles” in Official Journal of European Communities (2000)
3. Y.Yang, R. Boom, B. Irion, D. van Heerden, P. Kuiper and H. de Wit., Chem. Eng. Process. Process Intensif., 51, 53 (2012).
4. T. Kraus, M. Kuehnel and E. Witten, Composites Market Report 2014 (2014), pp. 29–44.
5. J. R. Kennerley, R. M. Kelly, N. J. Fenwick, S. J. Pickering and C. D. Rudd, Compos. Part A Appl. Sci. Manuf., 29, 839 (1998).
6. A. M. Cunliffe and P. T. Williams, Fuel., 82, 2223 (2003).
7. A. Torres, I. De Marco, B. M. Caballero, M. F. Laresgoiti, M. J. Chomón and G. Kondra, Adv. Polym. Technol,. 32, 474 (2012).
8. S. Feih, E.Boiocchi, G. Mathys, Z. Mathys, A.G. Gibson and A.P. Mouritz, Compos. Part B Eng., 42, 350 (2011).
9. P. G. Jenkins, L. Yang, J. Liggat and J. L. Thomason, J. Mater. Sci., 50 1050 (2014).
10. M. D. Lund and Y. Yue, J. Am. Ceram. Soc., 93, 3236 (2010).
11. C. E. Kouparitsas, C. N. Kartalis, P. C. Varelidis, C. J. Tsenoglou and C. D. Papaspyrides, Polym. Compos., 23, 682 (2002)
12. C. Bream and P. Hornsby, Polym. Compos., 21, 417 (2000).
13. C. Roux, J. Denault and M. F. Champagne, J. Appl. Polym. Sci., 78, 2047 (2000).
14. J. L. Thomason, C. C. Kao, J. Ure and L. Yang, J. Mater. Sci., 49, 153 (2013).
15. J. L. Thomason, L. Yang and R. Meier, Compos. Part A Appl. Sci. Manuf., 61, 201 (2014).
16. L. Yang and J. L. Thomason, Polym. Test., 31, 895 (2012).
17. L. Yang and J. L. Thomason, Compos. Part A Appl. Sci. Manuf., 41, 1077 (2010).
18. M. R. Hartwich, N. Höhn, H. Mayr, K. Sandau and R. Stengler, “FASEP ultra-automated analysis of fibre length distribution in glass-fibre-reinforced products” in Proceedings of SPIE Conference, 7389 (2009).
19. D. Akesson, Z. Foltynowicz, J. Christeen and M. Skrifvars, J. Reinf. Plast. Compos., 31, 1136 (2012).
20. M. Nishikawa, T. Okabe, K. Hemmi and N. Takeda, Int. J. Solids Struct., 45, 4098 (2008).
21. B. Fisa, Polym. Compos., 6. 232 (1985).
22. V. B. Gupta, R. K. Mittal, P. K. Sharma, G. Mennig, J. Wolters, Polym. Compos., 10, 8–15 (1989).
23. J. L. Thomason, Compos. Part A Appl. Sci. Manuf., 33, 1641 (2002).
24. J. L. Thomason, Compos. Sci. Technol., 62, 1455 (2002).
25. R. K. Mittal, V. B. Gupta, P. K. Sharma, Compos. Sci. Technol., 31, 295 (1988).
26. S.-Y. Fu, B. Lauke, E. Mäder, C.-Y. Yue and X. Hu, Compos. Part A Appl., Sci. Manuf. 31, 1117 (2000).
27. J. L. Thomason, Compos. Part A Appl. Sci. Manuf., 36, 995 (2005).
28. J. H. Phelps, A. I. Abd El-Rahman, V. Kunc and C. L. Tucker, Compos. Part A Appl. Sci. Manuf., 51, 11 (2013).
29. R. Turkovich and L. Erwin, Polym. Eng. Sci., 23, 743 (1983).
30. J. L. Thomason, M. A. Vlug, G. Schipper and H. G. L. T. Krikort, Compos. Part A Appl. Sci. Manuf., 27A, 1075 (1996).
31. S. F. Xavier and A. Misra, Polym. Compos., 6, 93 (1985).
32. V. B. Gupta, R. K. Mittal and P. K. Sharma, Polym. Compos. 10, 16 (1989).
33. S. Y. Fu, B. Lauke, Y. H. Zhang and Y.-W. Mai, Compos. Part A Appl. Sci. Manuf., 36, 987 (2005).
34. J. L. Thomason, Compos. Part A Appl. Sci. Manuf., 38, 210 (2007).

35. W. H. Bowyer and M. G. Bader, J. Mater. Sci., 7, 1315 (1972).
36. D. E. Spahr, K. Friedrich, J. M. Schultz and R. S. Bailey, J. Mater., Sci. 25, 4427 (1990).
37. H. Otto, J. Am. Ceram. Soc., 44, 68 (1961).
38. L. Yang and J. L. Thomason, J. Mater. Sci., 48, 5768 (2013).
39. L. Yang, E. R. Sáez, U. Nagel and J. L. Thomason, Compos. Part A Appl. Sci. Manuf., 72, 167 (2015).

Figure 1. Microbond sample preparation
Figure 2. Thermal gravimetric analysis of chopped glass fibers with PP optimized sizing
99.3
99.4
99.5
99.6
99.7
99.8
99.9
100
0 200 400 600
Rem
ain
ing
Mass [
%]
Temperature [°C]
Air
Nitrogen
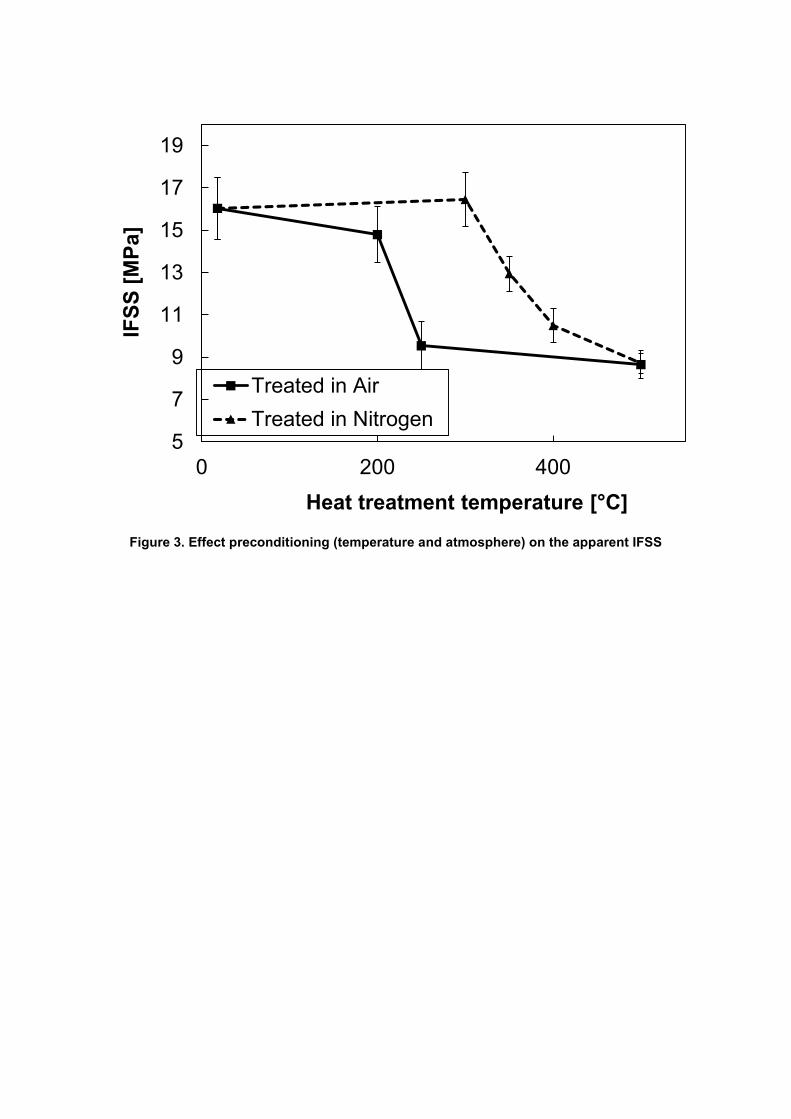
Figure 3. Effect preconditioning (temperature and atmosphere) on the apparent IFSS
5
7
9
11
13
15
17
19
0 200 400
IFS
S [
MP
a]
Heat treatment temperature [°C]
Treated in Air
Treated in Nitrogen
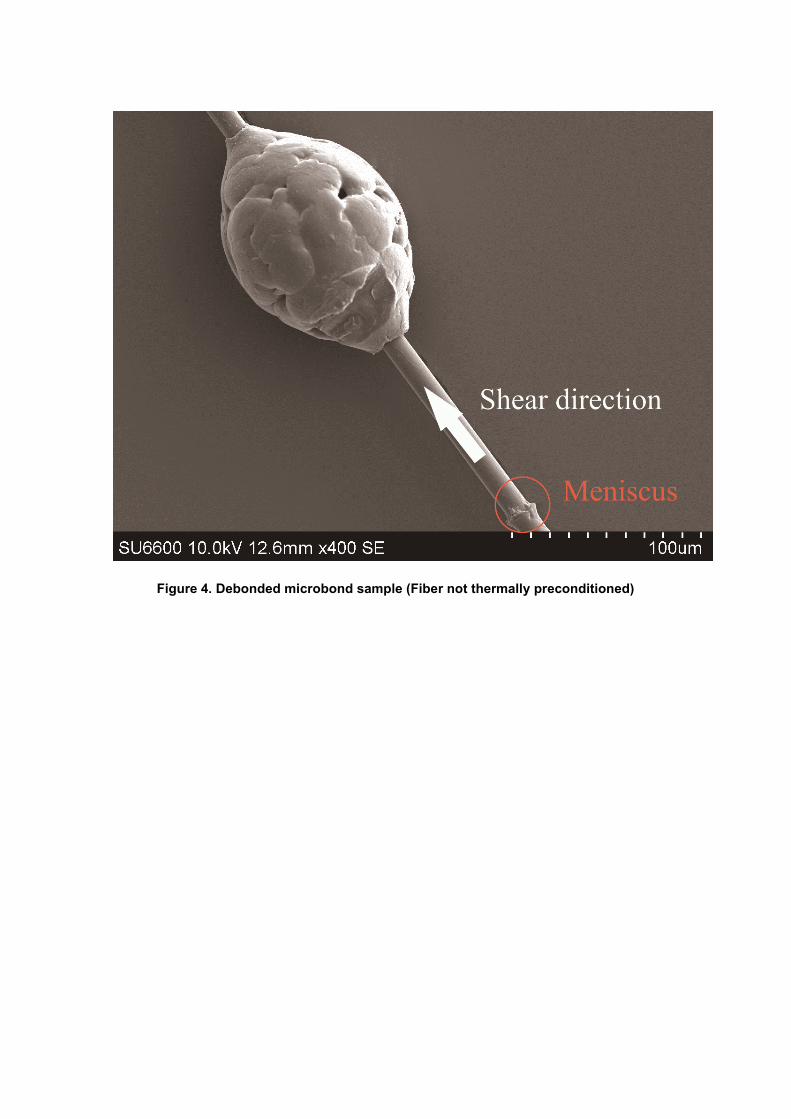
Figure 4. Debonded microbond sample (Fiber not thermally preconditioned)

Figure 5. Load vs. extension of sample with “as received” fiber and thermally preconditioned fiber (500 °C, 25min)
0
0.02
0.04
0.06
0.08
0.1
0.12
0.14
0.16
0.18
0.2
0 0.05 0.1 0.15
Lo
ad
[N
]
Extension [mm]
Untreated fibre
Preconditioned fibre

Figure 6. Length distributions of thermally preconditioned fibers in composites
Table 1. . Mean values and standard deviations of fiber length distributions
Fiber preconditioning
temperature
Arithmetic mean of
length of distribution
Standard deviation of
length distribution
Standard deviation
between repeat
measurements
As received 343 µm 209 µm 2 µm
200°C 342 µm 200 µm 3 µm
250°C 321 µm 191 µm 7 µm
300°C 318 µm 194 µm 5 µm
450°C 308 µm 190 µm 11 µm
500°C 296 µm 189 µm 3 µm
0
5
10
15
20
25
30F
req
uen
cy [
%]
Fibre length [µm]
As received
200°C
250°C
300°C
450°C
500°C

Figure 7. Maximum tensile stress versus fiber preconditioning temperature
30
40
50
60
70
80
0 100 200 300 400 500
Com
posite tensile
str
ength
[M
Pa
]
Fibre preconditioning temperature [°C]
Composite
neat PP
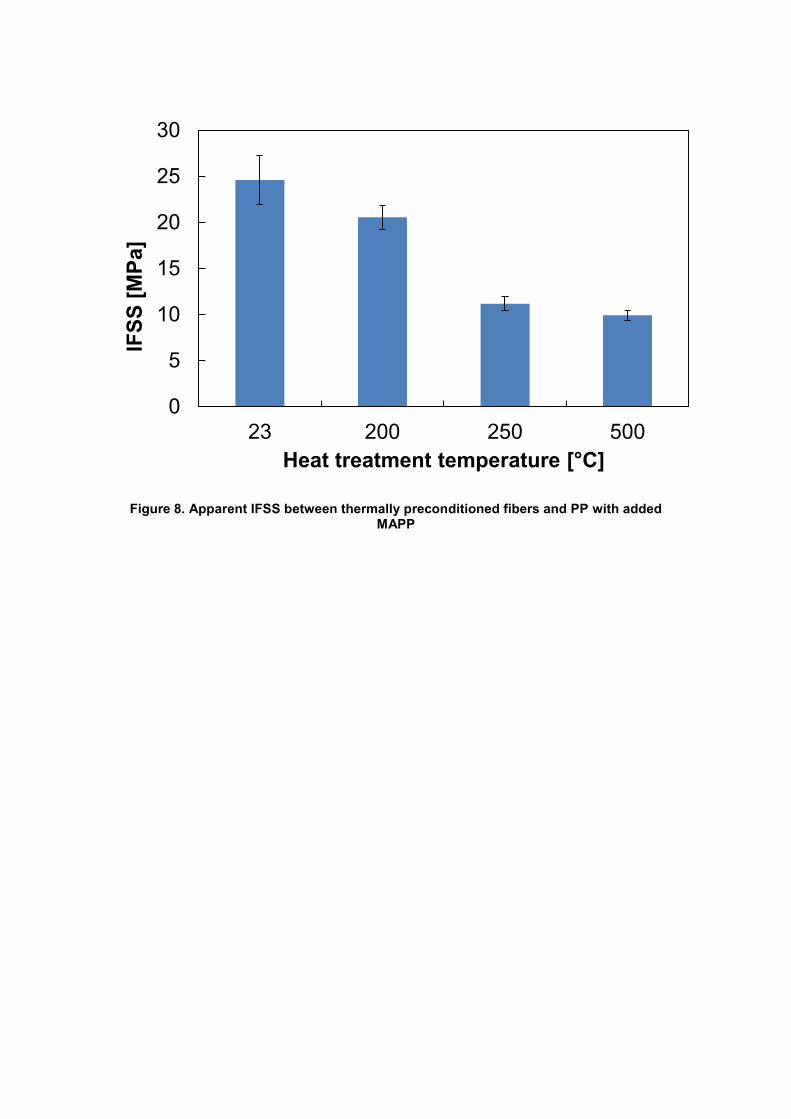
Figure 8. Apparent IFSS between thermally preconditioned fibers and PP with added MAPP
0
5
10
15
20
25
30
23 200 250 500
IFS
S [
MP
a]
Heat treatment temperature [°C]

Figure 9. Fracture surface of a PP composites reinforced with as received fibers and thermally preconditioned fibers (200°C)

Figure 10. Fracture surface of PP composite reinforced with thermally preconditioned fibers (250 °C and 500 °C)

Figure 11. Calculated fiber stress at composite failure vs. fiber preconditioning temperature
Figure 12. Composite failure strain versus fibre preconditioning temperature
0
500
1000
1500
2000
23 200 250 500
Fib
er
str
ess [M
Pa]
Heat treatment temperature [°C]
1
1.5
2
2.5
3
3.5
4
0 100 200 300 400 500
Failu
re s
train
[%
]
Fibre preconditioning temperature [°C]

Figure 13. Stress-strain curves of composites based on thermally preconditioned glass fibers
0
10
20
30
40
50
60
70
80
0 1 2 3 4
Str
ess
[M
Pa]
Strain [%]
As received
200°C
250°C
300°C
450°C
500°C


