

ADCS#: ####### Revised: 23 September, 2010
Efficient JTAG-based Linux
kernel debugging
Embedded Linux Conference Europe - 2011
ADCS#: ###### Revised: 23 September, 2010
Rationale
Embedded Linux in Devices: sustained growth for many years and more recently increasing success of System
Middleware for Devices based on Linux, especially Google Android.
The number of MPSoC running embedded Linux is increasing and accordingly the software architecture is adapting,
getting scalable and parallel. Now taken into account by chip vendors: cross triggering and system-wide tracing support IPs.
STMicroelectronics Internal requirements and historical facts The software for multimedia appliances (set-
top-boxes) is part of the reference design we provide. We needed to port a scalable Multimedia Streaming and Processing Framework from an RTOS to Linux by the time when mastering wake-up latency would mean doing kernel streaming (or using a RT co-kernel…)
1
ADCS#: ###### Revised: 23 September, 2010
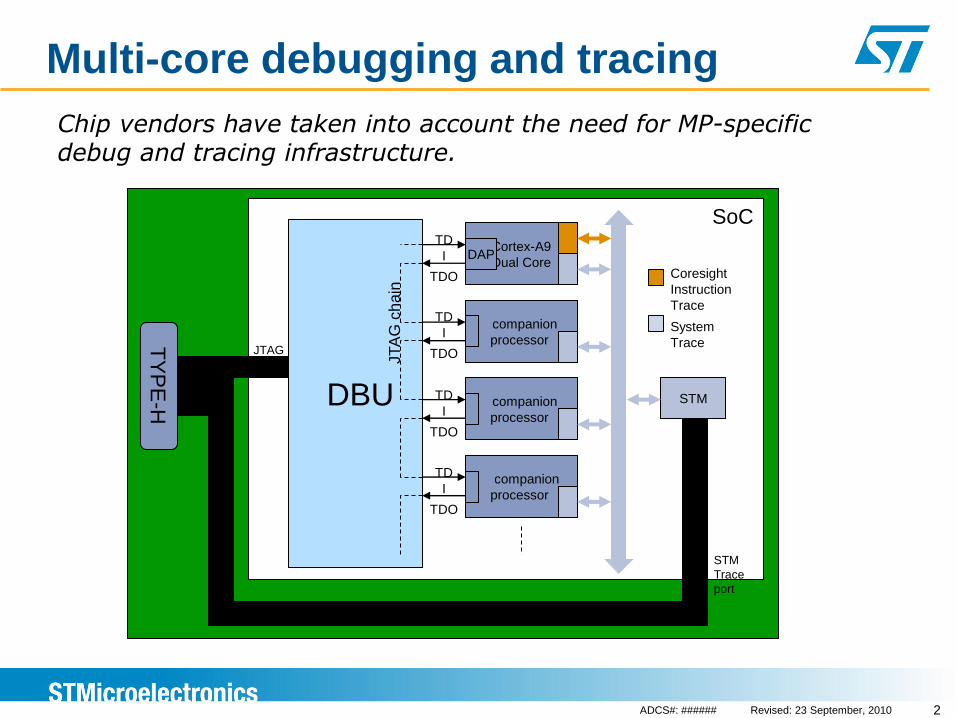
Multi-core debugging and tracing
2
SoC
DBU
Cortex-A9
Dual Core
companion
processor
companion
processor
companion
processor
DAP
Coresight
Instruction
Trace
STM
TD
I
TDO
TY
PE
-H
TD
I
TDO
TD
I
TDO
TD
I
TDO
JTA
G c
ha
in
JTAG
STM
Trace
port
System
Trace
Chip vendors have taken into account the need for MP-specific debug and tracing infrastructure.
ADCS#: ###### Revised: 23 September, 2010
Debugger
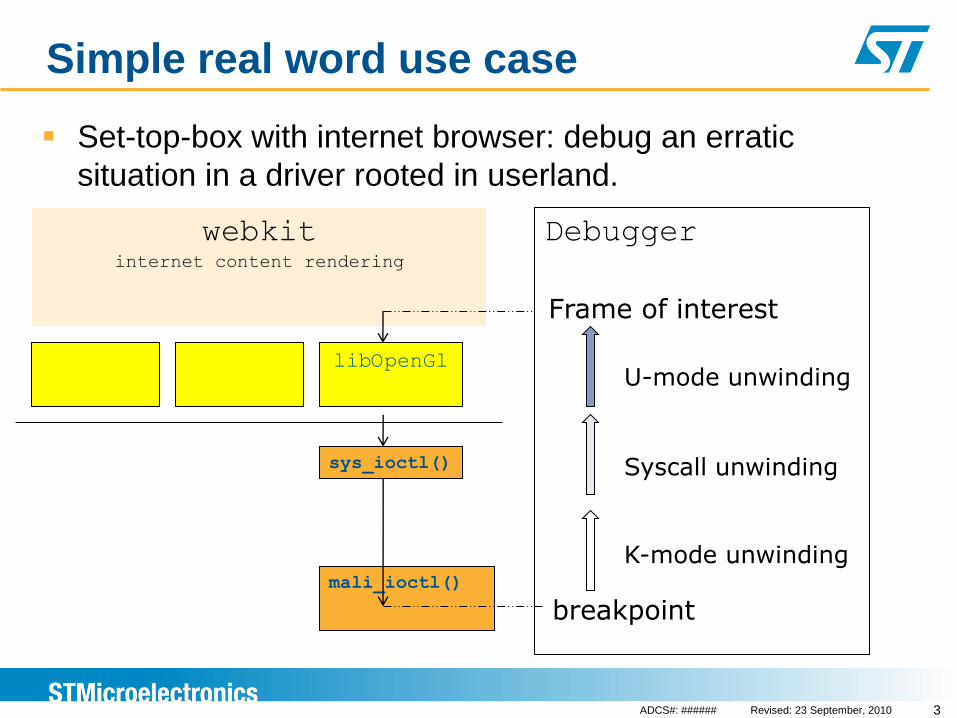
Simple real word use case
Set-top-box with internet browser: debug an erratic
situation in a driver rooted in userland.
3
webkit internet content rendering
libOpenGl
mali_ioctl()
sys_ioctl()
breakpoint
Frame of interest
U-mode unwinding
Syscall unwinding
K-mode unwinding

ADCS#: ###### Revised: 23 September, 2010
Simple real word use case
(gdb) b sys_open
Breakpoint 4 at 0x8006dd40: file fs/open.c, line 1060.
(gdb) c
Continuing.
[Switching to ls]
Breakpoint 4, sys_open (filename=0x2956bc9c "/etc/ld.so.cache", flags=0, mode=1) at fs/open.c:1060
1060 ret = do_sys_open(AT_FDCWD, filename, flags, mode);
(gdb) bt
#0 sys_open (filename=0x2956bc9c "/etc/ld.so.cache", flags=0, mode=1) at fs/open.c:1060
#1 0x80008920 in syscall_call ()
#2 0x29568244 in open ()
…
#11 0x2955bb78 in _dl_start_final (arg=0x7b82fd80) at rtld.c:328 usermode unwinding
#12 _dl_start (arg=0x7b82fd80) at rtld.c:554
#13 0x295588cc in _start ()
4
ADCS#: ###### Revised: 23 September, 2010
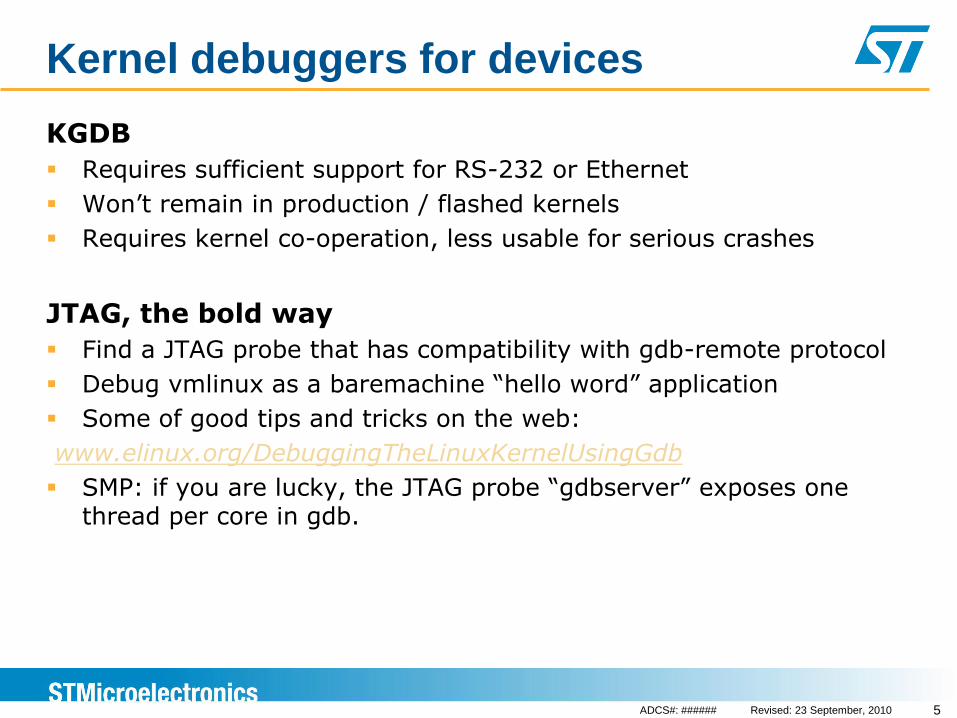
Kernel debuggers for devices
KGDB
Requires sufficient support for RS-232 or Ethernet
Won’t remain in production / flashed kernels
Requires kernel co-operation, less usable for serious crashes
JTAG, the bold way
Find a JTAG probe that has compatibility with gdb-remote protocol
Debug vmlinux as a baremachine “hello word” application
Some of good tips and tricks on the web:
www.elinux.org/DebuggingTheLinuxKernelUsingGdb
SMP: if you are lucky, the JTAG probe “gdbserver” exposes one thread per core in gdb.
5
ADCS#: ###### Revised: 23 September, 2010
Kernel debuggers for devices, fancier
Commercial Solutions
Must be very well defined in terms of supported targets, software versions and debugging hardware because support and service can be part of the package.
JTAG, the presented way: implement Linux Awareness
Find a JTAG probe compatible with gdb remote protocol
Handle kernel modules the same way as shared libraries, with init/release hooking.
Deal with memory translation and MMU settings, as the kernel will not do it for us
Expose Linux tasks as selectable threads in gdb
Allow stepping any of the scheduled task (one per core)
Allow backtracing
Allow breakpointing
6
ADCS#: ###### Revised: 23 September, 2010
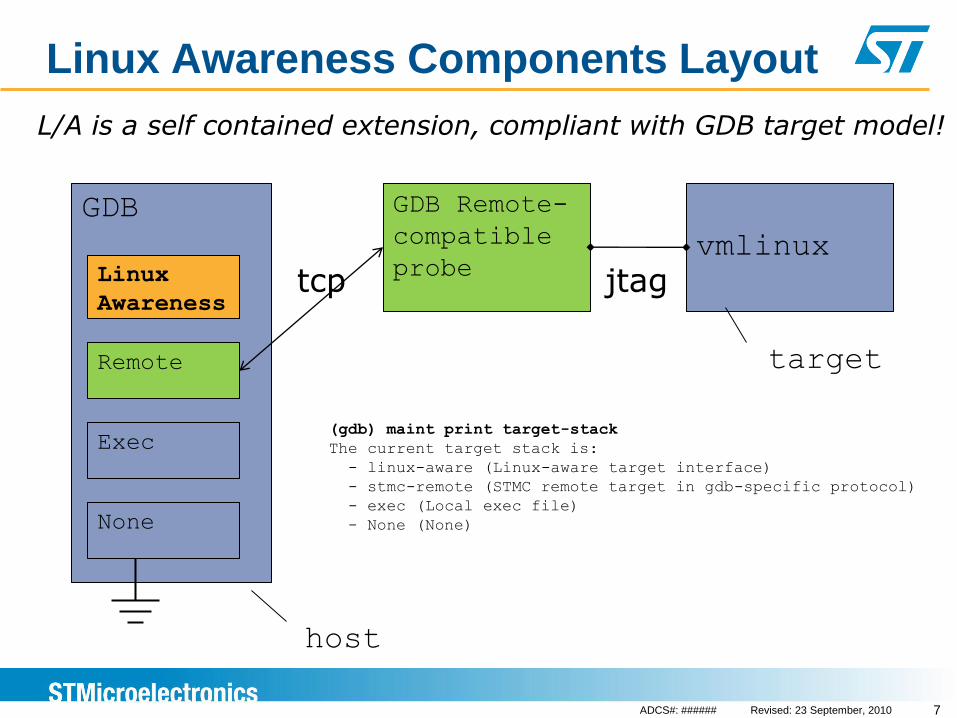
Linux Awareness Components Layout
7
GDB
Linux
Awareness
Remote
Exec
None
GDB Remote-
compatible
probe tcp
vmlinux
jtag
(gdb) maint print target-stack
The current target stack is:
- linux-aware (Linux-aware target interface)
- stmc-remote (STMC remote target in gdb-specific protocol)
- exec (Local exec file)
- None (None)
L/A is a self contained extension, compliant with GDB target model!
host
target

ADCS#: ###### Revised: 23 September, 2010
Mapping Linux tasks to gdb threads
8
Purpose
Map anything that has a task_struct to a thread for gdb
Be able to select this thread through usual gdb commands and
get the backtrace
list the sources matching a frame, resolve the symbols
set breakpoints, stepi/nexti, step/next, finish, return...
Howto
Enumeration walk the kernel linked lists of task_struct
Housekeeping track process creation and deletion
Distinguish scheduled ones (stepping allowed) from non-scheduled ones (stepping not allowed)
ADCS#: ###### Revised: 23 September, 2010
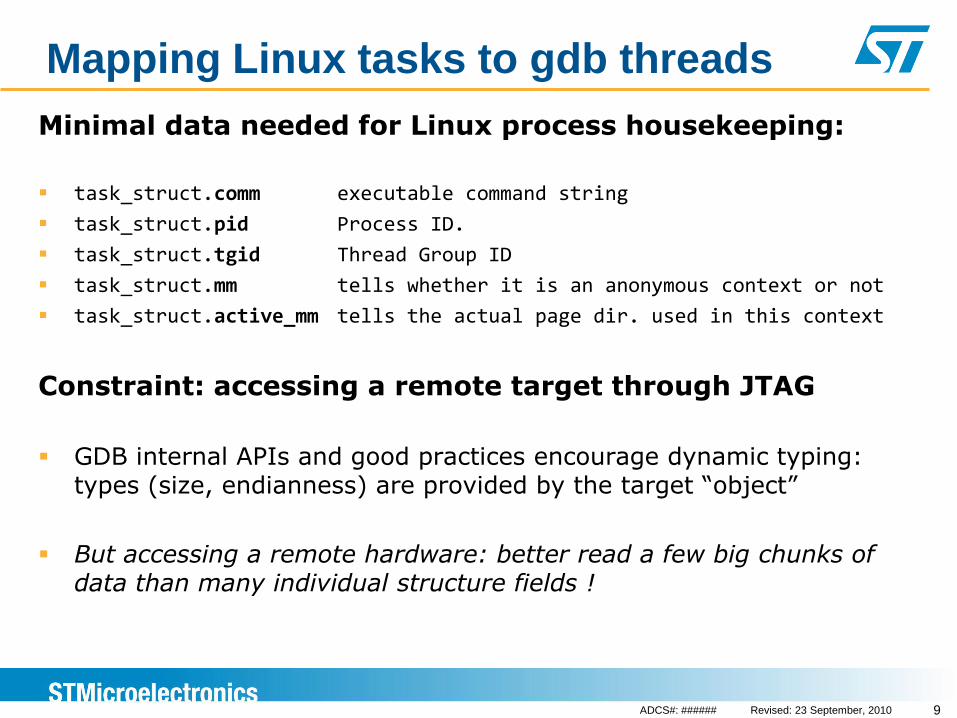
Mapping Linux tasks to gdb threads
9
Minimal data needed for Linux process housekeeping:
task_struct.comm executable command string
task_struct.pid Process ID.
task_struct.tgid Thread Group ID
task_struct.mm tells whether it is an anonymous context or not
task_struct.active_mm tells the actual page dir. used in this context
Constraint: accessing a remote target through JTAG
GDB internal APIs and good practices encourage dynamic typing: types (size, endianness) are provided by the target “object”
But accessing a remote hardware: better read a few big chunks of data than many individual structure fields !
ADCS#: ###### Revised: 23 September, 2010
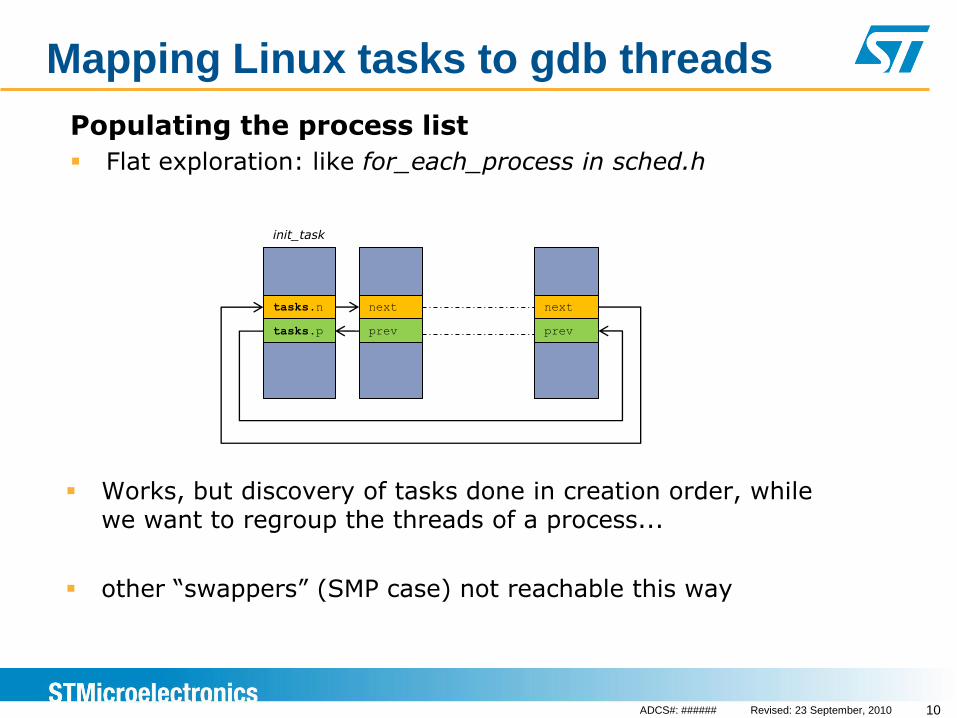
Mapping Linux tasks to gdb threads
10
Populating the process list
Flat exploration: like for_each_process in sched.h
tasks.p
tasks.n next
prev
next
prev
init_task
Works, but discovery of tasks done in creation order, while we want to regroup the threads of a process...
other “swappers” (SMP case) not reachable this way

ADCS#: ###### Revised: 23 September, 2010
Mapping Linux tasks to gdb threads
11
Populating the process list
Alternate exploration:
Other “swappers”: added by default, one per h/w thread reported by
underlying remote target. Reachable through the runqueues “idle” field.
thread_g.p
thread_g.n next
prev
next
prev
siblings.p
siblings.n next
prev
next
prev
children.n
ADCS#: ###### Revised: 23 September, 2010
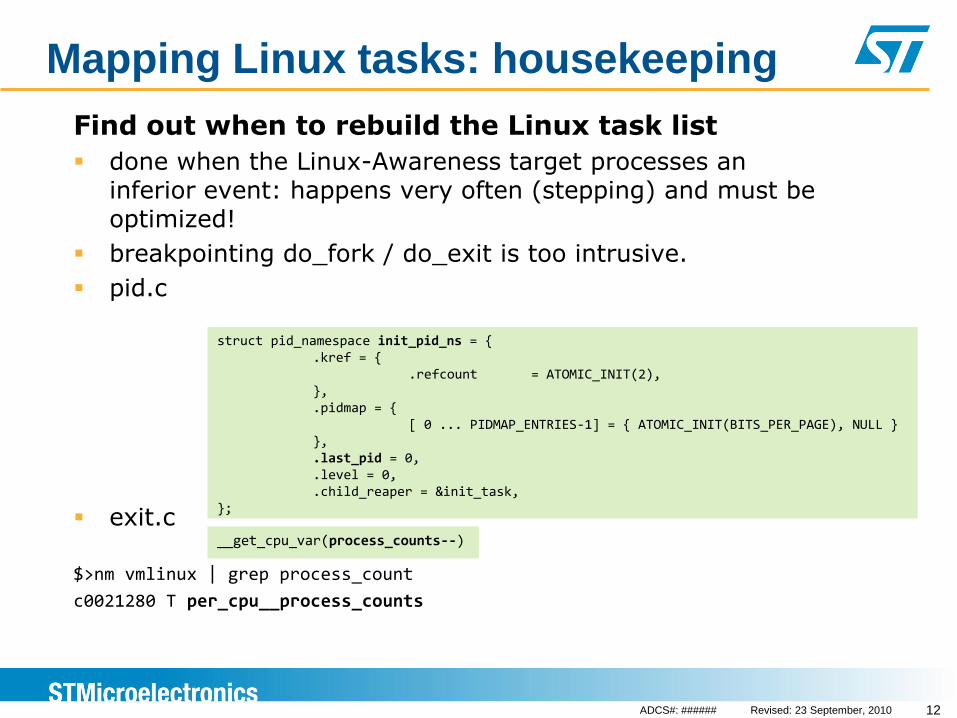
Mapping Linux tasks: housekeeping
12
struct pid_namespace init_pid_ns = { .kref = { .refcount = ATOMIC_INIT(2), }, .pidmap = { [ 0 ... PIDMAP_ENTRIES-1] = { ATOMIC_INIT(BITS_PER_PAGE), NULL } }, .last_pid = 0, .level = 0, .child_reaper = &init_task, };
Find out when to rebuild the Linux task list
done when the Linux-Awareness target processes an inferior event: happens very often (stepping) and must be optimized!
breakpointing do_fork / do_exit is too intrusive.
pid.c
exit.c
$>nm vmlinux | grep process_count
c0021280 T per_cpu__process_counts
__get_cpu_var(process_counts--)

ADCS#: ###### Revised: 23 September, 2010
Mapping Linux tasks
13
Accessing the per-cpu variables in GDB
Fairly simple, as of today we only need:
• __per_cpu_offset offset of each CPU’s per_cpu page
• process_count
• per_cpu__runqueues (or occasionally runqueues)
• rq->idle
• rq->curr currently scheduled task
Finding the currently scheduled task
“current = sp & ~(THREAD_SIZE-1)”: this won’t work when
putting the target in debug mode while the core is running a usermode code page.
We need to check rq->curr.
ADCS#: ###### Revised: 23 September, 2010
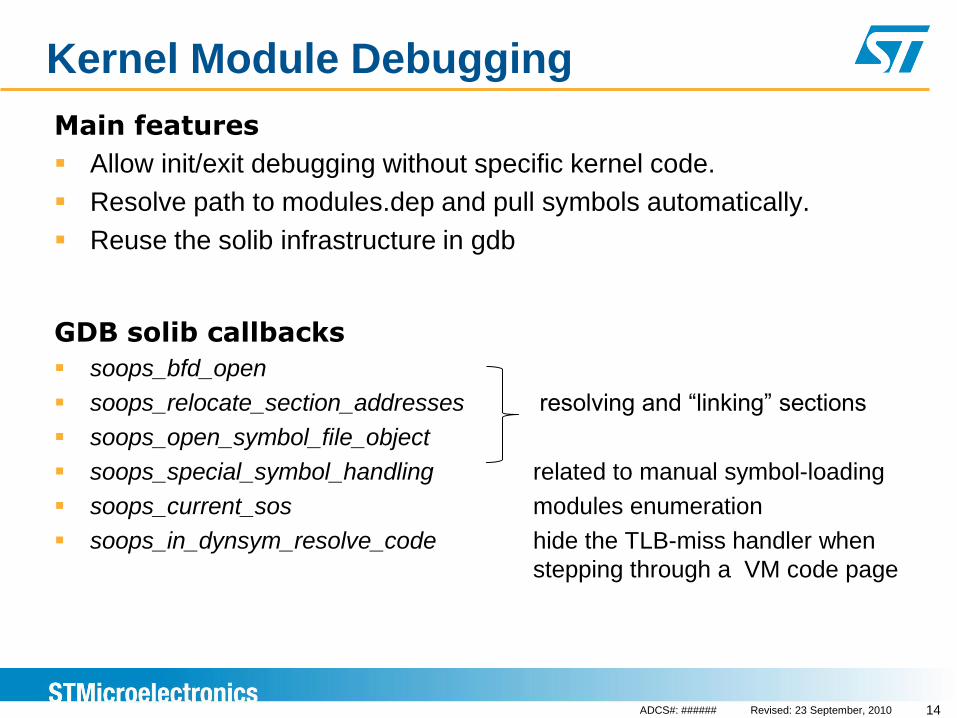
Kernel Module Debugging
Main features
Allow init/exit debugging without specific kernel code.
Resolve path to modules.dep and pull symbols automatically.
Reuse the solib infrastructure in gdb
GDB solib callbacks
soops_bfd_open
soops_relocate_section_addresses resolving and “linking” sections
soops_open_symbol_file_object
soops_special_symbol_handling related to manual symbol-loading
soops_current_sos modules enumeration
soops_in_dynsym_resolve_code hide the TLB-miss handler when
stepping through a VM code page
14
ADCS#: ###### Revised: 23 September, 2010
Kernel Module Debugging
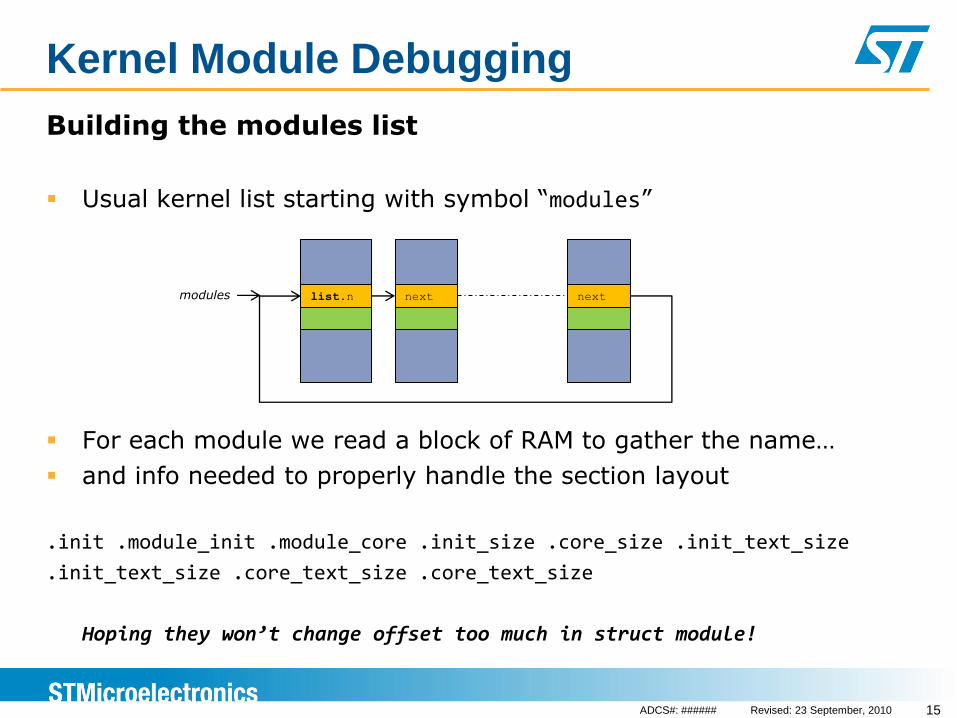
Building the modules list
Usual kernel list starting with symbol “modules”
For each module we read a block of RAM to gather the name…
and info needed to properly handle the section layout
.init .module_init .module_core .init_size .core_size .init_text_size
.init_text_size .core_text_size .core_text_size
Hoping they won’t change offset too much in struct module!
15
list.n next next modules

ADCS#: ###### Revised: 23 September, 2010
Kernel Module Debugging
Virtual memory handling
Architecture specific part (arm/memory.txt)!
Accessing modules code pages requires memory translation.
For pages between TASK_SIZE and PAGE_OFFSET_1 we set
pdg = swapper_pg_dir + 8* (addr >> PGDIR_SHIFT)
Cope with physical memory offset: pdg += phys_offset
We read phys_offset from: meminfo.bank[0].start
16
PAGE_OFFSET high_memory-1 Kernel direct-mapped RAM region. This maps the platforms RAM, and typically maps all platform RAM in a 1:1 relationship.
TASK_SIZE PAGE_OFFSET-1 Kernel module space Kernel modules inserted via insmod are placed here using dynamic mappings.

ADCS#: ###### Revised: 23 September, 2010
Kernel Module Debugging
From ARMv7 Arch. Ref. manual: small page translation flow
17

ADCS#: ###### Revised: 23 September, 2010
Kernel Module Debugging
MMU switching
GDB remote server must supply architecture specific support
This is currently the only arch specific constraint on gdbserver
Very simple interface for ARM, but can be tricky on gbdserver side.
Remote specific command example (ST-Microconnect):
st cp15 c1 0 c0 0 read System Control Register
st cp15 c2 0 c0 0 read Translation Table Base Register 0
st cp15 c2 0 c0 0 0x%x write TTRB0
st cp15 c13 0 c0 1 read Context ID register (ASID)
st cp15 c13 0 c0 1 0x%x write ASID
Example with Qemu:
Qqemu.st.mrc.c2_base0;%x
Qqemu.st.mrc.c13_context;%x
18
ADCS#: ###### Revised: 23 September, 2010
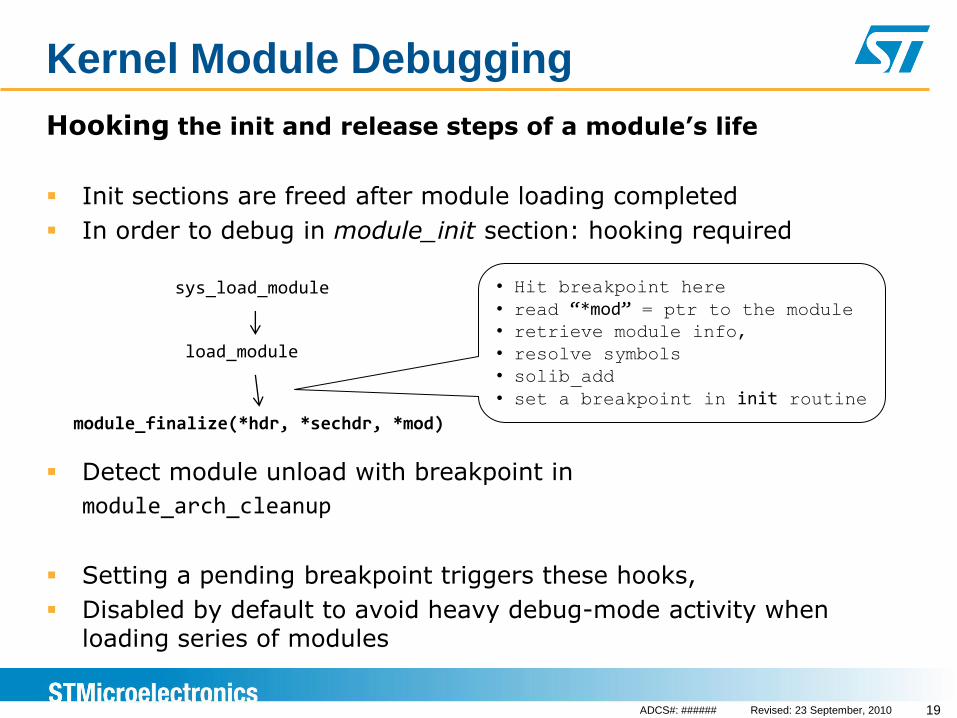
Kernel Module Debugging
Hooking the init and release steps of a module’s life
Init sections are freed after module loading completed
In order to debug in module_init section: hooking required
Detect module unload with breakpoint in
module_arch_cleanup
Setting a pending breakpoint triggers these hooks,
Disabled by default to avoid heavy debug-mode activity when loading series of modules
19
sys_load_module
load_module
module_finalize(*hdr, *sechdr, *mod)
• Hit breakpoint here
• read “*mod” = ptr to the module • retrieve module info,
• resolve symbols
• solib_add
• set a breakpoint in init routine
ADCS#: ###### Revised: 23 September, 2010
Userland support
Debugging userland with the Linux Kernel Debugger
not so simple, not so sensible, but some comfort can be granted to the user, like:
translate VM addresses:
pull process symbols, switch “main” and symbol space when stepping, backtracing usermode
Setting a breakpoint in kernel mode, then unwinding and stepping up to usermode is not so hard to achieve.
20
task_struct.active_mm.pgd task_struct.active_mm.id
ADCS#: ###### Revised: 23 September, 2010
Android support
About Google’s NDK
Fine for attaching to a running Linux process
Used not to work for regular cross-debugging (fixed?)
We had to provide users with means to debug the early init of a newly spawned Dalvik VM
New gdb commands
wait_exe_uid execute canned commands when hitting do_fork for an executable with the given UID
wait_android_vm execute canned commands when hitting do_fork for an executable with UID in the
range matching Android VMs (AID_APP)
21
ADCS#: ###### Revised: 23 September, 2010
Project Status and Maturity
Project Maturity
Historically based on GDB branch for ST40(sh4)/ST200 cross debuggers, many ST-internal contributors accountable for credit:
Mark Phillips, Miguel Santana, Chris Smith, Frederic Riss, ...
Widely deployed internally through Eclipse integration (STWorkbench)
Ongoing development for ARM MPSoC targets
Possible improvements
Leverage contribution of GDB as of 7.x: many contributions in the fields of scheduling control and multiple address and symbol space management.
22

ADCS#: ###### Revised: 23 September, 2010
About contribution and prospective
Feedback
We will consider the possibility to contribute this work upon positive feedback from the community.
Prospective work
Could be a basis to develop “Debuggers for Linux Cluster On Chip” ongoing PhD in this field (kevin pouget at st dot com)
Benefits of contribution
in mainstream GDB: encourage better core/device abstraction
in mainstream Kernel: encourage keeping access to data used for debug agnostic to kernel version and CONFIG_XXX and “JTAG friendly”
In JTAG probe software: support GDB-remote, present a hardware thread for each core
23
ADCS#: ###### Revised: 23 September, 2010
A word of conclusion
Suggestions for JTAG probe software implementers
act like a remote gdbserver, handle sw/hw breakpoints
Standardize “remote” commands for architecture specific coprocessor settings (typically cp15 operations on ARM)
Expose one hardware thread per core
Expose the implementation choices for SMP (whether all-block or not) thanks to remote target (gdb target abstraction).
Linux Kernel
so far we cope with most versions and CONFIG variants,
but would be nice if :
Used offsets and kernel symbols not moving too often
Fields needed for Linux-awareness kept contiguous to optimize transfers and limit intrusiveness.
24

ADCS#: ###### Revised: 23 September, 2010
25

![Debugging Embedded Linux Systems: Locate Device … · 1 Debugging Embedded Linux Systems: Locate Device Driver Source Code Debugging Embedded Linux Training Series [ Part 5]](https://static.documents.pub/doc/80x56/5b7deaf17f8b9a204c8d0f00/debugging-embedded-linux-systems-locate-device-1-debugging-embedded-linux-systems.jpg)


