
Michael MusserManaging DirectorHead of Industrial
Technology Practice+1.704.916.3074
Process ControlsElectrical &Electronics
Highly EngineeredProducts

KeyBanc M&A Accolades
Recent Awards
Ke
yB
an
cM
&A
Ac
co
lad
es
2015 Investment Bank of the Year
KeyBanc Capital Markets – InvestmentBank of the Year: Recognizing theinvestment bank that differentiated itselfwithin the middle market through its ability tostay active and demonstrate creativity ingetting deals to the finish line
2015 U.S. M&A Advisor of the Year
Global M&A Network’s prestigious M&A AtlasAwards honor top deals, star dealmakers andfirms from North and South America active inthe mergers, acquisitions, corporate andprivate equity deal communities. Winners areselected independently for successfullyclosing the best value-generatingtransactions with the best deal teamexpertise and execution.
Mergers & Acquisitions is a prominent digitalinformation and news service and monthlymiddle-market dealmaking. It covers allaspects of middle-market dealmaking.
2015 Deal of the Year Awards
KeyBanc Capital Markets, along with our distinguished clients,was honored for top achievements in three deal categories
Page 1
SPRING 2016
INDUSTRIAL TECHNOLOGY TRACKER
North America Private EquityDeal of the Year, Large Markets
Buy-Side Advisor
has acquired
$692,000,000Transaction Value
June 2015
$800,000,000Transaction Value
a portfolio company of
has been acquired by
Sell-Side Advisor
June 2015
North AmericaDeal of the Year, Large Markets
a portfolio company of
has been acquired by
Sell-Side Advisor
$124,000,000Transaction Value
December 2015
Deal of the Year, Small Markets
Page 2
SPRING 2016
INDUSTRIAL TECHNOLOGY TRACKER
3
Industry Update – Spring 2016
Contents
ECONOMIC INDICATORS
10 PROCESS CONTROLS
FlowControl
Process AutomationEquipment
19 ELECTRICAL & ELECTRONICS
ElectronicComponents
HIGHLY-ENGINEERED PRODUCTS24
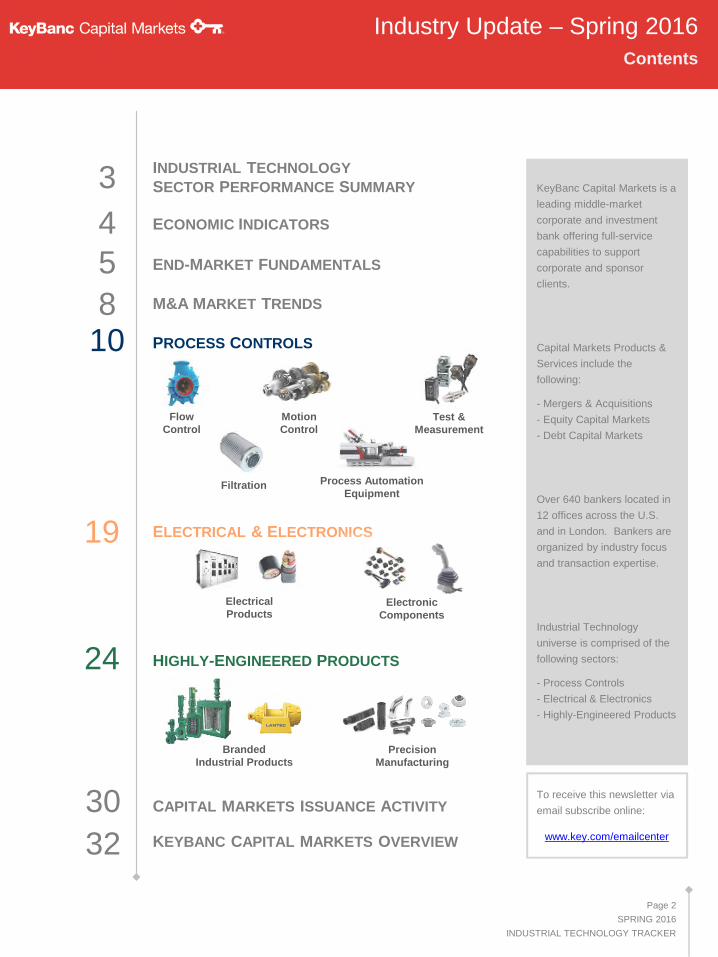
KeyBanc Capital Markets is a
leading middle-market
corporate and investment
bank offering full-service
capabilities to support
corporate and sponsor
clients.
Capital Markets Products &
Services include the
following:
- Mergers & Acquisitions
- Equity Capital Markets
- Debt Capital Markets
Over 640 bankers located in
12 offices across the U.S.
and in London. Bankers are
organized by industry focus
and transaction expertise.
Industrial Technology
universe is comprised of the
following sectors:
- Process Controls
- Electrical & Electronics
- Highly-Engineered Products
To receive this newsletter via
email subscribe online:
www.key.com/emailcenter
Filtration
4END-MARKET FUNDAMENTALS5M&A MARKET TRENDS
MotionControl
8
INDUSTRIAL TECHNOLOGY
SECTOR PERFORMANCE SUMMARY
PrecisionManufacturing
Test &Measurement
BrandedIndustrial Products
ElectricalProducts
KEYBANC CAPITAL MARKETS OVERVIEW
CAPITAL MARKETS ISSUANCE ACTIVITY30
32
80
90
100
110
120
130
140
May-13 Sep-13 Jan-14 May-14 Sep-14 Jan-15 May-15 Sep-15 Jan-16 May-16
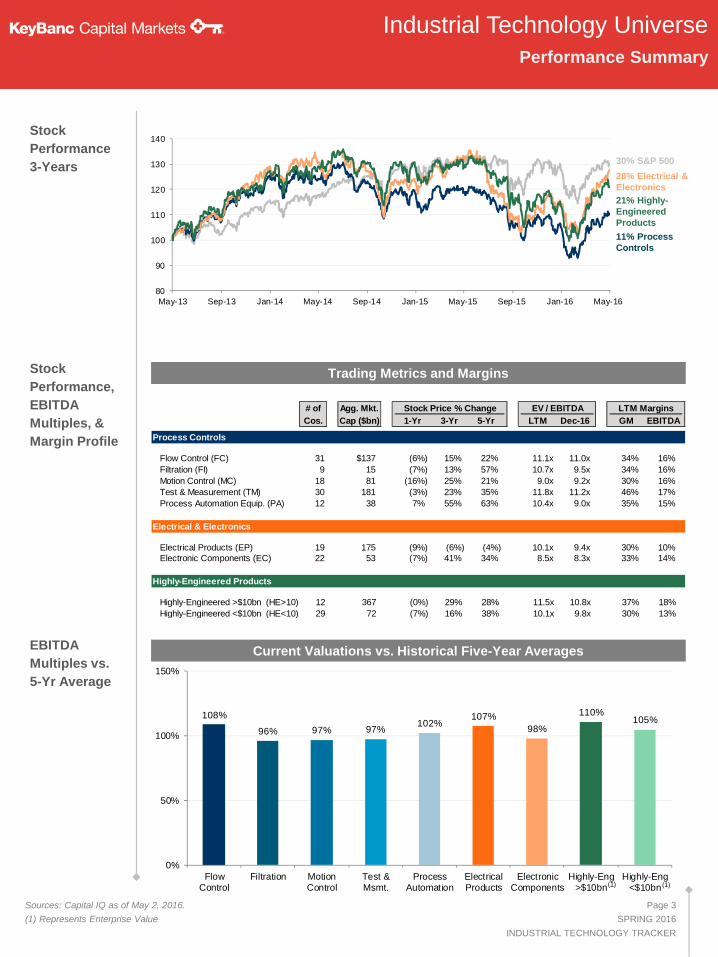
108%
96% 97% 97%102%
107%
98%
110%105%
0%
50%
100%
150%
FlowControl
Filtration MotionControl
Test &Msmt.
ProcessAutomation
ElectricalProducts
ElectronicComponents
Highly-Eng>$10bn
Highly-Eng<$10bn
# of Agg. Mkt. Stock Price % Change EV / EBITDA LTM Margins
Cos. Cap ($bn) 1-Yr 3-Yr 5-Yr LTM Dec-16 GM EBITDA
Process Controls
Flow Control (FC) 31 $137 (6%) 15% 22% 11.1x 11.0x 34% 16%
Filtration (FI) 9 15 (7%) 13% 57% 10.7x 9.5x 34% 16%
Motion Control (MC) 18 81 (16%) 25% 21% 9.0x 9.2x 30% 16%
Test & Measurement (TM) 30 181 (3%) 23% 35% 11.8x 11.2x 46% 17%
Process Automation Equip. (PA) 12 38 7% 55% 63% 10.4x 9.0x 35% 15%
Electrical & Electronics
Electrical Products (EP) 19 175 (9%) (6%) (4%) 10.1x 9.4x 30% 10%Electronic Components (EC) 22 53 (7%) 41% 34% 8.5x 8.3x 33% 14%
Highly-Engineered Products
Highly-Engineered >$10bn (HE>10) 12 367 (0%) 29% 28% 11.5x 10.8x 37% 18%
Highly-Engineered <$10bn (HE<10) 29 72 (7%) 16% 38% 10.1x 9.8x 30% 13%
28% Electrical &Electronics
21% Highly-EngineeredProducts
Industrial Technology Universe
Sources: Capital IQ as of May 2, 2016.
(1) Represents Enterprise Value
Stock
Performance
3-Years
Performance Summary
Page 3
SPRING 2016
INDUSTRIAL TECHNOLOGY TRACKER
Stock
Performance,
EBITDA
Multiples, &
Margin Profile
EBITDA
Multiples vs.
5-Yr Average
Trading Metrics and Margins
Current Valuations vs. Historical Five-Year Averages
11% ProcessControls
30% S&P 500
(1) (1)
-1
0
1
2
3
4
Q1 Q2 Q3 Q4 Q1 Q2 Q3 Q4 Q1 Q2 Q3 Q4
2013 2014 2015
US
EU28
-3
-2
-1
0
1
2
3
4
5
6
J M M J S N J M M J S N J M M J S N J M
2013 2014 2015 2016
45
50
55
60
65
J M M J S N J M M J S N J M M J S N J M
2013 2014 2015 2016
50
60
70
80
90
100
110
J M M J S N J M M J S N J M M J S N J M
2013 2014 2015 2016
90
100
110
120
J M M J S N J M M J S N J M M J S N J
2013 2014 2015 2016
Economic Indicators
Sources: Federal Reserve, Institute of Supply Management, U.S. Census Bureau, Bloomberg, WSJ,
Econoday, Conference Board, European Commission.
Note: EU28 represents the European Union.
Gross Domestic
Product
Industrial
Production
Ind
ex
Le
vel
ISM
Manufacturing
Index
%C
ha
ng
e(y
/y)
%C
ha
ng
e(y
/y)
Durable Goods
New Orders
Ind
ex
Le
vel
Exp
ansio
nC
ontra
ctio
n
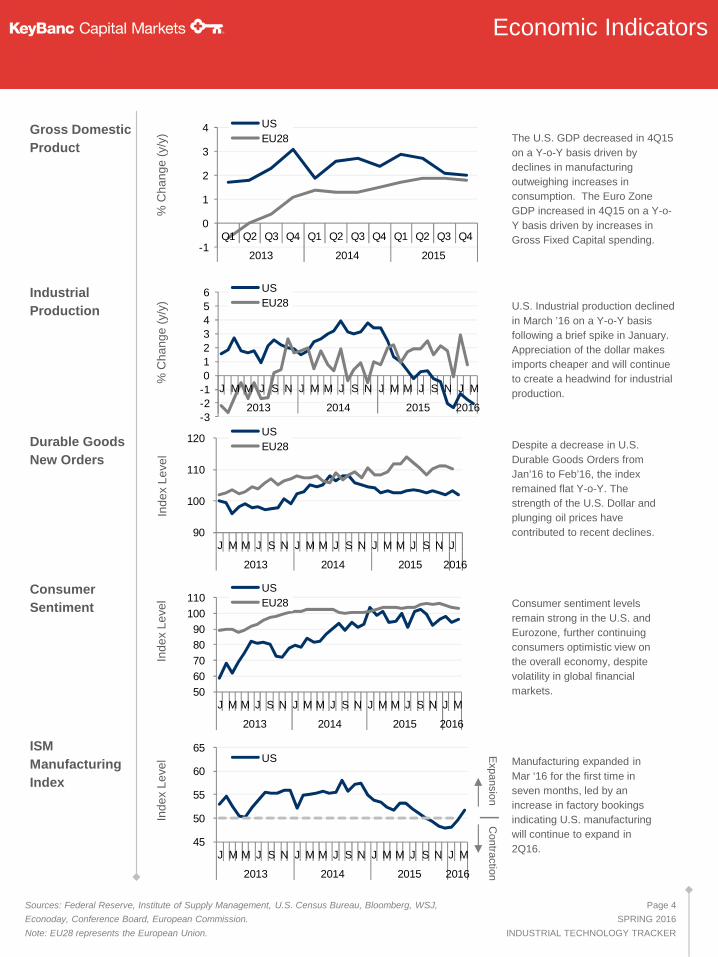
The U.S. GDP decreased in 4Q15
on a Y-o-Y basis driven by
declines in manufacturing
outweighing increases in
consumption. The Euro Zone
GDP increased in 4Q15 on a Y-o-
Y basis driven by increases in
Gross Fixed Capital spending.
U.S. Industrial production declined
in March ’16 on a Y-o-Y basis
following a brief spike in January.
Appreciation of the dollar makes
imports cheaper and will continue
to create a headwind for industrial
production.
Despite a decrease in U.S.
Durable Goods Orders from
Jan’16 to Feb’16, the index
remained flat Y-o-Y. The
strength of the U.S. Dollar and
plunging oil prices have
contributed to recent declines.
Manufacturing expanded in
Mar ‘16 for the first time in
seven months, led by an
increase in factory bookings
indicating U.S. manufacturing
will continue to expand in
2Q16.
Consumer
Sentiment
Ind
ex
Le
vel Consumer sentiment levels
remain strong in the U.S. and
Eurozone, further continuing
consumers optimistic view on
the overall economy, despite
volatility in global financial
markets.
Page 4
SPRING 2016
INDUSTRIAL TECHNOLOGY TRACKER
US
EU28
US
EU28
US
EU28
US

400
500
600
700
2013 2014 2015 2016 2017 2018 2019 2020
-
200
400
600
J FMAM J J A SOND J FMAM J J A SOND J FM
2014 2015 2016
End-Market Fundamentals
Sources: Equity Research, Boeing, Airbus, U.S. DoD Green Book.
The Current
End-Market
Cycle
Persistent weakness in oil prices has led to capex
curtailments, which places a continued strain on
companies with direct oil & gas exposure and those
selling into second- and third- derivative applications
Heavy-truck industry fundamentals are believed to
have peaked in 2015, evidenced by weak demand
and high inventory levels in 1Q16, resulting in the
current slowdown of the Class 8 truck market
OCTOBER 2015
Select
End-Markets
Commercial
Aerospace
The OEM order books remain
lackluster, despite Boeing’s orders
75% Y-o-Y increase. Airbus saw
negative orders in Mar ‘16 as
cancellations outpaced new orders.
Both Boeing and Airbus continue to
struggle to sell their largest aircraft,
the 747-8 jumbo jet and the A380,
respectively.
Ord
ers
inU
nits
Boeing Airbus
U.S. Defense
Spending
Despite congress reaching an
agreement for a two-year DoD
budget deal in Dec ‘15, defense
spending continues as a hot topic in
Congress amidst a wide array of
military challenges including
terrorism, regional instability in
MENA, globalization, and cyber
defense.
$in
bill
ion
s
Page 5
SPRING 2016
INDUSTRIAL TECHNOLOGY TRACKER
U.S. DoD Budget
Oil & Gas continues to negatively impact broader
markets; Heavy-truck faces overcapacity concerns Resi. Constr.Constr. Mach.(Light)
ChemicalsComm. Aero.(OEM)
AutomotiveHeavy Truck
Semi. Equip.
Water / Wastewater
Non-Res. Constr.
GeneralIndustrial
Comm. Aero.(AM)
Power Gen.
Military / Defense
Steel Oil & GasAg. Equip. Mining Equip.
Constr. Mach. (Heavy)
AcceleratingDecline
Trough Decline
AcceleratingGrowth
Peak Growth
DeceleratingGrowth
DeceleratingDecline
Oil & GasAg. Equip.
Mining Equip.
Constr. Mach. (Heavy)
Power Gen.
Military / Defense
Steel
GeneralIndustrial
Comm. Aero. (AM)
Semi. Equip.
Water / Wastewater
Non-Res. Constr.Automotive
Heavy Truck
Resi. Constr.
Constr.Mach. (Light)
Chemicals
Comm. Aero. (OEM)
MARCH 2016
North America

400
800
1,200
1,600
2,000
J FMAM J J A SOND J FMAM J J A SOND J FM
2014 2015 2016
(5)
-
5
10
15
20
J FMAM J J A SOND J FMAM J J A SOND J FM
2014 2015 2016
-
15
30
45
J F M AM J J A S ON D J F MAM J J A S ON D J F
2014 2015 2016
-
5
10
15
20
J F MAM J J A S ON D J F MAM J J A S ON D J F
2014 2015 2016
-
10
20
30
J FMAM J J A SOND J FMAM J J A SOND J FM
2014 2015 2016
End-Market Fundamentals
Sources: Equity Research, Association of Equipment Manufacturers, U.S. Census Bureau, American
Institute of Architects, FTR Associates, Auto Associations and Government Data (Bloomberg), Baker &
Hughes Inc., and Oil & Gas Journal.
Agriculture
Construction
Major farm equipment
manufacturers are experiencing a
softened global market as
economies remain weak. During
1Q16 retail buying under-preformed
expectations, while field inventories
continued to build, further
pressuring dealers to move
merchandise quickly.
Nonresidential construction
spending dipped in February,
following a strong increase in Jan
’16. Recent growth in construction
employment suggests there is no
cause for alarm in the recent dip.
Ord
ers
inU
nits
(00
0’s
)%
Ch
an
ge
(y/y
)
NA Tractor Sales
Heavy-Truck
Truck orders declined during the
first two months of ’16, and
preliminary data for March indicates
~15,800 units, the lowest since Sep
’12. Economic uncertainty
continues to cause Fleets to
proceed with caution, resulting in
delayed orders.
Ord
ers
inU
nits
(00
0’s
)
(continued)
Oil & Gas
The total rigs in the U.S. (those
actively searching for oil & gas)
have decreased by 57% Y-o-Y.
U.S. Oil and Gas companies
continue to cut the number of rigs
as the world oil market remains
plagued by depressed oil prices.
Un
its
B&H U.S. Rig Count
Automotive
NA Auto production slipped ~1%
Y-o-Y in Mar ’16. The decline in
production is attributed to the
Sterling Heights, Michigan Fiat
Chrysler Automobiles car production
plant closing for inventory control
and a large decline in Mexican auto
production.
%C
ha
ng
e(y
/y)
2013 2014NA Auto Production
Page 6
SPRING 2016
INDUSTRIAL TECHNOLOGY TRACKER
NA Class 8 Truck Orders
2013 2014Non-Resi Contruction Spend
100
103
106
109
112
J FMAM J J A SOND J FMAM J J A SOND J FM
2014 2015 2016
20
25
30
35
40
45
J F M A M J J A S O N D J F M A M J J A S O N D J
2014 2015 2016
405060708090
100110
J FMAM J J A SOND J FMAM J J A SOND J FM
2014 2015 2016
100
125
150
175
200
J FMAM J J A SOND J FMAM J J A SOND J FM
2014 2015 2016
0.90
0.95
1.00
1.05
1.10
1.15
1.20
J F MAM J J A S ON D J F MAM J J A S ON D J F
2014 2015 2016
End-Market Fundamentals
Sources: Equity Research, American Chemistry Council, Antaike, London Metal Exchange
(Bloomberg), International Monetary Fund, SEMI, Energy Information Administration.
Chemicals
Utilities / Power
Generation
Metals & Mining
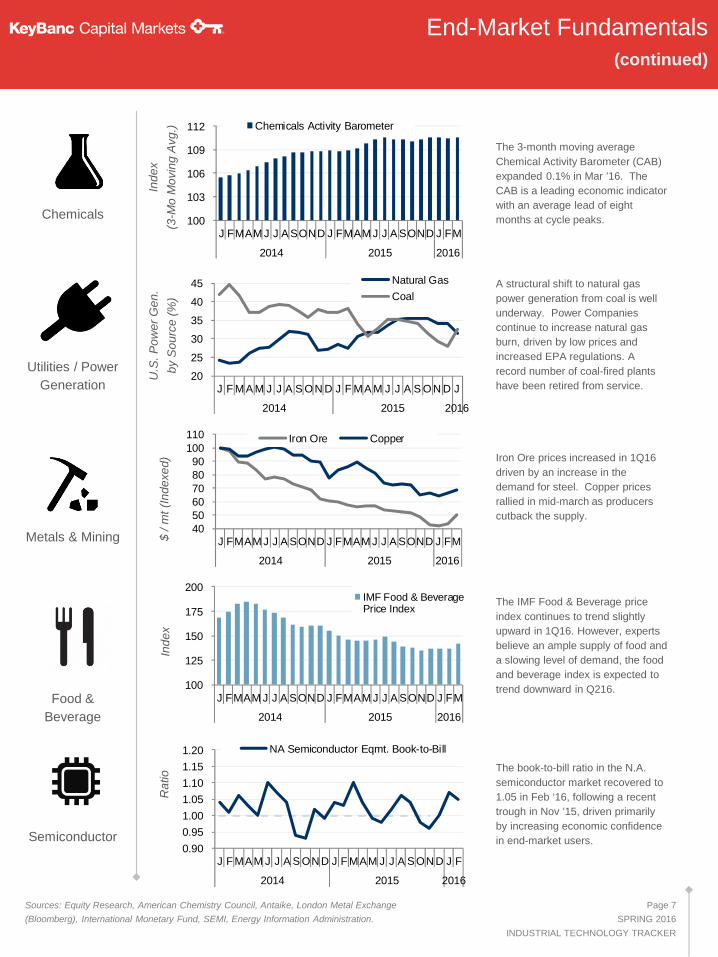
The 3-month moving average
Chemical Activity Barometer (CAB)
expanded 0.1% in Mar ’16. The
CAB is a leading economic indicator
with an average lead of eight
months at cycle peaks.
A structural shift to natural gas
power generation from coal is well
underway. Power Companies
continue to increase natural gas
burn, driven by low prices and
increased EPA regulations. A
record number of coal-fired plants
have been retired from service.
Iron Ore prices increased in 1Q16
driven by an increase in the
demand for steel. Copper prices
rallied in mid-march as producers
cutback the supply.
Ind
ex
(3-M
oM
ovin
gA
vg
.)
U.S
.P
ow
er
Ge
n.
by
So
urc
e(%
)$
/m
t(I
nd
exe
d)
Chemicals Activity Barometer
Iron Ore Copper
(continued)
Food &
Beverage
The IMF Food & Beverage price
index continues to trend slightly
upward in 1Q16. However, experts
believe an ample supply of food and
a slowing level of demand, the food
and beverage index is expected to
trend downward in Q216.
Ind
ex
Semiconductor
The book-to-bill ratio in the N.A.
semiconductor market recovered to
1.05 in Feb ‘16, following a recent
trough in Nov ’15, driven primarily
by increasing economic confidence
in end-market users.
Ra
tio
NA Semiconductor Eqmt. Book-to-Bill
Natural Gas
Coal
Page 7
SPRING 2016
INDUSTRIAL TECHNOLOGY TRACKER
IMF Food & BeveragePrice Index
-
30
60
90
120
1Q 2Q 3Q 4Q 1Q 2Q 3Q 4Q 1Q 2Q 3Q 4Q 1Q
2013 2014 2015 2016
$0
$150
$300
$450
$600
-
1,000
2,000
3,000
4,000
1Q 2Q 3Q 4Q 1Q 2Q 3Q 4Q 1Q 2Q 3Q 4Q 1Q
2013 2014 2015 2016
Highly-Engineered
Electrical &Electronic
ProcessControls
M&A Market Trends
Sources: Thomson Reuters, Capital IQ and KeyBanc Capital Markets.
(1) Control transactions in N.A., including U.S., Canada, and Mexico.
(2) Aggregate deal value represents the total of all disclosed transactions.
North American
M&A
Commentary
North American
Deal Activity
De
alC
ou
nt
(1)
De
alC
ou
nt
(1) A
gg
reg
ate
De
alV
alu
e($
B)
North America
North American
Industrial
Technology
Deal Activity
Page 8
SPRING 2016
INDUSTRIAL TECHNOLOGY TRACKER
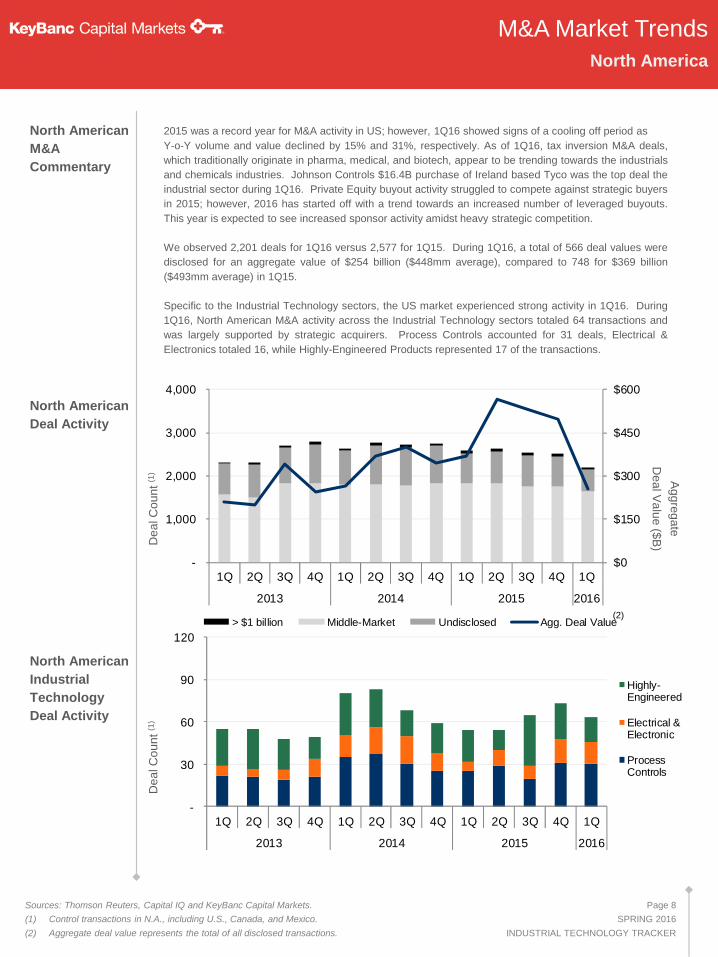
2015 was a record year for M&A activity in US; however, 1Q16 showed signs of a cooling off period as
Y-o-Y volume and value declined by 15% and 31%, respectively. As of 1Q16, tax inversion M&A deals,
which traditionally originate in pharma, medical, and biotech, appear to be trending towards the industrials
and chemicals industries. Johnson Controls $16.4B purchase of Ireland based Tyco was the top deal the
industrial sector during 1Q16. Private Equity buyout activity struggled to compete against strategic buyers
in 2015; however, 2016 has started off with a trend towards an increased number of leveraged buyouts.
This year is expected to see increased sponsor activity amidst heavy strategic competition.
We observed 2,201 deals for 1Q16 versus 2,577 for 1Q15. During 1Q16, a total of 566 deal values were
disclosed for an aggregate value of $254 billion ($448mm average), compared to 748 for $369 billion
($493mm average) in 1Q15.
Specific to the Industrial Technology sectors, the US market experienced strong activity in 1Q16. During
1Q16, North American M&A activity across the Industrial Technology sectors totaled 64 transactions and
was largely supported by strategic acquirers. Process Controls accounted for 31 deals, Electrical &
Electronics totaled 16, while Highly-Engineered Products represented 17 of the transactions.
> $1 billion Middle-Market Undisclosed Agg. Deal Value(2)

-
30
60
90
120
1Q 2Q 3Q 4Q 1Q 2Q 3Q 4Q 1Q 2Q 3Q 4Q 1Q
2013 2014 2015 2016
$0
$125
$250
$375
$500
-
1,000
2,000
3,000
4,000
1Q 2Q 3Q 4Q 1Q 2Q 3Q 4Q 1Q 2Q 3Q 4Q 1Q
2013 2014 2015 2016
M&A Market Trends
Sources: Thomson Reuters, Mergermarket, Capital IQ and KeyBanc Capital Markets.
(1) Control transactions in Europe.
(2) Aggregate deal value represents the total of all disclosed transactions.
Eurozone
M&A
Commentary
Eurozone
Deal Activity
De
alC
ou
nt
(1)
De
alC
ou
nt
(1) A
gg
reg
ate
De
alV
alu
e($
B)
Eurozone
Eurozone
Industrial
Technology
Deal Activity
Page 9
SPRING 2016
INDUSTRIAL TECHNOLOGY TRACKER
> $1 billion Middle-Market Undisclosed Agg. Deal Value(2)
Eurozone M&A activity slowed during 1Q16, following a post-crisis high in 2015. M&A activity remains
relatively high, as Y-o-Y volume and value increased 7.2% and 3.3%, respectively. 1Q16 was primarily
driven by outbound Chinese M&A. ChinaChem’s acquisition of Sygenta for $45.1B was the largest
Chinese outbound acquisition on record and the largest Eurozone deal in 1Q16. UK inbound deal activity
dropped by 38.5% from Q415 to 1Q16 due to wavering confidence of foreign investors as a possible
“Brexit” from the EU awaits decision.
We noted 2,623 deals for 1Q16 versus 2,446 for 1Q15. During 1Q16, a total of 598 deal values were
disclosed for an aggregate value of $155 billion ($258mm average), compared to 548 for $150 billion
($273mm average) in 1Q15.
Eurozone M&A activity across the Industrial Technology sectors totaled 67 transactions during 1Q16.
Process Controls accounted for 32 deals, Electrical & Electronics totaled 15, while Highly-Engineered
Products represented 20 of the transactions.
Highly-Engineered
Electrical &Electronic
ProcessControls

Electric Actuator Technology Prospers in
Production FieldsA more current and growing solution is the use of electric
actuators to move the valve, eliminating the use of gas
altogether. For most production sites, the electric actuators
must be able to handle the forces required by the process
and be able to react quickly to process changes with a
100% continuous duty cycle. [Read Full Article]
How Electric Motors are Getting ‘Wearables’ to
Monitor their Health
Process Controls
1.3M Industrial Robots to Enter Service by 2018
The automation of the fourth industrial revolution is
accelerating: By 2018, around 1.3 million industrial robots will
be entering service in factories around the world. In the high-
revenue automotive sector, global investments in industrial
robots increased by a record-breaking 43 percent (2013-
2014) within one year. [Read Full Article]
Sources: Eweek, Sensors Online, Automation Online; Control Engineering, Connecting Industry. Page 10
SPRING 2016
INDUSTRIAL TECHNOLOGY TRACKER
Salient
Industry
Topics
Pressure Sensor Construction Addresses
Challenges in Wet Environments
Like a wearable on a user's wrist that can monitor heart rate
and calories burned, electric motor company ABB has
developed a Bluetooth-linked sensor that can be mounted on
any of its electric motors to tell users how the machines are
working and if problems are cropping up. [Read Full Article]
Why Industry Needs to Redefine Solids Filtration
and Biological Control in Process Water
Engineers, manufacturers, utilities, public and private
enterprise, commerce, in fact any one that uses water for
temperature control are, in the most part, quite comfortable in
the belief that they are operating an effective and safe water
system – but how safe are they really? [Read Full Article]
Accurate measurement of low pressure with respect to
atmospheric reference (typically called vented or gauge
reference) requires that pressure sensors breathe under dry,
humid and wet conditions. [Read Full Article]

Process Controls
WaterjetCutting
Equipment
KFCFLOW CONTROL (“KFC”)
KMC
PressureTransducers
FlowMeters
LaserProfilers
MachineVision
Gears ElectricMotors
ActuatorsCouplings HydraulicCylinders
ProcessAnalyzers
Gearboxes VFD’s
FiltrationMedia
FiltrationSystems
Valves SealsPumps
Automated Production& CNC Equipment
Monitoring &Control
Instruments
ConveyorTechnologies
HeatExchangers
Molding & ExtrusionEquipment
Temp.Sensors
LabEquipment
Industrial Technology Indices
KFIFILTRATION (“KFI”)
KTM
KPA
MOTION CONTROL (“KMC”)
TEST & MEASUREMENT (“KTM”)
PROCESS AUTOMATION EQUIPMENT (“KPA”)
The KeyBanc Process Controls (“KPC”) index comprises 100 companies across
the five categories defined below:
PackagingEquipment
Page 11
SPRING 2016
INDUSTRIAL TECHNOLOGY TRACKER
11.1x10.7x
9.0x
11.8x
10.4x11.0x
9.5x 9.2x
11.2x
9.0x
4x
6x
8x
10x
12x
14x
Flow Control Filtration Motion Control Test & Msmt. Process AutomationEquipment
5x
6x
7x
8x
9x
10x
11x
12x
13x
14x
15x
May-11 Nov-11 May-12 Nov-12 May-13 Nov-13 May-14 Nov-14 May-15 Nov-15 May-16
-10%
10%
30%
50%
70%
-30% -20% -10% 0% 10% 20%
11.1x FC
10.4x PA
9.0x MC
11.8x TM
Process Controls
Public Comps Performance & Valuation
LTM CY 2016
Stock Price
Performance
EBITDA
Multiples
(LTM & Fwd.)
Historical
EV / EBITDA
Multiples
10.7x FI
Sources: Capital IQ as of May 2, 2016.
FlowControl
FiltrationMotionControl
Test &Msmt.
ProcessAutomation
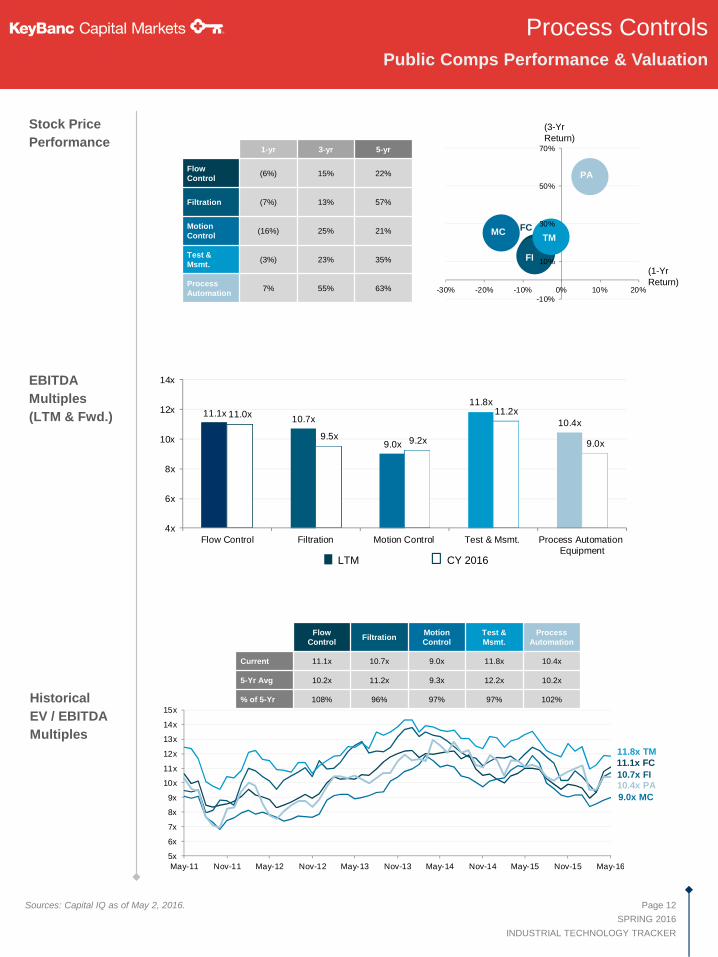
Current 11.1x 10.7x 9.0x 11.8x 10.4x
5-Yr Avg 10.2x 11.2x 9.3x 12.2x 10.2x
% of 5-Yr 108% 96% 97% 97% 102%
1-yr 3-yr 5-yr
FlowControl
(6%) 15% 22%
Filtration (7%) 13% 57%
MotionControl
(16%) 25% 21%
Test &Msmt.
(3%) 23% 35%
ProcessAutomation
7% 55% 63%
(1-YrReturn)
(3-YrReturn)
Page 12
SPRING 2016
INDUSTRIAL TECHNOLOGY TRACKER
FC
FI
TM
PA
MC

5/2/2016 OPERATING METRICS Net Debt / VALUATION
% of 52 52 Wk Mkt Ent LTM LTM EV / EBITDA Fwd PE
Ticker Price Wk High Return Cap Value Sales GM % EBITDA % Margin EBITDA LTM CY 2016 CY 2016
Flow Control (KFC)Atlas Copco AB OM:ATCO A $25.90 78% (17%) $30,735 $32,021 $12,410 40% $2,890 23% 0.4x 11.1x 11.4x 19.4x
Parker-Hannif in Corporation PH 115.50 92% (4%) 15,604 16,755 11,548 22% 1,511 13% 0.8 11.1 10.4 18.1
Pentair plc PNR 58.99 85% (5%) 10,660 15,340 6,550 34% 1,158 18% 4.0 13.3 12.5 14.4
Xylem Inc. XYL 42.25 98% 14% 7,554 8,148 3,663 39% 598 16% 1.1 13.6 12.5 20.6
Alfa Laval AB (publ) OM:ALFA 15.63 75% (16%) 6,557 8,036 4,798 33% 886 18% 1.6 9.1 10.3 15.9
Flow serve Corp. FLS 48.96 84% (14%) 6,383 7,727 4,494 34% 729 16% 1.8 10.6 11.8 19.6
IDEX Corporation IEX 82.47 95% 10% 6,260 6,997 2,021 45% 509 25% 1.4 13.7 13.4 22.1
Nordson Corporation NDSN 77.77 92% (4%) 4,432 5,512 1,682 54% 394 23% 2.7 14.0 13.4 19.5
Colfax Corporation CFX 32.05 60% (36%) 3,931 5,338 3,933 31% 469 12% 2.7 11.4 11.4 21.6
The Weir Group PLC LSE:WEIR 17.60 59% (38%) 3,752 4,968 2,828 33% 447 16% 2.7 11.1 13.2 19.9
Graco Inc. GGG 78.64 91% 8% 4,373 4,809 1,285 53% 344 27% 1.3 14.0 13.2 21.8
Aalberts Industries NV AALB 34.55 94% 11% 3,820 4,669 2,688 61% 408 15% 1.9 11.5 10.4 16.5
Curtiss-Wright Corporation CW 78.18 99% 8% 3,481 4,147 2,163 35% 411 19% 1.6 10.1 9.9 19.0
IMI plc LSE:IMI 13.71 73% (28%) 3,684 4,053 2,311 45% 424 18% 0.7 9.6 11.4 18.6
Crane Co. CR 56.32 88% (9%) 3,283 3,751 2,722 35% 450 17% 1.0 8.3 8.3 14.0
Spirax-Sarco Engineering plc LSE:SPX 50.08 91% (7%) 3,662 3,657 984 75% 263 27% - 13.9 13.4 22.9
ITT Corporation ITT 39.26 89% (3%) 3,527 3,650 2,506 32% 470 19% - 7.8 9.0 15.8
Ebara Corp. TSE:6361 4.53 75% 3% 2,109 2,406 4,148 27% 435 10% 0.4 5.5 5.2 NA
Watts Water Technologies, Inc. WTS 56.78 94% 4% 1,941 2,222 1,456 38% 198 14% 1.4 11.2 10.6 21.6
Mueller Water Products, Inc. MWA 10.90 98% 13% 1,760 2,155 1,139 31% 188 16% 2.1 11.5 10.5 21.8
SPX FLOW, Inc. FLOW 30.44 72% NA 1,264 2,087 2,322 33% 255 11% 3.2 8.2 8.5 16.5
Interpump Group SpA BIT:IP 14.25 78% (15%) 1,536 1,836 972 35% 196 20% 1.4 9.4 8.7 15.6
Mueller Industries Inc. MLI 31.86 87% (10%) 1,820 1,794 2,096 14% 162 8% - 11.1 NA 20.6
CIRCOR International, Inc. CIR 61.38 100% 10% 1,008 1,039 641 32% 73 11% 0.4 14.1 14.2 28.3
Chart Industries Inc. GTLS 25.77 68% (30%) 788 858 989 28% 117 12% 0.6 7.4 10.6 45.1
Lindsay Corporation LNN 76.64 83% (2%) 826 853 526 28% 69 13% 0.4 12.4 14.3 30.4
Gorman-Rupp Co. AMEX:GRC 29.16 89% 7% 761 720 407 22% 55 14% - 13.0 NA 32.4
KSB Aktiengesellschaft DB:KSB 358.44 65% (30%) 621 683 2,541 55% 200 8% - 3.4 4.1 12.5
Thermon Group Holdings, Inc. THR 18.95 74% (17%) 610 638 284 47% 60 21% 0.4 10.6 10.4 22.3
Ampco-Pittsburgh Corp. AP 18.91 98% 18% 231 149 238 18% 17 7% - 8.9 NA NA
Graham Corporation GHM 19.38 81% (17%) 190 117 105 30% 16 16% - 7.1 12.8 56.2
Median 87% (5%) $3,481 $3,657 $2,163 34% $394 16% 1.4x 11.1x 11.0x 19.9x
Filtration (KFI)Donaldson Company, Inc. DCI $32.80 88% (13%) $4,360 $4,784 $2,241 34% $348 16% 1.2x 13.8x 12.9x 20.6x
Essentra plc LSE:ESNT 11.91 78% (20%) 3,097 3,653 1,727 57% 296 17% 1.9 12.3 11.0 15.5
CLARCOR Inc. CLC 59.04 91% (9%) 2,863 3,166 1,408 33% 247 18% 1.2 12.8 12.5 22.0
ESCO Technologies Inc. ESE 38.66 97% 5% 998 1,029 560 37% 90 16% 0.7 11.4 9.5 19.1
Calgon Carbon Corporation CCC 16.25 72% (28%) 822 880 520 36% 100 19% 0.6 8.8 8.3 18.2
Ahlstrom Oyj HLSE:AHL1V 9.09 96% 6% 424 653 1,215 15% 121 10% 1.8 5.4 5.2 19.6
Lydall, Inc. LDL 37.44 96% 39% 641 585 527 24% 70 13% - 8.4 7.3 16.3
CECO Environmental Corp. CECE 6.53 52% (45%) 222 371 367 30% 47 13% 3.1 8.0 6.9 8.5
Porvair plc LSE:PRV 4.74 94% 3% 212 196 144 34% 18 13% - 10.7 11.1 20.5
Median 91% (9%) $822 $880 $560 34% $100 16% 1.2x 10.7x 9.5x 19.1x
Process Controls
Indices and Company Composition
Sources: Capital IQ as of May 2, 2016.
Note: $ in millions
Page 13
SPRING 2016
INDUSTRIAL TECHNOLOGY TRACKER

Motion Control (KMC)Nidec Corporation TSE:6594 $75.68 71% 0% $22,446 $22,475 $10,487 23% $1,682 16% - 13.4x 11.3x NA
Rockw ell Automation Inc. ROK 113.24 89% (7%) 14,882 14,363 6,050 42% 1,214 20% - 11.8 11.3 19.2x
SKF AB OM:SKF B 18.11 68% (26%) 8,247 10,255 9,166 25% 1,465 16% 1.2x 7.0 8.1 13.5
GKN plc LSE:GKN 4.09 74% (23%) 6,981 8,140 10,664 56% 1,175 11% 1.0 6.9 5.9 10.0
WEG S.A. BOVESPA:WEGE3 4.35 75% (17%) 7,017 7,911 2,831 28% 450 16% 1.9 17.6 17.1 20.3
Regal Beloit Corporation RBC 65.04 80% (17%) 2,905 4,428 3,510 27% 544 15% 2.7 8.1 8.6 13.1
Rexnord Corporation RXN 21.98 79% (18%) 2,228 3,717 1,950 35% 356 18% 4.2 10.4 9.7 15.2
The Timken Company TKR 35.81 88% (9%) 2,837 3,414 2,834 27% 447 16% 1.2 7.6 8.8 18.4
Yaskaw a Electric Corp. TSE:6506 11.86 71% (12%) 3,159 3,330 3,688 33% 427 12% 0.3 7.8 7.7 NA
Moog Inc. MOG.A 51.17 71% (26%) 1,877 2,643 2,437 30% 308 13% 2.5 8.6 8.5 14.6
Rotork plc LSE:ROR 2.74 70% (24%) 2,378 2,482 806 46% 199 25% 0.5 12.5 13.4 20.9
RBC Bearings Inc. ROLL 73.58 96% 1% 1,721 2,061 549 38% 134 24% 2.5 15.4 12.6 22.4
Franklin Electric Co., Inc. FELE 32.78 90% (9%) 1,513 1,678 918 33% 135 15% 1.2 12.5 11.5 19.9
NN Inc. NNBR 15.18 51% (40%) 407 1,217 910 23% 170 19% 4.8 7.2 7.4 9.1
Altra Industrial Motion Corp. AIMC 29.28 98% 6% 761 951 734 31% 106 14% 1.8 9.0 9.9 19.7
RENK AG DB:ZAR 112.82 92% 1% 767 632 529 23% 132 25% - 4.8 NA NA
Columbus McKinnon Corporation CMCO 16.53 64% (35%) 332 563 591 31% 59 10% 3.9 9.6 8.0 11.7
Allied Motion Technologies Inc. AMOT 22.22 70% (28%) 207 255 237 29% 28 12% 1.7 9.0 NA NA
Median 75% (17%) $2,303 $2,986 $2,194 30% $332 16% 1.8x 9.0x 9.2x 16.8x
Test & Measurement (KTM)Danaher Corp. DHR $97.39 100% 18% $67,072 $78,872 $21,256 53% $4,961 23% 2.4x 15.9x 14.7x 19.8x
Roper Technologies, Inc. ROP 177.50 91% 5% 17,961 20,549 3,620 61% 1,181 33% 2.2 17.4 15.0 25.4
Hexagon AB OM:HEXA B 39.94 94% 8% 14,396 16,263 3,306 60% 972 29% 1.8 16.7 14.8 21.8
Rockw ell Automation Inc. ROK 113.24 89% (7%) 14,882 14,363 6,050 42% 1,214 20% - 11.8 11.3 19.2
Ametek Inc. AME 48.46 84% (8%) 11,355 13,186 3,935 36% 1,094 28% 1.7 12.1 12.5 19.7
Mettler-Toledo International Inc. MTD 362.99 99% 13% 9,754 10,246 2,399 56% 554 23% 0.9 18.5 16.8 25.3
Sensata Technologies ST 37.67 66% (32%) 6,425 9,639 3,021 35% 865 29% 3.7 11.1 11.8 13.1
Halma plc LSE:HLMA 13.08 96% 22% 4,944 5,080 1,164 55% 283 24% 0.5 18.0 16.4 26.8
FLIR Systems, Inc. FLIR 30.56 90% (2%) 4,204 4,048 1,592 47% 357 22% - 11.3 10.8 18.8
Teledyne Technologies Inc. TDY 93.52 84% (9%) 3,224 3,920 2,264 38% 372 16% 1.9 10.5 10.7 18.3
Spectris plc LSE:SXS 26.71 75% (19%) 3,174 3,319 1,755 57% 293 17% 0.5 11.3 11.1 16.0
National Instruments NATI 27.92 88% (2%) 3,569 3,265 1,223 74% 211 17% - 15.5 13.8 24.5
Yokogaw a Electric Corp. TSE:6841 10.87 70% (6%) 2,901 2,822 3,543 43% 486 14% - 5.8 5.6 NA
Cognex Corporation CGNX 35.21 68% (23%) 2,993 2,644 445 77% 137 31% - 19.2 19.6 28.6
MSA Safety Incorporated MSA 49.14 90% 9% 1,836 2,201 1,153 44% 186 16% 2.0 11.8 10.8 17.9
Renishaw plc LSE:RSW 27.81 71% (27%) 2,020 1,967 692 53% 189 27% - 10.4 11.9 19.4
Itron, Inc. ITRI 41.23 95% 15% 1,563 1,821 1,878 30% 149 8% 1.6 12.2 9.5 19.4
MKS Instruments, Inc. MKSI 36.53 92% 2% 1,947 1,280 783 44% 181 23% - 7.1 6.5 16.6
Badger Meter Inc. BMI 71.92 94% 15% 1,046 1,097 395 37% 63 16% 0.8 17.4 16.6 30.1
MTS Systems Corporation MTSC 56.56 78% (20%) 835 817 562 38% 80 14% - 10.2 9.4 18.5
Chroma ATE Inc. TSEC:2360 2.22 95% (8%) 837 790 323 44% 49 15% - 16.2 13.3 17.9
Mistras Group, Inc. MG 24.20 91% 34% 700 787 710 31% 97 14% 0.9 8.1 8.8 26.5
Oxford Instruments plc LSE:OXIG 9.63 59% (34%) 549 753 568 45% 70 12% 3.0 10.8 9.0 13.2
INFICON Holding AG IFCN 323.53 88% (15%) 761 697 279 49% 48 17% - 14.4 12.7 20.5
CTS Corporation CTS 16.22 80% (10%) 531 465 381 34% 65 17% - 7.1 6.6 15.6
Landauer Inc. LDR 35.25 82% 7% 338 457 150 52% 36 24% 3.3 12.8 12.7 20.6
Isra Vision AG. XTRA:ISR 71.95 94% 10% 315 351 124 56% 37 30% 0.9 9.5 8.3 18.9
FARO Technologies Inc. FARO 29.21 60% (28%) 486 336 323 53% 24 8% - 13.8 9.5 23.3
Vishay Precision Group, Inc. VPG 14.93 95% 3% 197 168 232 36% 23 10% - 7.2 5.5 15.5
First Sensor AG XTRA:SIS 12.31 83% 7% 124 163 163 48% 18 11% 2.0 9.1 7.1 17.1
Median 89% (2%) $1,983 $2,084 $968 46% $183 17% 1.8x 11.8x 11.2x 19.4x
Process Automation Equipment (KPA)GEA Group DB:G1A $46.88 91% (3%) $8,808 $7,640 $4,995 32% $680 14% - 11.2x 9.1x 19.9x
Middleby Corp. MIDD 110.85 88% 8% 6,379 7,090 1,827 39% 395 22% 1.8x 18.0 15.5 25.0
Andritz AG WBAG:ANDR 55.75 85% (5%) 5,705 4,717 7,131 46% 602 8% - 7.8 7.3 16.1
Metso Corporation HLSE:MEO1V 23.80 75% (16%) 3,569 3,697 2,879 31% 427 15% 0.3 8.7 9.4 17.6
Krones AG XTRA:KRN 114.98 85% 4% 3,633 3,345 3,652 99% 359 10% - 9.3 9.0 19.3
Hillenbrand, Inc. HI 30.27 93% 4% 1,907 2,488 1,529 37% 238 16% 2.4 10.4 8.7 14.4
I.M.A. IMA 58.48 97% 15% 2,193 2,413 1,225 46% 462 38% 0.4 5.2 4.3 24.8
Marel hf ICSE:MARL 2.03 94% 53% 1,456 2,026 945 40% 152 16% 3.7 13.3 NA NA
Milacron Holdings Corp. MCRN 17.08 80% NA 1,148 2,020 1,178 34% 213 18% 4.1 9.5 9.0 11.3
John Bean Technologies JBT 52.42 86% 36% 1,531 1,800 1,149 29% 126 11% 2.1 14.3 NA NA
Astec Industries, Inc. ASTE 49.05 99% 16% 1,128 1,063 973 23% 81 8% - 13.1 10.3 21.9
Key Technology, Inc. KTEC 8.88 67% (32%) 55 57 115 29% - - - NA NA NA
Median 87% 4% $2,050 $2,450 $1,377 35% $359 15% 2.1x 10.4x 9.0x 19.3x
5/2/2016 OPERATING METRICS Net Debt / VALUATION
% of 52 52 Wk Mkt Ent LTM LTM EV / EBITDA Fwd PE
Ticker Price Wk High Return Cap Value Sales GM % EBITDA % Margin EBITDA LTM CY 2016 CY 2016
Process Controls
Sources: Capital IQ as of May 2, 2016.
Note: $ in millions
Page 14
SPRING 2016
INDUSTRIAL TECHNOLOGY TRACKER
Indices andCompany Composition
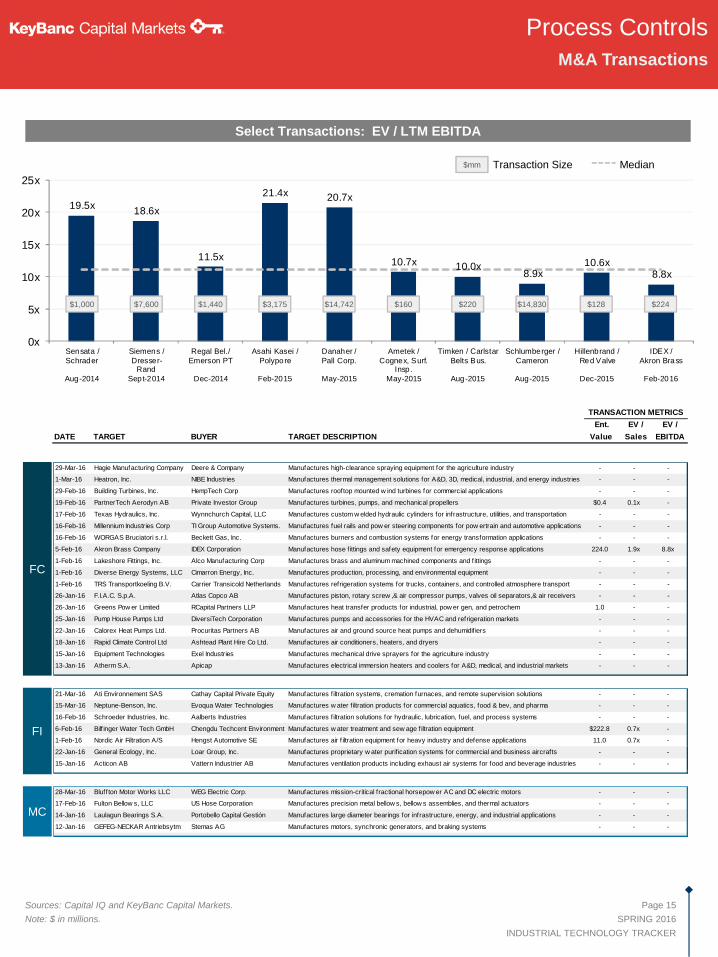
19.5x18.6x
11.5x
21.4x 20.7x
10.7x 10.0x8.9x
10.6x8.8x
0x
5x
10x
15x
20x
25x
Sensata /Schrader
Aug-2014
Siemens /Dresser-
RandSept-2014
Regal Bel./Emerson PT
Dec-2014
Asahi Kasei /Polypore
Feb-2015
Danaher /Pall Corp.
May-2015
Ametek /Cognex, Surf.
Insp.May-2015
Timken / CarlstarBelts Bus.
Aug-2015
Schlumberger /Cameron
Aug-2015
Hillenbrand /Red Valve
Dec-2015
IDEX /Akron Brass
Feb-2016
28-Mar-16 Bluff ton Motor Works LLC WEG Electric Corp. Manufactures mission-critical fractional horsepow er AC and DC electric motors - - -
17-Feb-16 Fulton Bellow s, LLC US Hose Corporation Manufactures precision metal bellow s, bellow s assemblies, and thermal actuators - - -
14-Jan-16 Laulagun Bearings S.A. Portobello Capital Gestión Manufactures large diameter bearings for infrastructure, energy, and industrial applications - - -
12-Jan-16 GEFEG-NECKAR Antriebsytm Stemas AG Manufactures motors, synchronic generators, and braking systems - - -
21-Mar-16 Ati Environnement SAS Cathay Capital Private Equity Manufactures filtration systems, cremation furnaces, and remote supervision solutions - - -
15-Mar-16 Neptune-Benson, Inc. Evoqua Water Technologies Manufactures w ater filtration products for commercial aquatics, food & bev, and pharma - - -
16-Feb-16 Schroeder Industries, Inc. Aalberts Industries Manufactures filtration solutions for hydraulic, lubrication, fuel, and process systems - - -
6-Feb-16 Bilf inger Water Tech GmbH Chengdu Techcent Environment Manufactures w ater treatment and sew age f iltration equipment $222.8 0.7x -
1-Feb-16 Nordic Air Filtration A/S Hengst Automotive SE Manufactures air f iltration equipment for heavy industry and defense applications 11.0 0.7x -
22-Jan-16 General Ecology, Inc. Loar Group, Inc. Manufactures proprietary w ater purification systems for commercial and business aircrafts - - -
15-Jan-16 Acticon AB Vattern Industrier AB Manufactures ventilation products including exhaust air systems for food and beverage industries - - -
29-Mar-16 Hagie Manufacturing Company Deere & Company Manufactures high-clearance spraying equipment for the agriculture industry - - -
1-Mar-16 Heatron, Inc. NIBE Industries Manufactures thermal management solutions for A&D, 3D, medical, industrial, and energy industries - - -
29-Feb-16 Building Turbines, Inc. HempTech Corp Manufactures rooftop mounted w ind turbines for commercial applications - - -
19-Feb-16 PartnerTech Aerodyn AB Private Investor Group Manufactures turbines, pumps, and mechanical propellers $0.4 0.1x -
17-Feb-16 Texas Hydraulics, Inc. Wynnchurch Capital, LLC Manufactures custom w elded hydraulic cylinders for infrastructure, utilities, and transportation - - -
16-Feb-16 Millennium Industries Corp TI Group Automotive Systems. Manufactures fuel rails and pow er steering components for pow ertrain and automotive applications - - -
16-Feb-16 WORGAS Bruciatori s.r.l. Beckett Gas, Inc. Manufactures burners and combustion systems for energy transformation applications - - -
5-Feb-16 Akron Brass Company IDEX Corporation Manufactures hose f ittings and safety equipment for emergency response applications 224.0 1.9x 8.8x
1-Feb-16 Lakeshore Fittings, Inc. Alco Manufacturing Corp Manufactures brass and aluminum machined components and f ittings - - -
1-Feb-16 Diverse Energy Systems, LLC Cimarron Energy, Inc. Manufactures production, processing, and environmental equipment - - -
1-Feb-16 TRS Transportkoeling B.V. Carrier Transicold Netherlands Manufactures refrigeration systems for trucks, containers, and controlled atmosphere transport - - -
26-Jan-16 F.I.A.C. S.p.A. Atlas Copco AB Manufactures piston, rotary screw ,& air compressor pumps, valves oil separators,& air receivers - - -
26-Jan-16 Greens Pow er Limited RCapital Partners LLP Manufactures heat transfer products for industrial, pow er gen, and petrochem 1.0 - -
25-Jan-16 Pump House Pumps Ltd DiversiTech Corporation Manufactures pumps and accessories for the HVAC and refrigeration markets - - -
22-Jan-16 Calorex Heat Pumps Ltd. Procuritas Partners AB Manufactures air and ground source heat pumps and dehumidif iers - - -
18-Jan-16 Rapid Climate Control Ltd Ashtead Plant Hire Co Ltd. Manufactures air conditioners, heaters, and dryers - - -
15-Jan-16 Equipment Technologies Exel Industries Manufactures mechanical drive sprayers for the agriculture industry - - -
13-Jan-16 Atherm S.A. Apicap Manufactures electrical immersion heaters and coolers for A&D, medical, and industrial markets - - -
Process Controls
M&A Transactions
Sources: Capital IQ and KeyBanc Capital Markets.
Note: $ in millions.
Select Transactions: EV / LTM EBITDA
Median
$14,742
$mm Transaction Size
$224$1,000 $7,600 $3,175$1,440
Page 15
SPRING 2016
INDUSTRIAL TECHNOLOGY TRACKER
FC
FI
MC
TRANSACTION METRICS
Ent. EV / EV /
DATE TARGET BUYER TARGET DESCRIPTION Value Sales EBITDA
$160 $220 $14,830 $128

31-Mar-16 System Logistics Spa Krones AG (XTRA:KRN) Manufactures automatic storage & retrieval systems including stacker cranes & vertical lift equip - - -
25-Mar-16 INDCO, Inc. Janel Corporation Manufactures specialty industrial mixers for industrial applications $11.3 - -
23-Mar-16 The Paslin Company Zhejiang Wanfeng Tech Manufactures and integrates full-service robotics for the automotive industry 302.0 - -
21-Mar-16 Morbark, Inc. Stellex Capital Management Manufactures tree chippers, tree grinders, and flails for w ood cutting applications - - -
18-Mar-16 Elliott Manufacturing Comp Massman Automation Designs Manufactures modular case packaging systems, case packers, and automatic hot melt sealers - - -
16-Mar-16 Rofin-Sinar Technologies Coherent, Inc. Manufactures laser technology for industrial cutting systems 780.0 1.5x 10.6x
15-Mar-16 Torninova S.r.l. Gruppo Colines Holding S.R.L. Manufactures plastic material extrusion lines including air bubble film and PE-foam machinery - - -
14-Mar-16 telerobot s.p.a Industria Macchine Automatiche Manufactures advanced robotics and specialized machines for assembly, handling, and production 3.3 - -
9-Mar-16 Sur-Form Corporation Big 3 Precision Products, Inc. Manufactures material handling solutions for the packaging industry - - -
7-Mar-16 Mould & Matic Solutions Gmbh Kiefel GmbH Manufactures thermoforming molds and injection molds for the packaging industry - - -
29-Feb-16 Corima Intl Machinery Srl Suzhou SLAC Precision Equipt Manufactures electro coaters, unw rappers, and conversion line products for the packaging industry 0.9 - -
18-Feb-16 TECHMATIK SA Columbia Machine, Inc. Manufactures molds, production machines, and batching & mixing solutions for dry cast concrete - - -
15-Feb-16 Stork Fabricators, Inc. Pro Mach, Inc. Manufactures fully automatic shrink w rapping systems - - -
15-Feb-16 Hymmen Industrieanlagen Private Investor Group Manufactures industrial printing lines, process automation equipment and machinery - - -
12-Feb-16 J. Bonals, S.A. Eurotab SA Manufactures compressing, compacting, granulation, and drying machines for industrial applications - - -
2-Feb-16 IMAFORNI INT'L S.p.A. GEA Group Manufactures mixers, dough feeding, forming items, ovens, and auxiliary equipment for food & bev - - -
1-Feb-16 Synerlink Iberica Synerlink SA Manufactures dairy packaging and filling machines that include form, f ill and seal machines - - -
1-Feb-16 SVM Automatik A/S Stevanato Group S.p.A. Manufactures automated assembly machines for the pharmaceutical industry - - -
27-Jan-16 Fabryka Urzadzen Gornictw a Zamet Industry S.A. Manufactures conveyor belt coilers, transport craw lers, spreaders, and excavators 11.2 - -
18-Jan-16 KUNZMANN Maschinenbau WEILER Werkzeugmaschinen Manufactures milling machines for tool & mold production and industrial markets - - -
14-Jan-16 elumatec AG EMMEGI S.p.A. Manufactures machines for processing aluminum, PVC, and steel prof iles 83.6 - -
5-Jan-16 Gemcor II, LLC Ascent Aerospace Manufactures automated fastening systems for the aerospace industry 44.0 - -
31-Mar-16 Cincinnati Sub-Zero Prods Gentherm Incorporated Manufactures temperature management equipment for the medical and industrial industries - - -
31-Mar-16 AICON 3D Systems GmbH Hexagon AB Manufactures measuring machines for vehicle testing and tube manufacturing - - -
18-Mar-16 Senmatic A/S Indutrade AB Manufactures sensors to measure temperature, humidity and gases - - -
11-Mar-16 Cruise Automation, Inc. General Motors Company Manufactures automated driving technology including precision steering and collision avoidance - - -
10-Mar-16 Tolteq Group, LLC National Oilw ell Varco Manufactures drilling measurement systems and solutions for the O&G industry - - -
2-Mar-16 MCC Control Systems LP S.J. Electro Systems, Inc. Manufactures integrated automation solutions for the w aste and w astew ater industries - - -
16-Feb-16 Speno International S.A. Private Investor Group Provides measurement, ultrasound, and detection of rail faults - - -
5-Feb-16 Brookfield Engineering Labs Ametek Inc Manufactures texture analyzers and pow der testing products - - -
4-Feb-16 Tideland Signal Corporation Xylem Inc Manufactures audible aids, buoys, helidecks, lanterns, and remote monitoring for marine navigation - - -
4-Feb-16 Cascade Microtech Inc FormFactor Inc Manufactures precision electrical test and measurement for semiconductor devices - - -
7-Jan-16 DIT-MCO International Sage Capital, LLC Manufactures w iring analyzers for automated testing solutions - - -
4-Jan-16 Klein Associates Mitcham Industries Manufactures sonar equipment and w aterside security/maritime domain aw areness systems - - -
PA
Process Controls
M&A Transactions
Sources: Capital IQ and KeyBanc Capital Markets.
Note: $ in millions.
TM
Page 16
SPRING 2016
INDUSTRIAL TECHNOLOGY TRACKER
TRANSACTION METRICS
Ent. EV / EV /
DATE TARGET BUYER TARGET DESCRIPTION Value Sales EBITDA

May 5, 2016
CW: Free Cash Flow Continues toShine
January 27, 2016
IEX: 4Q15 Operationally in Line
May 1, 2016
CIR: Encouraging Signs in 1Q16 fromRevenue and Margin Resilience
Process Controls
Selected Equity Research
Sources: KeyBanc Capital Markets Equity Research.
Flow Control
Commentary
Page 17
SPRING 2016
INDUSTRIAL TECHNOLOGY TRACKER
KeyBanc Capital
Markets’ Industrial
Research platform
has consistently
achieved a Top 2
ranking in Greenwich
Associates annual
survey of small / mid-
cap fund managers.
(1)
April 28, 2016
FLS: Strong EPD Volume in 1Q16;Aftermarket Stabilizing
February 3, 2016
THR: Valuation Interesting, butUncertainty Over Trough Balances
Current/Risk Reward….
April 26, 2016
PNR: Well Diversified Mix and V&CCost-Outs Holding the Line
May 6, 2016
ITT: Continued MT Strength Offsetby Worse than Expected IP End
Markets
April 20, 2016
GGG: 1Q16 Miss on Weak Process;Full-Year MSD Organic Growth
Guide Reaffirmed
Our top-ranked(1) equity research team covers numerous companies across the Process
Controls sector. Selected recent research notes are provided below. Click on the
respective “tear out” to read the entire note.

Process Controls
Motion Control
Commentary
Test &
Measurement
Commentary
Selected Equity Research
Sources: KeyBanc Capital Markets Equity Research.
.
Page 18
SPRING 2016
INDUSTRIAL TECHNOLOGY TRACKER
KeyBanc Capital
Markets’ Industrial
Research platform
has consistently
achieved a Top 2
ranking in Greenwich
Associates annual
survey of small / mid-
cap fund managers.
April 29, 2016
AIMC: Decrementals Continue toImprove; Ample 2H Contingency in
Reaffirmed Guide
February 2, 2016
RXN: Solid Margin Beat inF3Q16; Guide Fine-Tuned
February 8, 2016
RBC: 4Q15 Weaker on Soft PTSAftermarket; 2016 Guide Likely
Includes Refi
April 29, 2016
MOG.A: 2Q Marks Solid SequentialImprovement
April 28, 2016
AME: We Think Selloff De-Risks theFY16 Story
April 26, 2016
FLIR: Are Margin HeadwindsStructural?
May 2, 2016
MKS: Completes NewportAcquisition, Moves Up a Weight…
April 7, 2016
MG: Downgrading to Sector Weighton Valuation
Electrical & Electronics
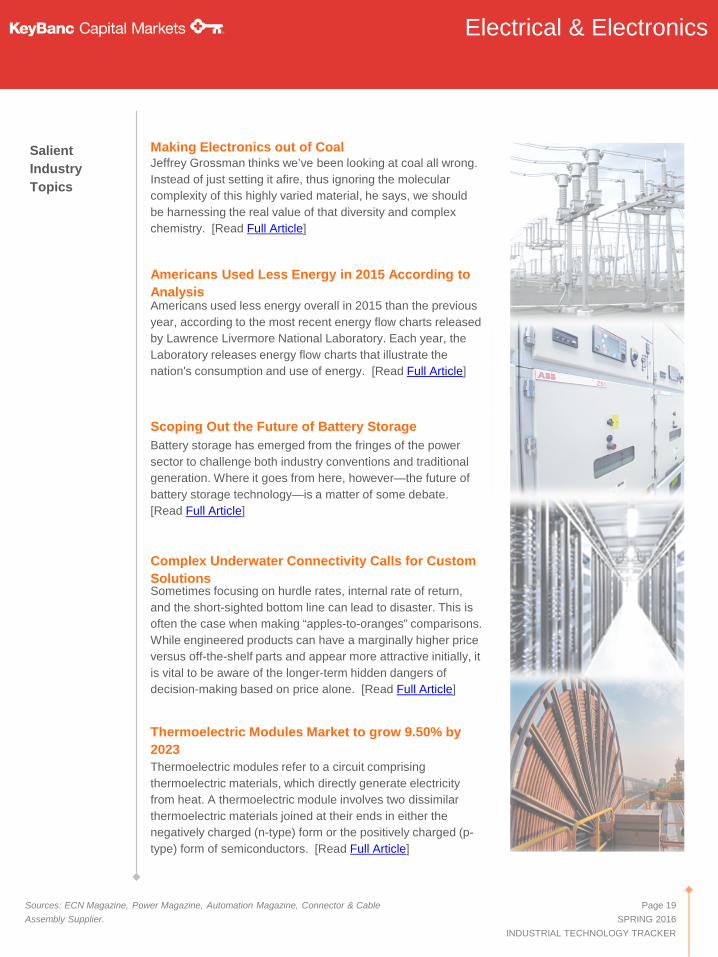
Making Electronics out of CoalJeffrey Grossman thinks we’ve been looking at coal all wrong.
Instead of just setting it afire, thus ignoring the molecular
complexity of this highly varied material, he says, we should
be harnessing the real value of that diversity and complex
chemistry. [Read Full Article]
Thermoelectric Modules Market to grow 9.50% by
2023
Thermoelectric modules refer to a circuit comprising
thermoelectric materials, which directly generate electricity
from heat. A thermoelectric module involves two dissimilar
thermoelectric materials joined at their ends in either the
negatively charged (n-type) form or the positively charged (p-
type) form of semiconductors. [Read Full Article]
Sources: ECN Magazine, Power Magazine, Automation Magazine, Connector & Cable
Assembly Supplier.
Scoping Out the Future of Battery Storage
Battery storage has emerged from the fringes of the power
sector to challenge both industry conventions and traditional
generation. Where it goes from here, however—the future of
battery storage technology—is a matter of some debate.
[Read Full Article]
Page 19
SPRING 2016
INDUSTRIAL TECHNOLOGY TRACKER
Salient
Industry
Topics
Americans Used Less Energy in 2015 According to
AnalysisAmericans used less energy overall in 2015 than the previous
year, according to the most recent energy flow charts released
by Lawrence Livermore National Laboratory. Each year, the
Laboratory releases energy flow charts that illustrate the
nation's consumption and use of energy. [Read Full Article]
Complex Underwater Connectivity Calls for Custom
SolutionsSometimes focusing on hurdle rates, internal rate of return,
and the short-sighted bottom line can lead to disaster. This is
often the case when making “apples-to-oranges” comparisons.
While engineered products can have a marginally higher price
versus off-the-shelf parts and appear more attractive initially, it
is vital to be aware of the longer-term hidden dangers of
decision-making based on price alone. [Read Full Article]
Electrical & Electronics
Industrial Technology Indices
KEP
UninterruptiblePower Supplies
Electronic ControlUnit
BatteryChargers
Industrial ControlTransformers
Fuses
PowerConverters
ElectronicManufacturing
Services
IndustrialConnectors
Data, Audio& Video Cable
DiscreteConnectors
Enterprise Cable& Connectivity
Fiber & CopperComms Cables
ElectricalEnclosures
Capacitors
Batteries Generators:Stationary &
Portable
Inverters
PatchPanels
Solid &Stranded Wires
Joysticks &Switches
Industrial WirelessConnectivity
HazardousDuty Cables
Tubing &HarnessingProducts
CircuitProtection
KEC
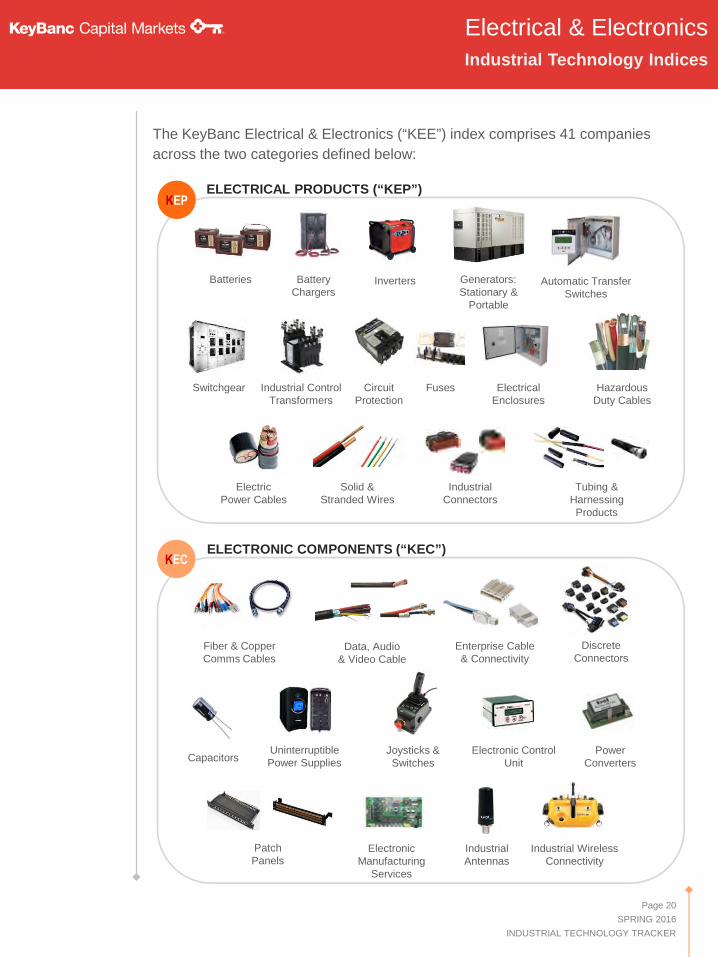
ELECTRICAL PRODUCTS (“KEP”)
ELECTRONIC COMPONENTS (“KEC”)
The KeyBanc Electrical & Electronics (“KEE”) index comprises 41 companies
across the two categories defined below:
IndustrialAntennas
ElectricPower Cables
Automatic TransferSwitches
Switchgear
Page 20
SPRING 2016
INDUSTRIAL TECHNOLOGY TRACKER

6x
8x
10x
12x
May-11 Oct-11 Mar-12 Aug-12 Jan-13 Jun-13 Nov-13 Apr-14 Sep-14 Feb-15 Jul-15 Dec-15 May-16
-20%
0%
20%
40%
60%
-25% -15% -5% 5% 15%
10.1x
8.5x
9.4x
8.3x
4x
6x
8x
10x
12x
Electrical Products Electronic Components
Electrical & Electronics
Public CompsPerformance & Valuation
LTM CY 2016
10.1x EP
8.5x EC
Sources: Capital IQ as of May 2, 2016.
ElectricalProducts
ElectronicComponents
Current 10.1x 8.5x
5-Yr Avg 9.4x 8.7x
% of 5-Yr 107% 98%
Page 21
SPRING 2016
INDUSTRIAL TECHNOLOGY TRACKER
1-yr 3-yr 5-yr
ElectricalProducts
(9%) (6%) (4%)
ElectronicComponents
(7%) 41% 34%
EP
EC
Stock Price
Performance
EBITDA
Multiples
(LTM & Fwd.)
Historical
EV / EBITDA
Multiples
(1-YrReturn)
(3-YrReturn)

5/2/2016 OPERATING METRICS Net Debt / VALUATION
% of 52 52 Wk Mkt Ent LTM LTM EV / EBITDA Fwd PE
Ticker Price Wk High Return Cap EV Sales GM % EBITDA % Margin EBITDA LTM CY 2016 CY 2016
Electrical Products (KEP)ABB Ltd. ABBN $21.25 92% (4%) $45,998 $48,161 $34,829 29% $4,462 13% 0.4x 10.8x 10.3x 18.5x
Schneider Electric SE SU 65.29 79% (13%) 37,920 43,711 28,933 37% 4,139 14% 1.2 10.6 10.0 15.4
Eaton Corporation plc ETN 63.46 86% (10%) 29,065 37,189 20,445 32% 3,443 17% 2.3 10.8 11.2 14.8
Mitsubishi Electric Corporation TSE:6503 11.16 69% (14%) 23,957 23,287 39,110 30% 3,910 10% - 6.0 5.3 NA
Legrand SA ENXTPA:LR 57.51 87% (1%) 15,346 16,281 5,506 52% 1,204 22% 0.7 13.5 13.1 22.4
Hubbell Inc. HUBB 106.14 94% (3%) 5,872 6,538 3,416 33% 625 18% 1.1 10.5 11.3 20.0
Prysmian S.p.A. BIT:PRY 23.58 92% 15% 5,046 6,100 7,995 38% 587 7% 1.4 10.4 7.6 15.0
Generac Holdings Inc. GNRC 37.85 87% (5%) 2,512 3,458 1,292 35% 249 19% 4.1 13.9 11.8 12.4
EnerSys ENS 58.36 80% (14%) 2,535 2,849 2,335 26% 340 15% 0.9 8.4 8.9 13.6
Nexans Société Anonyme ENXTPA:NEX 46.56 95% 19% 1,984 2,278 6,776 13% 310 5% 0.7 7.4 5.5 15.1
General Cable Corporation BGC 15.97 75% (4%) 786 1,880 4,028 - 262 7% 4.0 7.2 8.5 16.4
AZZ incorporated AZZ 56.82 94% 22% 1,473 1,759 903 26% 175 19% 1.6 10.1 9.4 17.3
LEM Holding SA SWX:LEHN 905.67 100% 2% 1,032 1,060 260 46% 66 25% 0.4 16.0 16.9 24.6
Crompton Greaves Limited BSE:500093 0.86 28% (68%) 538 776 1,514 - 149 10% 1.6 5.2 7.2 11.0
Pow ell Industries, Inc. POWL 31.26 79% (6%) 355 299 641 18% 30 5% - 9.9 10.1 34.5
Preformed Line Products PLPC 42.20 92% (1%) 220 222 355 30% 28 8% 0.1 7.9 NA NA
Hammond Pow er Solutions Inc. HPS.A 5.43 90% (3%) 64 76 198 24% 14 7% 0.7 5.5 NA NA
Pioneer Pow er Solutions, Inc. PPSI 5.41 65% (33%) 47 64 107 20% 4 4% 4.6 17.0 7.4 9.3
Volex plc LSE:VLX 0.48 37% (58%) 43 48 392 16% 13 3% 0.4 3.6 2.3 NA
Median 87% (4%) $1,984 $2,278 $2,335 30% $262 10% 1.1x 10.1x 9.4x 15.4x
Electronic Components (KEC)TE Connectivity Ltd. TEL $59.80 84% (12%) $21,385 $24,119 $11,887 33% $2,608 22% 1.0x 9.2x 9.2x 14.4x
CommScope COMM 30.34 89% 3% 5,822 10,377 4,601 38% 1043 23% 4.4 10.0 9.3 12.3
Sensata Technologies ST 37.67 66% (32%) 6,425 9,639 3,021 35% 719 24% 4.5 13.4 12.1 13.1
Belden Inc. BDC 63.95 73% (25%) 2,690 4,227 2,304 41% 401 17% 3.8 10.5 10.0 12.0
Littelfuse Inc. LFUS 117.99 95% 19% 2,638 2,476 877 40% 188 21% - 13.1 10.9 20.9
Ultra Electronics Holdings plc LSE:ULE 25.90 86% (1%) 1,811 2,243 1,071 31% 173 16% 2.5 13.0 10.6 13.9
Laird PLC LSE:LRD 5.11 84% (6%) 1,382 1,687 930 41% 92 10% 3.2 18.3 9.4 14.0
AVX Corp. AVX 13.17 89% (5%) 2,207 1,258 1,196 24% 162 14% - 7.8 6.3 17.6
Advanced Energy Industries, Inc. AEIS 33.30 93% 31% 1,328 1,158 408 52% 105 26% - 11.0 10.0 13.5
Vishay Intertechnology Inc. VSH 12.12 91% (5%) 1,790 1,138 2,278 23% 349 15% - 3.3 3.1 14.2
Rogers Corporation ROG 58.66 79% (21%) 1,056 1,036 637 37% 120 19% - 8.6 8.3 16.6
Methode Electronics, Inc. MEI 30.05 61% (31%) 1,109 962 824 25% 117 14% - 8.2 7.0 13.3
Saft Groupe S.A. ENXTPA:SAFT 30.50 65% (24%) 771 833 825 28% 114 14% 0.5 7.3 6.3 12.4
Stoneridge Inc. SRI 14.26 91% 17% 397 474 645 28% 56 9% 1.3 8.5 6.6 10.9
CTS Corporation CTS 16.22 80% (10%) 531 465 381 34% 65 17% - 7.1 7.4 15.6
KEMET Corp. KEM 2.33 55% (45%) 107 459 735 22% 76 10% 4.3 6.0 4.5 8.6
TT Electronics plc LSE:TTG 2.27 92% 15% 355 440 752 18% 52 7% 1.6 8.5 6.0 15.6
Sparton Corp. SPA 21.03 71% (17%) 206 335 450 20% 41 9% 3.2 8.2 8.8 21.0
Vicor Corp. VICR 9.77 66% (36%) 379 320 202 44% - - - - NA NA
Bel Fuse Inc. BELF.B 16.86 71% (20%) 196 299 546 21% 51 9% 2.0 5.8 NA 11.7
CyberPow er Systems, Inc. TSEC:3617 3.01 74% 45% 243 197 194 44% 22 12% - 8.8 6.7 11.0
SL Industries Inc. SLI 39.97 95% (4%) 159 161 203 34% 22 11% 0.1 7.4 NA NA
Median 82% (8%) $1,083 $999 $788 33% $114 14% 2.5x 8.5x 8.3x 13.7x
Electrical & Electronics
Sources: Capital IQ as of May 2, 2016.
Note: $ in millions
Page 22
SPRING 2016
INDUSTRIAL TECHNOLOGY TRACKER
Indices andCompany Composition
TRANSACTION METRICS
Ent. EV / EV /
DATE TARGET BUYER TARGET DESCRIPTION Value Sales EBITDA
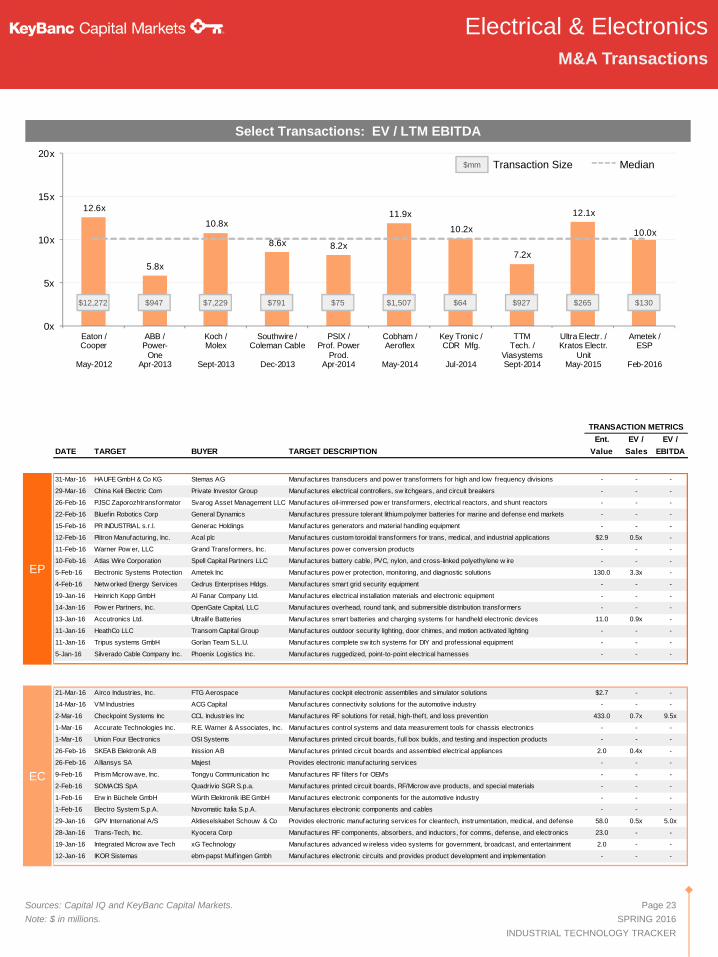
31-Mar-16 HAUFE GmbH & Co KG Stemas AG Manufactures transducers and pow er transformers for high and low frequency divisions - - -
29-Mar-16 China Keli Electric Com Private Investor Group Manufactures electrical controllers, sw itchgears, and circuit breakers - - -
26-Feb-16 PJSC Zaporozhtransformator Svarog Asset Management LLC Manufactures oil-immersed pow er transformers, electrical reactors, and shunt reactors - - -
22-Feb-16 Bluef in Robotics Corp General Dynamics Manufactures pressure tolerant lithium polymer batteries for marine and defense end markets - - -
15-Feb-16 PR INDUSTRIAL s.r.l. Generac Holdings Manufactures generators and material handling equipment - - -
12-Feb-16 Plitron Manufacturing, Inc. Acal plc Manufactures custom toroidal transformers for trans, medical, and industrial applications $2.9 0.5x -
11-Feb-16 Warner Pow er, LLC Grand Transformers, Inc. Manufactures pow er conversion products - - -
10-Feb-16 Atlas Wire Corporation Spell Capital Partners LLC Manufactures battery cable, PVC, nylon, and cross-linked polyethylene w ire - - -
5-Feb-16 Electronic Systems Protection Ametek Inc Manufactures pow er protection, monitoring, and diagnostic solutions 130.0 3.3x -
4-Feb-16 Netw orked Energy Services Cedrus Enterprises Hldgs. Manufactures smart grid security equipment - - -
19-Jan-16 Heinrich Kopp GmbH Al Fanar Company Ltd. Manufactures electrical installation materials and electronic equipment - - -
14-Jan-16 Pow er Partners, Inc. OpenGate Capital, LLC Manufactures overhead, round tank, and submersible distribution transformers - - -
13-Jan-16 Accutronics Ltd. Ultralife Batteries Manufactures smart batteries and charging systems for handheld electronic devices 11.0 0.9x -
11-Jan-16 HeathCo LLC Transom Capital Group Manufactures outdoor security lighting, door chimes, and motion activated lighting - - -
11-Jan-16 Tripus systems GmbH Gorlan Team S.L.U. Manufactures complete sw itch systems for DIY and professional equipment - - -
5-Jan-16 Silverado Cable Company Inc. Phoenix Logistics Inc. Manufactures ruggedized, point-to-point electrical harnesses - - -
21-Mar-16 Airco Industries, Inc. FTG Aerospace Manufactures cockpit electronic assemblies and simulator solutions $2.7 - -
14-Mar-16 VM Industries ACG Capital Manufactures connectivity solutions for the automotive industry - - -
2-Mar-16 Checkpoint Systems Inc CCL Industries Inc Manufactures RF solutions for retail, high-thef t, and loss prevention 433.0 0.7x 9.5x
1-Mar-16 Accurate Technologies Inc. R.E. Warner & Associates, Inc. Manufactures control systems and data measurement tools for chassis electronics - - -
1-Mar-16 Union Four Electronics OSI Systems Manufactures printed circuit boards, full box builds, and testing and inspection products - - -
26-Feb-16 SKEAB Elektronik AB Inission AB Manufactures printed circuit boards and assembled electrical appliances 2.0 0.4x -
26-Feb-16 Alliansys SA Majest Provides electronic manufacturing services - - -
9-Feb-16 Prism Microw ave, Inc. Tongyu Communication Inc Manufactures RF filters for OEM's - - -
2-Feb-16 SOMACIS SpA Quadrivio SGR S.p.a. Manufactures printed circuit boards, RF/Microw ave products, and special materials - - -
1-Feb-16 Erw in Büchele GmbH Würth Elektronik iBEGmbH Manufactures electronic components for the automotive industry - - -
1-Feb-16 Electro System S.p.A. Novomatic Italia S.p.A. Manufactures electronic components and cables - - -
29-Jan-16 GPV International A/S Aktieselskabet Schouw & Co Provides electronic manufacturing services for cleantech, instrumentation, medical, and defense 58.0 0.5x 5.0x
28-Jan-16 Trans-Tech, Inc. Kyocera Corp Manufactures RF components, absorbers, and inductors, for comms, defense, and electronics 23.0 - -
19-Jan-16 Integrated Microw ave Tech xG Technology Manufactures advanced w ireless video systems for government, broadcast, and entertainment 2.0 - -
12-Jan-16 IKOR Sistemas ebm-papst Mulfingen Gmbh Manufactures electronic circuits and provides product development and implementation - - -
12.6x
5.8x
10.8x
8.6x 8.2x
11.9x
10.2x
7.2x
12.1x
10.0x
0x
5x
10x
15x
20x
Eaton /Cooper
May-2012
ABB /Power-
OneApr-2013
Koch /Molex
Sept-2013
Southwire /Coleman Cable
Dec-2013
PSIX /Prof. Power
Prod.Apr-2014
Cobham /Aeroflex
May-2014
Key Tronic /CDR Mfg.
Jul-2014
TTMTech. /
ViasystemsSept-2014
Ultra Electr. /Kratos Electr.
UnitMay-2015
Ametek /ESP
Feb-2016
Electrical & Electronics
M&A Transactions
$130$12,272 $947 $7,229 $791 $75 $1,507 $64 $927
Page 23
SPRING 2016
INDUSTRIAL TECHNOLOGY TRACKER
Select Transactions: EV / LTM EBITDA
$mm
EC
EP
Sources: Capital IQ and KeyBanc Capital Markets.
Note: $ in millions.
MedianTransaction Size
$265

Highly-Engineered Products
Page 24
SPRING 2016
INDUSTRIAL TECHNOLOGY TRACKER
Sources: CMM Magazine, CTE Magazine, Control Engineering Magazine, Business Wire,
The Fabricator
Salient
Industry
Topics
Machining Process Targets Moldmakers and MoreImagine a machining process that removes material five times
faster than milling and 10 times faster than sinker EDMing,
machines Inconel and hardened steel with ease, holds
tolerances to ±0.0006" and utilizes the same tool to process
thousands of parts with virtually no tool wear.
[Read Full Article]
Growing Demand from End-user Industries to Drive
Global Laser Cutting Machine Market Through 2020Technavio analysts forecast the global laser cutting machine
market to grow at a CAGR of close to 9% during the forecast
period, according to their latest report. The research study
covers the present scenario and growth prospects of the global
laser cutting machine market for 2016-2020.
[Read Full Article]
High-End Micro Stamping Provides Smart Sourcing
OptionsOur world is getting smaller as design engineers create
increasingly challenging, more complex parts that require ever-
tighter tolerances. As component complexity increases,
precision micro stamping excels, it shouldn't be a complete
mystery micro stamping offers unique manufacturing benefits
including outstanding repeatability and low cost per piece.
[Read Full Article]
What’s Sizzling in Hot Stamping?
The popularity of high-strength parts continues to drive
increased demand for hot stamping presses, according to Josh
Dixon, director of sales and marketing for Beckwood, Fenton,
Mo. Stamping manufacturers using hot stamping technology to
reduce vehicle weight, fuel consumption, and environmental
impact fall into two categories, said Schuler Group Sales
Manager Hot Forming Jens Aspacher.
[Read Full Article]
Automate Product Support Through the IIoT
The Industrial Internet of Things (IIoT) is taking industrial
industries by storm, impacting everything from how products
are designed to how they're serviced to how organizations
interact with customers.
[Read Full Article]

Highly-Engineered Products
Industrial Technology Indices
PRECISIONMANUFACTURING
KHE
BRANDED INDUSTRIALPRODUCTS & TOOLS
Highly-Engineered Products (“KHE”)
The KeyBanc Highly-Engineered Products (“KEP”) index comprises 41
companies manufacturing products similar to those below. This company
universe is further divided by enterprise value on the following page:
SpecializedTechnical Systems
Application-SpecificTools & Equipment
Page 25
SPRING 2016
INDUSTRIAL TECHNOLOGY TRACKER
Assemblies &Contacts
Moldings &Security Seals
Fasteners
PrecisionStampings
Bearings, Closures& Gaskets
Advanced CompositeEngineered Materials
FabricatedDevices
SpecializedAssemblies
Build-to-Print &Customized Equipment
Mission- CriticalParts

5x
7x
9x
11x
13x
May-11 Nov-11 May-12 Nov-12 May-13 Nov-13 May-14 Nov-14 May-15 Nov-15 May-16
-20%
0%
20%
40%
-20% -10% 0% 10%
11.5x
10.1x
10.8x
9.7x
4x
6x
8x
10x
12x
Highly-Engineered Products >$10bn Highly-Engineered Products <$10bn
Highly-Engineered Products
LTM CY 2016
11.5x HE>10
Sources: Capital IQ as of May 2, 2016.
(1) Represents Enterprise Value
Page 26
SPRING 2016
INDUSTRIAL TECHNOLOGY TRACKER
1-yr 3-yr 5-yr
HighlyEngineered> $10bn
0% 29% 28%
HighlyEngineered< $10bn
(7%) 16% 38%
HE>$10
Stock Price
Performance
EBITDA
Multiples
(LTM & Fwd.)
Historical
EV / EBITDA
Multiples
(1-YrReturn)
(3-YrReturn)
HE<$10
HighlyEngineered
>$10bn
HighEngineered
<$10bn
Current 11.5x 10.1x
5-Yr Avg 10.4x 9.7x
% of 5-Yr 110% 105%
10.1x HE<10
(1)(1)
Public CompsPerformance & Valuation
5/2/2016 OPERATING METRICS Net Debt / VALUATION
% of 52 52 Wk Mkt Ent LTM LTM EV / EBITDA Fwd PE
Ticker Price Wk High Return Cap EV Sales GM % EBITDA % Margin EBITDA LTM CY 2016 CY 2016
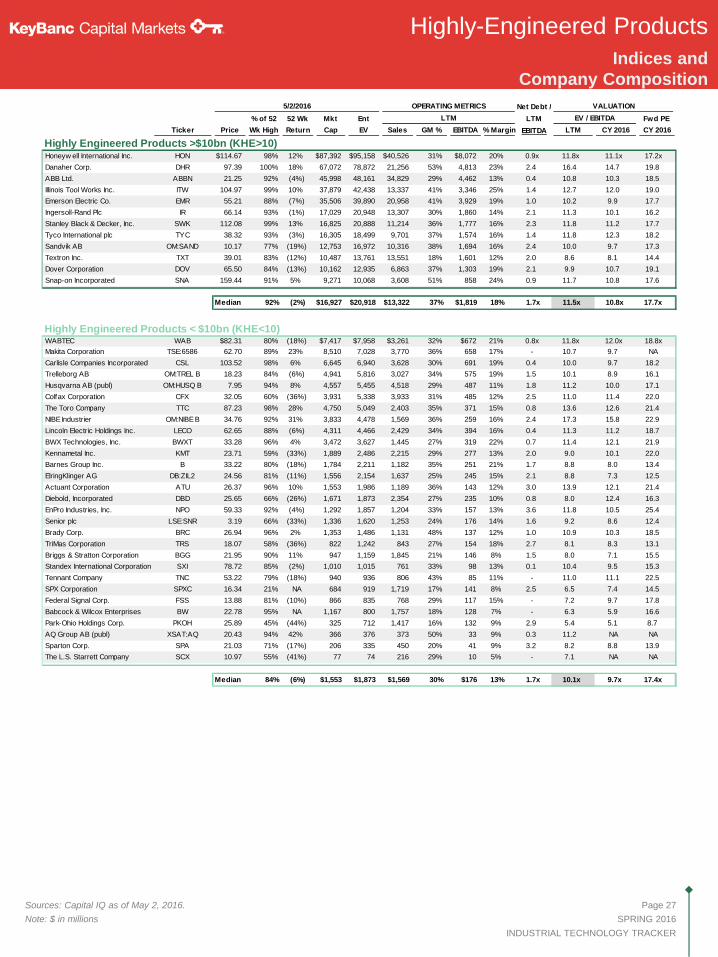
Highly Engineered Products >$10bn (KHE>10)Honeyw ell International Inc. HON $114.67 98% 12% $87,392 $95,158 $40,526 31% $8,072 20% 0.9x 11.8x 11.1x 17.2x
Danaher Corp. DHR 97.39 100% 18% 67,072 78,872 21,256 53% 4,813 23% 2.4 16.4 14.7 19.8
ABB Ltd. ABBN 21.25 92% (4%) 45,998 48,161 34,829 29% 4,462 13% 0.4 10.8 10.3 18.5
Illinois Tool Works Inc. ITW 104.97 99% 10% 37,879 42,438 13,337 41% 3,346 25% 1.4 12.7 12.0 19.0
Emerson Electric Co. EMR 55.21 88% (7%) 35,506 39,890 20,958 41% 3,929 19% 1.0 10.2 9.9 17.7
Ingersoll-Rand Plc IR 66.14 93% (1%) 17,029 20,948 13,307 30% 1,860 14% 2.1 11.3 10.1 16.2
Stanley Black & Decker, Inc. SWK 112.08 99% 13% 16,825 20,888 11,214 36% 1,777 16% 2.3 11.8 11.2 17.7
Tyco International plc TYC 38.32 93% (3%) 16,305 18,499 9,701 37% 1,574 16% 1.4 11.8 12.3 18.2
Sandvik AB OM:SAND 10.17 77% (19%) 12,753 16,972 10,316 38% 1,694 16% 2.4 10.0 9.7 17.3
Textron Inc. TXT 39.01 83% (12%) 10,487 13,761 13,551 18% 1,601 12% 2.0 8.6 8.1 14.4
Dover Corporation DOV 65.50 84% (13%) 10,162 12,935 6,863 37% 1,303 19% 2.1 9.9 10.7 19.1
Snap-on Incorporated SNA 159.44 91% 5% 9,271 10,068 3,608 51% 858 24% 0.9 11.7 10.8 17.6
Median 92% (2%) $16,927 $20,918 $13,322 37% $1,819 18% 1.7x 11.5x 10.8x 17.7x
Highly Engineered Products < $10bn (KHE<10)WABTEC WAB $82.31 80% (18%) $7,417 $7,958 $3,261 32% $672 21% 0.8x 11.8x 12.0x 18.8x
Makita Corporation TSE:6586 62.70 89% 23% 8,510 7,028 3,770 36% 658 17% - 10.7 9.7 NA
Carlisle Companies Incorporated CSL 103.52 98% 6% 6,645 6,940 3,628 30% 691 19% 0.4 10.0 9.7 18.2
Trelleborg AB OM:TREL B 18.23 84% (6%) 4,941 5,816 3,027 34% 575 19% 1.5 10.1 8.9 16.1
Husqvarna AB (publ) OM:HUSQ B 7.95 94% 8% 4,557 5,455 4,518 29% 487 11% 1.8 11.2 10.0 17.1
Colfax Corporation CFX 32.05 60% (36%) 3,931 5,338 3,933 31% 485 12% 2.5 11.0 11.4 22.0
The Toro Company TTC 87.23 98% 28% 4,750 5,049 2,403 35% 371 15% 0.8 13.6 12.6 21.4
NIBE Industrier OM:NIBEB 34.76 92% 31% 3,833 4,478 1,569 36% 259 16% 2.4 17.3 15.8 22.9
Lincoln Electric Holdings Inc. LECO 62.65 88% (6%) 4,311 4,466 2,429 34% 394 16% 0.4 11.3 11.2 18.7
BWX Technologies, Inc. BWXT 33.28 96% 4% 3,472 3,627 1,445 27% 319 22% 0.7 11.4 12.1 21.9
Kennametal Inc. KMT 23.71 59% (33%) 1,889 2,486 2,215 29% 277 13% 2.0 9.0 10.1 22.0
Barnes Group Inc. B 33.22 80% (18%) 1,784 2,211 1,182 35% 251 21% 1.7 8.8 8.0 13.4
ElringKlinger AG DB:ZIL2 24.56 81% (11%) 1,556 2,154 1,637 25% 245 15% 2.1 8.8 7.3 12.5
Actuant Corporation ATU 26.37 96% 10% 1,553 1,986 1,189 36% 143 12% 3.0 13.9 12.1 21.4
Diebold, Incorporated DBD 25.65 66% (26%) 1,671 1,873 2,354 27% 235 10% 0.8 8.0 12.4 16.3
EnPro Industries, Inc. NPO 59.33 92% (4%) 1,292 1,857 1,204 33% 157 13% 3.6 11.8 10.5 25.4
Senior plc LSE:SNR 3.19 66% (33%) 1,336 1,620 1,253 24% 176 14% 1.6 9.2 8.6 12.4
Brady Corp. BRC 26.94 96% 2% 1,353 1,486 1,131 48% 137 12% 1.0 10.9 10.3 18.5
TriMas Corporation TRS 18.07 58% (36%) 822 1,242 843 27% 154 18% 2.7 8.1 8.3 13.1
Briggs & Stratton Corporation BGG 21.95 90% 11% 947 1,159 1,845 21% 146 8% 1.5 8.0 7.1 15.5
Standex International Corporation SXI 78.72 85% (2%) 1,010 1,015 761 33% 98 13% 0.1 10.4 9.5 15.3
Tennant Company TNC 53.22 79% (18%) 940 936 806 43% 85 11% - 11.0 11.1 22.5
SPX Corporation SPXC 16.34 21% NA 684 919 1,719 17% 141 8% 2.5 6.5 7.4 14.5
Federal Signal Corp. FSS 13.88 81% (10%) 866 835 768 29% 117 15% - 7.2 9.7 17.8
Babcock & Wilcox Enterprises BW 22.78 95% NA 1,167 800 1,757 18% 128 7% - 6.3 5.9 16.6
Park-Ohio Holdings Corp. PKOH 25.89 45% (44%) 325 712 1,417 16% 132 9% 2.9 5.4 5.1 8.7
AQ Group AB (publ) XSAT:AQ 20.43 94% 42% 366 376 373 50% 33 9% 0.3 11.2 NA NA
Sparton Corp. SPA 21.03 71% (17%) 206 335 450 20% 41 9% 3.2 8.2 8.8 13.9
The L.S. Starrett Company SCX 10.97 55% (41%) 77 74 216 29% 10 5% - 7.1 NA NA
Median 84% (6%) $1,553 $1,873 $1,569 30% $176 13% 1.7x 10.1x 9.7x 17.4x
Highly-Engineered Products
Sources: Capital IQ as of May 2, 2016.
Note: $ in millions
Page 27
SPRING 2016
INDUSTRIAL TECHNOLOGY TRACKER
Indices andCompany Composition
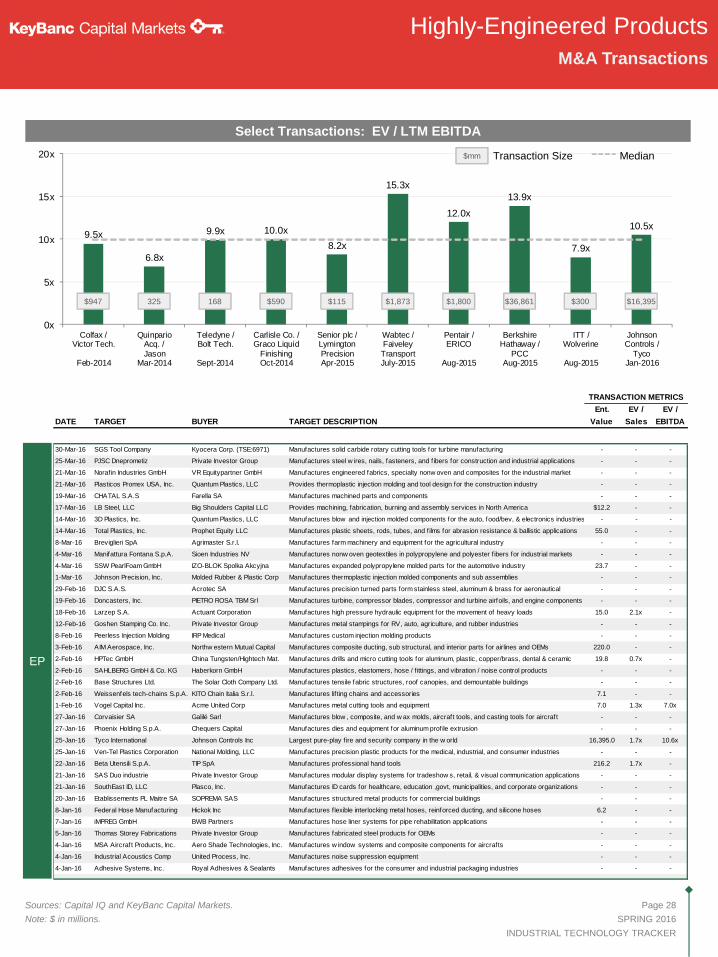
9.5x
6.8x
9.9x 10.0x
8.2x
15.3x
12.0x
13.9x
7.9x
10.5x
0x
5x
10x
15x
20x
Colfax /Victor Tech.
Feb-2014
QuinparioAcq. /Jason
Mar-2014
Teledyne /Bolt Tech.
Sept-2014
Carlisle Co. /Graco Liquid
FinishingOct-2014
Senior plc /LymingtonPrecisionApr-2015
Wabtec /FaiveleyTransportJuly-2015
Pentair /ERICO
Aug-2015
BerkshireHathaway /
PCCAug-2015
ITT /Wolverine
Aug-2015
JohnsonControls /
TycoJan-2016
TRANSACTION METRICS
Ent. EV / EV /
DATE TARGET BUYER TARGET DESCRIPTION Value Sales EBITDA
30-Mar-16 SGS Tool Company Kyocera Corp. (TSE:6971) Manufactures solid carbide rotary cutting tools for turbine manufacturing - - -
25-Mar-16 PJSC Dneprometiz Private Investor Group Manufactures steel w ires, nails, fasteners, and fibers for construction and industrial applications - - -
21-Mar-16 Norafin Industries GmbH VR Equitypartner GmbH Manufactures engineered fabrics, specialty nonw oven and composites for the industrial market - - -
21-Mar-16 Plasticos Promex USA, Inc. Quantum Plastics, LLC Provides thermoplastic injection molding and tool design for the construction industry - - -
19-Mar-16 CHATAL S.A.S Farella SA Manufactures machined parts and components - - -
17-Mar-16 LB Steel, LLC Big Shoulders Capital LLC Provides machining, fabrication, burning and assembly services in North America $12.2 - -
14-Mar-16 3D Plastics, Inc. Quantum Plastics, LLC Manufactures blow and injection molded components for the auto, food/bev, & electronics industries - - -
14-Mar-16 Total Plastics, Inc. Prophet Equity LLC Manufactures plastic sheets, rods, tubes, and films for abrasion resistance & ballistic applications 55.0 - -
8-Mar-16 Breviglieri SpA Agrimaster S.r.l. Manufactures farm machinery and equipment for the agricultural industry - - -
4-Mar-16 Manifattura Fontana S.p.A. Sioen Industries NV Manufactures nonw oven geotextiles in polypropylene and polyester fibers for industrial markets - - -
4-Mar-16 SSW PearlFoam GmbH IZO-BLOK Spolka Akcyjna Manufactures expanded polypropylene molded parts for the automotive industry 23.7 - -
1-Mar-16 Johnson Precision, Inc. Molded Rubber & Plastic Corp Manufactures thermoplastic injection molded components and sub assemblies - - -
29-Feb-16 DJC S.A.S. Acrotec SA Manufactures precision turned parts form stainless steel, aluminum & brass for aeronautical - - -
19-Feb-16 Doncasters, Inc. PIETRO ROSA TBM Srl Manufactures turbine, compressor blades, compressor and turbine airfoils, and engine components - - -
18-Feb-16 Larzep S.A. Actuant Corporation Manufactures high pressure hydraulic equipment for the movement of heavy loads 15.0 2.1x -
12-Feb-16 Goshen Stamping Co. Inc. Private Investor Group Manufactures metal stampings for RV, auto, agriculture, and rubber industries - - -
8-Feb-16 Peerless Injection Molding IRP Medical Manufactures custom injection molding products - - -
3-Feb-16 AIM Aerospace, Inc. Northw estern Mutual Capital Manufactures composite ducting, sub structural, and interior parts for airlines and OEMs 220.0 - -
2-Feb-16 HPTec GmbH China Tungsten/Hightech Mat. Manufactures drills and micro cutting tools for aluminum, plastic, copper/brass, dental & ceramic 19.8 0.7x -
2-Feb-16 SAHLBERG GmbH & Co. KG Haberkorn GmbH Manufactures plastics, elastomers, hose / fittings, and vibration / noise control products - - -
2-Feb-16 Base Structures Ltd. The Solar Cloth Company Ltd. Manufactures tensile fabric structures, roof canopies, and demountable buildings - - -
2-Feb-16 Weissenfels tech-chains S.p.A. KITO Chain Italia S.r.l. Manufactures lifting chains and accessories 7.1 - -
1-Feb-16 Vogel Capital Inc. Acme United Corp Manufactures metal cutting tools and equipment 7.0 1.3x 7.0x
27-Jan-16 Corvaisier SA Galilé Sarl Manufactures blow , composite, and w ax molds, aircraft tools, and casting tools for aircraf t - - -
27-Jan-16 Phoenix Holding S.p.A. Chequers Capital Manufactures dies and equipment for aluminum prof ile extrusion - - -
25-Jan-16 Tyco International Johnson Controls Inc Largest pure-play fire and security company in the w orld 16,395.0 1.7x 10.6x
25-Jan-16 Ven-Tel Plastics Corporation National Molding, LLC Manufactures precision plastic products for the medical, industrial, and consumer industries - - -
22-Jan-16 Beta Utensili S.p.A. TIP SpA Manufactures professional hand tools 216.2 1.7x -
21-Jan-16 SAS Duo industrie Private Investor Group Manufactures modular display systems for tradeshow s, retail, & visual communication applications - - -
21-Jan-16 SouthEast ID, LLC Plasco, Inc. Manufactures ID cards for healthcare, education ,govt, municipalities, and corporate organizations - - -
20-Jan-16 Etablissements PL Maitre SA SOPREMA SAS Manufactures structured metal products for commercial buildings - - -
8-Jan-16 Federal Hose Manufacturing Hickok Inc Manufactures flexible interlocking metal hoses, reinforced ducting, and silicone hoses 6.2 - -
7-Jan-16 iMPREG GmbH BWB Partners Manufactures hose liner systems for pipe rehabilitation applications - - -
5-Jan-16 Thomas Storey Fabrications Private Investor Group Manufactures fabricated steel products for OEMs - - -
4-Jan-16 MSA Aircraf t Products, Inc. Aero Shade Technologies, Inc. Manufactures w indow systems and composite components for aircrafts - - -
4-Jan-16 Industrial Acoustics Comp United Process, Inc. Manufactures noise suppression equipment - - -
4-Jan-16 Adhesive Systems, Inc. Royal Adhesives & Sealants Manufactures adhesives for the consumer and industrial packaging industries - - -
Highly-Engineered Products
M&A Transactions
Page 28
SPRING 2016
INDUSTRIAL TECHNOLOGY TRACKER
$947 325 168 $590 $115 $1,873 $1,800
Select Transactions: EV / LTM EBITDA
$mm
Sources: Capital IQ and KeyBanc Capital Markets.
Note: $ in millions.
MedianTransaction Size
$36,861 $300 $16,395
EP
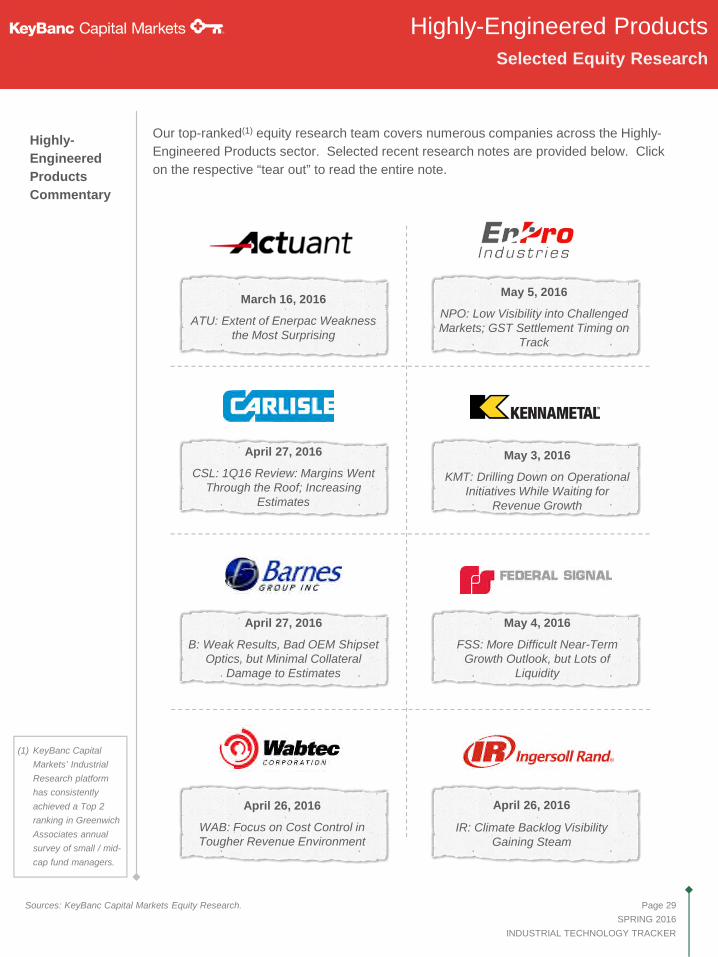
Highly-
Engineered
Products
Commentary
Highly-Engineered Products
Selected Equity Research
Sources: KeyBanc Capital Markets Equity Research. Page 29
SPRING 2016
INDUSTRIAL TECHNOLOGY TRACKER
KeyBanc Capital
Markets’ Industrial
Research platform
has consistently
achieved a Top 2
ranking in Greenwich
Associates annual
survey of small / mid-
cap fund managers.
(1)
March 16, 2016
ATU: Extent of Enerpac Weaknessthe Most Surprising
May 5, 2016
NPO: Low Visibility into ChallengedMarkets; GST Settlement Timing on
Track
April 27, 2016
CSL: 1Q16 Review: Margins WentThrough the Roof; Increasing
Estimates
May 3, 2016
KMT: Drilling Down on OperationalInitiatives While Waiting for
Revenue Growth
April 27, 2016
B: Weak Results, Bad OEM ShipsetOptics, but Minimal Collateral
Damage to Estimates
May 4, 2016
FSS: More Difficult Near-TermGrowth Outlook, but Lots of
Liquidity
April 26, 2016
WAB: Focus on Cost Control inTougher Revenue Environment
April 26, 2016
IR: Climate Backlog VisibilityGaining Steam
Our top-ranked(1) equity research team covers numerous companies across the Highly-
Engineered Products sector. Selected recent research notes are provided below. Click
on the respective “tear out” to read the entire note.

RegionSize
(mm)RCF TL
Tenor
(Mon.)RCF TL Moody's S&P Purpose
Cambridge International Inc NA $92 $13 $79 39 550 bps 550 bps - - Dividend Recapitalization
Coherent Inc NA $850 $100 $750 60 / 84 475 bps 475 bps - - Acquisition
DMG Mori Seiki AG Europe € 500 € 200 € 300 60 - - WR - General Purpose
Erich Netzsch GmbH & Co Europe € 120 € 120 - 60 - - - - General Purpose
KraussMaffei AG Europe € 625 € 125 € 500 60 250 bps 250 bps - - Leveraged Buyout
LAP GmbH Laser Applikationen Europe € 33 € 3€12 /€18
72 / 72 /
84- - - - Leveraged Buyout
Mac Puar Corporacin SL Europe € 49 -€7.5 /€41.5
27 / 57 - - - - Restructuring
Morbark LLC NA $50 $40 $10 60 200 bps 275 bps - - Leveraged Buyout
Pepperl & Fuchs GmbH Europe € 70 - € 70 84 / 120 - - - - General Purpose
Salzgitter Kloeckner-Werke GmbH Europe € 200 -€169.5 /
$35
36 / 60 /
84- - - - General Purpose
Texas Hydraulics Inc NA $38 $14 $24 60 200 bps 650 bps - - Leveraged Buyout
Urschel Laboratories Inc NA $120 $25 $95 48 / 60 200 bps 200 bps - - General Purpose
Watts Water Technologies NA $800 $500 $300 60 125 bps 150 bps - - General Purpose
Amphenol Corp NA $2,000 $2,000 - 60 112.5 bps - Baa1 - General Purpose
FEI Co NA $200 $200 - 60 100 bps - - - General Purpose
Littelfuse Inc NA $700 $575 $125 60 150 bps 150 bps - - Acquisition
Rea Magnetic Wire NA $169 $120 $49 48 / 60 150 bps 175 bps - - General Purpose
Brighton-Best International Inc NA $140 $140 - 66 225 bps - - - General Purpose
Ingersoll-Rand NA $1,000 $1,000 - 60 125 bps - - - General Purpose
Manitowoc Foodservice Inc NA $1,200 $225 $975 60 / 84 275 bps 475 bps - B+ General Purpose
Newell Rubbermaid Co NA $10,500 - $10,500 11 / 38 - 150 bps WR BBB- Acquisition
Tyden Group Holdings Corp NA $103 $45 $58 60 300 bps 300 bps - - General Purpose
FACILITY PRICING RATINGS
Sources: Capital IQ, Bloomberg and LoanConnector.
Notes: (1) Credit backs Coherent’s acquisition of Rofin-Sinar; (2) Credit backs AGIC Capital’s acquisition of KraussMaffei
from Onex; (3) Credit backs capiton AG’s acquisition of LAP GmbH Laser Applikationen; (4) Credit backs Stellex Capital
Management’s acquisition of Morbark; (5) Credit backs Wynnchurch Capital’s acquisition of Texas Hydraulics; (6) Credit
backs Littelfuse’s acquisition of TE Connectivity’s Circuit Protection Business; (7) Credit backs Newell Rubbermaid’s
acquisition of Jarden
Select Credit
Financings
Page 30
SPRING 2016
INDUSTRIAL TECHNOLOGY TRACKER
Process Controls
Electrical & Electronics
Highly-Engineered Products
(1)
(2)
(3)
(4)
(5)
(6)
(7)
Industrial Technology
Capital MarketsIssuance Activity (1Q 2016)
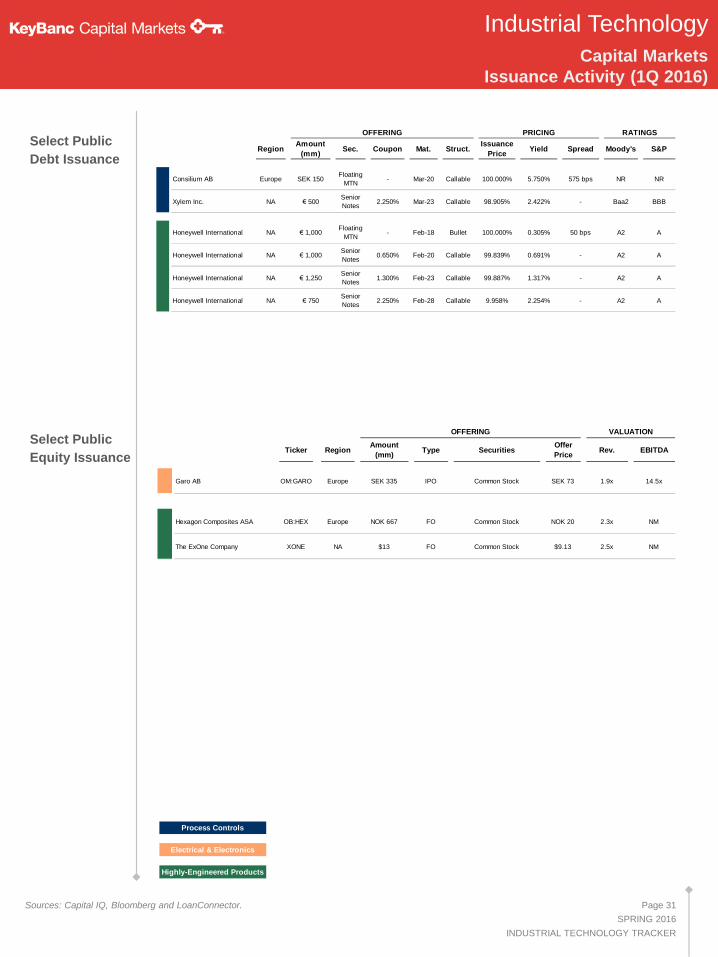
Ticker RegionAmount
(mm)Type Securities
Offer
PriceRev. EBITDA
Garo AB OM:GARO Europe SEK 335 IPO Common Stock SEK 73 1.9x 14.5x
Hexagon Composites ASA OB:HEX Europe NOK 667 FO Common Stock NOK 20 2.3x NM
The ExOne Company XONE NA $13 FO Common Stock $9.13 2.5x NM
OFFERING VALUATION
Industrial Technology
Capital MarketsIssuance Activity (1Q 2016)
Sources: Capital IQ, Bloomberg and LoanConnector.
Select Public
Debt Issuance
Page 31
SPRING 2016
INDUSTRIAL TECHNOLOGY TRACKER
Process Controls
Electrical & Electronics
Highly-Engineered Products
Select Public
Equity Issuance
RegionAmount
(mm)Sec. Coupon Mat. Struct.
Issuance
PriceYield Spread Moody's S&P
Consilium AB Europe SEK 150Floating
MTN- Mar-20 Callable 100.000% 5.750% 575 bps NR NR
Xylem Inc. NA € 500Senior
Notes2.250% Mar-23 Callable 98.905% 2.422% - Baa2 BBB
Honeywell International NA € 1,000Floating
MTN- Feb-18 Bullet 100.000% 0.305% 50 bps A2 A
Honeywell International NA € 1,000Senior
Notes0.650% Feb-20 Callable 99.839% 0.691% - A2 A
Honeywell International NA € 1,250Senior
Notes1.300% Feb-23 Callable 99.887% 1.317% - A2 A
Honeywell International NA € 750Senior
Notes2.250% Feb-28 Callable 9.958% 2.254% - A2 A
RATINGSOFFERING PRICING

KeyBanc Capital Markets
Corporate & Investment Banking
For additional information on KeyBanc Capital Markets’ Industrial Technology Practice, please contact any of the individuals listed below:
- Team Contacts
KeyBanc Capital Markets
Office Locations
Provides full-service investment banking expertise to clients in the Industrial, Energy, Consumer / Retail, Real Estate,
Healthcare and Technology industries
Corporate and Investment Bank focused on the middle market for both corporate and sponsor clients
Full-service Capital Markets capabilities:
- Mergers & Acquisitions
- Equity Capital Markets
- Debt Capital Markets
Banker expertise organized by industry focus with over 640 bankers in 12 offices
Consistently ranked as a top advisor for middle market M&A deals, with over 600 transactions completed since 2000,
of which ~60% have been sell-side assignments and ~50% have been industrial mandates
Nationally recognized institutional equities platform focused on small and mid-cap investors
Over 95 senior and associate equity research analysts covering ~750 companies across six major industry sectors
Top-ranked equity research team covers numerous companies across the Industrial sectors
KeyBanc Capital Markets' Industrial Research platform has consistently achieved a Top 2 ranking in Greenwich
Associates annual survey of small/mid-cap fund managers
Jeffrey JohnstonManaging Director,Mergers &Acquisitions
(216) [email protected]
Michael MusserManaging Director,Head of IndustrialTechnology Practice
(704) [email protected]
Craig BerichAssociate,IndustrialTechnology
(704) [email protected]
Justin McClureAnalyst,IndustrialTechnology
(704) [email protected]
Arindam BasuDirector,Mergers &Acquisitions
(216) [email protected]
Charlotte Chicago Dallas
Cleveland (HQ)
Houston London
Portland San Francisco Seattle
Page 32
SPRING 2016
INDUSTRIAL TECHNOLOGY TRACKER
Atlanta Boston
New York
J.R. DoolosVice President,Mergers &Acquisitions
(216) [email protected]
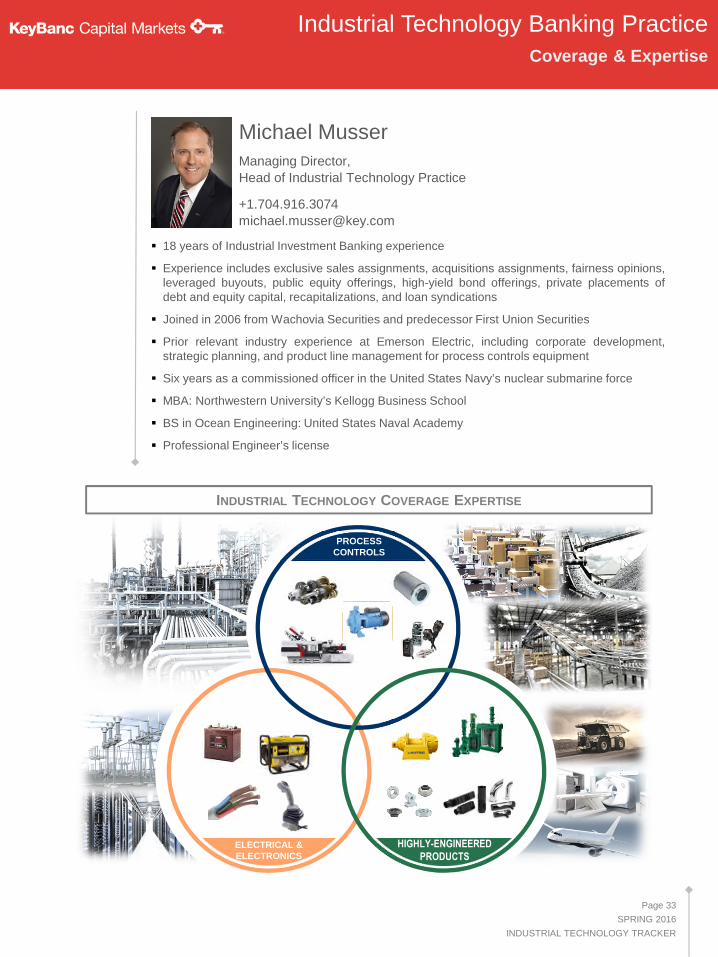
PROCESSCONTROLS
ELECTRICAL &ELECTRONICS
INDUSTRIAL TECHNOLOGY COVERAGE EXPERTISE
Industrial Technology Banking Practice
Coverage & Expertise
Michael MusserManaging Director,
Head of Industrial Technology Practice
+1.704.916.3074
18 years of Industrial Investment Banking experience
Experience includes exclusive sales assignments, acquisitions assignments, fairness opinions,leveraged buyouts, public equity offerings, high-yield bond offerings, private placements ofdebt and equity capital, recapitalizations, and loan syndications
Joined in 2006 from Wachovia Securities and predecessor First Union Securities
Prior relevant industry experience at Emerson Electric, including corporate development,strategic planning, and product line management for process controls equipment
Six years as a commissioned officer in the United States Navy’s nuclear submarine force
MBA: Northwestern University’s Kellogg Business School
BS in Ocean Engineering: United States Naval Academy
Professional Engineer’s license
Page 33
SPRING 2016
INDUSTRIAL TECHNOLOGY TRACKER
HIGHLY-ENGINEEREDPRODUCTS

KeyBanc Capital Markets
Thank you for reviewing our Industrial Technology quarterly newsletter.
Key’s Corporate Subscriptions allow you to choose helpful resources
to stay informed and effectively address business challenges.
If you would like to receive our Industrial Technology newsletter via
email, please visit us at the following website and sign up for a
quarterly subscription:
www.key.com/emailcenter
Disclosure: KeyBanc Capital Markets is a trade name under which corporate and investment banking products and services of KeyCorp and its subsidiaries, KeyBanc Capital MarketsInc., Member NYSE/FINRA/SIPC, and KeyBank National Association (“KeyBank N.A.”), are marketed. Securities products and services are offered by KeyBanc Capital Markets Inc.and its licensed securities representatives, who may also be employees of KeyBank N.A. Banking products and services are offered by KeyBank N.A..
This report was not issued by our research department. The information contained in this report has been obtained from sources deemed to be reliable but is not represented to becomplete, and it should not be relied upon as such. This report does not purport to be a complete analysis of any security, issuer, or industry and is not an offer or a solicitation of anoffer to buy or sell any securities. This report is prepared for general information purposes only and does not consider the specific investment objectives, financial situation andparticular needs of any individual person or entity.


