
1
Electrochemical kinetics and dimensional considerations at the nanoscale
H. Yamada1*, and P.R. Bandaru1, 2*
1 Department of Electrical Engineering,
2 Program in Materials Science, Department of Mechanical Engineering,
University of California, San Diego, La Jolla, CA
Abstract
It is shown that the consideration of the density of states variation in nanoscale
electrochemical systems yields modulations in the rate constant and concomitant electrical
currents. The proposed models extend the utility of Marcus-Hush-Chidsey (MHC) kinetics to a
larger class of materials and could be used as a test of dimensional character. The implications of
the study are of much significance to an understanding and modulation of charge transfer
nanostructured electrodes.
*E-mail: [email protected]

2
A critical understanding of the thermodynamics and kinetics inherent to electrochemical
reactions is necessary for scientific insights into charge transfer [1] as well as in applications
ranging from biochemical reactions [2] to charge storage in capacitors and batteries [3]. While
the foundational attributes have almost always been reckoned in terms of one-electron based
charge transfer [4,5], much of the theoretical and experimental analysis has only obliquely
referred to the considerations of dimensionality. Consequently, three-dimensional electrode
characteristics and classical thermodynamics have been implicitly assumed in heterogeneous
electron transfer kinetics, encompassing the widely used Butler-Volmer (BV) formulations and
the subsequent Marcus [6,7] – Hush [8] interpretations. In this regard, Arrhenius based
activation theory, leading to the BV approaches, has been used for over a century, and
extensively documented in standard electrochemistry textbooks [4,9]. In the BV case, the rate
constant (KBV), considering that for the forward reaction rate (KF) and for the backward reaction
(KB), is:
K BV= KF +KB = K o exp
αeηkBT
⎡
⎣⎢
⎤
⎦⎥ + K o exp
(1−α )eηkBT
⎡
⎣⎢
⎤
⎦⎥ (1)
In Eqn. (1), the α is the electron transfer coefficient and η refers to the overpotential (= V - Vo),
with V as the applied voltage and Vo as the standard redox potential. The e is the elementary unit
of electronic charge, kB is the Boltzmann constant, and T is the temperature. While simple to use,
in principle, such an approach does not yield substantial insight into the type and involvement of
the specific constituents (redox species as well as the electrode) and the α is phenomenologically
determined. The Marcus-Hush (MH) theory then seeks to better understand the rationale for the
Ko and α through a more detailed consideration [10] of the reorganization dynamics of the

3
solvent and the redox species vis-à-vis the electrochemical reactions and the electrolyte (through
the macroscopic dielectric constant).
Fig. 1(a) Gibbs free energy (G) - reaction coordinate (q) curves for the oxidized (O) and reduced
(R) species in an electrochemical redox reaction, of the type: O + e- R. The free energy of
reaction (ΔGo), and the free energy of activation (ΔGa) are indicated, for several applied voltages
(η) and resulting R species configurations. (b) For low-dimensional structures, variation in the
density of states (DOS) accessible for electron transfer, as in the lowering of the DOS for a one-
dimensional systems, would yield equivalent behavior, (c) The operating points corresponding to
the various R curves in (i) and (ii) represented in the normalized rate constant (K/Kη=0)-η plot.
We first briefly review the salient features of the MH kinetics approach and its extension
by Chidsey [11]. Consequently, we consider typical [6,7] free energy (G) – reaction coordinate
(q) curves: Fig. 1. Typically, the reaction coordinate has been broadly interpreted [12], and may
refer to the distance [13], in a multi-dimensional extensive variable sense (e.g., the change of
bond length, electrical charge, etc.), between the oxidized (O) and reduced (R) species in an
electrochemical redox reaction, of the type: O + e- !R. While the progressive lowering of the
minimum energy of the R parabola (e.g., through increasing the η) always decreases the free
!
(a)
(b) (c)

4
energy of reaction ΔGo, the free energy of activation ΔGa initially decreases, reaching zero when
the R parabola passes through the minimum of the O parabola, and subsequently increases, due
to a shift of the R free energy curves to the left hand side of the O parabola: Fig. 1(a). The
concomitant increase and decrease of the electrochemical reaction rate constant KMH, i.e., as
represented in Eqn. (2), with v as the attempt frequency, reaches a maximum when ΔGa = 0.
(2)
Such a non-intuitive increase and subsequent decrease of the reaction rate with increasing
driving force (i.e., η) constitutes the essence of the inverted region, particular to the Marcus-
Hush theory. Such a notion on the maximum of a rate constant has been experimentally
confirmed [14], e.g., in intramolecular reactions, concerning molecules with bridged donor –
acceptor units [15]. It may also be derived that [14], ΔGa = λ
41+ ΔGo
λ⎛⎝⎜
⎞⎠⎟
2
, with λ as the
reorganization energy - which is related to the energy required for both the internal (e.g., due to
the bond configuration changes) and the external (e.g., in the rearrangement of the solvation
shell, surrounding electrolyte, etc.) configurational changes. Subsequently, it is evident that a
zero ΔGa would imply that the peak of the KMH is at a value of λ ∼ - ΔGo.
However, such a theory seemed to be incompatible with the notion of long distance
interfacial electron transfer where the rate constant decreases exponentially with increased
donor-acceptor separation distances [16] as considered through the seminal work of
Chidsey [11]. Additionally, the experimental observation, in certain metal electrode based
electrochemical ensembles, of the saturation of the electrochemical current with increasing η,
prompted the consideration of a continuum of energy level states. The consequently derived rate
K MH= ν exp − ΔG
kBT⎡
⎣⎢
⎤
⎦⎥ = vexp − (λ ∓ eη)2
4λkBT⎡
⎣⎢
⎤
⎦⎥

5
constant KMHC, considering energy level occupancy through the Fermi-Dirac distribution fFD, and
the explicit introduction of a constant metallic electronic density of states (DOS) (= ρ), was of
the form [11]:
K MHC= νρkBT 11+ exp(x)−∞
∞
∫ exp −kBT4λ
x − λ ∓ eηkBT
⎡
⎣⎢
⎤
⎦⎥
2⎛
⎝⎜⎜
⎞
⎠⎟⎟
dx (3)
The variable x =
E − EF
kBT, refers to the normalized energy of a relevant participating level (E),
e.g., in the electrode, relative to the Fermi energy (EF) and the negative sign is used for η> 0.
The integration limits may be narrowed down to either the negative interval (-∞, 0] or the
positive interval: [0, ∞), if fFD (E) can be approximated by a step function, which would be
applicable when the η exceeds 26 mV (=kBT/e).
Fig. 2 The Chidsey formulation for the rate constant in Eqn. (3) can be interpreted as indicating
the relative overlap between the Fermi-Dirac distribution function fFD (E) – on the left, and the
Gaussian curve – on the right, corresponding to the MH models.
The MHC relation, indicated in Eqn. (3), may also be interpreted as related to the area of
overlap between the fFD and an Arrhenius based rate law: Fig. 2. This figure indicates that at low

6
η, BV theory may be adequate to model the electrochemical kinetics while increasing η, leads to
overlap and the Chidsey extension. However, at |η| = λ/e. and beyond, the electrical current starts
to decrease and saturation may be expected when |η| is significantly larger compared to the λ/e.
The constant height of the step function results from an assumption of a constant DOS.
The MHC relation seems to yield excellent agreement with the experimental observation
of the plateauing of the rate constant as a function of the electrode overpotential. It is to be noted
that the rate constants, e.g., the KMHC are typically obtained through chronoamperometry (CA)
experiments, through the electrical current I decay with time t (in response to a step-voltage
change) of the form: I=Io exp (-KMHCt). However, even in such molecular systems, the Chidsey
modification to the Marcus-Hush theory adopts an intrinsically continuum point of view, through
assuming a constant ρ.
In this paper, we broadly aim to extend the utility of the Marcus-Hush-Chidsey (MHC)
kinetics to a larger class of materials and situations. For instance, we observe in zero-
dimensional (0-D) or one-dimensional (1-D) nanostructures, electrical current oscillations as a
function of the η, corresponding to the gradual population (and de-population) of each
successive sub-band. We posit that the consideration of a variable/non-constant DOS leads to a
deeper appreciation of the MHC formulations and may yield tests of dimensional character and
concomitant contribution to electrochemical systems.
First, we reinterpret the classical free energy – reaction coordinate curves depicted in Fig.
1(a), in the context of lower dimensional structures. The initial decrease in ΔGa followed by a
subsequent increase, can be related by analogy to the availability and subsequent lack in the
number of energy levels (related to the DOS) accessible for electron transfer. Such a modulation
is apparent in the DOS of one-dimensional nanostructures [17], with increasing carrier

7
concentration and change of the EF, and may be induced through appropriate η. We have then
observed that such non-constant DOS yields novel electrical current – voltage response in related
electrochemical systems. Fig. 1(b) indicates the correspondence for lower dimensional systems
where the decreasing DOS at higher energy may be taken analogous to the increasing λ. Indeed,
saturation of the electrical current/rate constant curves may be indicative of the limit of a finite
DOS.
Fig. 3 The variation of the normalized reaction rate constants, K, as a function of electrochemical
kinetics, i.e., corresponding to Butler – Volmer: BV, Marcus-Hush: MH, Poisson-Marcus: PM,
or Marcus-Hush-Chidsey: MHC, models - with the overpotential η. The K values have been
normalized to their minimum values in each case. The experimental values were adapted from
Miller, et al. [15], Chidsey [11], and Bai, et al, [19].
The consequent plots of the respective normalized K value variation, through Eqns. (1),
(2), and (3), with the η (corresponding to BV, MH, or MHC kinetics) are indicated in Fig. 3.
From CA related experiments and I=Io exp (-KMHCt), such characteristics may be considered

8
equivalent to electrical current I-η plots. The figure also indicates a re-plotting of experimental
data previously obtained [15]. It is to be noted that while the BV kinetics indicates a linear
variation with η, the MH model exhibits a peak as a function of the η. It is also relevant to note
that the experimental curves were also fit through employing Poisson statistics [18] assuming
homogeneous charge transfer, with a net λ (=1.2 eV) constituted from (i) an external solvation
energy λs = 0.75 eV, and (ii) an internal vibrational energy component λv = 0.45 eV. The
incorporation of Poisson (cf., Gaussian distribution) statistics also yields an inversion of the K,
while avoiding the steeper drop-off of the MH curve, and was considered [15] the best fit to
certain chronoamperometric data.
We now consider the influence of a variable DOS, on the K variation with η. The number
of electrons available for the redox reaction from the electrode: n, would be:
n= fFD (E − EF )DOS(E − Ec )dE
EC
∞
∫ , where Ec is the energy at the bottom of the conduction band.
We concomitantly introduce a new DOS based reaction rate constant: KMHC-DOS, considering the
influence of the energy levels, through:
K MHC−DOS= νkBTDOS x +
EF − Ec
kBT⎛
⎝⎜⎞
⎠⎟
1+ exp(x)−∞
∞
∫ exp −kBT4λ
x − λ ∓ eηkBT
⎡
⎣⎢
⎤
⎦⎥
2⎛
⎝⎜⎜
⎞
⎠⎟⎟
dx (4)
The integration may again be either over the negative interval (- ∞, 0] or the positive interval: [0,
∞), as previously discussed. In a limiting case corresponding to Eqn. (3), the DOS would be a
constant (e.g., ρ), reverting to the original Chidsey formulation [11]. In the subsequent treatment,
the Ec was taken as reference energy and set to zero. Such a formulation involving the energy
variation of the DOS [17] as a function of the dimensionality, D (e.g., DOS3D ~ constant or ~

9
E1/2 – for a semiconductor, DOS2D ~ E0, DOS1D ~ E-1/2, DOS0D ~ Dirac delta function like) also
allows for a variable height of the step function, depicted on the left hand side of Fig. 2. The
resulting KMHC-DOS-η curves, as a function of the dimensionality dependent DOS are indicated in
Fig. 4. In addition to the parabolic Energy-k vector dispersion, we have also incorporated a linear
E-k dispersion as seems to be necessary to describe the characteristics of graphene and related
2D materials [20,21].
Fig. 4 The variation of the normalized KMHC-DOS based reaction rate constants with η - obtained
from Eqn. (4), for electrodes with DOS ~ Ea. The exponent a, indicated in the figure, is a
function of the electrode dimensionality (i.e., a = ½ for a three-dimensional semiconductor; a =
0 or 1, for a two-dimensional system, a = - ½ for a one-dimensional system) and is Delta-
function like for zero-dimensional systems, such as quantum dots. The case of a = ½ involves a
bandgap, which causes the Kη=0 to be smaller than that for the other cases. Generally, a reduction
of the K corresponds to a decreasing DOS with energy.
The respective influences of the dimensionality and the dispersion are clearly evident.
While the traditional MHC based formulations assumed a constant DOS, particular to bulk-

10
like/three-dimensional (3D) metallic electrodes, the energy variation of the DOS in lower
dimensional systems yields rich and involved behavior. For instance, the behavior of a two-
dimensional (2D) material with parabolic energy dispersion, e.g., involving a quantum well, is
seen to differ compared to one with linear energy dispersion, e.g., graphene. In the latter case, an
increasing DOS with electron kinetic energy is responsible for the observed variation. The
situation for a one-dimensional (1D) material, e.g., a carbon nanotube (CNT), constituted
electrode - with parabolic energy dispersion along the long-axis and quantization along the two
perpendicular directions, with a decreasing DOS vis-à-vis energy, corresponds to inversion in the
K-η curves at a sufficiently large η, as posited in the original MH formulations. In one-
dimensional systems, the initial increase of the DOS upon the EF reaching the band edge and the
subsequent E-1/2 induced decrease yields a corresponding modulation of the K and the electrical
currents.
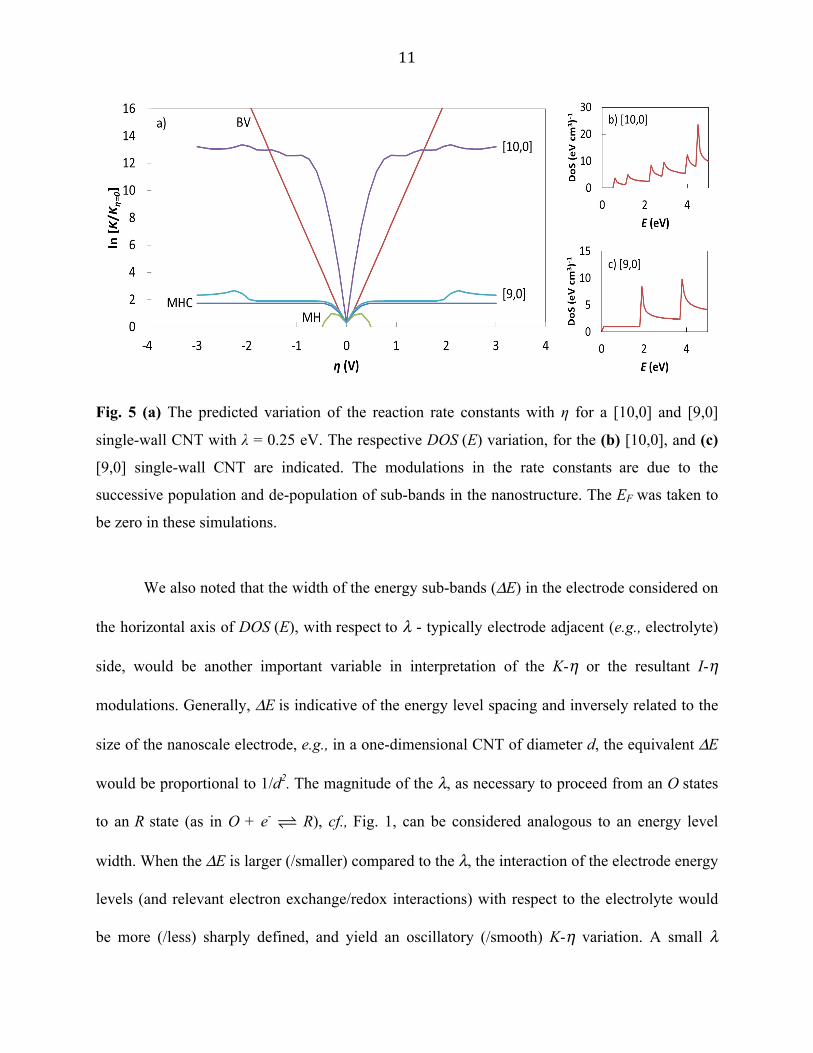
We then predict the occurrence of oscillations in the K/Kη=0 - η curves in one-dimensional
nanostructures as a function of chirality in Fig. 5. As is well known [22], the specific nature of
wrapping of a constituent graphene sheet, through the chirality index [m, n], dictates whether the
resulting CNT is metallic/semiconducting. We depict the corresponding DOS for a (i)
semiconducting [10,0] nanotube, and a (ii) metallic [9,0] nanotube: Figures 5(b) and (c),
respectively. While the rate constant oscillations are particularly pronounced in the former, they
are less so in the latter case. The underlying reason may be related to the smaller (/larger)
separation of the energy sub-bands, respectively. Moreover, the oscillations in the
semiconducting and the metallic cases occur at different voltages, corresponding to the DOS
variation.
11
Fig. 5 (a) The predicted variation of the reaction rate constants with η for a [10,0] and [9,0]
single-wall CNT with λ = 0.25 eV. The respective DOS (E) variation, for the (b) [10,0], and (c)
[9,0] single-wall CNT are indicated. The modulations in the rate constants are due to the
successive population and de-population of sub-bands in the nanostructure. The EF was taken to
be zero in these simulations.
We also noted that the width of the energy sub-bands (ΔE) in the electrode considered on
the horizontal axis of DOS (E), with respect to λ - typically electrode adjacent (e.g., electrolyte)
side, would be another important variable in interpretation of the K-η or the resultant I-η
modulations. Generally, ΔE is indicative of the energy level spacing and inversely related to the
size of the nanoscale electrode, e.g., in a one-dimensional CNT of diameter d, the equivalent ΔE
would be proportional to 1/d2. The magnitude of the λ, as necessary to proceed from an O states
to an R state (as in O + e- ! R), cf., Fig. 1, can be considered analogous to an energy level
width. When the ΔE is larger (/smaller) compared to the λ, the interaction of the electrode energy
levels (and relevant electron exchange/redox interactions) with respect to the electrolyte would
be more (/less) sharply defined, and yield an oscillatory (/smooth) K-η variation. A small λ

12
implies that the nuclear reconfiguration and the coordinating solvent interactions [23]
accompanying the redox reaction is negligible. At a large enough λ/ΔE, a continuous electronic
distribution/DOS may be assumed, yielding smooth MHC kinetics, with an increase of the K up
to η ~ λ/e, and subsequent plateauing of the K-η curves. The discussed K-η variation as related
to the λ/ΔΕ ratio is indicated in Fig. 6.
Fig. 6 The K/Kη=0 variations for a (a) [9,0] CNT, and (b) [10,0] CNT, as a function of the λ,
indicates the competing effects of the classical reorganization energy (λ) and the sub-band
energy separation (ΔΕ ), with respect to the influence of the DOS. The bandgap for the [10,0]
CNT actually causes K/Kη=0 to decrease with increasing λ, in contrast to the [9,0] CNT.
As it was recently indicated that a λ of ~ 0.2 eV seemed to be effective for modeling
MHC based charge transfer kinetics at LiFePO4 battery electrode interfaces [19], such
modulations could be experimentally probed. Additionally, the K/Kη=0 increases with λ for a
[9,0] CNT, as was previously indicated [10], but shows the opposite variation in a [10,0] CNT.
The bandgap in the semiconducting [10,0] CNT causes the Kη=0 value to be smaller than that for
the metallic [9,0] CNT; such an effects is stronger for smaller λ, cf. Fig. 2.

13
In summary, we have shown that considering the specific nature of the DOS, as would be
necessary in nanostructured materials, leads to a modification of the expected MHC electro-
kinetics. We have predicted, most notably, the occurrence of oscillations of the rate constant and
the concomitant electrical current in semiconducting nanotubes, the experimental verification of
which would be a significant test of the nature of electrical conductivity as well as
dimensionality. The implications of our study would be relevant to the use of nanostructured
electrodes in electrochemical storage systems where such electrical current modulations would
impact energy and power delivery.
The authors are grateful for support from the Defense Advanced Research Projects Agency
(DARPA: W911NF-15-2-0122), National Science Foundation (NSF: CMMI 1246800), and
acknowledge detailed discussions and interactions with R. Narayanan and Prof. P. Asbeck.

14
References
[1] Kuznetsov, Charge Transfer in Physics, Chemistry and Biology: Physical Mechanisms of
Elementary Processes and an Introduction to the Theory (CRC Press, 1995).
[2] J.-M. Savéant, Elements of Molecular and Biomolecular Electrochemistry: An
Electrochemical Approach to Electron Transfer Chemistry (John Wiley & Sons, Inc., New
York, NY, 2006).
[3] D. Linden and T. B. Reddy, Linden’s Handbook of Batteries (McGraw Hill, New York,
NY, 2010).
[4] A. J. Bard and L. R. Faulkner, Electrochemical Methods: Fundamentals and Applications,
2nd ed. (John Wiley, New York, 2001).
[5] R. G. Compton and C. E. Banks, Understanding Voltammetry (Imperial College Press,
London, UK, 2011).
[6] R. A. Marcus, J. Chem. Phys. 24, 966 (1956).
[7] N. Sutin, J. Phys. Chem. 90, 3465 (1986).
[8] N. S. Hush, J. Electroanal. Chem. 470, 170 (1999).
[9] P. H. Rieger, Electrochemistry, 2nd ed. (Chapman and Hall, New York, 1994).
[10] M. C. Henstridge, E. Laborda, N. V. Rees, and R. G. Compton, Electrochim. Acta 84, 12
(2012).
[11] C. E. Chidsey, Science 251, 919 (1991).
[12] R. A. Marcus, J. Electroanal. Chem. (2000).
[13] T. M. Cover and J. A. Thomas, Elements of Information Theory (Wiley-Interscience,
Hoboken, NJ, 2006).
[14] G. Grampp, Angew. Chemie Intl. Edn. 32, 691 (1993).

15
[15] J. R. Miller, L. T. Calcaterra, and G. L. Closs, J. Am. Chem. Soc. 106, 3047 (1984).
[16] T. T. T. Li and M. J. Weaver, J. Am. Chem. Soc. 106, 6107 (1984).
[17] S. Datta, Quantum Transport: Atom to Transistor (Cambridge University Press, New
York, 2005).
[18] J. R. Miller, J. V. Beitz, and R. K. Huddleston, J. Am. Chem. Soc. 106, 5057 (1984).
[19] P. Bai and M. Z. Bazant, Nat. Commun. 5, 3585 (2014).
[20] M. I. Kastnelson, Graphene: Carbon in Two Dimensions (Cambridge University press,
Cambridge, UK, 2012).
[21] S. Das Sharma, S. Adam, E. H. Hwang, and E. Rossi, Rev. Mod. Phys. 83, 407 (2011).
[22] P. R. Bandaru, J. Nanosci. Nanotechnol. 7, 1239 (2007).
[23] S. Fletcher, J. Solid State Electrochem. 14, 705 (2010).


![Stochastic Electrochemical Kinetics · PDF filearXiv:1608.07507v2 [ ] 18 Sep 2016 Stochastic Electrochemical Kinetics Ot´avio Beruski Instituto de Qu´ımica de](https://static.documents.pub/doc/80x56/5abbc4fa7f8b9a76038d1bff/stochastic-electrochemical-kinetics-160807507v2-18-sep-2016-stochastic-electrochemical.jpg)


