

Electrocomponents plc
ANNOUNCEMENT OF PRELIMINARY RESULTS
YEAR ENDED 31 MARCH 2013 23 May 2013

2 2
Agenda
Overview and current trading Ian Mason
Financial performance Simon Boddie
Business performance Simon Boddie
Strategy update Ian Mason
Q&A All

3 3
Key themes
Challenging market conditions during FY13
Significant improvement in gross margin and cost performance in H2
Global operating model implemented to enable global strategy delivery
Evolved to common global strategy comprising seven strategic priorities
New performance framework, targeting improved medium-term financial performance
Common global strategy to drive improved performance
4 4
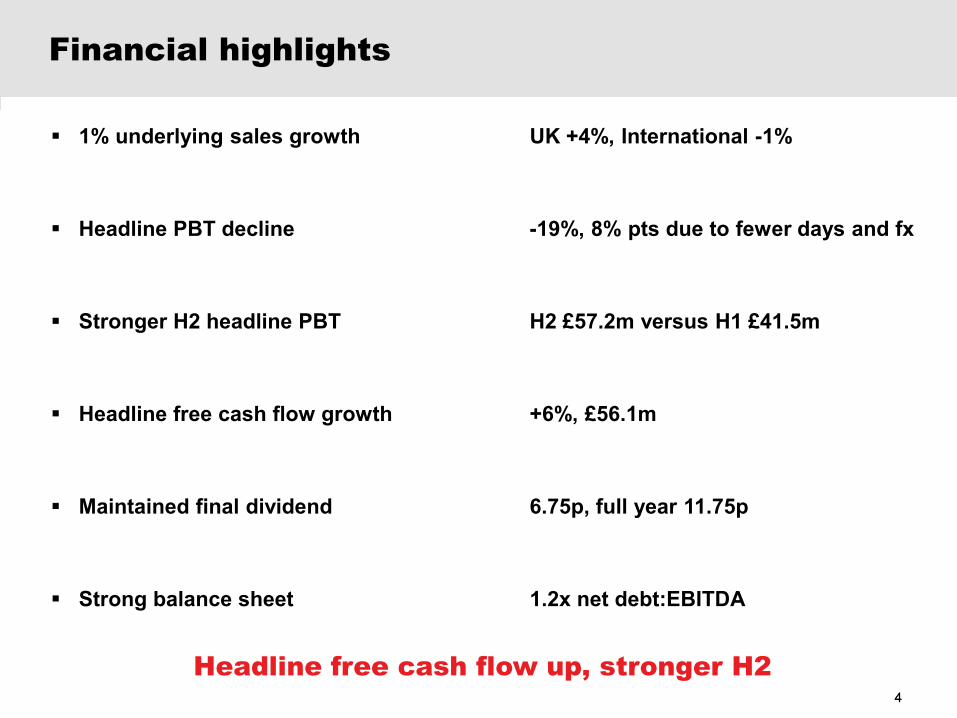
Financial highlights
1% underlying sales growth UK +4%, International -1%
Headline PBT decline -19%, 8% pts due to fewer days and fx
Stronger H2 headline PBT H2 £57.2m versus H1 £41.5m
Headline free cash flow growth +6%, £56.1m
Maintained final dividend 6.75p, full year 11.75p
Strong balance sheet 1.2x net debt:EBITDA
Headline free cash flow up, stronger H2

5 5
Current trading
(1) underlying sales growth adjusted for currency and trading days
(2) seven weeks to 17 May 2013
Group sales growth maintained at H2 level
Sales Growth (1)
Region H1
FY13 H2
FY13 Apr & May (2)
FY14 Continental Europe 0% 1% 2%
North America (5)% (1)% 1%
Asia Pacific 0% 0% (1)%
International (2)% 0% 1%
UK 5% 2% 0%
Group 0% 1% 1%

6 6
Agenda
Overview and current trading Ian Mason
Financial performance Simon Boddie
Business performance Simon Boddie
Strategy update Ian Mason
Q&A All

7 7
Basis of preparation
Unless otherwise stated: Figures have been prepared using International Financial Reporting Standards
(IFRS)
Changes in sales are adjusted for currency movements and for the number of trading days (‘underlying sales growth/decline’)
Changes in profit, cash flow, debt and share related measures, such as earnings per share, are at reported exchange rates
Sign conventions: % changes in sales and costs are disclosed as positive if improving profit and negative if reducing profit
In FY13 net expenses of £7.4m were reported for items excluded from headline profit before tax
Key performance measures such as return on sales and EBITDA use headline profit figures

8 8
Profit and loss account
(1) Adjusted for currency; sales also adjusted for trading days (2) Headline operating profit expressed as a percentage of sales
Headline return on sales of 8.4% (2)
£m 2013 2012 Change
Sales 1,235.6 1,267.4 0.5% (1)
Gross margin 46.0% 46.8% (0.8)% pointsHeadline operating costs (464.1) (464.6) (1.7)% (1)
Headline operating profit 104.3 128.1 (18.6)%Interest (5.6) (5.8) 3.4%Headline profit before tax 98.7 122.3 (19.3)%
Headline return on sales (2) 8.4% 10.1% (1.7)% points
Group sales growth by technology:
• Maintenance sales growth of 3% (1)
• Electronics sales decline of 2% (1)
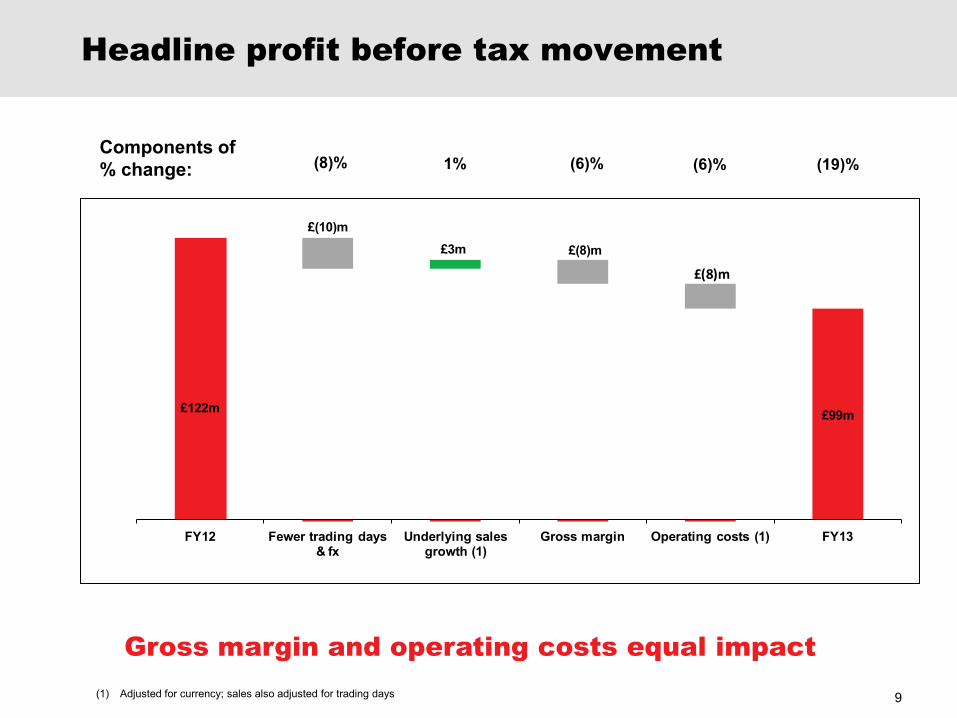
Headline profit before tax movement
Components of % change:
(1) Adjusted for currency; sales also adjusted for trading days
(8)% 1% (6)%
9
(6)% (19)%
Gross margin and operating costs equal impact
£122m £99m
£3m £(8)m
£(10)m
FY12 Fewer trading days & fx
Underlying sales growth (1)
Gross margin Operating costs (1) FY13
£(8)m

10 10
Significant H2 improvement
(1) Adjusted for currency; sales also adjusted for trading days (2) Headline operating profit expressed as a percentage of sales
H2 benefitting from management actions
H1 H2 FY
Underlying sales growth (1) 0% 1% 1%
Gross margin change (points) (1.2)% (0.3)% (0.8)%
Headline operating costs growth (1) (3.1)% (0.3)% (1.7)%
Headline PBT 41.5 57.2 98.7
Headline return on sales (points) (2) 7.3% 9.5% 8.4%
11 11
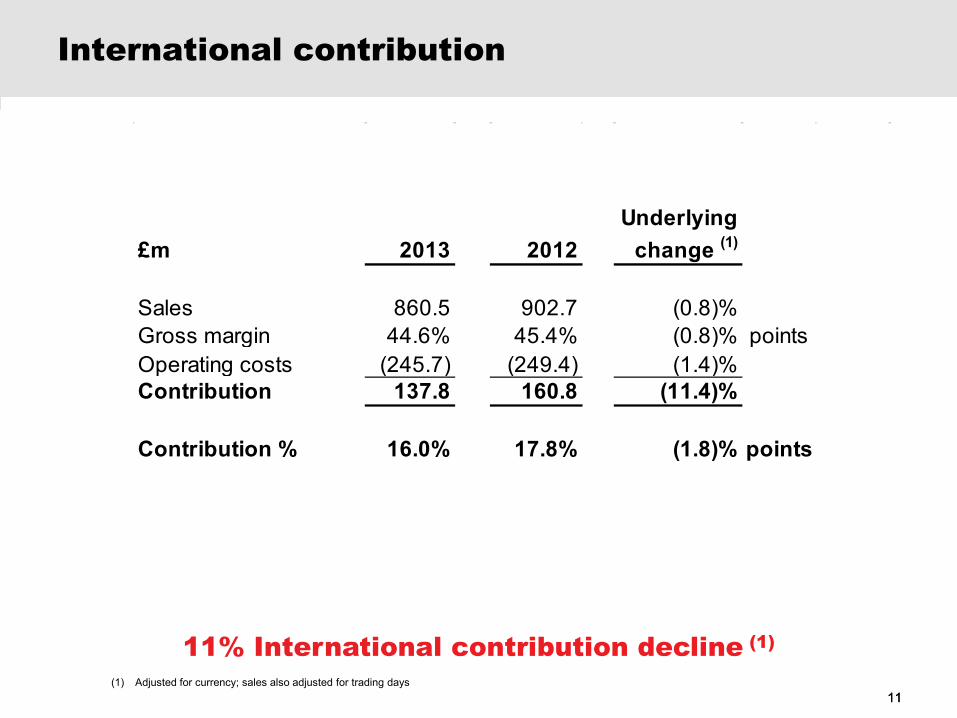
International contribution
£m 2013 2012Underlying
change (1)
Sales 860.5 902.7 (0.8)%Gross margin 44.6% 45.4% (0.8)% pointsOperating costs (245.7) (249.4) (1.4)%Contribution 137.8 160.8 (11.4)%
Contribution % 16.0% 17.8% (1.8)% points
(1) Adjusted for currency; sales also adjusted for trading days
11% International contribution decline (1)
12 12
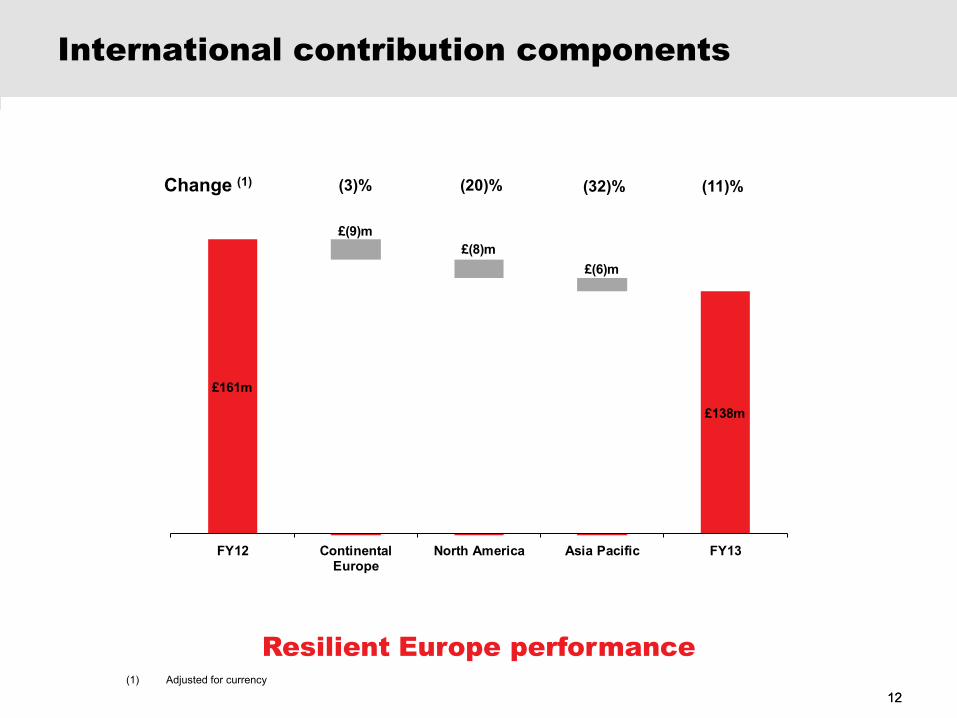
International contribution components
Change (1)
(1) Adjusted for currency
Resilient Europe performance
(3)% (20)% (32)% (11)%
£161m
£138m
£(9)m£(8)m
£(6)m
FY12 Continental Europe
North America Asia Pacific FY13

13 13
UK contribution
£m 2013 2012Underlying
change (1)
Sales 375.1 364.7 3.7%Gross margin 49.3% 50.0% (0.7)% pointsOperating costs (79.0) (76.5) (3.2)%Contribution 105.9 106.0 (0.1)%
Contribution % 28.2% 29.1% (0.9)% points
(1) Sales adjusted for trading days
Strong UK contribution margin above 28%

14 14
Headline earnings per share
£m 2013 2012 Change
Headline profit before tax 98.7 122.3 (19)%Headline effective tax rate 30% 31% 1% points
Per share amounts:Headline earnings 15.7p 19.5p (19)%
Full year dividend (1) 11.75p 11.75p -
(1) 2013: comprises 5p interim dividend, 6.75p proposed final dividend
Full year dividend maintained

Reorganisation: impact on profit
15
Annualised cost savings of £7m achieved
Reconciliation from headline to reported profit before tax:
Recurring cost savings: FY13 savings c.£4m, annualised c. £7m
Net reduction of 140 roles
£m 2013 2012 Change
Headline profit before tax 98.7 122.3 (19)%Reorganisation costs (7.4) - -Reported profit before tax 91.3 122.3 (25)%
16 16
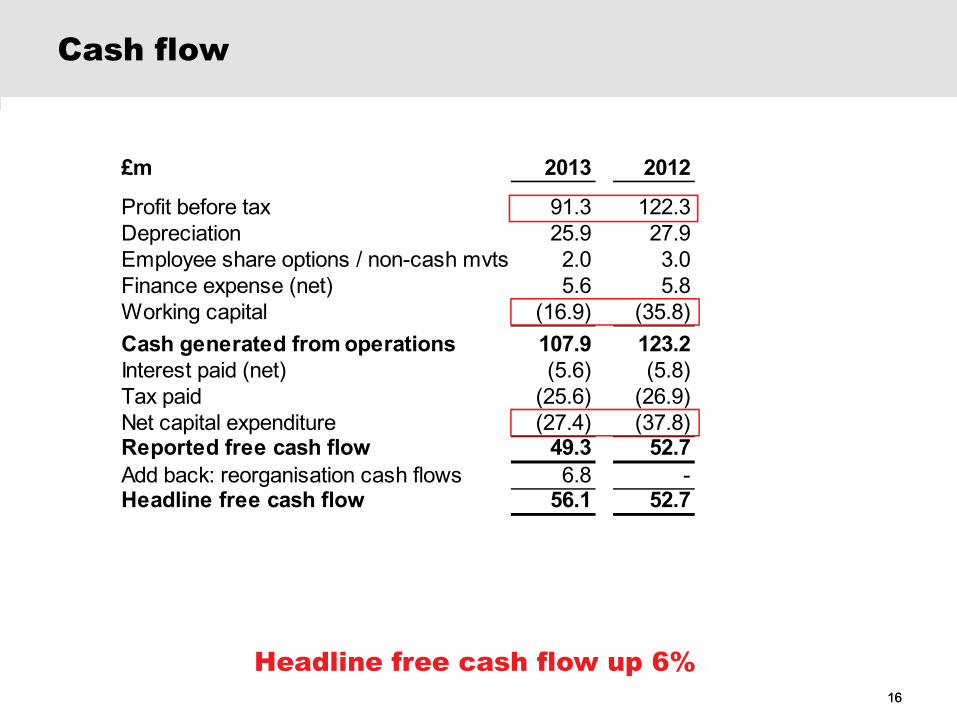
Cash flow
Headline free cash flow up 6%
£m 2013 2012
Profit before tax 91.3 122.3Depreciation 25.9 27.9Employee share options / non-cash mvts 2.0 3.0Finance expense (net) 5.6 5.8Working capital (16.9) (35.8)Cash generated from operations 107.9 123.2Interest paid (net) (5.6) (5.8)Tax paid (25.6) (26.9)Net capital expenditure (27.4) (37.8)Reported free cash flow 49.3 52.7Add back: reorganisation cash flows 6.8 -Headline free cash flow 56.1 52.7
17 17
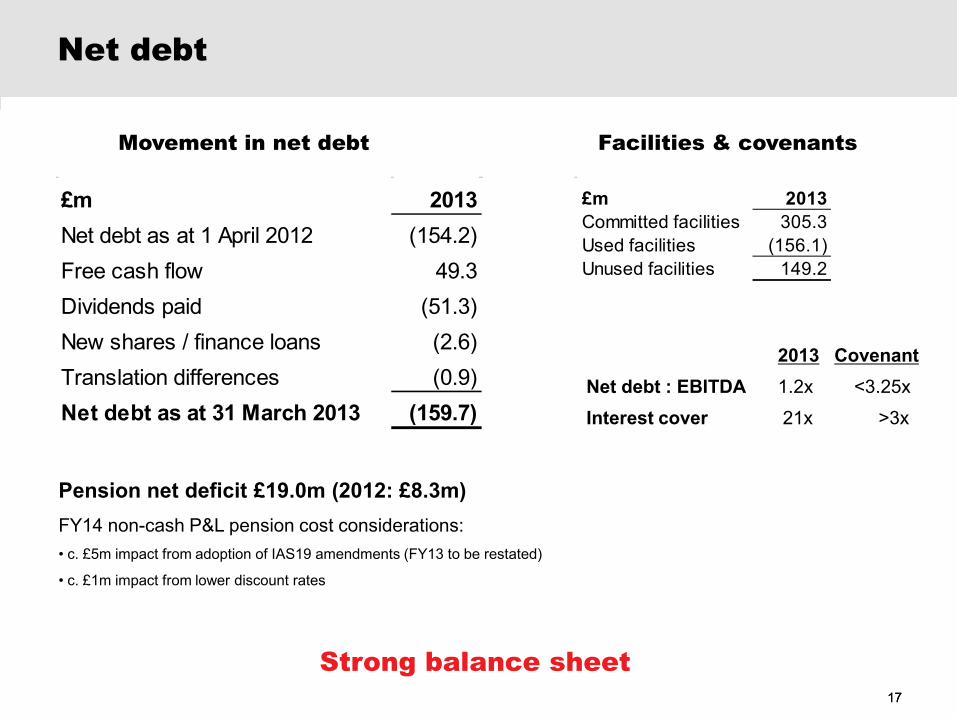
Net debt
£m 2013Net debt as at 1 April 2012 (154.2)Free cash flow 49.3Dividends paid (51.3)New shares / finance loans (2.6)Translation differences (0.9)Net debt as at 31 March 2013 (159.7)
Strong balance sheet
Pension net deficit £19.0m (2012: £8.3m) FY14 non-cash P&L pension cost considerations: • c. £5m impact from adoption of IAS19 amendments (FY13 to be restated)
• c. £1m impact from lower discount rates
2013 Covenant Net debt : EBITDA 1.2x <3.25x
Interest cover 21x >3x
£m 2013Committed facilities 305.3Used facilities (156.1)Unused facilities 149.2
Movement in net debt Facilities & covenants
18 18
Agenda
Overview and current trading Ian Mason
Financial performance Simon Boddie
Business performance Simon Boddie
Strategy update Ian Mason
Q&A All

19 19
Business portfolio
Significant opportunity to improve International margin
FY13 £m
Underlying sales
growth% of Group
revenueContribution % of revenue
Market position
Continental Europe 1% 35% 21% No. 1
North America (3)% 22% 13% No. 3
Asia Pacific 0% 13% 7% No. 1
International -1% 70% 16% No. 1
UK 4% 30% 28% No. 1
Group 1% 100% 20% No.1

20 20
Continental Europe
1% sales growth (1)
France flat, smaller markets performing well
10% eCommerce growth, 66% share
Strengthened automation and control offer
10% sales CAGR (1) since regionalisation
Good performance in challenging markets (1) Adjusted for trading days and currency
Continental Europe eCommerce share
0%
10%
20%
30%
40%
50%
60%
70%
FY06 FY07 FY08 FY09 FY10 FY11 FY12 FY13
21 21
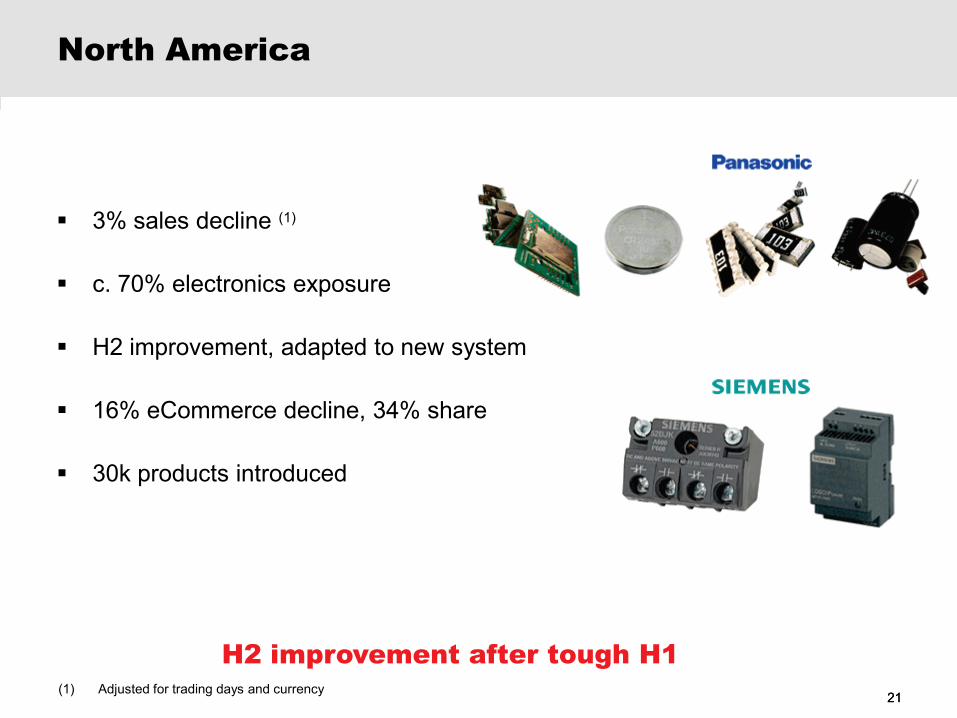
North America
3% sales decline (1)
c. 70% electronics exposure
H2 improvement, adapted to new system
16% eCommerce decline, 34% share
30k products introduced
H2 improvement after tough H1 (1) Adjusted for trading days and currency

22 22
Asia Pacific
Flat sales growth (1)
Greater China and South East Asia in growth
Japan improving after tough H1, Australia slowing
3% eCommerce decline, 50% share
Over 30 large customer account wins
Successful SAP system go-live in Australia
Mixed regional picture, system upgrade on track (1) Adjusted for trading days and currency
Corporate account wins in FY13

To help protect your privacy, PowerPoint prevented this external picture from being automatically downloaded. To download and display this picture, click Options in the Message Bar, and then click Enable external content.
23 23
UK
4% sales growth (1), 1% ex-Raspberry Pi
c. 75% maintenance exposure
Strong sales of Raspberry Pi
10% eCommerce growth, 62% share
Corporate accounts performing well
Benefitting from maintenance and Raspberry Pi (1) Adjusted for trading days
Raspberry Pi Model B

24 24
Agenda
Overview and current trading Ian Mason
Financial performance Simon Boddie
Business performance Simon Boddie
Strategy update Ian Mason
Q&A All

• International growth• Electronics and Maintenance• eCommerce• Operating leverage• UK profitability
“The world’s distributor of choice”Vision
Strategy
Priorities
25 25
Successful delivery of strategy set in 2006
New opportunities identified
26 26
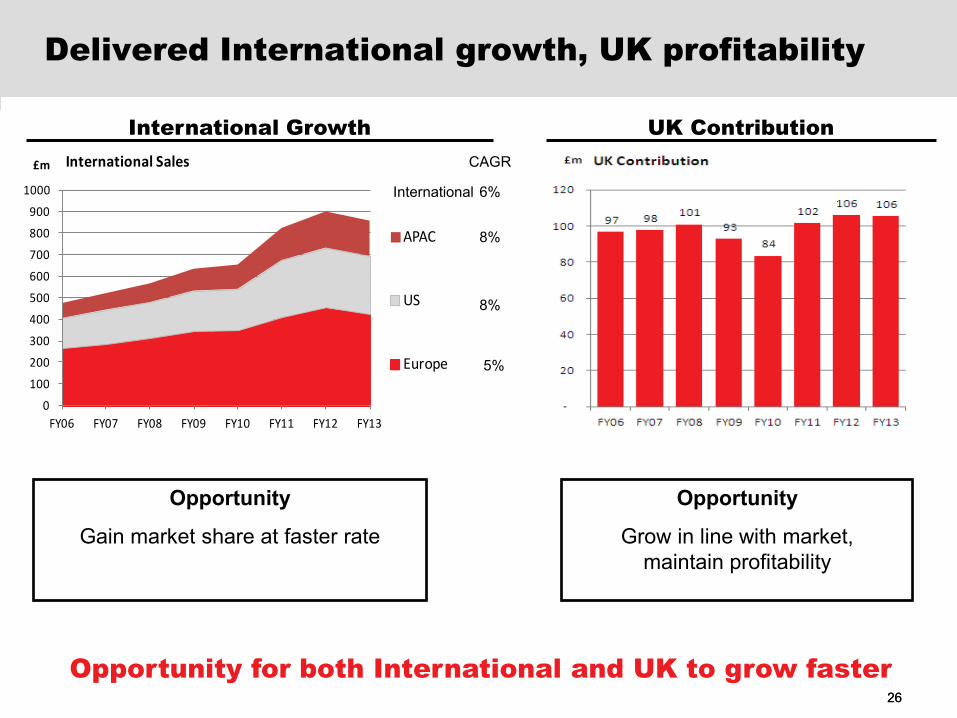
Delivered International growth, UK profitability
Opportunity for both International and UK to grow faster
0
100
200
300
400
500
600
700
800
900
1000
FY06 FY07 FY08 FY09 FY10 FY11 FY12 FY13
£m International Sales
APAC
US
Europe
CAGR
8%
8%
5%
International Growth UK Contribution
International 6%
Opportunity
Gain market share at faster rate
Opportunity
Grow in line with market, maintain profitability

27 27
Delivered two strong offers
Single global offer driving growth
Higher Electronics Growth balanced by Higher Maintenance Returns
Opportunities:
Grow faster and more efficiently with single global offer
Global pricing strategy to improve value for money perception, partially mitigate gross margin pressure
Customers Suppliers Cross-sell
Electronics Maintenance >100k new products
& technical marketing Automation & Control emerged
as leading technology

28 28
Exploited eCommerce and delivered cost leverage
eCommerce is the engine of growth
eCommerce % share of Group sales Costs as % of sales
0%
10%
20%
30%
40%
50%
60%
70%
FY06 FY07 FY08 FY09 FY10 FY11 FY12 FY13
Europe
UK
Group
APAC
US
0%
10%
20%
30%
40%
50%
60%
FY06 FY08 FY10 FY12
APAC
Europe
Group
UK
US
Process
Change 06-13
-6% pt
-5% pt
-5% pt
-5% pt
-2% pt
-2% pt
%, Reported
Opportunity
Grow faster using eCommerce at heart of multi-channel approach
Opportunity
Continued cost leverage
29 29
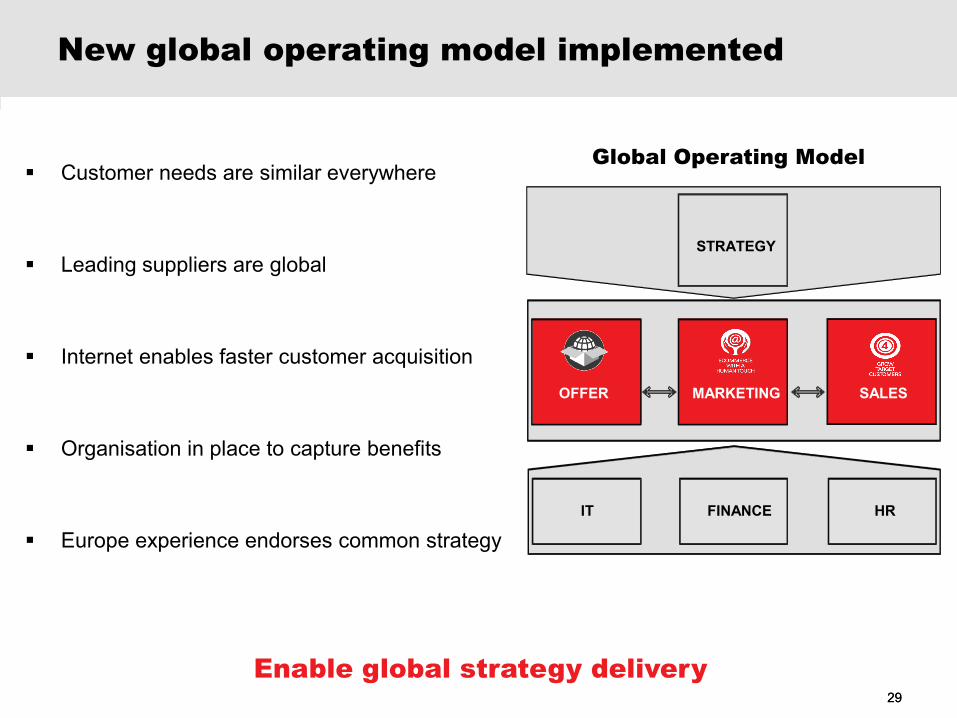
New global operating model implemented
Customer needs are similar everywhere
Leading suppliers are global
Internet enables faster customer acquisition
Organisation in place to capture benefits
Europe experience endorses common strategy
Enable global strategy delivery
IT FINANCE HR
SALES OFFER MARKETING
STRATEGY
Global Operating Model

30 30
Evolved to common global strategy
7 strategic priorities, integrated business plan

31 31
Grow target customers
Integrated strategy to service and grow each customer group
Focus on our four key contact types and their needs

One global offer
32
Key initiatives
More products, more efficiently
Global range
Global inventory management
Reliable 1,2,3 day service
Clear, distinct category strategies
Semiconductors
Automation & Control
Support
Electrical, Test & Measurement
SemiconductorsSemiconductors
Interconnect, Passives & Electromechanical
Automation & Control
Electrical, Test & Measurement
Support
,
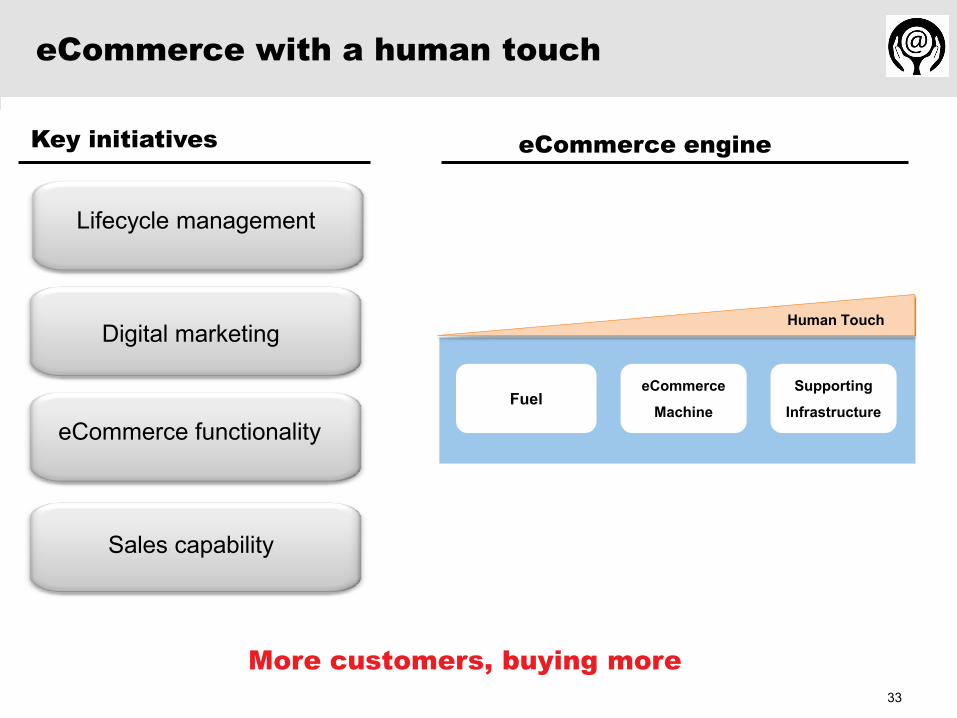
eCommerce with a human touch
More customers, buying more 33
Key initiatives
Lifecycle management
Digital marketing
eCommerce functionality
Sales capability
eCommerce engine
Fuel eCommerce
Machine
Supporting
Infrastructure
Human Touch
34 34
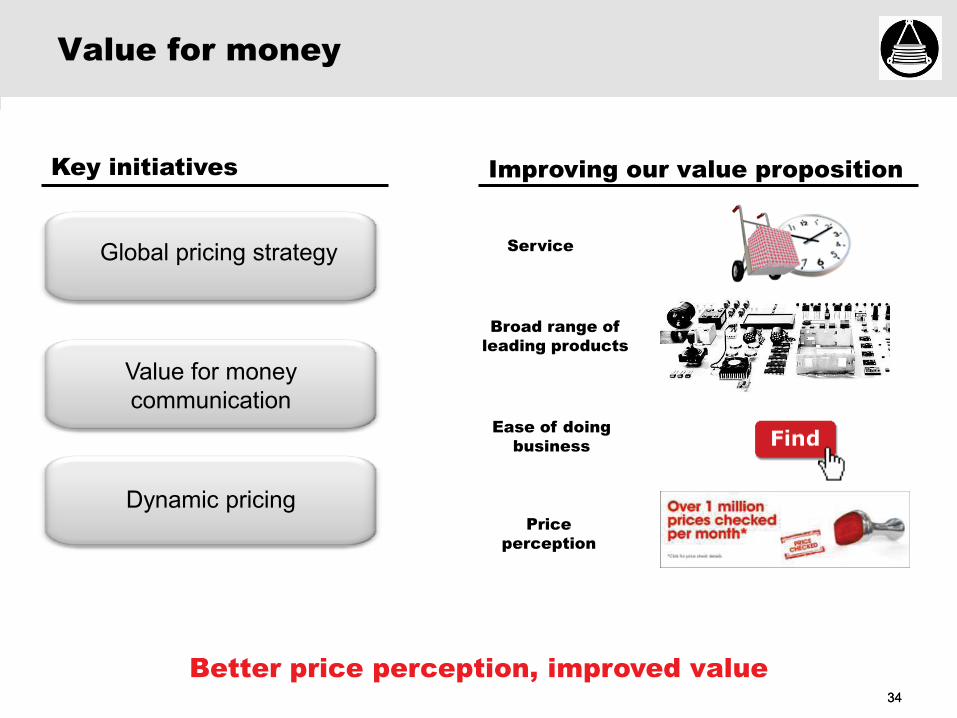
Value for money
Key initiatives
Better price perception, improved value
Global pricing strategy
Value for money communication
Dynamic pricing
Improving our value proposition
Service
Price perception
Ease of doing business
Broad range of leading products

35 35
Strategic enablers
Strong platform for growth
• High-performing team
• Business insight
• World-class systems and supply chain
Global network of hubs

36 36
Increasing investment in strategic initiatives
Funded from existing cash flows
Capital expenditure investment Key strategic initiatives • Global inventory planning tools
• Systems enabling global range
• Develop APAC network
• Website functionality
• Search engine marketing, optimisation
• Global automated nursery programme
• SAP across APAC
• Enterprise architecture
• Global pricing tools
0
5
10
15
20
25
30
35
40
FY06 FY07 FY08 FY09 FY10 FY11 FY12 FY13
£m• Target average run-rate £40m pa
• Historic average run-rate £25m pa

0%
2%
4%
6%
8%
10%
12%
FY06 FY07 FY08 FY09 FY10 FY11 FY12 FY13
Return on sales adjusted to reflect 75:25 International:UK sales mix
37 37
Performance metrics
Focused on growth, profitability and cash flow (1) Underlying sales growth, adjusting for trading days and currency movements. Target range includes estimated market growth of 3.5%, historic includes market growth of 2.5%
-10%
-5%
0%
5%
10%
15%
20%
25%
FY06 FY07 FY08 FY09 FY10 FY11 FY12 FY13
Group sales growth (1)
• Target 5% - 8% pa
• Historic 4% pa
Group return on sales
0%
1%
2%
3%
4%
5%
6%
7%
8%
9%
10%
FY06 FY07 FY08 FY09 FY10 FY11 FY12 FY13
Free cash flow as a % of sales
• Target 4% - 6%
• Historic 3% - 8%
0%
5%
10%
15%
20%
25%
FY06 FY07 FY08 FY09 FY10 FY11 FY12 FY13
Return on capital employed
• Target 20% - 30%
• Historic 15% - 25%
• Target 9% - 11%
• Historic 7% - 10%
38 38
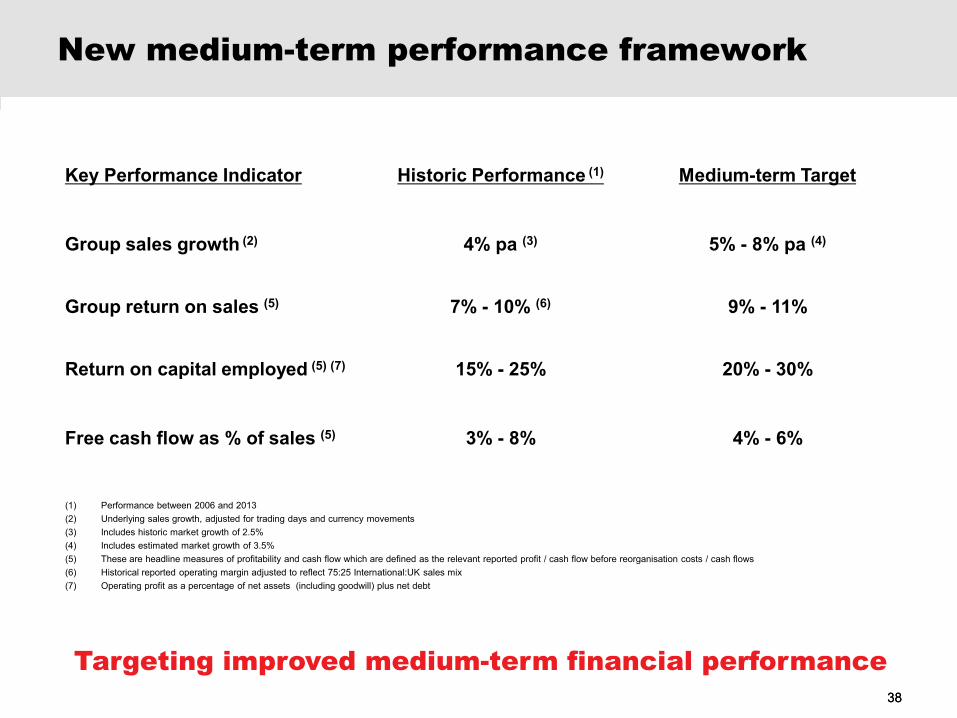
New medium-term performance framework
Targeting improved medium-term financial performance
(1) Performance between 2006 and 2013 (2) Underlying sales growth, adjusted for trading days and currency movements (3) Includes historic market growth of 2.5% (4) Includes estimated market growth of 3.5% (5) These are headline measures of profitability and cash flow which are defined as the relevant reported profit / cash flow before reorganisation costs / cash flows (6) Historical reported operating margin adjusted to reflect 75:25 International:UK sales mix (7) Operating profit as a percentage of net assets (including goodwill) plus net debt
Key Performance Indicator Historic Performance (1) Medium-term Target
Group sales growth (2) 4% pa (3) 5% - 8% pa (4)
Group return on sales (5) 7% - 10% (6) 9% - 11%
Return on capital employed (5) (7) 15% - 25% 20% - 30%
Free cash flow as % of sales (5) 3% - 8% 4% - 6%
39 39
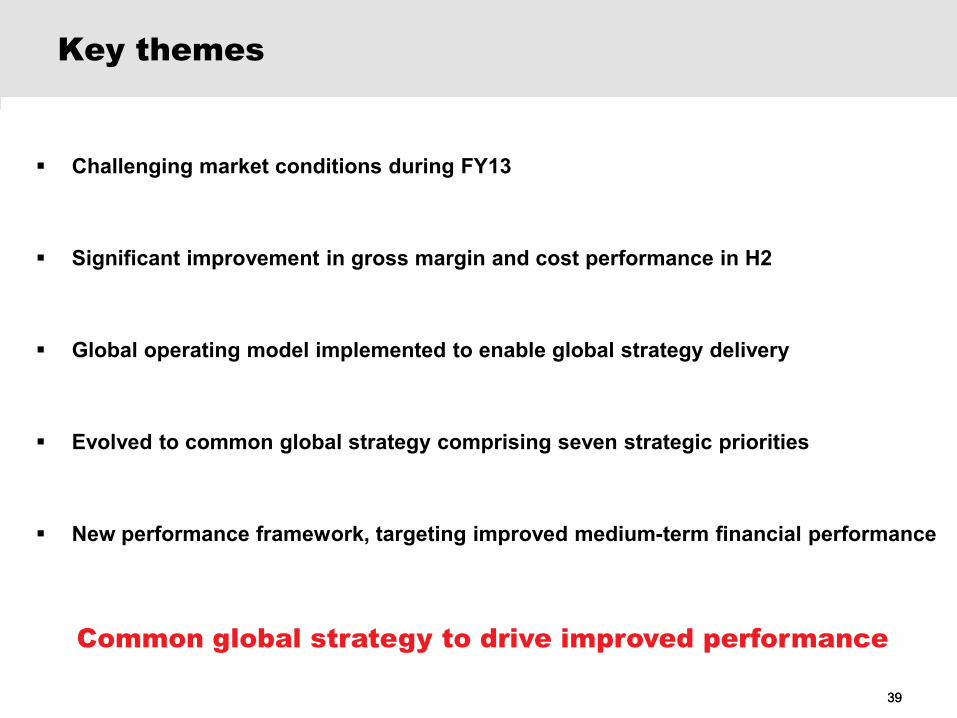
Key themes
Challenging market conditions during FY13
Significant improvement in gross margin and cost performance in H2
Global operating model implemented to enable global strategy delivery
Evolved to common global strategy comprising seven strategic priorities
New performance framework, targeting improved medium-term financial performance
Common global strategy to drive improved performance
40 40
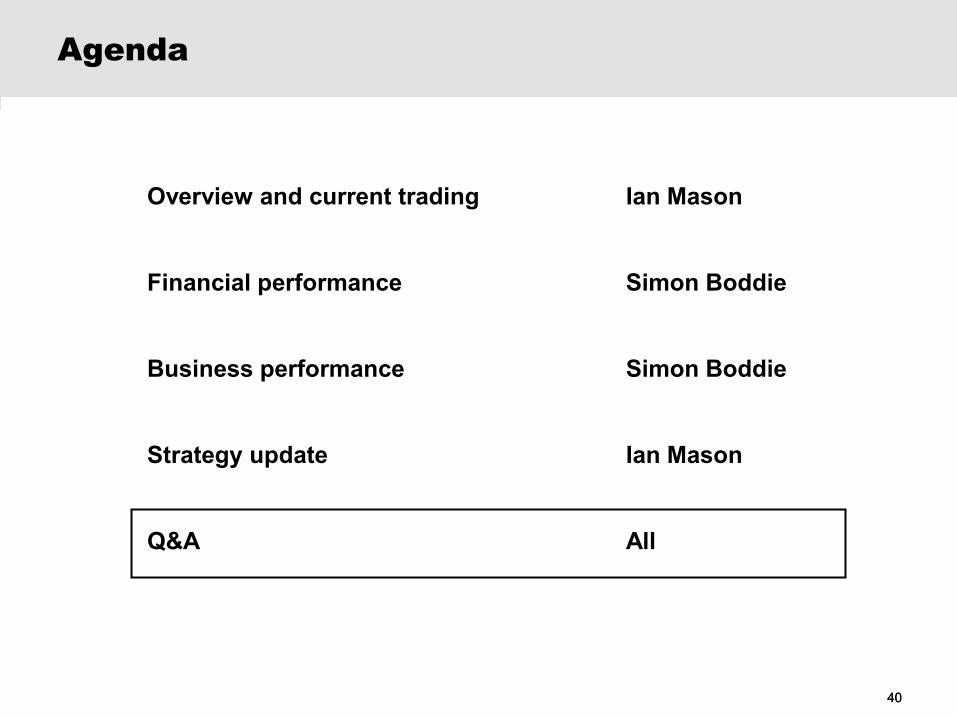
Agenda
Overview and current trading Ian Mason
Financial performance Simon Boddie
Business performance Simon Boddie
Strategy update Ian Mason
Q&A All

Electrocomponents plc
ANNOUNCEMENT OF PRELIMINARY RESULTS
YEAR ENDED 31 MARCH 2013 23 May 2013

42 42
Financial appendices

43 43
Impact of foreign exchange
Foreign exchange operating profit sensitivities: A 10 cent weakening of the Euro against Sterling reduces Group operating profit by c. £6m
A 10 cent weakening of the US Dollar against Sterling reduces Group operating profit by c. £2m
2013 2012 2012 Growth GrowthForeign exchange reported Foreign exchang
impact adjusted£m £m % %
International contribution
Continental Europe 90.9 99.8 (5.8) (8.9)% (3.3)%
North America 34.9 43.3 0.5 (19.4)% (20.3)%
Asia Pacific 12.0 17.7 0.1 (32.2)% (32.4)%
International 137.8 160.8 (5.3) (14.3)% (11.4)%
UK contribution 105.9 106.0 (0.0) (0.1)% (0.1)%
Group contribution 243.7 266.8 (5.3) (8.7)% (6.8)%
Process costs (139.4) (138.7) 1.3 (0.5)% (1.5)%
Headline operating profit 104.3 128.1 (4.0) (18.6)% (16.0)%
Reported

44 44
800K Catalogues 56% e Commerce
44,000 Parcels Daily
> 1m Customers
Strong Brands
2,500 Major Suppliers > 550,000 Products
17 Distribution Centres 90+% of World GDP
Electrocomponents: what we do
The World’s distributor of choice


