
Emaar PropertiesH1 2018 Results August 2018
Emaar Properties PJSC, for themselves and for Emaar Group, give notice that: The particulars of this
presentation do not constitute any part of an offer or a contract.
Given that the presentation contains information based on forecasts and roll outs, all statements contained in this
presentation are made without responsibility on the part of Emaar Properties PJSC, their advisors, or members of
Emaar Group (including their directors, officers and employees).
None of the statements contained in this presentation is to be relied upon as a statement or representation of fact.
All parties must satisfy themselves as to the correctness of each of the statements contained in this presentation.
Emaar Properties PJSC and members of the Emaar Group do not make or give, and neither members of the
Emaar Group nor any of their directors or officers or persons in their employment or advisors has any authority to
make or give, any representation or warranty whatsoever in relation to this presentation.
This presentation may not be stored, copied, distributed, transmitted, retransmitted or reproduced, in whole or in
part, in any form or medium without the permission of Emaar Properties PJSC.
Disclaimer
29 August 2018H1 2018 Results Presentation Page 1
Table of Contents
KEY HIGHLIGHTS
INCOME STATEMENT
BALANCE SHEET
OPERATIONAL OVERVIEW
APPENDIX
29 August 2018H1 2018 Results Presentation Page 2
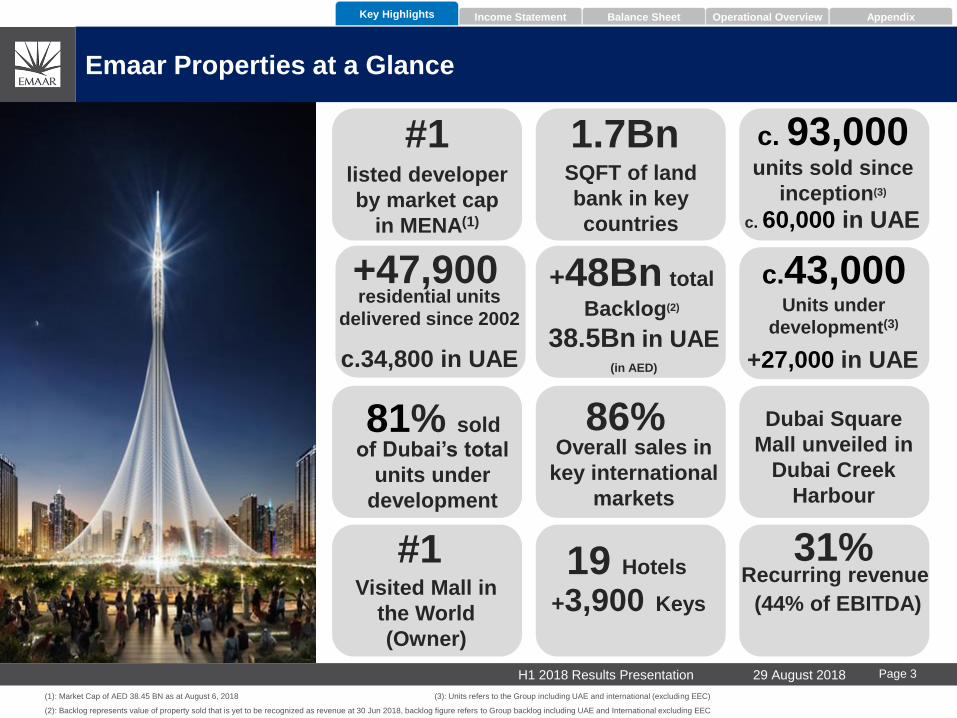
(1): Market Cap of AED 38.45 BN as at August 6, 2018 (3): Units refers to the Group including UAE and international (excluding EEC)
(2): Backlog represents value of property sold that is yet to be recognized as revenue at 30 Jun 2018, backlog figure refers to Group backlog including UAE and International excluding EEC
+47,900residential units
delivered since 2002
c.34,800 in UAE
19 Hotels
+3,900 Keys
#1Visited Mall in
the World
(Owner)
81% soldof Dubai’s total
units under
development
86%Overall sales in
key international
markets
+48Bn total
Backlog(2)
38.5Bn in UAE(in AED)
c.43,000Units under
development(3)
31%
(44% of EBITDA)
Emaar Properties at a Glance
Key Highlights Income Statement Balance Sheet Operational Overview Appendix
Dubai Square
Mall unveiled in
Dubai Creek
Harbour
+27,000 in UAE
#1listed developer
by market cap
in MENA(1)
1.7BnSQFT of land
bank in key
countries
c. 93,000 units sold since
inception(3)
c. 60,000 in UAE
Recurring revenue
29 August 2018H1 2018 Results Presentation Page 3
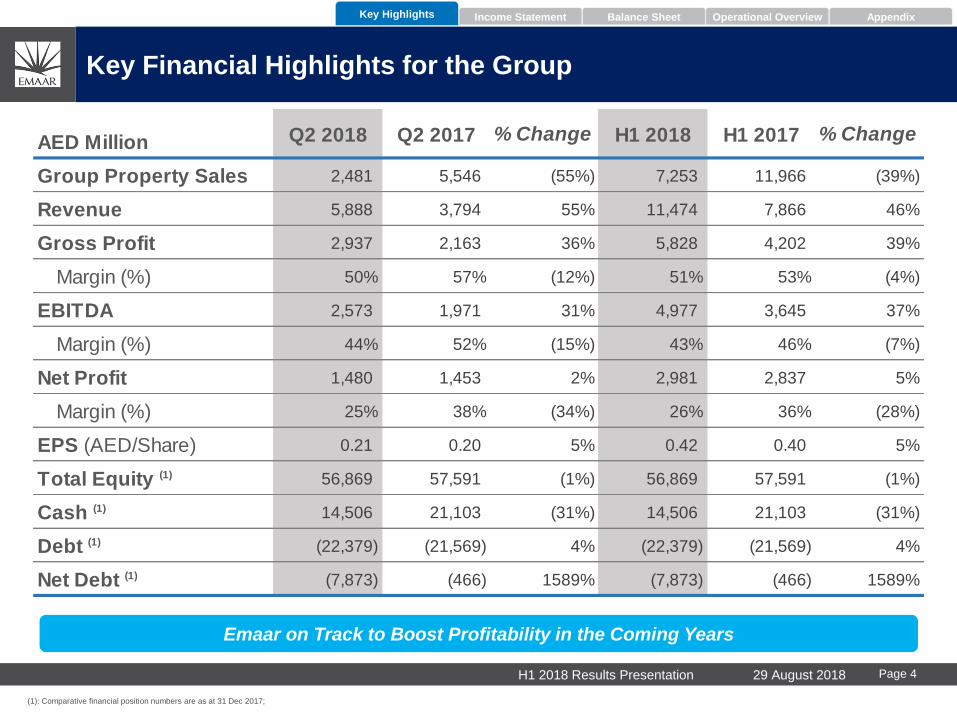
AED Million Q2 2018 Q2 2017 % Change H1 2018 H1 2017 % Change
Group Property Sales 2,481 5,546 (55%) 7,253 11,966 (39%)
Revenue 5,888 3,794 55% 11,474 7,866 46%
Gross Profit 2,937 2,163 36% 5,828 4,202 39%
Margin (%) 50% 57% (12%) 51% 53% (4%)
EBITDA 2,573 1,971 31% 4,977 3,645 37%
Margin (%) 44% 52% (15%) 43% 46% (7%)
Net Profit 1,480 1,453 2% 2,981 2,837 5%
Margin (%) 25% 38% (34%) 26% 36% (28%)
EPS (AED/Share) 0.21 0.20 5% 0.42 0.40 5%
Total Equity (1) 56,869 57,591 (1%) 56,869 57,591 (1%)
Cash (1) 14,506 21,103 (31%) 14,506 21,103 (31%)
Debt (1) (22,379) (21,569) 4% (22,379) (21,569) 4%
Net Debt (1) (7,873) (466) 1589% (7,873) (466) 1589%
Emaar on Track to Boost Profitability in the Coming Years
Key Financial Highlights for the Group
Key Highlights Income Statement Balance Sheet Operational Overview Appendix
(1): Comparative financial position numbers are as at 31 Dec 2017;
29 August 2018H1 2018 Results Presentation Page 4
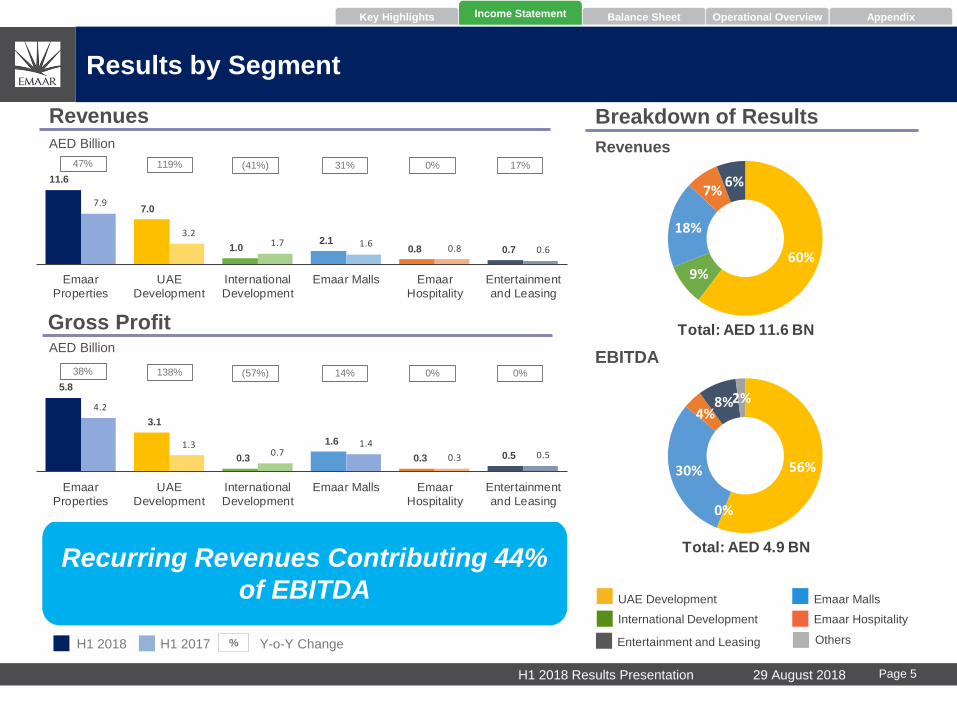
56%
0%
30%
4%8%2%
Total: AED 4.9 BN
60%9%
18%
7%6%
Total: AED 11.6 BN
Breakdown of ResultsAED Billion
Revenues
AED Billion
Gross Profit
Revenues
EBITDA
H1 2017 Y-o-Y Change
Emaar Hospitality
Emaar Malls
%
International Development
Income StatementKey Highlights Balance Sheet Operational Overview Appendix
H1 2018
Results by Segment
Recurring Revenues Contributing 44%
of EBITDA UAE Development
29 August 2018H1 2018 Results Presentation Page 5
11.6
7.0
1.0 2.1
0.8 0.7
7.9
3.2 1.7 1.6
0.8 0.6
Emaar
Properties
UAE
Development
International
Development
Emaar Malls Emaar
Hospitality
Entertainment
and Leasing
47% 119% (41%) 31% 0% 17%
5.8
3.1
0.3
1.6
0.3 0.5
4.2
1.3 0.7
1.4
0.3 0.5
Emaar
Properties
UAE
Development
International
Development
Emaar Malls Emaar
Hospitality
Entertainment
and Leasing
38% 138% (57%) 14% 0% 0%
Entertainment and Leasing Others
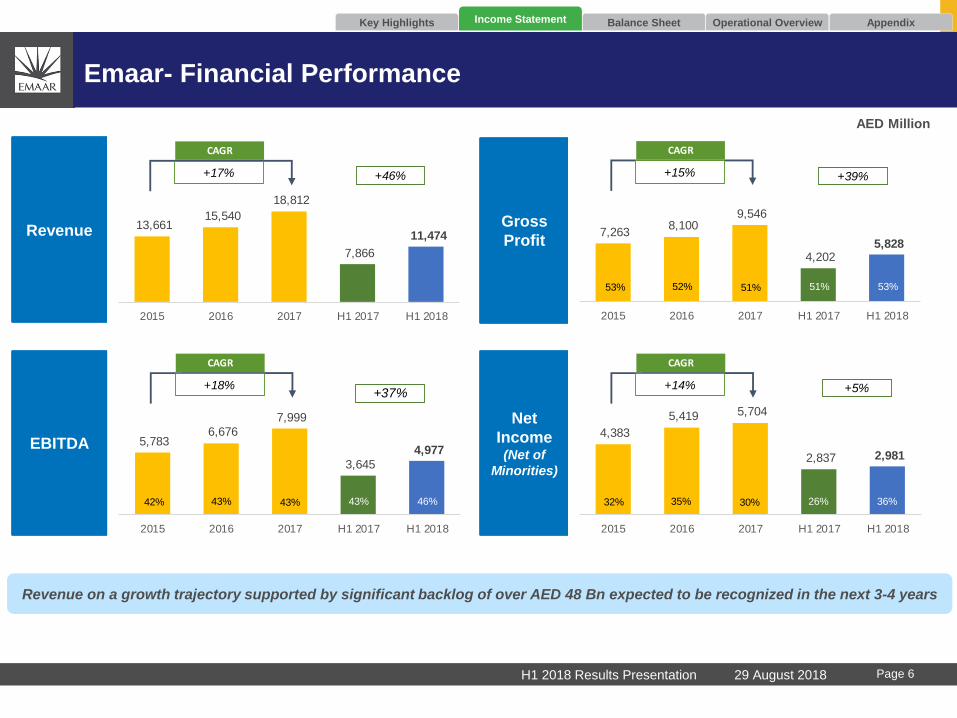
Emaar- Financial Performance
Revenue on a growth trajectory supported by significant backlog of over AED 48 Bn expected to be recognized in the next 3-4 years
AED Million
Revenue
EBITDA
Gross
Profit
Net
Income(Net of
Minorities)
13,661 15,540
18,812
7,866
11,474
2015 2016 2017 H1 2017 H1 2018
+46%+17%
CAGR
7,263 8,100
9,546
4,202 5,828
2015 2016 2017 H1 2017 H1 2018
+39%+15%
CAGR
53% 52% 51% 51% 53%
5,783 6,676
7,999
3,645
4,977
2015 2016 2017 H1 2017 H1 2018
+37%+18%
CAGR
42% 43% 43% 43% 46%
4,383
5,419 5,704
2,837 2,981
2015 2016 2017 H1 2017 H1 2018
+5%+14%
CAGR
32% 35% 30% 26% 36%
Income StatementKey Highlights Balance Sheet Operational Overview Appendix
29 August 2018H1 2018 Results Presentation Page 6
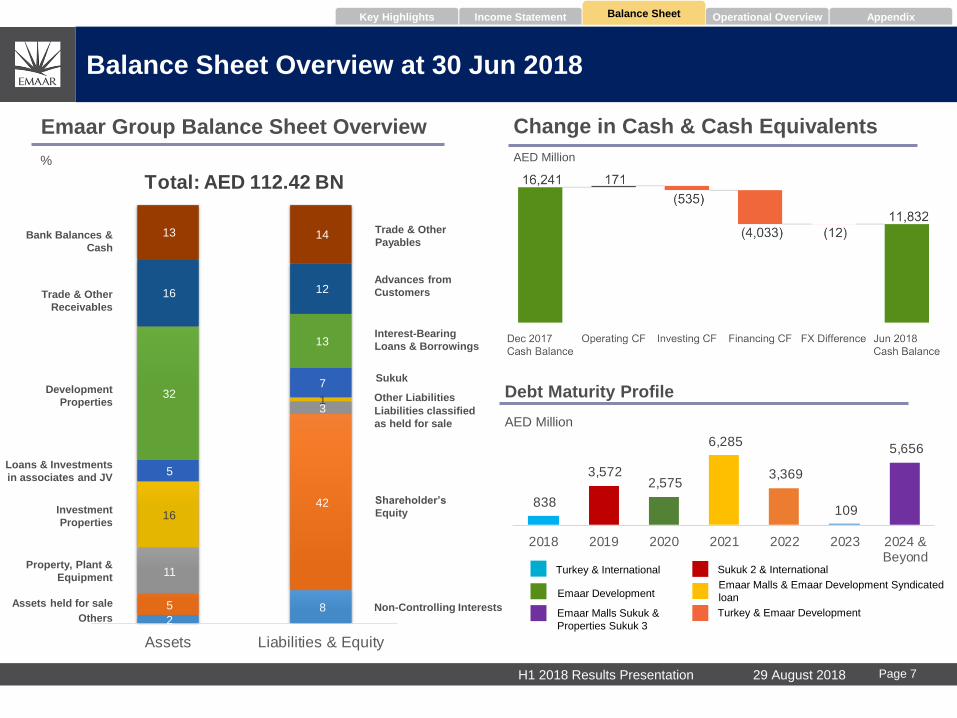
838
3,572 2,575
6,285
3,369
109
5,656
2018 2019 2020 2021 2022 2023 2024 &Beyond
2 8 5
42
11
3
16
1
5
7 32
13
16 12
13 14
Assets Liabilities & Equity
Total: AED 112.42 BN
AED Million%
Balance Sheet Overview at 30 Jun 2018
Investment
Properties
Loans & Investments
in associates and JV
Development
Properties
Trade & Other
Receivables
Bank Balances &
Cash
Sukuk
Interest-Bearing
Loans & Borrowings
Advances from
Customers
Trade & Other
Payables
Emaar Group Balance Sheet Overview
Debt Maturity Profile
AED Million
Balance SheetIncome StatementKey Highlights Operational Overview Appendix
Property, Plant &
Equipment
Others
Other Liabilities
Shareholder’s
Equity
Non-Controlling Interests
Change in Cash & Cash Equivalents
Liabilities classified
as held for sale
Assets held for sale
29 August 2018H1 2018 Results Presentation Page 7
Emaar Malls Sukuk &
Properties Sukuk 3
Turkey & International
Emaar DevelopmentEmaar Malls & Emaar Development Syndicated
loan
Sukuk 2 & International
Turkey & Emaar Development
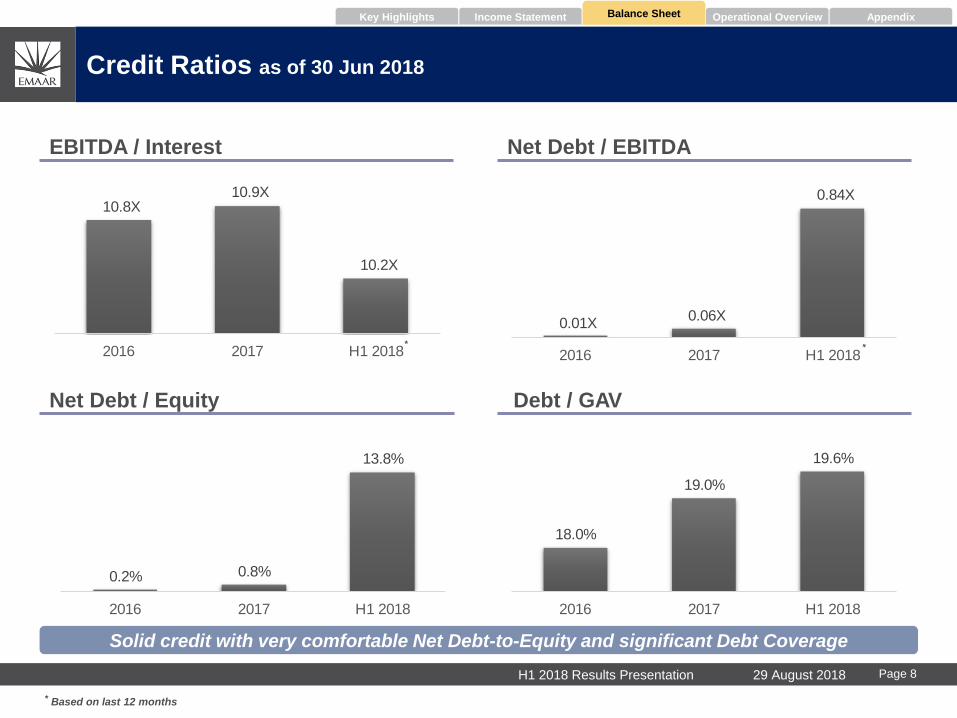
0.01X 0.06X
0.84X
2016 2017 H1 2018
10.8X 10.9X
10.2X
2016 2017 H1 2018
Solid credit with very comfortable Net Debt-to-Equity and significant Debt Coverage
EBITDA / Interest
Debt / GAV
Credit Ratios as of 30 Jun 2018
Net Debt / Equity
Net Debt / EBITDA
Balance SheetIncome StatementKey Highlights Operational Overview Appendix
* Based on last 12 months
*
*
0.2% 0.8%
13.8%
2016 2017 H1 2018
18.0%
19.0%
19.6%
2016 2017 H1 2018
29 August 2018H1 2018 Results Presentation Page 8
UAE Development

Operational OverviewKey Highlights Income Statement Balance Sheet Appendix
(1): Sales value of properties sold but not yet recognised as revenue under IFRS including 100% ownership of joint ventures as of 30 Jun 2018;
(2): Including 100% of Escrow balances of Joint Ventures
UAE DevelopmentOverview
H1 -
2018 L
au
nch
es
The Collective SocioGolf Place
Sunrise BayBeach Vista
Successfully launched 7 new projects
in Dubai during H1 2018 with a total
value of AED 8 Bn
AED 6.2 Bn of sales booked and
2,800 units sold across all projects
during H1 2018
c.60,000properties sold
since inception
AED 38.5Bn UAE Backlog(1)
AED 9.6Bnto be recognized
within the next 3-
4 years
Escrow
balance(2)
units under
development in
UAE
+27,000
29 August 2018H1 2018 Results Presentation Page 10
The Grand Grande
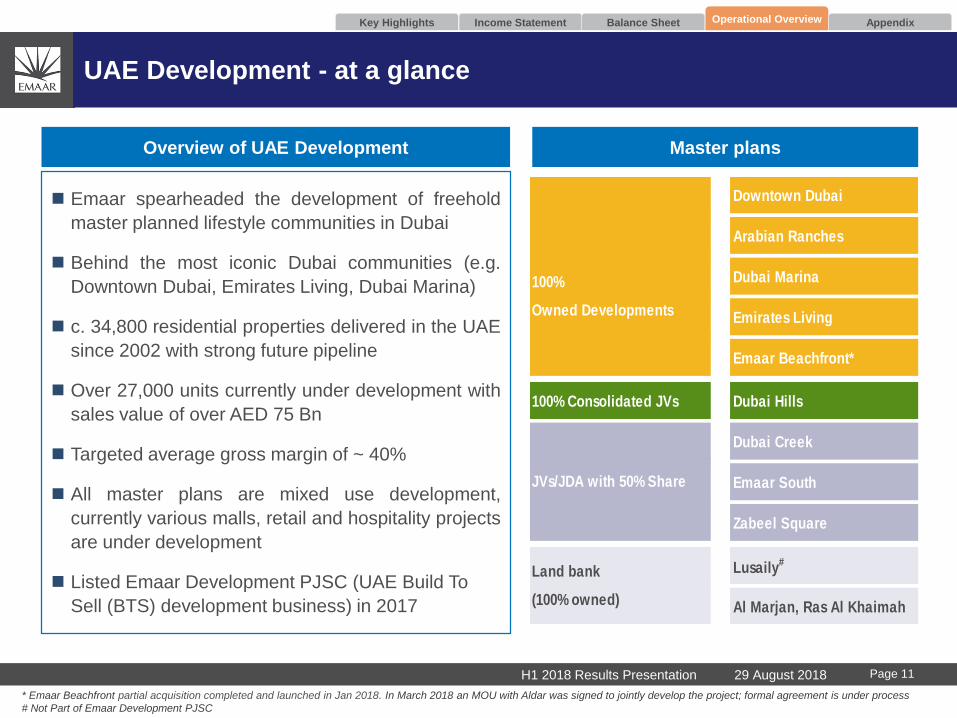
UAE Development - at a glance
Master plans
Emaar spearheaded the development of freehold
master planned lifestyle communities in Dubai
Behind the most iconic Dubai communities (e.g.
Downtown Dubai, Emirates Living, Dubai Marina)
c. 34,800 residential properties delivered in the UAE
since 2002 with strong future pipeline
Over 27,000 units currently under development with
sales value of over AED 75 Bn
Targeted average gross margin of ~ 40%
All master plans are mixed use development,
currently various malls, retail and hospitality projects
are under development
Listed Emaar Development PJSC (UAE Build To
Sell (BTS) development business) in 2017
Overview of UAE Development
Key Highlights Income Statement Balance Sheet Operational Overview Appendix
* Emaar Beachfront partial acquisition completed and launched in Jan 2018. In March 2018 an MOU with Aldar was signed to jointly develop the project; formal agreement is under process
# Not Part of Emaar Development PJSC
29 August 2018H1 2018 Results Presentation Page 11
Downtown Dubai
Arabian Ranches
100% Dubai Marina
Owned Developments Emirates Living
Emaar Beachfront*
100% Consolidated JVs Dubai Hills
Dubai Creek
Emaar South
Zabeel Square
Land bank Lusaily#
(100% owned) Al Marjan, Ras Al Khaimah
JVs/JDA with 50% Share
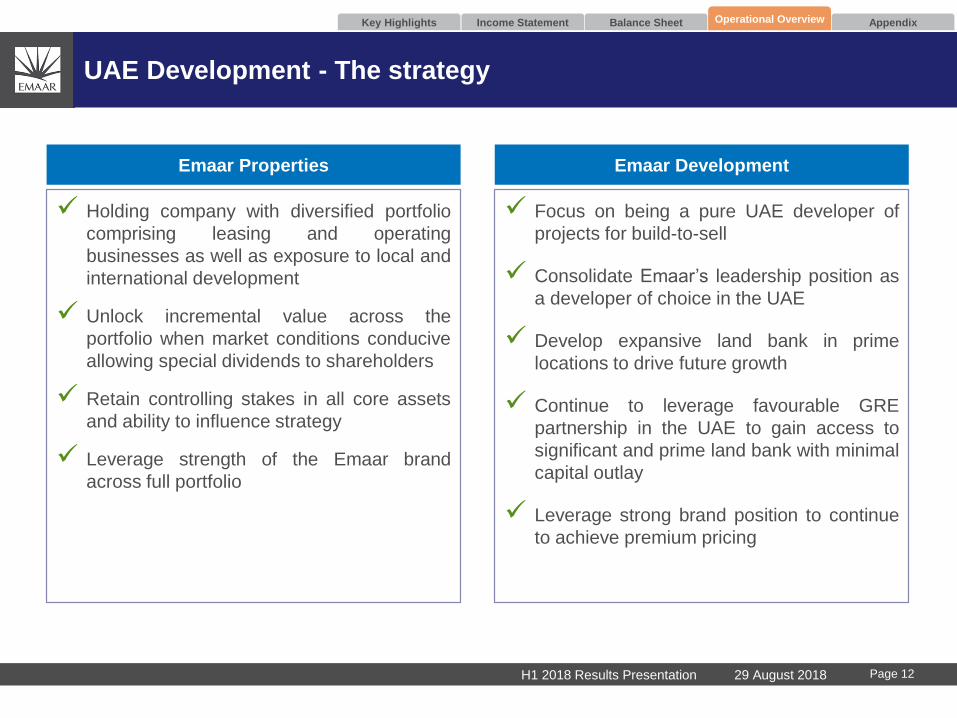
UAE Development - The strategy
Emaar Properties Emaar Development
Holding company with diversified portfolio
comprising leasing and operating
businesses as well as exposure to local and
international development
Unlock incremental value across the
portfolio when market conditions conducive
allowing special dividends to shareholders
Retain controlling stakes in all core assets
and ability to influence strategy
Leverage strength of the Emaar brand
across full portfolio
Focus on being a pure UAE developer of
projects for build-to-sell
Consolidate Emaar’s leadership position as
a developer of choice in the UAE
Develop expansive land bank in prime
locations to drive future growth
Continue to leverage favourable GRE
partnership in the UAE to gain access to
significant and prime land bank with minimal
capital outlay
Leverage strong brand position to continue
to achieve premium pricing
Key Highlights Income Statement Balance Sheet Operational Overview Appendix
29 August 2018H1 2018 Results Presentation Page 12
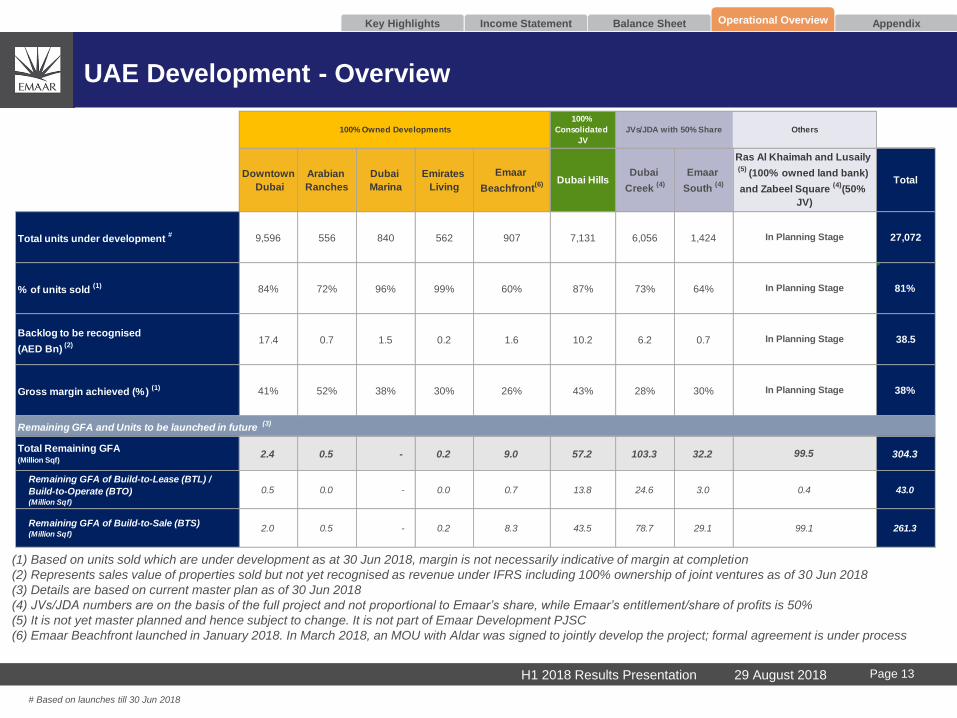
UAE Development - Overview
(1) Based on units sold which are under development as at 30 Jun 2018, margin is not necessarily indicative of margin at completion
(2) Represents sales value of properties sold but not yet recognised as revenue under IFRS including 100% ownership of joint ventures as of 30 Jun 2018
(3) Details are based on current master plan as of 30 Jun 2018
(4) JVs/JDA numbers are on the basis of the full project and not proportional to Emaar’s share, while Emaar’s entitlement/share of profits is 50%
(5) It is not yet master planned and hence subject to change. It is not part of Emaar Development PJSC
(6) Emaar Beachfront launched in January 2018. In March 2018, an MOU with Aldar was signed to jointly develop the project; formal agreement is under process
Key Highlights Income Statement Balance Sheet Operational Overview Appendix
# Based on launches till 30 Jun 2018
29 August 2018H1 2018 Results Presentation Page 13
100%
Consolidated
JV
Downtown
Dubai
Arabian
Ranches
Dubai
Marina
Emirates
Living
Emaar
Beachfront(6) Dubai Hills
Dubai
Creek (4)
Emaar
South (4) Total
Total units under development # 9,596 556 840 562 907 7,131 6,056 1,424 27,072
% of units sold (1) 84% 72% 96% 99% 60% 87% 73% 64% 81%
Backlog to be recognised
(AED Bn) (2)
17.4 0.7 1.5 0.2 1.6 10.2 6.2 0.7 38.5
Gross margin achieved (%) (1) 41% 52% 38% 30% 26% 43% 28% 30% 38%
Total Remaining GFA (Million Sqf)
2.4 0.5 - 0.2 9.0 57.2 103.3 32.2 304.3
Remaining GFA of Build-to-Lease (BTL) /
Build-to-Operate (BTO) (Million Sqf)
0.5 0.0 - 0.0 0.7 13.8 24.6 3.0 43.0
Remaining GFA of Build-to-Sale (BTS) (Million Sqf)
2.0 0.5 - 0.2 8.3 43.5 78.7 29.1 261.3
In Planning Stage
In Planning Stage
Ras Al Khaimah and Lusaily (5)
(100% owned land bank)
and Zabeel Square (4)
(50%
JV)
JVs/JDA with 50% Share100% Owned Developments Others
In Planning Stage
In Planning Stage
0.4
99.1
99.5
Remaining GFA and Units to be launched in future (3)
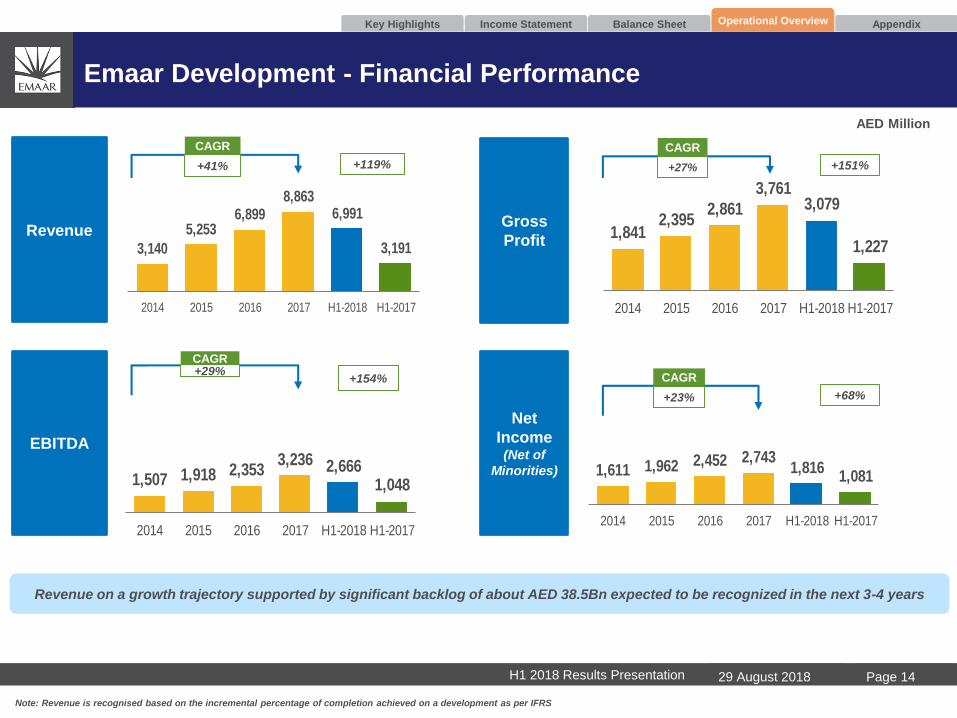
1,841 2,395
2,861
3,761 3,079
1,227
2014 2015 2016 2017 H1-2018 H1-2017
1,611 1,962 2,452 2,743 1,816
1,081
2014 2015 2016 2017 H1-2018 H1-2017
1,507 1,918 2,353 3,236 2,666
1,048
2014 2015 2016 2017 H1-2018 H1-2017
3,140
5,253 6,899
8,863 6,991
3,191
2014 2015 2016 2017 H1-2018 H1-2017
Emaar Development - Financial Performance
H1 2018 Results Presentation 29 August 2018
Revenue on a growth trajectory supported by significant backlog of about AED 38.5Bn expected to be recognized in the next 3-4 years
Note: Revenue is recognised based on the incremental percentage of completion achieved on a development as per IFRS
Revenue
EBITDA
Gross
Profit
Net
Income(Net of
Minorities)
+41%
CAGR
+27%
CAGR
+23%
CAGR+29%CAGR
AED Million
+119% +151%
+68%
+154%
Key Highlights Income Statement Balance Sheet Operational Overview Appendix
Page 14
International Development
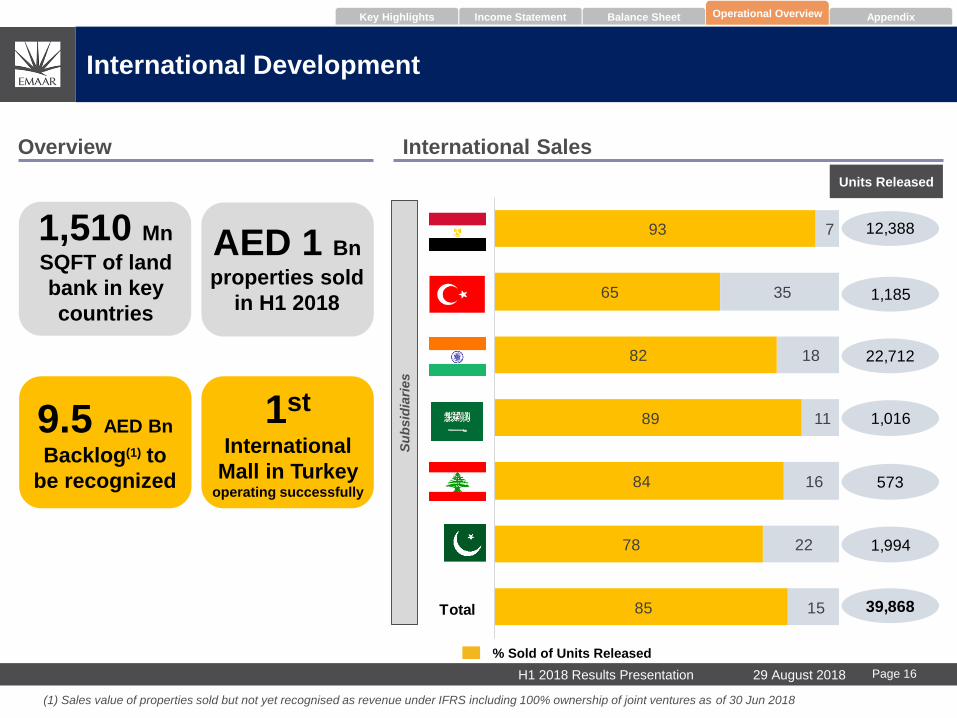
93
65
82
89
84
78
85
7
35
18
11
16
22
15
Emaar Misr
Emaar Turkey
Emaar India
Emaar MiddleEast
MetnRenaissance
EGKL & EDIL
Total
12,388
573
1,016
22,712
1,185
1,994
Total 39,868
International Development
Overview International Sales
Operational OverviewBalance SheetIncome StatementKey Highlights Appendix
Units Released
% Sold of Units Released
Su
bsid
iari
es
9.5 AED Bn
Backlog(1) to
be recognized
1,510 Mn
SQFT of land
bank in key
countries
AED 1 Bn
properties sold
in H1 2018
1st
International
Mall in Turkeyoperating successfully
(1) Sales value of properties sold but not yet recognised as revenue under IFRS including 100% ownership of joint ventures as of 30 Jun 2018
29 August 2018H1 2018 Results Presentation Page 16
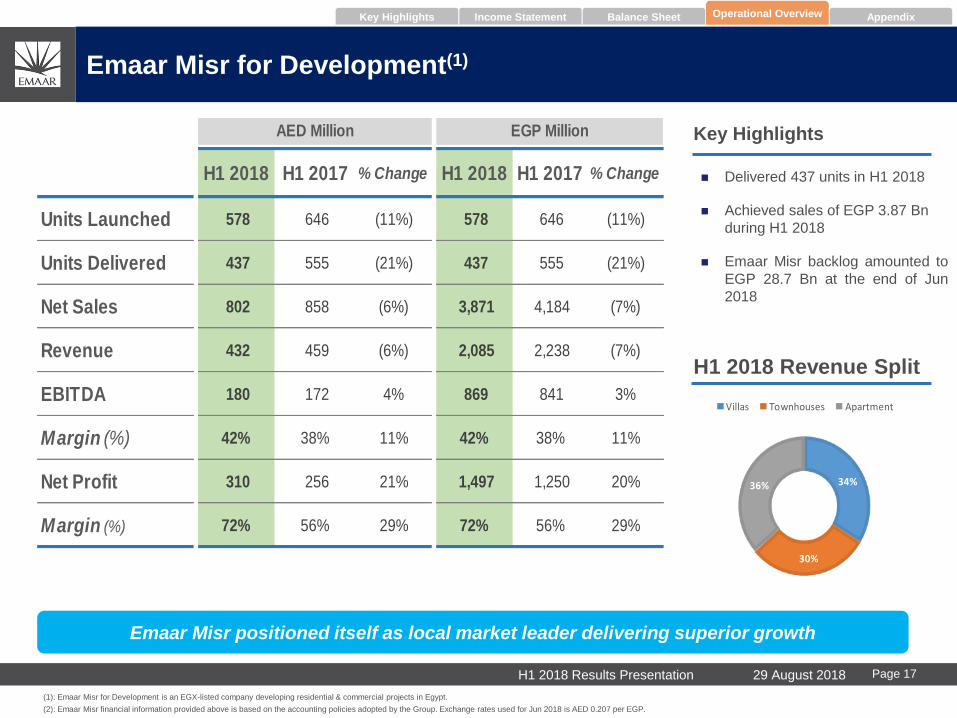
34%
30%
36%
Villas Townhouses Apartment
H1 2018 H1 2017 % Change H1 2018 H1 2017 % Change
Units Launched 578 646 (11%) 578 646 (11%)
Units Delivered 437 555 (21%) 437 555 (21%)
Net Sales 802 858 (6%) 3,871 4,184 (7%)
Revenue 432 459 (6%) 2,085 2,238 (7%)
EBITDA 180 172 4% 869 841 3%
Margin (%) 42% 38% 11% 42% 38% 11%
Net Profit 310 256 21% 1,497 1,250 20%
Margin (%) 72% 56% 29% 72% 56% 29%
AED Million EGP Million
Emaar Misr positioned itself as local market leader delivering superior growth
Emaar Misr for Development(1)
Operational OverviewBalance SheetIncome StatementKey Highlights Appendix
(1): Emaar Misr for Development is an EGX-listed company developing residential & commercial projects in Egypt.
(2): Emaar Misr financial information provided above is based on the accounting policies adopted by the Group. Exchange rates used for Jun 2018 is AED 0.207 per EGP.
Key Highlights
H1 2018 Revenue Split
Delivered 437 units in H1 2018
Achieved sales of EGP 3.87 Bn
during H1 2018
Emaar Misr backlog amounted to
EGP 28.7 Bn at the end of Jun
2018
29 August 2018H1 2018 Results Presentation Page 17
29 August 2018H1 2018 Results Presentation Page 18
Emaar Malls
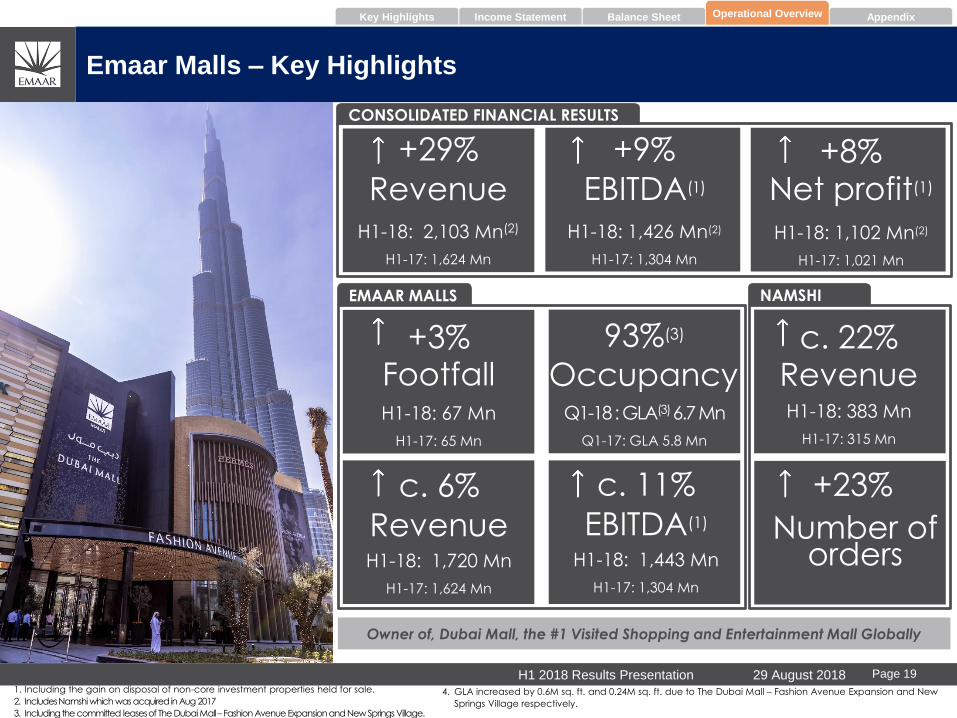
EMAAR MALLS NAMSHI
CONSOLIDATED FINANCIAL RESULTS
Owner of, Dubai Mall, the #1 Visited Shopping and Entertainment Mall Globally
Emaar Malls – Key Highlights
Operational OverviewBalance SheetIncome StatementKey Highlights Appendix
H1-18: 67 Mn
H1-17: 65 Mn
Footfall
+29% +9%
EBITDA(1)RevenueH1-18: 2,103 Mn(2)
H1-17: 1,624 Mn
H1-18: 1,426 Mn(2)
H1-17: 1,304 Mn
Number of orders
+23%
H1-18: 383 Mn
H1-17: 315 Mn
Revenuec. 22%+3%
+8%Net profit(1)
H1-18: 1,102 Mn(2)
H1-17: 1,021 Mn
c. 6%
RevenueH1-18: 1,720 Mn
H1-17: 1,624 Mn
Q1-18 : GLA(3) 6.7 Mn
Q1-17: GLA 5.8 Mn
Occupancy
93%(3)
c. 11%
EBITDA(1)
H1-18: 1,443 Mn
H1-17: 1,304 Mn
1. Including the gain on disposal of non-core investment properties held for sale.
2. Includes Namshi which was acquired in Aug 2017
3. Including the committed leases of The Dubai Mall – Fashion Avenue Expansion and New Springs Village.
4. GLA increased by 0.6M sq. ft. and 0.24M sq. ft. due to The Dubai Mall – Fashion Avenue Expansion and New
Springs Village respectively.
29 August 2018H1 2018 Results Presentation Page 19

H1 2018 H1 2017 % Change
GLA
(Mn SQFT) 6.7 5.8 16%
Occupancy Rate
(%)93% 95% (2%)
Base Rent
(AED Mn) 1,292 1,175 10%
Turnover Rent
(AED Mn) 61 57 7%
Revenue (2)
(AED Mn) 1,720 1,624 6%
EBITDA (2)
(AED Mn) 1,443 1,304 11%
Margin (2)
(%)84% 80% 4%
Base Rent, 61%
Net Turnover rent, 3%
Services and other charges,
10%
other rental income, 8%
Online retail, 18%
Stable Performance, EBITDA increased by 4% in H1 2018
Emaar Malls - Performance
Operational OverviewBalance SheetIncome StatementKey Highlights Appendix
Emaar Malls records 3% growth in footfall
YoY to 67 million visitors
Fashion Avenue & Springs welcomed
shoppers in H1 2018.
Key Highlights
H1 2018 Revenue Split
(1) Including committed lease of the The Dubai Mall – Fashion Avenue Expansion and New Spring Village.
(2) H1-17 does not include Namshi results as its acquired from Aug-17
29 August 2018H1 2018 Results Presentation Page 20
(1)

Hospitality Group
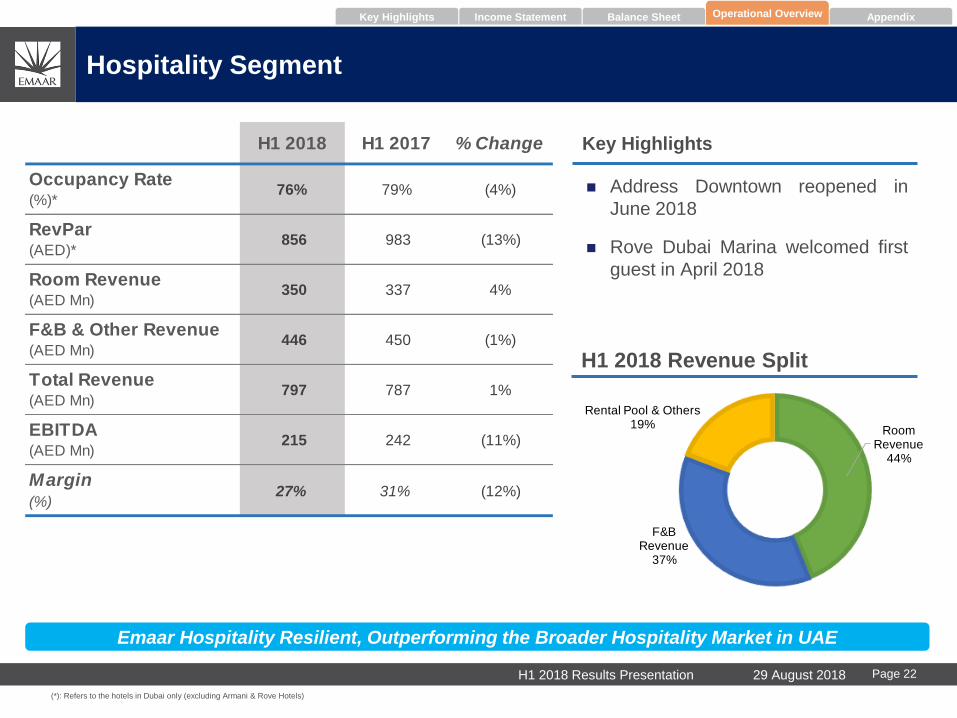
Room Revenue
44%
F&B Revenue
37%
Rental Pool & Others19%
Key Highlights
Hospitality Segment
Operational OverviewBalance SheetIncome StatementKey Highlights Appendix
(*): Refers to the hotels in Dubai only (excluding Armani & Rove Hotels)
Emaar Hospitality Resilient, Outperforming the Broader Hospitality Market in UAE
Address Downtown reopened in
June 2018
Rove Dubai Marina welcomed first
guest in April 2018
H1 2018 Revenue Split
H1 2018 H1 2017 % Change
Occupancy Rate (%)*
76% 79% (4%)
RevPar (AED)*
856 983 (13%)
Room Revenue (AED Mn)
350 337 4%
F&B & Other Revenue (AED Mn)
446 450 (1%)
Total Revenue (AED Mn)
797 787 1%
EBITDA (AED Mn)
215 242 (11%)
Margin (%)
27% 31% (12%)
29 August 2018H1 2018 Results Presentation Page 22

Emaar Hospitality Group: Asset Performance Breakdown
1. The hotel was opened in March 2017
2. The hotel is under short term renovation from April 2018
Operational OverviewBalance SheetIncome StatementKey Highlights Appendix
H1 2018 H1 2017 H1 2018 H1 2017 H1 2018 H1 2017
Available Room Nights 35,476 23,912 43,802 43,802 44,164 44,164
Occupancy (%) 74% 48% 80% 82% 68% 84%
ADR (AED) 1,420 1,666 1,469 1,622 1,362 1,564
RevPar (AED) 1,053 806 1,175 1,322 926 1,307
Room Revenue (AED Thousands) 37,357 19,264 51,447 57,924 40,885 57,708
H1 2018 H1 2017 H1 2018 H1 2017 H1 2018 H1 2017
Available Room Nights 36,200 36,200 35,657 35,657 28,236 28,236
Occupancy (%) 84% 82% 77% 80% 81% 86%
ADR (AED) 938 1,031 745 848 786 869
RevPar (AED) 784 845 573 678 635 752
Room Revenue (AED Thousands) 28,370 30,605 20,418 24,163 17,936 21,230
Address Boulevard (1) The Palace Downtown Address Dubai Mall
(2)
Address Dubai Marina Manzil Downtown Vida Downtown
29 August 2018H1 2018 Results Presentation Page 23
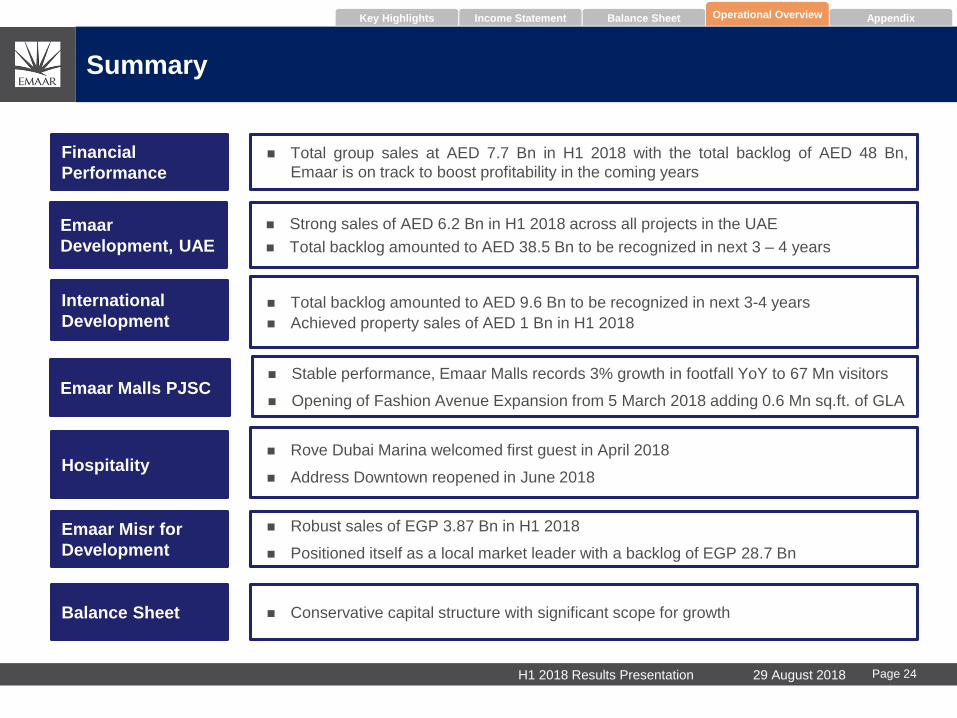
Financial
Performance
Total group sales at AED 7.7 Bn in H1 2018 with the total backlog of AED 48 Bn,
Emaar is on track to boost profitability in the coming years
Emaar
Development, UAE
Strong sales of AED 6.2 Bn in H1 2018 across all projects in the UAE
Total backlog amounted to AED 38.5 Bn to be recognized in next 3 – 4 years
International
Development Total backlog amounted to AED 9.6 Bn to be recognized in next 3-4 years
Achieved property sales of AED 1 Bn in H1 2018
Emaar Malls PJSC Stable performance, Emaar Malls records 3% growth in footfall YoY to 67 Mn visitors
Opening of Fashion Avenue Expansion from 5 March 2018 adding 0.6 Mn sq.ft. of GLA
Hospitality Rove Dubai Marina welcomed first guest in April 2018
Address Downtown reopened in June 2018
Emaar Misr for
Development
Robust sales of EGP 3.87 Bn in H1 2018
Positioned itself as a local market leader with a backlog of EGP 28.7 Bn
Summary
Balance Sheet Conservative capital structure with significant scope for growth
Operational OverviewBalance SheetIncome StatementKey Highlights Appendix
29 August 2018H1 2018 Results Presentation Page 24
Appendix
Appendix A – Overview of Divisions and Strategy
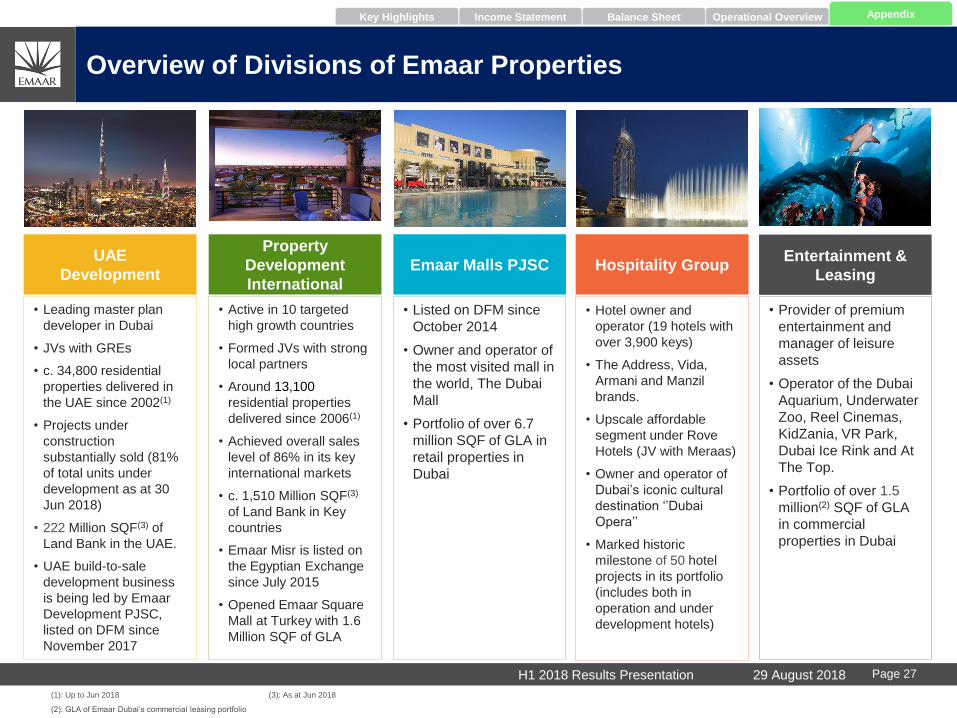
UAE
Development
• Leading master plan
developer in Dubai
• JVs with GREs
• c. 34,800 residential
properties delivered in
the UAE since 2002(1)
• Projects under
construction
substantially sold (81%
of total units under
development as at 30
Jun 2018)
• 222 Million SQF(3) of
Land Bank in the UAE.
• UAE build-to-sale
development business
is being led by Emaar
Development PJSC,
listed on DFM since
November 2017
Property
Development
International
• Active in 10 targeted
high growth countries
• Formed JVs with strong
local partners
• Around 13,100
residential properties
delivered since 2006(1)
• Achieved overall sales
level of 86% in its key
international markets
• c. 1,510 Million SQF(3)
of Land Bank in Key
countries
• Emaar Misr is listed on
the Egyptian Exchange
since July 2015
• Opened Emaar Square
Mall at Turkey with 1.6
Million SQF of GLA
Emaar Malls PJSC
• Listed on DFM since
October 2014
• Owner and operator of
the most visited mall in
the world, The Dubai
Mall
• Portfolio of over 6.7
million SQF of GLA in
retail properties in
Dubai
Hospitality Group
• Hotel owner and
operator (19 hotels with
over 3,900 keys)
• The Address, Vida,
Armani and Manzil
brands.
• Upscale affordable
segment under Rove
Hotels (JV with Meraas)
• Owner and operator of
Dubai’s iconic cultural
destination ‘’Dubai
Opera’’
• Marked historic
milestone of 50 hotel
projects in its portfolio
(includes both in
operation and under
development hotels)
(1): Up to Jun 2018
(2): GLA of Emaar Dubai’s commercial leasing portfolio
Overview of Divisions of Emaar Properties
Entertainment &
Leasing
• Provider of premium
entertainment and
manager of leisure
assets
• Operator of the Dubai
Aquarium, Underwater
Zoo, Reel Cinemas,
KidZania, VR Park,
Dubai Ice Rink and At
The Top.
• Portfolio of over 1.5
million(2) SQF of GLA
in commercial
properties in Dubai
Income Statement Balance Sheet Operational OverviewKey Highlights Appendix
(3): As at Jun 2018
29 August 2018H1 2018 Results Presentation Page 27

UAE Consolidate Emaar’s position as of the largest developer of iconic projects in Dubai.
Enter into joint ventures in UAE to get access to significant land bank, limiting need for
immediate cash outlays for land purchases.
International Replicate the Dubai business model in international markets. This is reflected through gain
of control in Indian JV – Emaar MGF during 2016.
Increase international contribution to Group revenue.
Funding
Limit funding from the parent to land acquisition and initial infrastructure related
construction.
Additional funding to be raised at the project level through pre-sales, debt financing, and
strategic sales.
Monetize Core
Assets Monetize core assets (IPO / REITs) including Hospitality, Turkey and India at the right time
to provide further growth capital and create significant value for shareholders.
Recurring
Revenues
Continue to increase recurring revenues in UAE and international market
Develop mall assets internationally & expand our hotel brands globally.
Strategy
Income Statement Balance Sheet Operational OverviewKey Highlights Appendix
29 August 2018H1 2018 Results Presentation Page 28
Appendix B – Overview of UAE Development
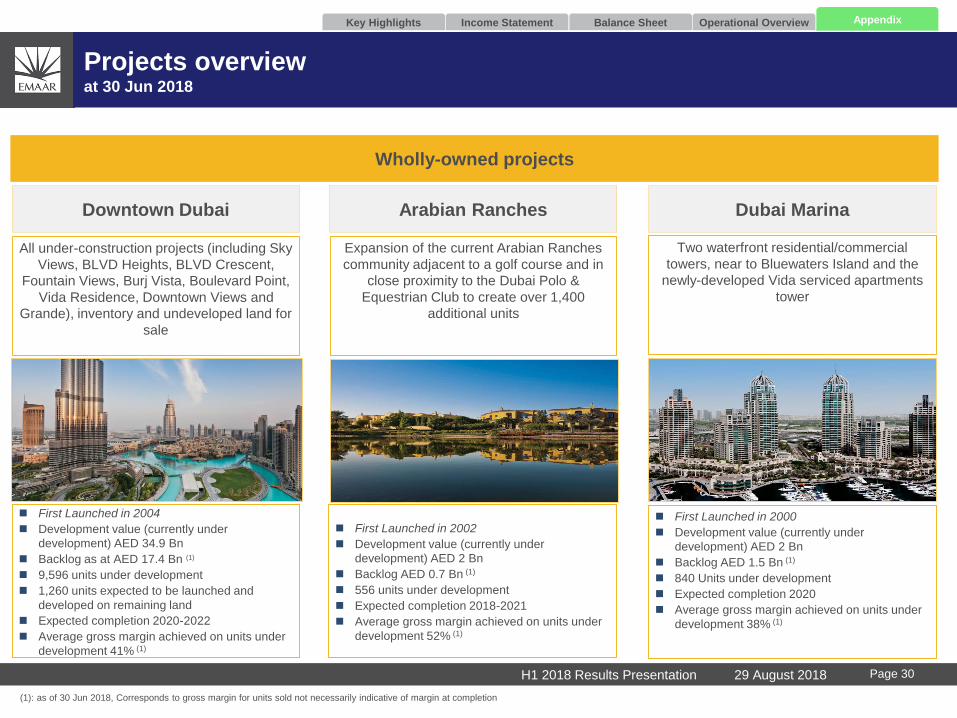
Arabian Ranches
Expansion of the current Arabian Ranches
community adjacent to a golf course and in
close proximity to the Dubai Polo &
Equestrian Club to create over 1,400
additional units
Dubai Marina
Two waterfront residential/commercial
towers, near to Bluewaters Island and the
newly-developed Vida serviced apartments
tower
Downtown Dubai
All under-construction projects (including Sky
Views, BLVD Heights, BLVD Crescent,
Fountain Views, Burj Vista, Boulevard Point,
Vida Residence, Downtown Views and
Grande), inventory and undeveloped land for
sale
Projects overviewat 30 Jun 2018
Wholly-owned projects
Income Statement Balance Sheet Operational OverviewKey Highlights Appendix
(1): as of 30 Jun 2018, Corresponds to gross margin for units sold not necessarily indicative of margin at completion
First Launched in 2002
Development value (currently under
development) AED 2 Bn
Backlog AED 0.7 Bn (1)
556 units under development
Expected completion 2018-2021
Average gross margin achieved on units under
development 52% (1)
First Launched in 2000
Development value (currently under
development) AED 2 Bn
Backlog AED 1.5 Bn (1)
840 Units under development
Expected completion 2020
Average gross margin achieved on units under
development 38% (1)
First Launched in 2004
Development value (currently under
development) AED 34.9 Bn
Backlog as at AED 17.4 Bn (1)
9,596 units under development
1,260 units expected to be launched and
developed on remaining land
Expected completion 2020-2022
Average gross margin achieved on units under
development 41% (1)
29 August 2018H1 2018 Results Presentation Page 30
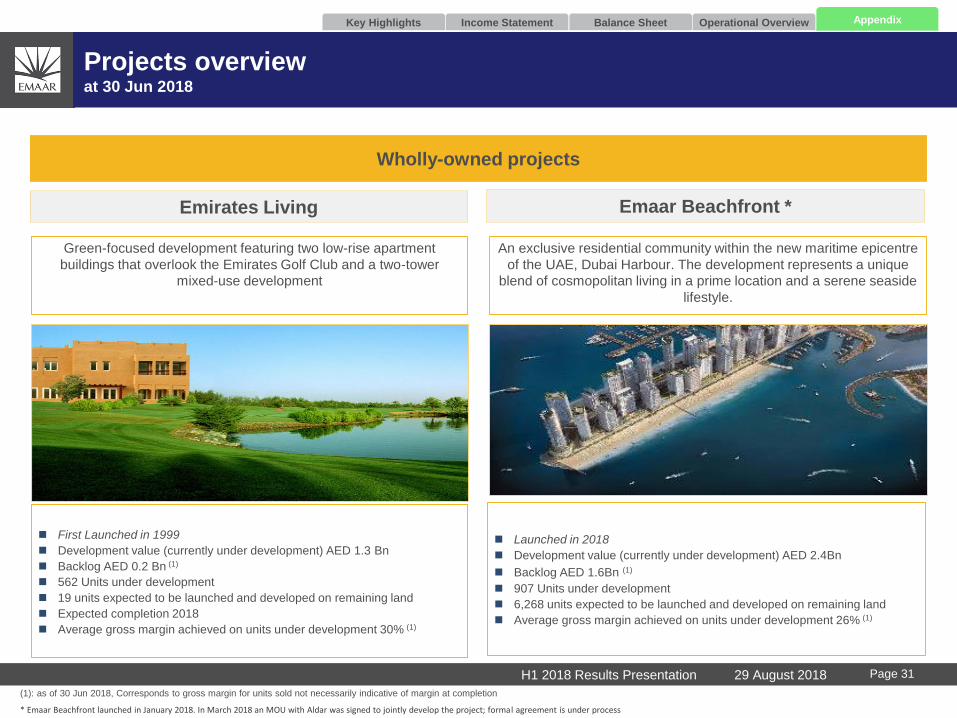
Emaar Beachfront *
An exclusive residential community within the new maritime epicentre
of the UAE, Dubai Harbour. The development represents a unique
blend of cosmopolitan living in a prime location and a serene seaside
lifestyle.
Emirates Living
Green-focused development featuring two low-rise apartment
buildings that overlook the Emirates Golf Club and a two-tower
mixed-use development
Projects overviewat 30 Jun 2018
Wholly-owned projects
Income Statement Balance Sheet Operational OverviewKey Highlights Appendix
(1): as of 30 Jun 2018, Corresponds to gross margin for units sold not necessarily indicative of margin at completion
* Emaar Beachfront launched in January 2018. In March 2018 an MOU with Aldar was signed to jointly develop the project; formal agreement is under process
First Launched in 1999
Development value (currently under development) AED 1.3 Bn
Backlog AED 0.2 Bn (1)
562 Units under development
19 units expected to be launched and developed on remaining land
Expected completion 2018
Average gross margin achieved on units under development 30% (1)
29 August 2018H1 2018 Results Presentation Page 31
Launched in 2018
Development value (currently under development) AED 2.4Bn
Backlog AED 1.6Bn (1)
907 Units under development
6,268 units expected to be launched and developed on remaining land
Average gross margin achieved on units under development 26% (1)
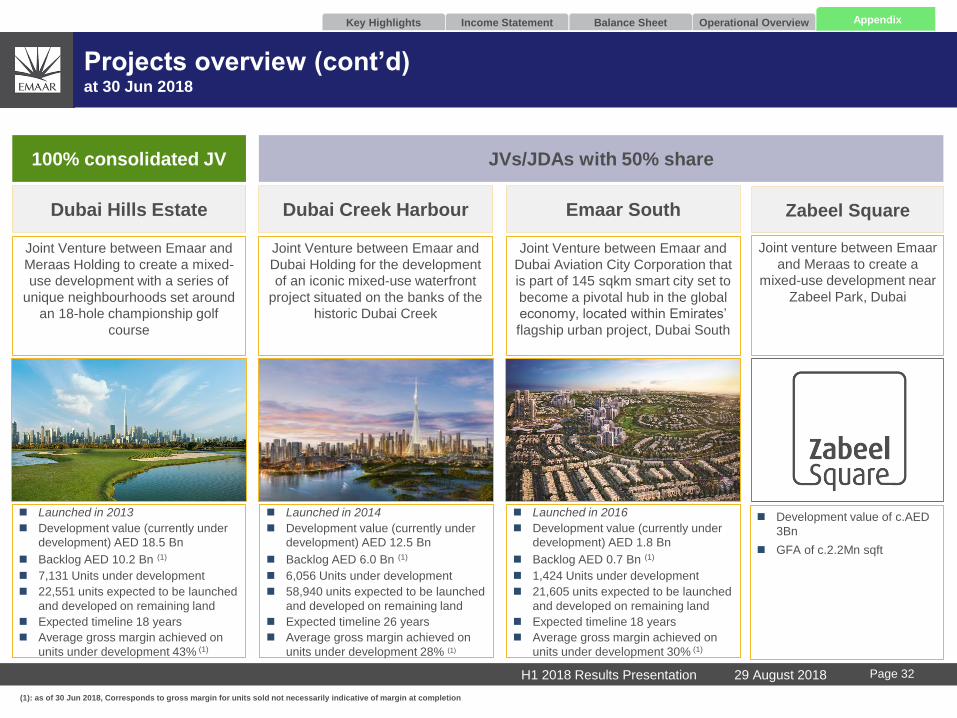
Dubai Creek Harbour
Joint Venture between Emaar and
Dubai Holding for the development
of an iconic mixed-use waterfront
project situated on the banks of the
historic Dubai Creek
Emaar South
Joint Venture between Emaar and
Dubai Aviation City Corporation that
is part of 145 sqkm smart city set to
become a pivotal hub in the global
economy, located within Emirates’
flagship urban project, Dubai South
Dubai Hills Estate
Joint Venture between Emaar and
Meraas Holding to create a mixed-
use development with a series of
unique neighbourhoods set around
an 18-hole championship golf
course
100% consolidated JV JVs/JDAs with 50% share
Income Statement Balance Sheet Operational OverviewKey Highlights Appendix
Projects overview (cont’d)at 30 Jun 2018
(1): as of 30 Jun 2018, Corresponds to gross margin for units sold not necessarily indicative of margin at completion
Launched in 2014
Development value (currently under
development) AED 12.5 Bn
Backlog AED 6.0 Bn (1)
6,056 Units under development
58,940 units expected to be launched
and developed on remaining land
Expected timeline 26 years
Average gross margin achieved on
units under development 28% (1)
Launched in 2013
Development value (currently under
development) AED 18.5 Bn
Backlog AED 10.2 Bn (1)
7,131 Units under development
22,551 units expected to be launched
and developed on remaining land
Expected timeline 18 years
Average gross margin achieved on
units under development 43% (1)
Launched in 2016
Development value (currently under
development) AED 1.8 Bn
Backlog AED 0.7 Bn (1)
1,424 Units under development
21,605 units expected to be launched
and developed on remaining land
Expected timeline 18 years
Average gross margin achieved on
units under development 30% (1)
29 August 2018H1 2018 Results Presentation Page 32
Zabeel Square
Joint venture between Emaar
and Meraas to create a
mixed-use development near
Zabeel Park, Dubai
Development value of c.AED
3Bn
GFA of c.2.2Mn sqft
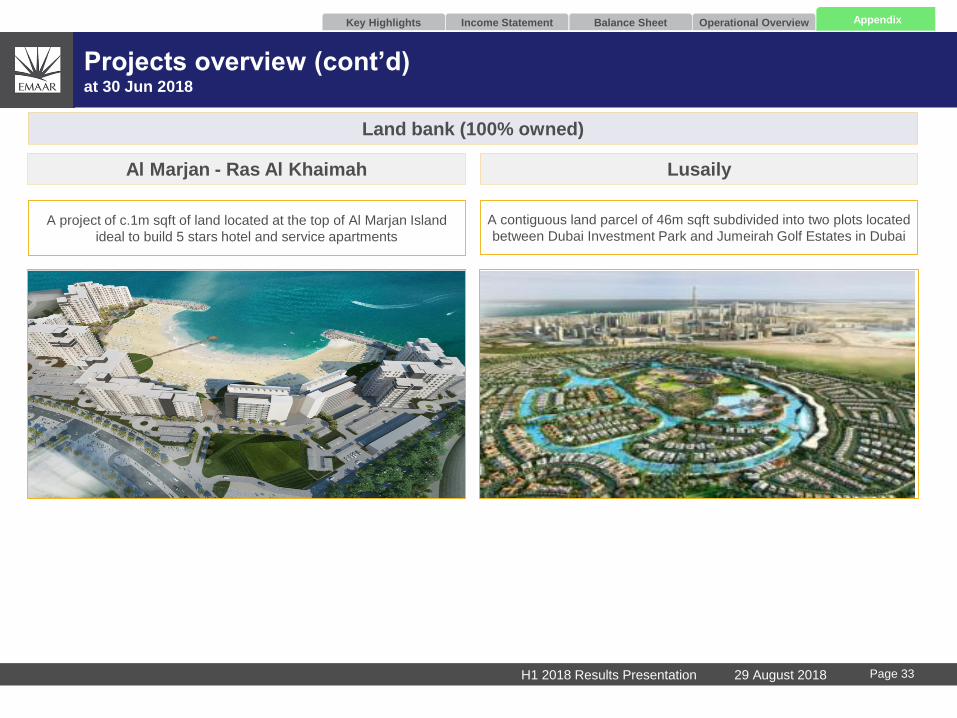
Al Marjan - Ras Al Khaimah
A project of c.1m sqft of land located at the top of Al Marjan Island
ideal to build 5 stars hotel and service apartments
Land bank (100% owned)
Income Statement Balance Sheet Operational OverviewKey Highlights Appendix
Projects overview (cont’d)at 30 Jun 2018
A contiguous land parcel of 46m sqft subdivided into two plots located
between Dubai Investment Park and Jumeirah Golf Estates in Dubai
Lusaily
29 August 2018H1 2018 Results Presentation Page 33
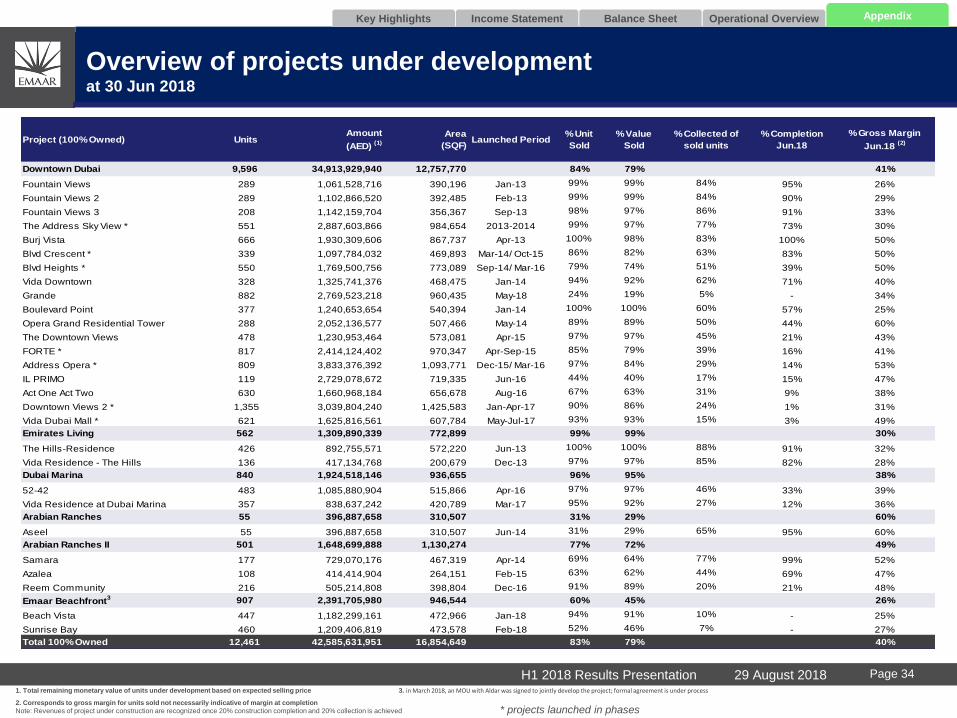
Overview of projects under developmentat 30 Jun 2018
Income Statement Balance Sheet Operational OverviewKey Highlights Appendix
1. Total remaining monetary value of units under development based on expected selling price 3. in March 2018, an MOU with Aldar was signed to jointly develop the project; formal agreement is under process
2. Corresponds to gross margin for units sold not necessarily indicative of margin at completion
Note: Revenues of project under construction are recognized once 20% construction completion and 20% collection is achieved * projects launched in phases
29 August 2018H1 2018 Results Presentation Page 34
Project (100% Owned) UnitsAmount
(AED) (1)
Area
(SQF)Launched Period
% Unit
Sold
% Value
Sold
% Collected of
sold units
% Completion
Jun.18
% Gross Margin
Jun.18 (2)
Downtown Dubai 9,596 34,913,929,940 12,757,770 84% 79% 41%
Fountain Views 289 1,061,528,716 390,196 Jan-13 99% 99% 84% 95% 26%
Fountain Views 2 289 1,102,866,520 392,485 Feb-13 99% 99% 84% 90% 29%
Fountain Views 3 208 1,142,159,704 356,367 Sep-13 98% 97% 86% 91% 33%
The Address Sky View * 551 2,887,603,866 984,654 2013-2014 99% 97% 77% 73% 30%
Burj Vista 666 1,930,309,606 867,737 Apr-13 100% 98% 83% 100% 50%
Blvd Crescent * 339 1,097,784,032 469,893 Mar-14/ Oct-15 86% 82% 63% 83% 50%
Blvd Heights * 550 1,769,500,756 773,089 Sep-14/ Mar-16 79% 74% 51% 39% 50%
Vida Downtown 328 1,325,741,376 468,475 Jan-14 94% 92% 62% 71% 40%
Grande 882 2,769,523,218 960,435 May-18 24% 19% 5% - 34%
Boulevard Point 377 1,240,653,654 540,394 Jan-14 100% 100% 60% 57% 25%
Opera Grand Residential Tower 288 2,052,136,577 507,466 May-14 89% 89% 50% 44% 60%
The Downtown Views 478 1,230,953,464 573,081 Apr-15 97% 97% 45% 21% 43%
FORTE * 817 2,414,124,402 970,347 Apr-Sep-15 85% 79% 39% 16% 41%
Address Opera * 809 3,833,376,392 1,093,771 Dec-15/ Mar-16 97% 84% 29% 14% 53%
IL PRIMO 119 2,729,078,672 719,335 Jun-16 44% 40% 17% 15% 47%
Act One Act Two 630 1,660,968,184 656,678 Aug-16 67% 63% 31% 9% 38%
Downtown Views 2 * 1,355 3,039,804,240 1,425,583 Jan-Apr-17 90% 86% 24% 1% 31%
Vida Dubai Mall * 621 1,625,816,561 607,784 May-Jul-17 93% 93% 15% 3% 49%
Emirates Living 562 1,309,890,339 772,899 99% 99% 30%
The Hills-Residence 426 892,755,571 572,220 Jun-13 100% 100% 88% 91% 32%
Vida Residence - The Hills 136 417,134,768 200,679 Dec-13 97% 97% 85% 82% 28%
Dubai Marina 840 1,924,518,146 936,655 96% 95% 38%
52-42 483 1,085,880,904 515,866 Apr-16 97% 97% 46% 33% 39%
Vida Residence at Dubai Marina 357 838,637,242 420,789 Mar-17 95% 92% 27% 12% 36%
Arabian Ranches 55 396,887,658 310,507 31% 29% 60%
Aseel 55 396,887,658 310,507 Jun-14 31% 29% 65% 95% 60%
Arabian Ranches II 501 1,648,699,888 1,130,274 77% 72% 49%
Samara 177 729,070,176 467,319 Apr-14 69% 64% 77% 99% 52%
Azalea 108 414,414,904 264,151 Feb-15 63% 62% 44% 69% 47%
Reem Community 216 505,214,808 398,804 Dec-16 91% 89% 20% 21% 48%
Emaar Beachfront3 907 2,391,705,980 946,544 60% 45% 26%
Beach Vista 447 1,182,299,161 472,966 Jan-18 94% 91% 10% - 25%
Sunrise Bay 460 1,209,406,819 473,578 Feb-18 52% 46% 7% - 27%
Total 100% Owned 12,461 42,585,631,951 16,854,649 83% 79% 40%
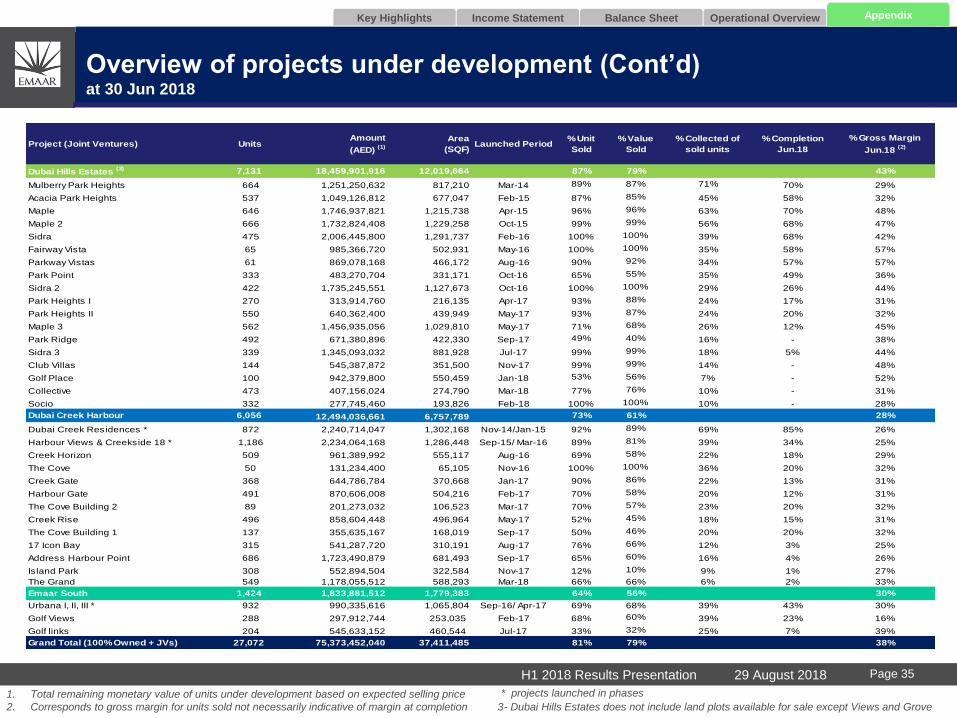
Overview of projects under development (Cont’d)at 30 Jun 2018
Income Statement Balance Sheet Operational OverviewKey Highlights Appendix
1. Total remaining monetary value of units under development based on expected selling price
2. Corresponds to gross margin for units sold not necessarily indicative of margin at completion 3- Dubai Hills Estates does not include land plots available for sale except Views and Grove
* projects launched in phases
29 August 2018H1 2018 Results Presentation Page 35
Project (Joint Ventures) UnitsAmount
(AED) (1)
Area
(SQF)Launched Period
% Unit
Sold
% Value
Sold
% Collected of
sold units
% Completion
Jun.18
% Gross Margin
Jun.18 (2)
Dubai Hills Estates (3) 7,131 18,459,901,916 12,019,664 87% 79% 43%
Mulberry Park Heights 664 1,251,250,632 817,210 Mar-14 89% 87% 71% 70% 29%
Acacia Park Heights 537 1,049,126,812 677,047 Feb-15 87% 85% 45% 58% 32%
Maple 646 1,746,937,821 1,215,738 Apr-15 96% 96% 63% 70% 48%
Maple 2 666 1,732,824,408 1,229,258 Oct-15 99% 99% 56% 68% 47%
Sidra 475 2,006,445,800 1,291,737 Feb-16 100% 100% 39% 68% 42%
Fairway Vista 65 985,366,720 502,931 May-16 100% 100% 35% 58% 57%
Parkway Vistas 61 869,078,168 466,172 Aug-16 90% 92% 34% 57% 57%
Park Point 333 483,270,704 331,171 Oct-16 65% 55% 35% 49% 36%
Sidra 2 422 1,735,245,551 1,127,673 Oct-16 100% 100% 29% 26% 44%
Park Heights I 270 313,914,760 216,135 Apr-17 93% 88% 24% 17% 31%
Park Heights II 550 640,362,400 439,949 May-17 93% 87% 24% 20% 32%
Maple 3 562 1,456,935,056 1,029,810 May-17 71% 68% 26% 12% 45%
Park Ridge 492 671,380,896 422,330 Sep-17 49% 40% 16% - 38%
Sidra 3 339 1,345,093,032 881,928 Jul-17 99% 99% 18% 5% 44%
Club Villas 144 545,387,872 351,500 Nov-17 99% 99% 14% - 48%
Golf Place 100 942,379,800 550,459 Jan-18 53% 56% 7% - 52%
Collective 473 407,156,024 274,790 Mar-18 77% 76% 10% - 31%
Socio 332 277,745,460 193,826 Feb-18 100% 100% 10% - 28%
Dubai Creek Harbour 6,056 12,494,036,661 6,757,789 73% 61% 28%
Dubai Creek Residences * 872 2,240,714,047 1,302,168 Nov-14/Jan-15 92% 89% 69% 85% 26%
Harbour Views & Creekside 18 * 1,186 2,234,064,168 1,286,448 Sep-15/ Mar-16 89% 81% 39% 34% 25%
Creek Horizon 509 961,389,992 555,117 Aug-16 69% 58% 22% 18% 29%
The Cove 50 131,234,400 65,105 Nov-16 100% 100% 36% 20% 32%
Creek Gate 368 644,786,784 370,668 Jan-17 90% 86% 22% 13% 31%
Harbour Gate 491 870,606,008 504,216 Feb-17 70% 58% 20% 12% 31%
The Cove Building 2 89 201,273,032 106,523 Mar-17 70% 57% 23% 20% 32%
Creek Rise 496 858,604,448 496,964 May-17 52% 45% 18% 15% 31%
The Cove Building 1 137 355,635,167 168,019 Sep-17 50% 46% 20% 20% 32%
17 Icon Bay 315 541,287,720 310,191 Aug-17 76% 66% 12% 3% 25%
Address Harbour Point 686 1,723,490,879 681,493 Sep-17 65% 60% 16% 4% 26%
Island Park 308 552,894,504 322,584 Nov-17 12% 10% 9% 1% 27%
The Grand 549 1,178,055,512 588,293 Mar-18 66% 66% 6% 2% 33%
Emaar South 1,424 1,833,881,512 1,779,383 64% 56% 30%
Urbana I, II, III * 932 990,335,616 1,065,804 Sep-16/ Apr-17 69% 68% 39% 43% 30%
Golf Views 288 297,912,744 253,035 Feb-17 68% 60% 39% 23% 16%
Golf links 204 545,633,152 460,544 Jul-17 33% 32% 25% 7% 39%
Grand Total (100% Owned + JVs) 27,072 75,373,452,040 37,411,485 81% 79% 38%
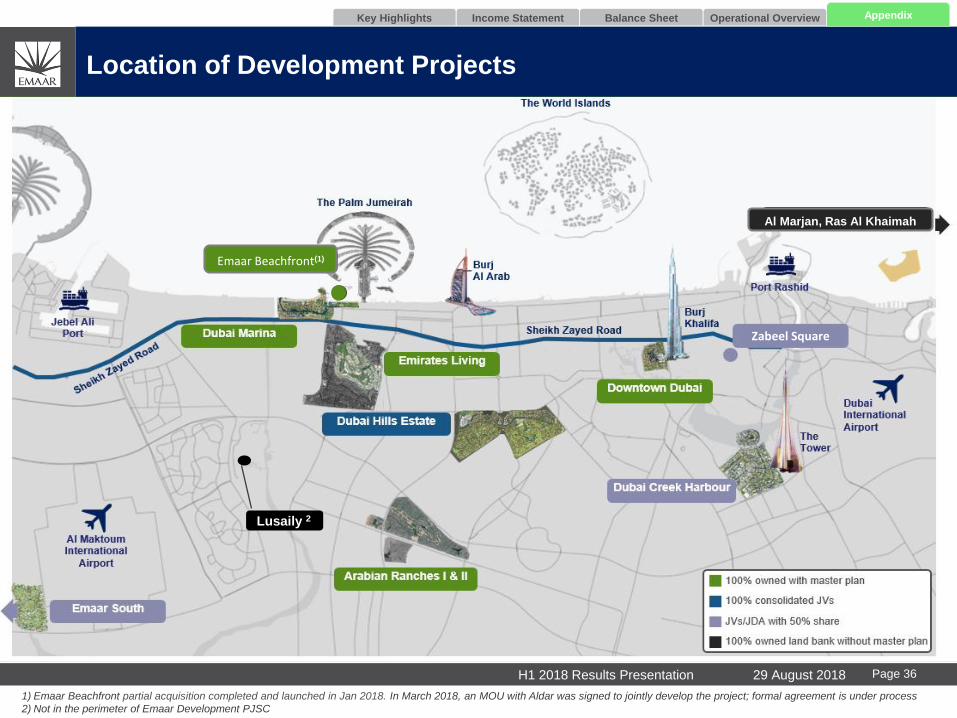
Location of Development Projects
Zaabeel
Emaar Beachfront(1)
Al Marjan, Ras Al Khaimah
Lusaily 2
Income Statement Balance Sheet Operational OverviewKey Highlights Appendix
Zabeel Square
1) Emaar Beachfront partial acquisition completed and launched in Jan 2018. In March 2018, an MOU with Aldar was signed to jointly develop the project; formal agreement is under process
2) Not in the perimeter of Emaar Development PJSC
29 August 2018H1 2018 Results Presentation Page 36
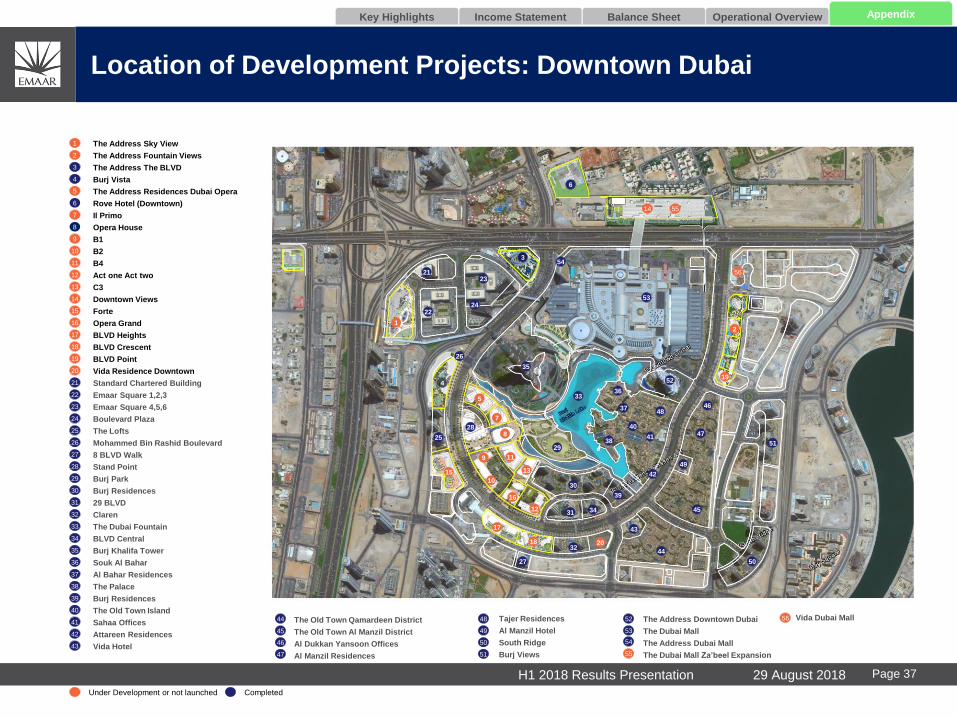
The Address Sky View
The Address Fountain Views
The Address The BLVD
Burj Vista
The Address Residences Dubai Opera
Rove Hotel (Downtown)
Il Primo
Opera House
B1
B2
B4
Act one Act two
C3
Downtown Views
Forte
Opera Grand
BLVD Heights
BLVD Crescent
BLVD Point
Vida Residence Downtown
Standard Chartered Building
Emaar Square 1,2,3
Emaar Square 4,5,6
Boulevard Plaza
The Lofts
Mohammed Bin Rashid Boulevard
8 BLVD Walk
Stand Point
Burj Park
Burj Residences
29 BLVD
Claren
The Dubai Fountain
BLVD Central
Burj Khalifa Tower
Souk Al Bahar
Al Bahar Residences
The Palace
Burj Residences
The Old Town Island
Sahaa Offices
Attareen Residences
Vida Hotel
Location of Development Projects: Downtown Dubai
Income Statement Balance Sheet Operational OverviewKey Highlights Appendix
1
2
4
5
18
8
17
11
16
14
3
19
6
7
9
10
12
13
15
22
23
24
25
26
27
28
29
30
31
32
33
34
20
35
36
37
38
39
40
4144
45
21
49
48
46
47
53
52
50
51
The Old Town Qamardeen District
The Old Town Al Manzil District
Al Dukkan Yansoon Offices
Al Manzil Residences
Tajer Residences
Al Manzil Hotel
South Ridge
Burj Views
The Address Downtown Dubai
The Dubai Mall
The Address Dubai Mall
The Dubai Mall Za’beel Expansion
42
4354
Under Development or not launched Completed
5
6
7
8
119
10
16
12
15
1
18
17
19
2
4
3
3336
37
52
48
40
41
49
45
44
43
2032
27
34
50
21
2224
23
53
51
47
35
29
46
39
31
2538
30
4213
28
26
54
55
5514
Vida Dubai Mall56
56
29 August 2018H1 2018 Results Presentation Page 37
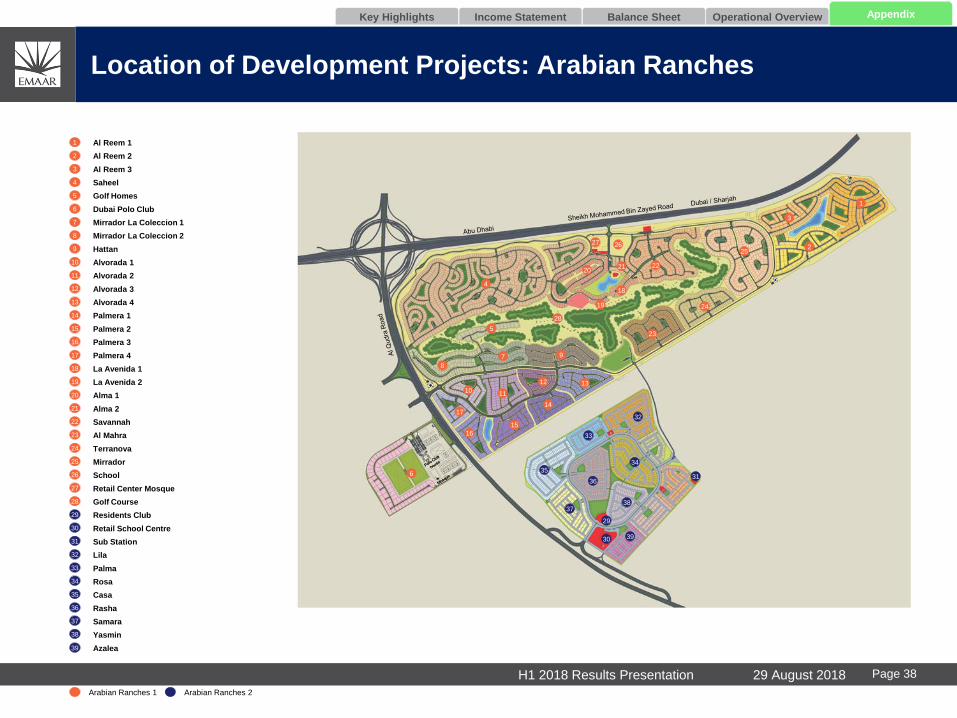
Location of Development Projects: Arabian Ranches
Income Statement Balance Sheet Operational OverviewKey Highlights Appendix
Al Reem 1
Al Reem 2
Al Reem 3
Saheel
Golf Homes
Dubai Polo Club
Mirrador La Coleccion 1
Mirrador La Coleccion 2
Hattan
Alvorada 1
Alvorada 2
Alvorada 3
Alvorada 4
Palmera 1
Palmera 2
Palmera 3
Palmera 4
La Avenida 1
La Avenida 2
Alma 1
Alma 2
Savannah
Al Mahra
Terranova
Mirrador
School
Retail Center Mosque
Golf Course
Residents Club
Retail School Centre
Sub Station
Lila
Palma
Rosa
Casa
Rasha
Samara
Yasmin
Azalea
4
5
6
7
8
9
10
11
12
13
14
15
16
17
18
19
20
21
22
23
24
25
26
27
28
29
30
31
32
33
34
35
37
38
1
2
3
36
23
24
252
3
22
26
28
27
2120
4
5
8
7 9
11
12 13
14
10
17
19
18
15
16
635
33
32
34
36
3738
39
1
29
30
31
Arabian Ranches 1 Arabian Ranches 2
39
29 August 2018H1 2018 Results Presentation Page 38
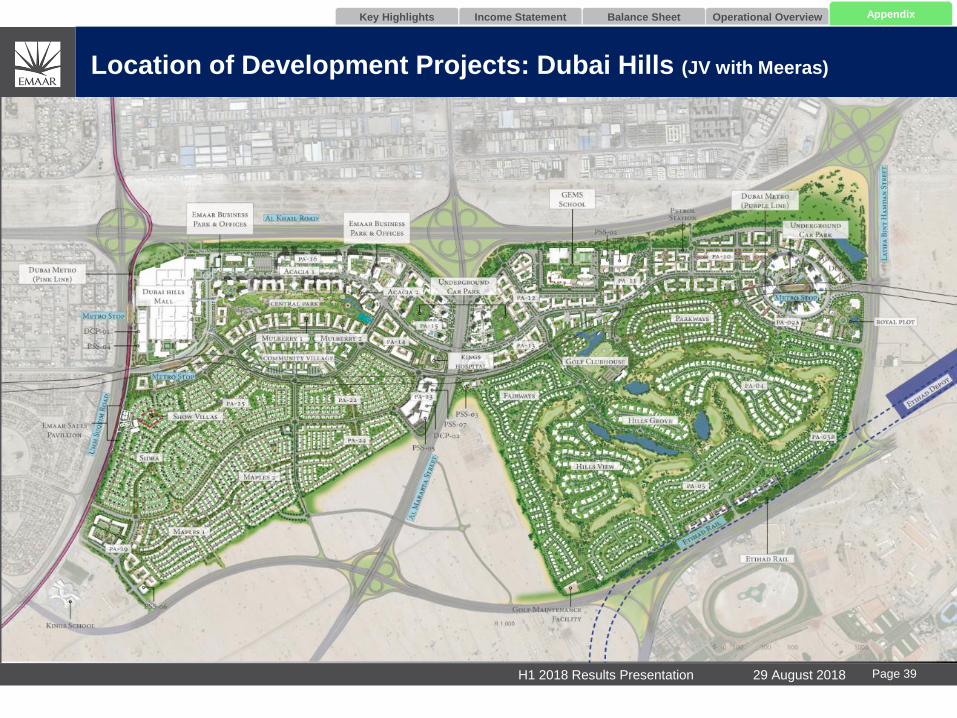
Location of Development Projects: Dubai Hills (JV with Meeras)
Income Statement Balance Sheet Operational OverviewKey Highlights Appendix
29 August 2018H1 2018 Results Presentation Page 39
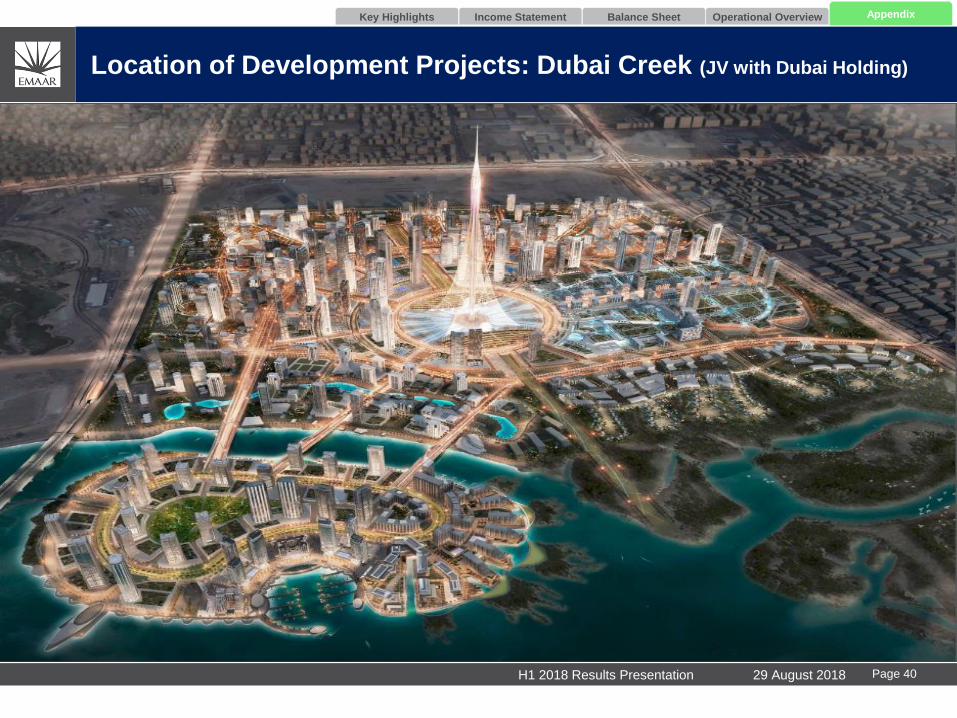
Location of Development Projects: Dubai Creek (JV with Dubai Holding)
Income Statement Balance Sheet Operational OverviewKey Highlights Appendix
29 August 2018H1 2018 Results Presentation Page 40
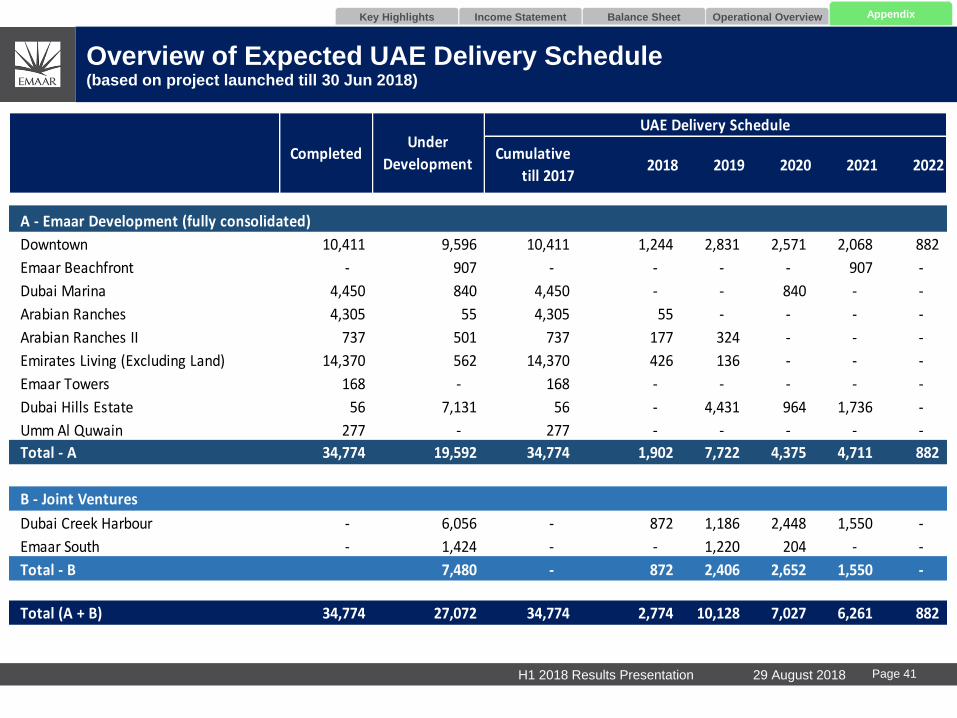
Overview of Expected UAE Delivery Schedule (based on project launched till 30 Jun 2018)
Income Statement Balance Sheet Operational OverviewKey Highlights Appendix
29 August 2018H1 2018 Results Presentation Page 41
- A - Emaar Development (fully consolidated)
Downtown 10,411 9,596 10,411 1,244 2,831 2,571 2,068 882
Emaar Beachfront - 907 - - - - 907 -
Dubai Marina 4,450 840 4,450 - - 840 - -
Arabian Ranches 4,305 55 4,305 55 - - - -
Arabian Ranches II 737 501 737 177 324 - - -
Emirates Living (Excluding Land) 14,370 562 14,370 426 136 - - -
Emaar Towers 168 - 168 - - - - -
Dubai Hills Estate 56 7,131 56 - 4,431 964 1,736 -
Umm Al Quwain 277 - 277 - - - - -
Total - A 34,774 19,592 34,774 1,902 7,722 4,375 4,711 882
B - Joint Ventures
Dubai Creek Harbour - 6,056 - 872 1,186 2,448 1,550 -
Emaar South - 1,424 - - 1,220 204 - -
Total - B 7,480 - 872 2,406 2,652 1,550 -
Total (A + B) 34,774 27,072 34,774 2,774 10,128 7,027 6,261 882
Cumulative
till 20172018 2019 2020 2021 2022
UAE Delivery Schedule
Completed Under
Development
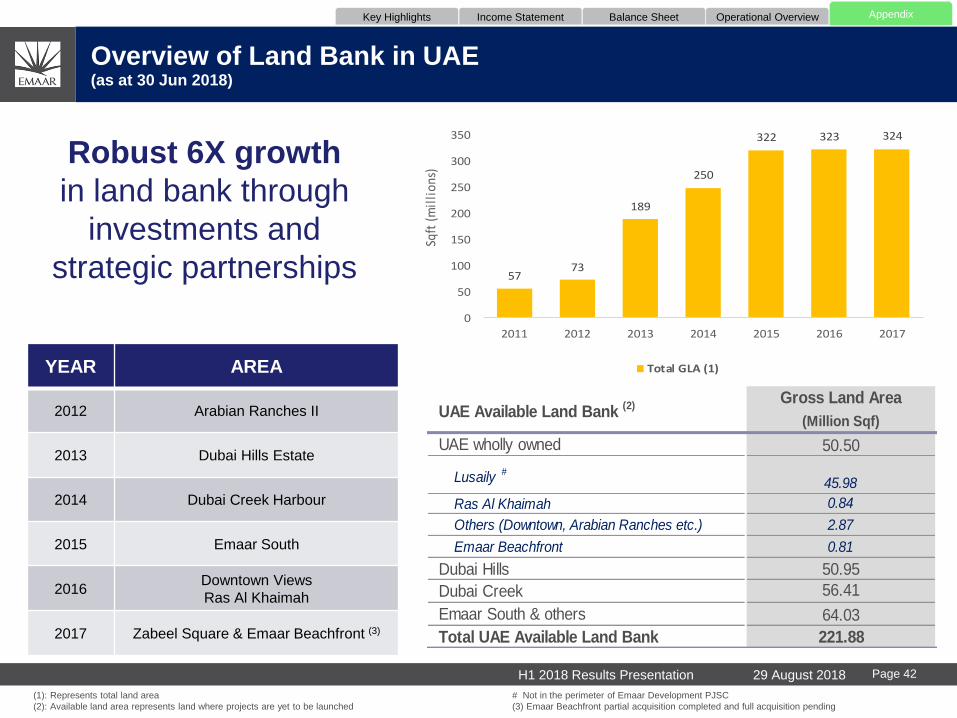
Overview of Land Bank in UAE(as at 30 Jun 2018)
Income Statement Balance Sheet Operational OverviewKey Highlights Appendix
Robust 6X growth
in land bank through
investments and
strategic partnerships
YEAR AREA
2012 Arabian Ranches II
2013 Dubai Hills Estate
2014 Dubai Creek Harbour
2015 Emaar South
2016Downtown Views
Ras Al Khaimah
2017 Zabeel Square & Emaar Beachfront (3)
5773
189
250
322 323 324
0
50
100
150
200
250
300
350
2011 2012 2013 2014 2015 2016 2017
Sqft
(m
illi
ons)
Total GLA (1)
(1): Represents total land area # Not in the perimeter of Emaar Development PJSC
(2): Available land area represents land where projects are yet to be launched (3) Emaar Beachfront partial acquisition completed and full acquisition pending
29 August 2018H1 2018 Results Presentation Page 42
Gross Land Area
(Million Sqf)
UAE wholly owned 50.50
Lusaily #
45.98
Ras Al Khaimah 0.84
Others (Downtown, Arabian Ranches etc.) 2.87
Emaar Beachfront 0.81
Dubai Hills 50.95
Dubai Creek 56.41
Emaar South & others 64.03
Total UAE Available Land Bank 221.88
UAE Available Land Bank (2)
Income Statement Balance Sheet Operational OverviewKey Highlights Appendix
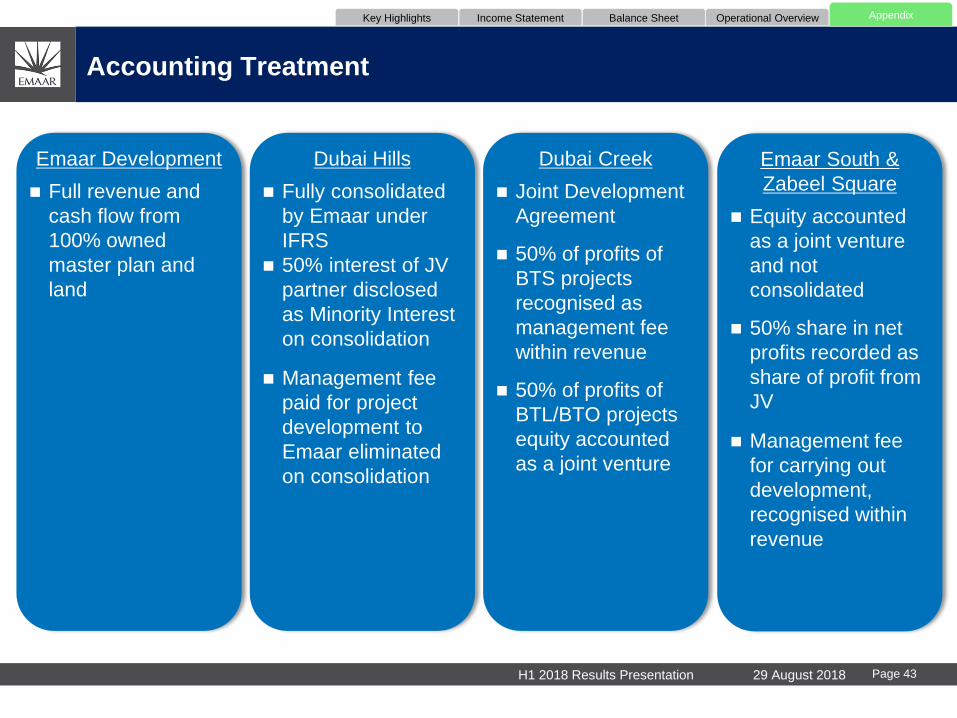
Accounting Treatment
Emaar Development
Full revenue and
cash flow from
100% owned
master plan and
land
Dubai Hills
Fully consolidated
by Emaar under
IFRS
50% interest of JV
partner disclosed
as Minority Interest
on consolidation
Management fee
paid for project
development to
Emaar eliminated
on consolidation
Dubai Creek
Joint Development
Agreement
50% of profits of
BTS projects
recognised as
management fee
within revenue
50% of profits of
BTL/BTO projects
equity accounted
as a joint venture
Emaar South &
Zabeel Square
Equity accounted
as a joint venture
and not
consolidated
50% share in net
profits recorded as
share of profit from
JV
Management fee
for carrying out
development,
recognised within
revenue
29 August 2018H1 2018 Results Presentation Page 43
Appendix C – Overview of International Development
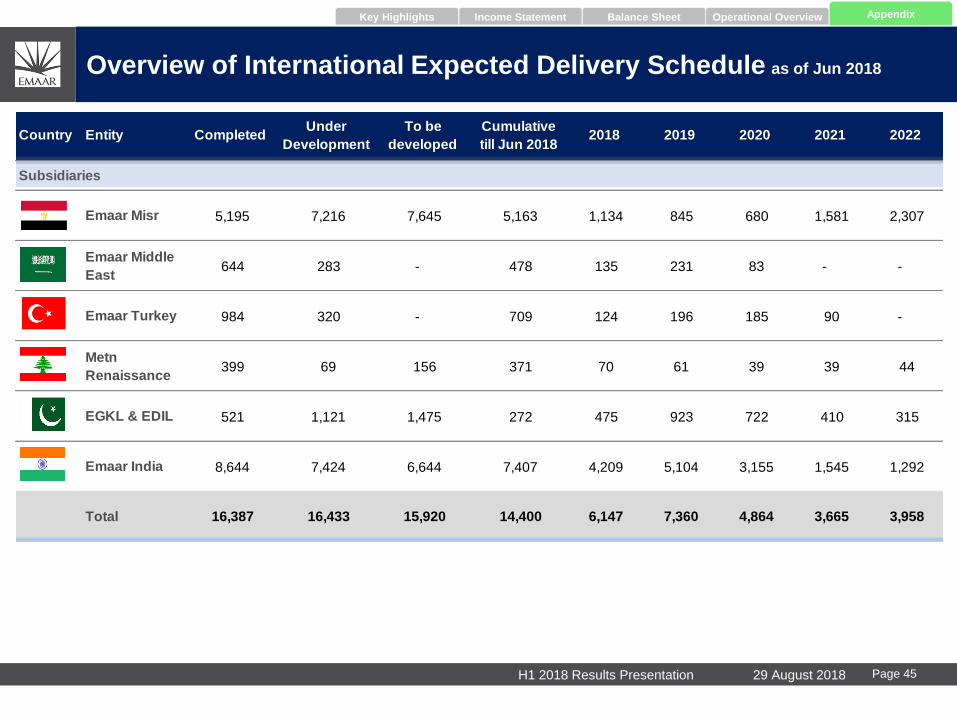
Overview of International Expected Delivery Schedule as of Jun 2018
Income Statement Balance Sheet Operational OverviewKey Highlights Appendix
Country Entity CompletedUnder
Development
To be
developed
Cumulative
till Jun 20182018 2019 2020 2021 2022
Subsidiaries
Emaar Misr 5,195 7,216 7,645 5,163 1,134 845 680 1,581 2,307
Emaar Middle
East 644 283 - 478 135 231 83 - -
Emaar Turkey 984 320 - 709 124 196 185 90 -
Metn
Renaissance 399 69 156 371 70 61 39 39 44
EGKL & EDIL 521 1,121 1,475 272 475 923 722 410 315
Emaar India 8,644 7,424 6,644 7,407 4,209 5,104 3,155 1,545 1,292
Total 16,387 16,433 15,920 14,400 6,147 7,360 4,864 3,665 3,958
29 August 2018H1 2018 Results Presentation Page 45
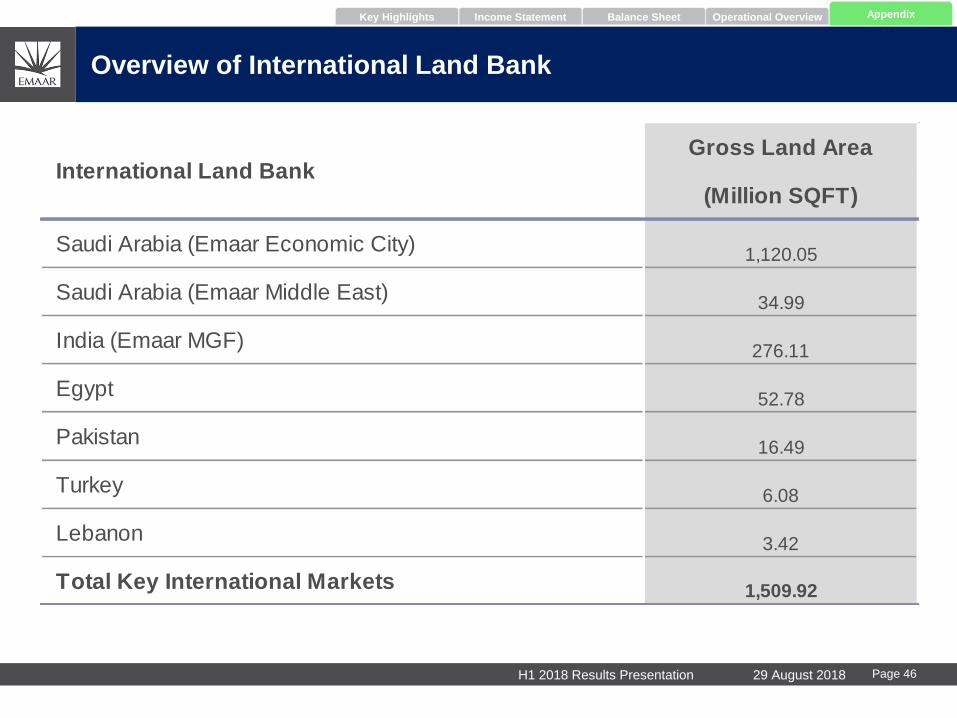
Overview of International Land Bank
Income Statement Balance Sheet Operational OverviewKey Highlights Appendix
Gross Land Area
(Million SQFT)
Saudi Arabia (Emaar Economic City)1,120.05
Saudi Arabia (Emaar Middle East)34.99
India (Emaar MGF)276.11
Egypt52.78
Pakistan16.49
Turkey6.08
Lebanon3.42
Total Key International Markets 1,509.92
International Land Bank
29 August 2018H1 2018 Results Presentation Page 46
Appendix D – Overview of Emaar Hospitality Group
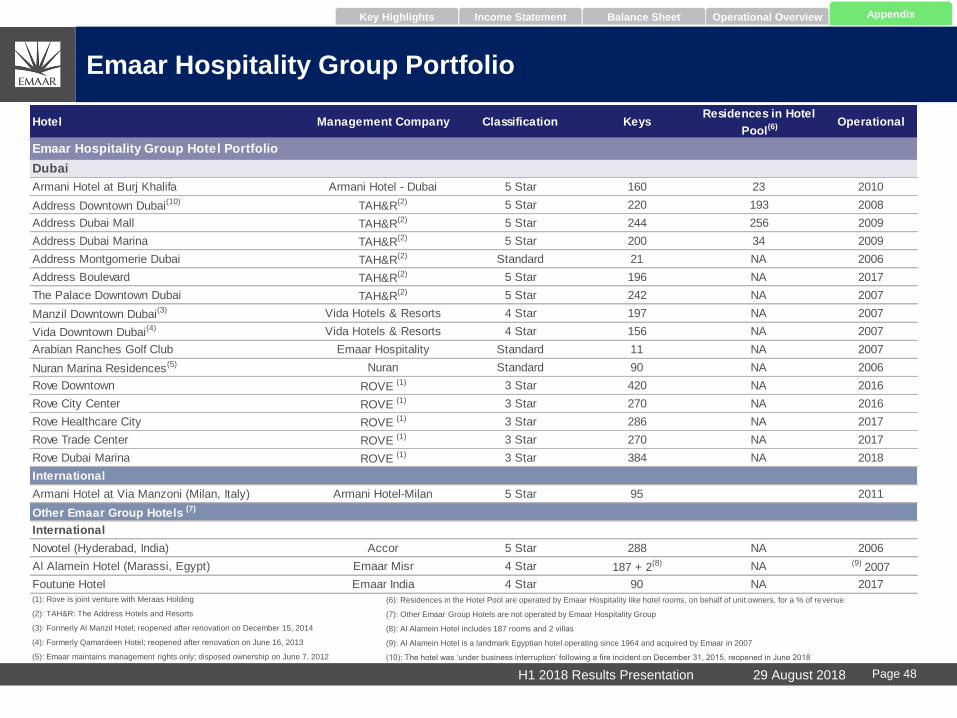
Emaar Hospitality Group Portfolio
Income Statement Balance Sheet Operational OverviewKey Highlights Appendix
(1): Rove is joint venture with Meraas Holding
(2): TAH&R: The Address Hotels and Resorts
(3): Formerly Al Manzil Hotel; reopened after renovation on December 15, 2014
(4): Formerly Qamardeen Hotel; reopened after renovation on June 16, 2013
(5): Emaar maintains management rights only; disposed ownership on June 7, 2012
(6): Residences in the Hotel Pool are operated by Emaar Hospitality like hotel rooms, on behalf of unit owners, for a % of revenue
(7): Other Emaar Group Hotels are not operated by Emaar Hospitality Group
(8): Al Alamein Hotel includes 187 rooms and 2 villas
(9): Al Alamein Hotel is a landmark Egyptian hotel operating since 1964 and acquired by Emaar in 2007
(10): The hotel was ‘under business interruption’ following a fire incident on December 31, 2015, reopened in June 2018
Armani Hotel - Dubai 5 Star 160 23 2010
TAH&R(2) 5 Star 220 193 2008
TAH&R(2) 5 Star 244 256 2009
TAH&R(2) 5 Star 200 34 2009
TAH&R(2) Standard 21 NA 2006
TAH&R(2) 5 Star 196 NA 2017
TAH&R(2) 5 Star 242 NA 2007
Vida Hotels & Resorts 4 Star 197 NA 2007
Vida Hotels & Resorts 4 Star 156 NA 2007
Emaar Hospitality Standard 11 NA 2007
Nuran Standard 90 NA 2006
ROVE (1) 3 Star 420 NA 2016
ROVE (1) 3 Star 270 NA 2016
ROVE (1) 3 Star 286 NA 2017
ROVE (1) 3 Star 270 NA 2017
Rove Dubai Marina ROVE (1) 3 Star 384 NA 2018
Armani Hotel-Milan 5 Star 95 2011
Accor 5 Star 288 NA 2006
Emaar Misr 4 Star 187 + 2(8) NA (9) 2007
Emaar India 4 Star 90 NA 2017
OperationalHotel Management Company Classification KeysResidences in Hotel
Pool(6)
Arabian Ranches Golf Club
Emaar Hospitality Group Hotel Portfolio
Dubai
Armani Hotel at Burj Khalifa
Address Downtown Dubai(10)
Address Dubai Mall
Address Dubai Marina
Address Montgomerie Dubai
Address Boulevard
The Palace Downtown Dubai
Manzil Downtown Dubai(3)
Vida Downtown Dubai(4)
Foutune Hotel
Nuran Marina Residences(5)
Rove Downtown
Rove City Center
Rove Healthcare City
Rove Trade Center
International
Armani Hotel at Via Manzoni (Milan, Italy)
Other Emaar Group Hotels (7)
International
Novotel (Hyderabad, India)
Al Alamein Hotel (Marassi, Egypt)
29 August 2018H1 2018 Results Presentation Page 48
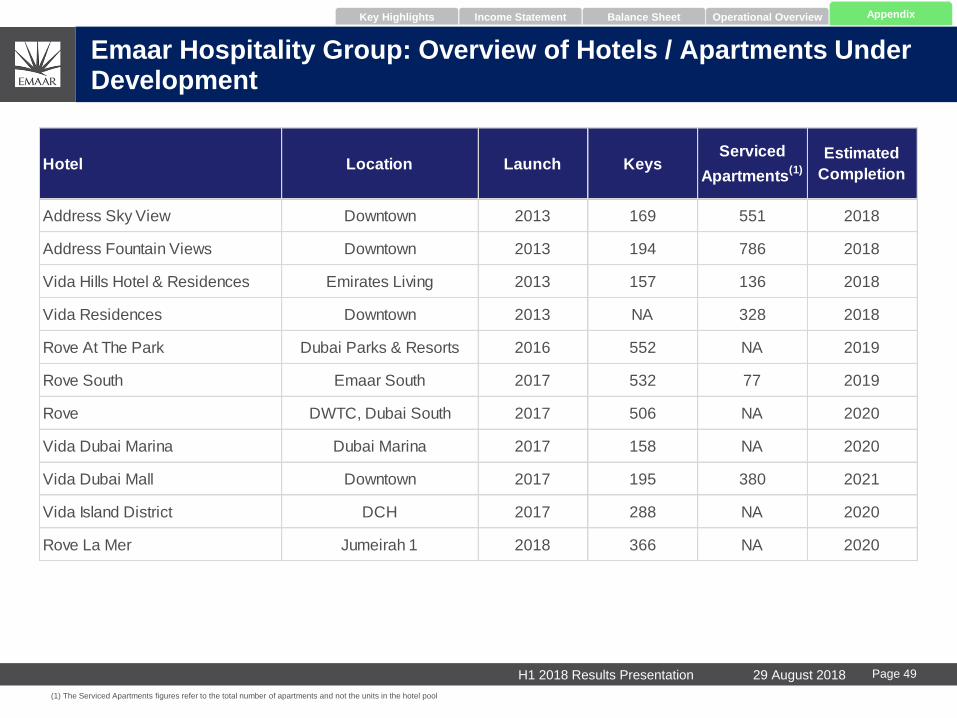
Hotel Location Launch KeysServiced
Apartments(1)
Estimated
Completion
Address Sky View Downtown 2013 169 551 2018
Address Fountain Views Downtown 2013 194 786 2018
Vida Hills Hotel & Residences Emirates Living 2013 157 136 2018
Vida Residences Downtown 2013 NA 328 2018
Rove At The Park Dubai Parks & Resorts 2016 552 NA 2019
Rove South Emaar South 2017 532 77 2019
Rove DWTC, Dubai South 2017 506 NA 2020
Vida Dubai Marina Dubai Marina 2017 158 NA 2020
Vida Dubai Mall Downtown 2017 195 380 2021
Vida Island District DCH 2017 288 NA 2020
Rove La Mer Jumeirah 1 2018 366 NA 2020
Emaar Hospitality Group: Overview of Hotels / Apartments Under Development
(1) The Serviced Apartments figures refer to the total number of apartments and not the units in the hotel pool
Income Statement Balance Sheet Operational OverviewKey Highlights Appendix
29 August 2018H1 2018 Results Presentation Page 49
Appendix E – Group Structure
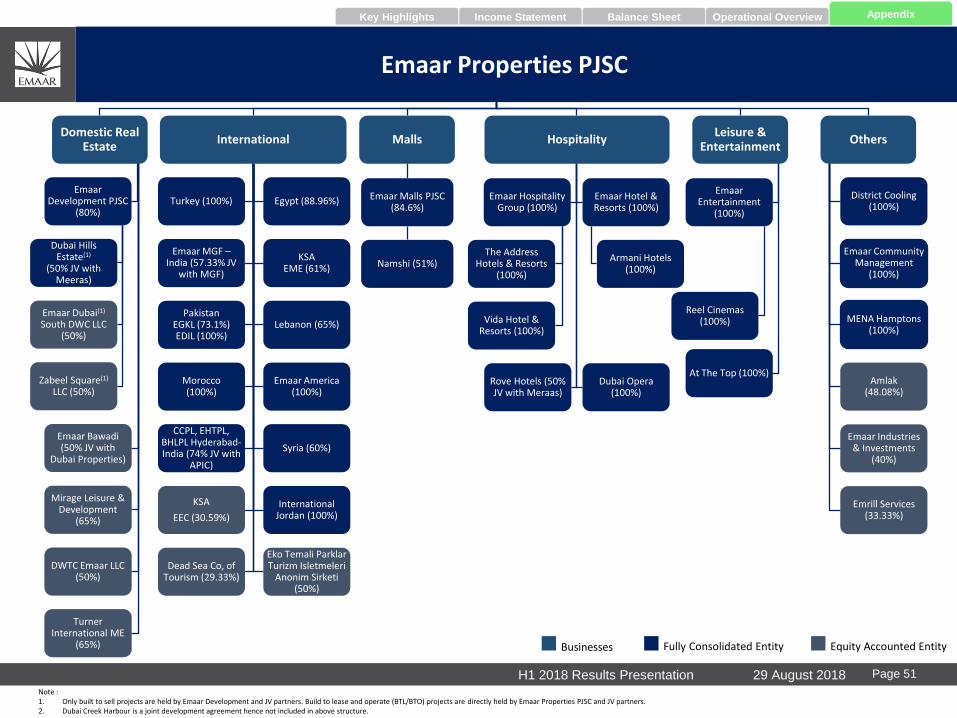
Emaar Properties PJSC
Income Statement Balance Sheet Operational OverviewKey Highlights Appendix
Domestic Real Estate
Emaar Development PJSC
(80%)
Dubai Hills Estate(1)
(50% JV with Meeras)
Emaar Dubai(1)
South DWC LLC (50%)
Zabeel Square(1)
LLC (50%)
Emaar Bawadi (50% JV with
Dubai Properties)
Mirage Leisure & Development
(65%)
DWTC Emaar LLC (50%)
Turner International ME
(65%)
International
Turkey (100%) Egypt (88.96%)
Emaar MGF –India (57.33% JV
with MGF)
KSAEME (61%)
PakistanEGKL (73.1%)EDIL (100%)
Lebanon (65%)
Morocco(100%)
Emaar America (100%)
CCPL, EHTPL, BHLPL Hyderabad-India (74% JV with
APIC)
Syria (60%)
KSA
EEC (30.59%)
International Jordan (100%)
Dead Sea Co, of Tourism (29.33%)
Eko Temali ParklarTurizm Isletmeleri
Anonim Sirketi(50%)
Malls
Emaar Malls PJSC (84.6%)
Namshi (51%)
Hospitality
Emaar Hospitality Group (100%)
The Address Hotels & Resorts
(100%)
Vida Hotel & Resorts (100%)
Emaar Hotel & Resorts (100%)
Armani Hotels (100%)
Rove Hotels (50% JV with Meraas)
Dubai Opera (100%)
Leisure & Entertainment
Emaar Entertainment
(100%)
Reel Cinemas (100%)
At The Top (100%)
Others
District Cooling (100%)
Emaar Community Management
(100%)
MENA Hamptons (100%)
Amlak(48.08%)
Emaar Industries & Investments
(40%)
Emrill Services (33.33%)
Businesses Fully Consolidated Entity Equity Accounted Entity
Note : 1. Only built to sell projects are held by Emaar Development and JV partners. Build to lease and operate (BTL/BTO) projects are directly held by Emaar Properties PJSC and JV partners.2. Dubai Creek Harbour is a joint development agreement hence not included in above structure.
29 August 2018H1 2018 Results Presentation Page 51


